Page 1
The Effectiveness of Scientific Games in Teaching Chemistry Concept
A Thesis
Presented to
The Faculty of College of EducationEulogio “Amang” Rodriguez Institute of Science and Technology
In Partial Fulfillment of the Requirements for Basic ResearchProf. Ed. 11
Submitted by:
Glenda C. PerlotaReymund G. Reyes
Jay-Ar D. RiveraRonald A. SatoMacel T. Solis
Avegail B. Vega
School Year 2007-2008
Submitted to:
Mrs. Eleanor S. Arcillas
1
Page 2
TABLE OF CONTENTS
Title Page
Acknowledgement ……………………………………………………………i
Abstract………………………………………………………………………..ii
CHAPTER 1: Problems and its Background………………………………5
Introduction…………………………………………………….5
Theoretical Framework…………………..…………………..6
Conceptual Framework………………………..……………..7
Statement of the Problem……………………..……………..9
Research Hypothesis…………………………………………9
Significance of the Study………………………..…………..10
Scope and Delimitation………………………………………11
Definition of Terms…………………………….……………..12
CHAPTER 2: Review Related Literature…………………………………...14
Foreign Literature…………………………………………….15
Local Literature……………………………………..………...16
CHAPTER 3: Methodology……………………………………..…………….20
Method Used…………………………………………………..20
Respondent of the Study……………………………………20
Sources of Data……………………………………...………..21
Data Gathering Instrument…………………………………..21
Data Gathering Procedure……………………..……………21
Statistical Treatment…………………...…………………….22
2
Page 3
CHAPTER 4: Presentations, Analysis and Interpretation of Data……...23
Description of Respondents……………………………..…23
Comparison of Pre-test Mean Scores of the Experimental
And Control Group……………………………………..23
Comparison of the Pre-test and Post-test Mean
Of the Experimental and Control Group……….…24
Comparison of the Post-test Mean Scores of the
Two groups…………………………………………….25
CHAPTER 5: Summary Conclusion and Recommendation……………26
Summary of Findings……………………………………….….26
Conclusion………………………………………………………..27
Recommendation……………………………………….............27
Bibliography …………………………………………………….……………..28
Curriculum Vitae………………………………………………….……………29
3
Page 4
ABSTRACT
Title: The Effectiveness of Scientific Games in Teaching Chemistry
Researchers: Glenda C. Perlota Reymund G. Reyes Jay-Ar D. RiveraRolanald A. Sato Macel T. Solis Avegail A. Vega
Course: Bachelor of Science in Education- Major in Physical ScienceYear level: 3rd yearS.Y. 2008-2009
Professor: Mrs. Eleanor S. Arcillas
Introduction
The major problem of this study is to determine the effectiveness of
scientific games as a strategy in teaching chemistry to Third Year students of
EARIST Laboratory High School in Nagtahan, Sampaloc, Manila.
For the purpose of the study, the researcher formulate a hypothesis,
that there is a significant difference in the chemistry achievement test of students
exposed to scientific games strategy and those who were taught using the
traditional method.
This study utilized the true experimental design employing the pre-test and
post-test. The respondents of the study were twenty two (22) Third Year students
of EARIST Laboratory High School, during the school year 2007-2008. They
were divided into two groups and randomly assigned to experimental and control
group. The experimental group were exposed to actual application using
4
Page 5
scientific games as motivation while the control group were exposed to the
traditional method only.
The statistical treatment of data involves the computation of mean, standard
deviation, and t-test. From the above findings the following conclusion are made.
Interactive method using scientific games and traditional methods of teaching are
equally effective in teaching selected topics in chemistry. But the students on the
experimental group learned very well not only theories but also in skills on how to
apply a particular example of each topic.
Based from the findings and conclusion formulated in this research study,
the following recommendations are hereby proposed. Science teachers can use
games to enrich their science teaching. This strategy can be used to arouse and
enhance their interests to learn the subject matter. Science teachers should
explore the used of other enrichment activities that could be used to teach
science concepts and skills. Another extensive study should be conducted in
terms of longer exposure time to scientific games strategy and the inclusion of
more topics that can be taught using games to arrive more exact conclusions.
5
Page 6
ACKNOWLEDGEMENT
The researcher wishes to express our sincere and profound gratitude
to the following persons and institutions who, in one way or their, have
generously contributed to the successful completion of the study:
Dr. Rowena A. Bolotaolo, Dean of college of Education, for granting
her permission to administer the pre test and post test to third year chemistry
students;
Prof. Eleanor S. Arcillas, for her critic, for her sincere concern,
assistance and intelligent criticism and invaluable suggestions in the
improvement of the study;
The Special Science Laboratory High School Third Year students,
including the subject teacher Miss Eleanor Salvador, for their support and
cooperation, this humble research would not have been completed;
The EARIST Library and National Library, for giving their permission
to utilize some of their library materials;
To our parents for their Love and undying support;
And above all, Heavenly Father, who gives his undying blessings,
strength, determination and guidance to the pursuit of the study.
6
Page 7
Approval Sheet
This thesis entitled: The Effectiveness of Scientific Games used as Motivations in Teaching Chemistry Concept is prepared and submitted by the following researchers:
Glenda C. Perlota Reymund G. Reyes Jay-Ar D. Rivera Ronald A. Sato Macel T. Solis Avegail B. Vega
In partial fulfilment of the requirements for the Basic Research Subject, has been examined and is recommended for the final defence.
Mrs. Eleanor S. Arcillas
Approve in the partial fulfilment of the requirements for the Basic Research by the panellist committee with a rating of______________
_____________________Professor Carlito Biares
______________________Professor Ligaya A. Viray
7
Page 8
LIST OF TABLES
TABLES pages
1.2.3.4.5.6.
List of figures
Figutre 1…………………………………………………………………14
8
Page 9
CHAPTER 1: THE PROBLEM AND ITS BACKGROUND Introduction
Science holds a dominating place in the curriculum. This is so
because every sector recognizes an increasing contribution of the discipline to
the progress of the modern world as well as its traditional standing as an element
of humanistic and scientific education. Its importance, as the key subject is
common knowledge. Science has been recognized as a patent means of
sharpening our competitive edge. As mandated in the Philippine Constitution, it is
the duty of the schools to develop scientific and technology efficiency among the
pupils and the students.Thus, it becomes necessary to evolve a strong science
programs in all levels. So, the teaching of science should be effectively earned
out so as to satisfy the national development goals. Science is a multifaceted
subject, limitless in extent and depth, vital for science and technology, and rich in
the cultural import. It offers a lot of challenges to an individual. Well-known
scientist considered it is the key to success in many of the most powerful and
prestigious jobs in our highly technical society. Without science, it is impossible to
get into medicine, engineering, astronomers and most of the mobs requiring
technical expertise. In school, however, students find the subject dull and difficult
and dreary by many. More so, science in general is even considered by many as
uninteresting or boring subject if not difficult or not applicable into their daily lives.
The performance of the pupil depends largely on quality of the teaching
competencies of their teacher. A competent teacher learns to build effective
learning situation and to select teaching methods/strategies to guarantee
9
Page 10
maximum retention and application of the learning that are achieved. According
to what we read in the Educator’s Speak, strategy refers to all techniques by
which the teachers structure the learning environment so that the students led to
discover what they suppose to discover. Teacher’s uses a wide variety of
techniques to elicit information from students. In view of this, the teacher must
determine effective strategies that would suit to the interest, abilities and needs
of the pupils. The researcher believes that the games could be an effective
strategy in teaching secondary schools.
Theoretical Framework
This study recognizes the principle behind the Chinese maxim; “I hear and
I forget, I see and I remember, I do and I understand’’. This explain that the
learner must be active not passive to maximize learning. This research work
based its framework on the constructivism theory of John Dewey (1859-1952)
and Jean Piaget (1896-1952). Constructivism Theory is about how we come to
know what we know. It is founded on the presence that children, adolescents,
and even adults construct or make meaning about the world around them based
on the context of their existing knowledge. (Llewellyn D. 2005)
This study further concerned on cognitive ability of the students and their
performance in the actual classroom interaction.
10
Page 11
The following are the six theories of motivation that supports the idea on
how to arouse the attention of the students:
A- Behavioral Theories
• Drive: (Hull) urgent, basic, or instinctual need: a motivating physiological
condition of an organism.
• Learned motives
1. Classical conditioning: (Pavlov) it states that biological responses to
associated stimuli energize and direct behavior.
2. Instrumental/operant learning: (Skinner) it states that the primary
factor is consequences: rein forcers are incentives to increase
behavior and punishers are disincentives that result in a decrease
in behavior.
(Stimulus => response => reward)
The desire of reward is one of the strongest incentives of human
conduct; ... the best security for the fidelity of mankind is to make
their interest coincide with their duty. --Alexander Hamilton (The
Federalist Papers)
3. Observational/social learning: (Bandura) it suggests that modeling
(imitating others) and vicarious learning (watching others have
consequences applied to their behavior) are important motivators of
behavior.
11
Page 12
• Incentive motivation: it refers to goal-directed behavior (behavior that is
"pulled" more than "pushed"). Seeking of rewards; avoidance of punishers.
Unlike drives, which were thought to be innate, incentives are usually
considered to be learned.
Behaviorists explain motivation in terms of external stimuli and
reinforcement. The physical environment and actions of the teacher are of
prime importance.
B- Cognitive Theories
• Expectancy-value/VIE theory: (Vroom, 1964) it proposes the following
equation:
Motivation =
Perceived Probability of Success (Expectancy)
Connection of Success and Reward-- material benefit (Instrumentality)
Value of Obtaining Goal (Valence, Value)
(VIE = Valence, Instrumentality, Expectancy)
.
Since this formula states that the three factors of Expectancy, Instrumentality,
and Valence or Value are to be multiplied by each other, a low value in one will
result in a low value of motivation. Therefore, all three must be present in order
for motivation to occur. That is, if an individual doesn't believe he or she can be
12
Page 13
successful at a task OR the individual does not see a connection between his or
her activity and success OR the individual does not value the results of success,
then the probability is lowered that the individual will engage in the required
learning activity. From the perspective of this theory, all three variables must be
high in order for motivation and the resulting behavior to be high.
=> An individual will act in a certain way based on the expectation that the act will
be followed by a given outcome and on the attractiveness of that outcome to the
individual.
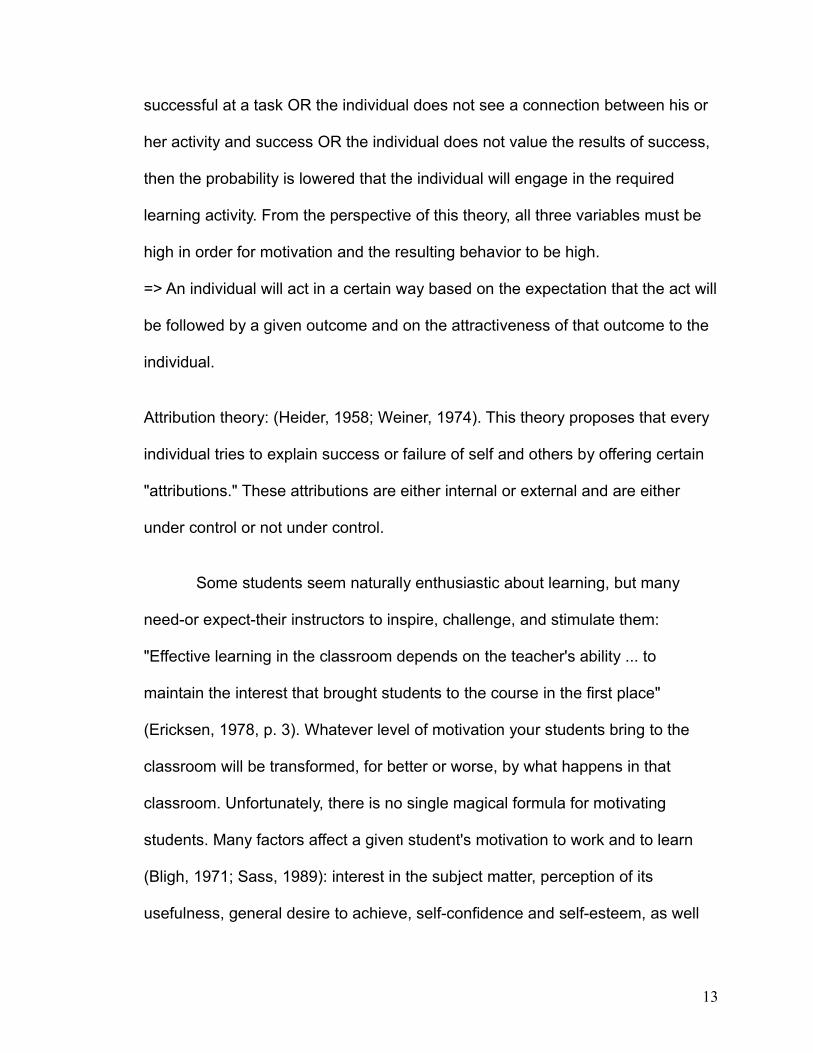
Attribution theory: (Heider, 1958; Weiner, 1974). This theory proposes that every
individual tries to explain success or failure of self and others by offering certain
"attributions." These attributions are either internal or external and are either
under control or not under control.
Some students seem naturally enthusiastic about learning, but many
need-or expect-their instructors to inspire, challenge, and stimulate them:
"Effective learning in the classroom depends on the teacher's ability ... to
maintain the interest that brought students to the course in the first place"
(Ericksen, 1978, p. 3). Whatever level of motivation your students bring to the
classroom will be transformed, for better or worse, by what happens in that
classroom. Unfortunately, there is no single magical formula for motivating
students. Many factors affect a given student's motivation to work and to learn
(Bligh, 1971; Sass, 1989): interest in the subject matter, perception of its
usefulness, general desire to achieve, self-confidence and self-esteem, as well
13
Page 14
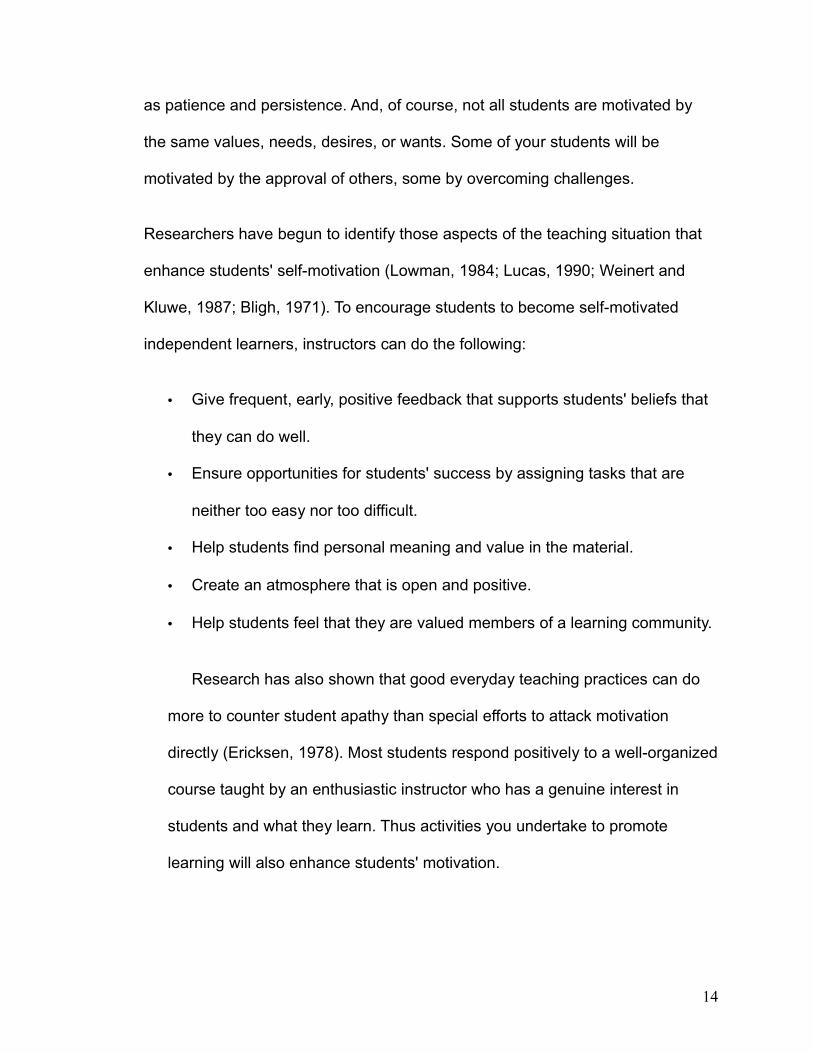
as patience and persistence. And, of course, not all students are motivated by
the same values, needs, desires, or wants. Some of your students will be
motivated by the approval of others, some by overcoming challenges.
Researchers have begun to identify those aspects of the teaching situation that
enhance students' self-motivation (Lowman, 1984; Lucas, 1990; Weinert and
Kluwe, 1987; Bligh, 1971). To encourage students to become self-motivated
independent learners, instructors can do the following:
• Give frequent, early, positive feedback that supports students' beliefs that
they can do well.
• Ensure opportunities for students' success by assigning tasks that are
neither too easy nor too difficult.
• Help students find personal meaning and value in the material.
• Create an atmosphere that is open and positive.
• Help students feel that they are valued members of a learning community.
Research has also shown that good everyday teaching practices can do
more to counter student apathy than special efforts to attack motivation
directly (Ericksen, 1978). Most students respond positively to a well-organized
course taught by an enthusiastic instructor who has a genuine interest in
students and what they learn. Thus activities you undertake to promote
learning will also enhance students' motivation.
14
Page 15
Conceptual Framework
Figure.1 the Research Paradigm
The paradigm above shows that the pre-test administered by the researchers,
to measure the performances of the students with regards to their initial
knowledge in Chemistry.
After the pre-test given to the third year high school students, they were
divided into two groups, the experimental and control group. The experimental
group taught using scientific games/motivations whereas the control group taught
traditional method of teaching. After going through the lessons, both groups were
given post-test to measure their performance based on teaching-learning
EXPERIMENTAL GROUP
CONTROL GROUP
INTERACTIVE TEACHING METHOD
TRADITIONAL METHOD
POST TEST ON CHANGES IN MATTER, MIXTURES, ACIDS & BASIS
CHEMISTRY ACHIEVEMENTS OR RESULTS OF TEST
PRE-TEST SELECTED CHEMISTRY TOPICS
LEARNING OUTCOMES
15
Page 16
outcomes. The purpose of the post-test was used to evaluate the achievements
of the two groups in learning Chemistry.
Statement of the Problem
This the study aimed to find out the effectiveness using games in teaching
selected topics in Chemistry to the Third year students of EARIST Laboratory
High School, during the school year 2007-2008. Specially, the study sought to
answer the following questions.
1. Is there a significant difference on the pre-test scores of then control group
and experimental group?
2. Is there a significant difference on the post-test of the control group and the
experimental group?
3. Is there a difference between the pre-test and post-test scores of students in
both control and experimental group?
Hypothesis
Null hypothesis (HO) - There is a significant difference in the chemistry
achievement of students exposed to interactive method using scientific games-
lecture strategy and those who were taught using traditional method since both of
the group acquired knowledge about the subject matter.
Research alternative hypothesis (HA) - There is a significant difference
statistically and logically in the performance of the two groups because the
experimental group is exposing to scientific games which will motivate them and
arouse their interest to listen and learn the lesson. Motivational factors have a
16
Page 17
big contribution in the teaching-learning process. This was already studied by
several educators and it seems effective in the learning process of the students.
The researchers study and trying to find-out how very effective are, if teachers
will use different enrichment activities that will help motivate the students study
chemistry seriously and eventually love it.
Significance of the Study
This study hopes to make the following contributions to the following:
High School Chemistry Students:
This study may help develop better understanding of the abstract
concepts and ideas in chemistry and relate them in everyday sense of interest for
greater knowledge and skills achievement and right attitude as they prepare for
higher learning in science.
Chemistry Teachers:
This finding of this study may likewise motivate and challenge them
in their determination to help majority of the high school students, who
experience learning block in chemistry primarily due to less effective in teaching
chemistry concept, with the use of various teaching strategies, students may
develop a deeper understanding of the concepts and process to science that will
consequently lead to higher achievement.
Educators:
The useful and relevant information acquired from the study may
provide their insights on how they can promote higher academic achievement
17
Page 18
using effective strategy in teaching abstract concepts and ideas in high school
chemistry and any other science. Moreover this study helps them achieve their
long sought goal of development of effective understanding of the science
processes and concepts.
Scope and Delimitations
This research study was limit and conducted only at EARIST SCIENCE
LABORATORY HIGH SCHOOL during the third grading period of the school year
2007-2008.
The respondents of the study were the third year students belonging to one
intact class in high school chemistry. The instrument used in this study was an
achievement test which serve both as the pre-test as post-test. This is used to
classify the student’s performance and learning outcomes of the students.
Different scientific games will be used to motivate and arouse the interests and
attention each students.
The class were divided into two groups namely, the control group (11)
pupils and the experimental group (11) respectively. The experimental group was
subjected to Scientific Games used as motivation in teaching chemistry, while the
control group was exposed to traditional method.
Definition of Terms
The following terms are defined operationally/conceptually for the better
understanding in the study:
18
Page 19
Performance towards chemistry – it is a deposition of response favourably or
unfavourably towards science subject. In this study, the performance of the pupils
toward science is measured which strategy they learned better.
Interest toward Scientific Games – It refers to the favourable or unfavourable
response of the pupils toward Scientific Games as use in this study. It described
ones feeling toward the games was used. This tool was used only in the
experimental group to arouse pupils interests towards the lessons.
Control Group – It refers to the class that was exposed to the traditional
method.
Experimental group – In this study, this refers to the pupils who taught
chemistry using Scientific Games as motivation.
Scientific Games – These are playful motivational scientific activities played
according to rules.
Games – Method of teaching which involved both physical and mental
competition where active participation of students are required.
Lecture method - Also know as traditional method of teaching which is a
Teacher-oriented and is characterized with less student participation.
Games – Method of teaching which involved both physical and mental
competition where active participation of students are required.
Lecture - Also know as traditional method of teaching which is a Teacher-
oriented and is characterized with less student participation.
Pre-test – a test gives before the lecture.
Post-test – a test given after the lecture or discussion.
19
Page 20
Standard Deviation – a measure of dispersion among all scores in the
distribution rather than through extreme scores. It Is the square root of the
average of the squared deviation from the mean.
Null Hypothesis- is a hypothesis set up to be nullified or refuted in order to
support an alternate hypothesis. It used to test differences in treatment and
control groups, and the assumption at the outset of the experiment is that no
difference exists between the two groups for the variable being compared. It is
only resulted from random chance. Ho, is always expressed in the form of
equality.
Alternative hypothesis (research hypothesis) - is the possibility that an
observed effect is genuine. Ha, is usually the hypothesis for which the
researchers wish to gather evidence to support
Mean – or average of data values is the sum of all of the data values divided by
the number of data values.
Mean difference is minus the mean of the first group to the second group of
samples.
Significance level– It is defined as the probability of making a decision to reject
the null hypothesis when the null hypothesis is actually true
T-Test – is often used to calculate the significance of observed difference
between the means of two samples.
Critical T-value- is the table value corresponding to a given significance level
where its value at the boundary of the rejection region.
20
Page 21
Standard error -is the error of the particular test being used. (In the sense that it
is related to the test statistic)
CHAPTER 2
REVIEW ON RELATED LITERATURE
Broadly speaking, the social scientific approach has concerned
itself with the question of “What do games do to students?” Using tools and
methods such as surveys and controlled laboratory experiments, researchers
have investigated both the positive and negative impact that using games in
teaching could have on students learning.
Among the possible negative effects of game play, perhaps the one
most commonly raised by media and the general public has to do with violence in
games. What are the possible effects that playing videogames, in particular those
that feature aggressive or violent elements might have on children and youth?
Social learning theory (e.g., Bandura, 1986) suggests that playing aggressive
videogames would stimulate aggressive behavior in players in particular because
the player is an active participant (as opposed to a passive observer as the case
of aggression in film and television). On the other hand, catharsis theory (e.g.,
Feshbach and Singer, 1971) implies that playing aggressive videogames would
have the opposite effect by channeling latent aggression resulting in a positive
effect on players. Numerous reviews of existing literature have been written and
21
Page 22
there isn’t a clear picture of the effects of playing violent videogames might have
(Griffiths, 1999; Sherry, 2001).
As for positive effects, educators and learning scientists have also
debated how to leverage the motivation students had for playing games as well
as exploring the medium of videogames for educational and pedagogical
purposes. Malone explored the intrinsically motivating qualities that games have
and how they might be useful in designing educational games (Malone, 1980;
Malone, 1981) while Kafai utilized the design of games by schoolchildren as the
context for them to learn computer programming concepts and mathematics
(Kafai, 1995; Kafai, 1996). Similarly, Squire has explored the use of commercial
games as a means for engaging disenfranchised students in school (Squire,
2005). In addition to their motivational factors, Gee and Shaffer have argued that
certain qualities present in the medium of videogames provide valuable
opportunities for learning (Gee, 2003; Shaffer, 2006). In her book Life on the
Screen, Sherry Turkle explored how people that participated in online multiplayer
games such as MUDs used their experiences with the game to explore personal
issues of identity (Turkle, 1995). In her book Play Between Worlds, T. L. Taylor
recounts her experience playing the massively multiplayer online game
Everquest. In doing so, she seeks to understand “the nuanced border
relationship that exists between MMOG players and the (game) worlds they
inhabit” (Taylor, 2006).
A. Foreign Literature
22
Page 23
Swiss educator Johannes Heinrich Pestlozzi (1746-1827) agree with
the view that a school should be adapted in an atmosphere of general permissive
where physical exercise, play activities and nature study walk should be part of
the learning experiences against the dullness deadening memorization and
recitation.
German educator, Friedrich Froebel (1782-1852) also a naturalist,
believes that the teacher must become an active instructor instead a taskmaster
and hearer of active recitations. He introduced the school for early childhood
education, the kindergarten or child garden that emphasized games, play, songs
and crafts. He urged teachers to look back of their childhood days that could help
them understand the needs of the child.
Other significant studies that relate the games to improved
achievement is in the hand of biology (Bleitan, 1989) and in Genetics concepts
(Garcia, 1993)
B. Local Literature
Nueva Espana et.al (1990, preface) our country depends on Science
and Technology. A great numbers of its problem can be solved by developing its
greatest resource people. Our people must develop skill in Science and
Technology III (chemistry). Sufficiency in scientific and technological expertise is
a characteristic of countries that are become progressive and rich no matter how
small they are. Our country still has a long, long way to become self-sustaining.
Knowledge of Chemistry and the efficient use of its principle can help a lot toward
making our society self sufficient in turn, making us masters of our own science
23
Page 24
and technology and not servants of society. (Philippine Graphics, May 19, 1997
p.8). Senator: Ernesto Maceda made alarming news about the results of our
students performance in mathematics and science competence in the
elementary, high school and even college levels that the Philippines close the
bottom ranked 37th out of 39th countries in Asia. He said that we have to respond
to the truth this tell us with greater sense of urgency to help our students in
several dimensions of the educational process: retraining our teachers,
lengthening classroom work, improving classroom facilities, reviewing the
textbooks now in use and supplementing the resources available in our school
libraries. Allan C. Ornstein (strategies for effective teaching New York: Harper-
Collins publishers 1990 p.213) Ornstein said that “to understand why and how to
use instructional objectives results should be obtained in more effective teaching
and testing. The use of instructional objectives help the teachers focus on what
students should know at the end of the lesson. Likewise, it helps students know
what is expected of them.
C. Foreign Studies
Lebanon is presently in the midst of an educational reform that started shortly
after the end of a fifteen-year civil war (1975-1989). The most important outcomes
of this reform included an operational reform plan (1994), a new educational
ladder (1995), and new curricula and textbooks for all school subjects, including
science. In addition, the reform entailed a series of comprehensive teacher
training activities that covered the privates and public sectors nationwide.
According to the national Center for Educational Research and Development
24
Page 25
(CERD) 1995), The old curriculum has neither met societal needs nor prepared
students properly for the future. This is primarily due to the fact that the
curriculum was outdated, lacked general and specific objectives, and was mainly
focused on the theoretical rather than the practical aspects of knowledge (CERD,
1995). The outcomes of the educational reform initiatives are currently being
evaluated and revised in light of feedback from all stakeholders in the reform.
Eventually, the evaluation will result in recommendations for change that will be
studied and institutionalized after being scrutinized by the appropriate
committees and institutions within the Ministry of Education. Concurrently, the
Education Development Plan, which is a five- year plan, 2002-2007, funded by a
grant from the World Bank, is now well underway. This plan has three
components pertaining to the development and administration of the educational
system, leadership development, assessment and evaluation, and education
infrastructure. The leadership development, assessment, and evaluation
component includes three sub-components: a) development of school principals,
b) teacher training, and c) assessment. Science attracted increasing attention in
the 1995 Lebanese Educational Reform Plan. For example, the number of hours
apportioned to science has increased in the new educational ladder. Biology,
chemistry and physics are taught as separate subjects starting in Grade 7, and
an issues-oriented science curriculum, labeled “scientific literacy”, is being
implemented for those students who do not choose science at the secondary
level. Moreover, the Science Curriculum Committee that was commissioned by
CERD to design and write the new curriculum has decided to give emphasis to
25
Page 26
hands-on and minds-on science learning (Author, 2002). The current Lebanese
curriculum stipulates that chemistry be taught as a separate subject starting at
the Grade 7 level. The number of periods of chemistry per week is presented in
Table.The Number of Periods per Year of Chemistry at Each Grade Level of the
Lebanese Educational System
S = Science, H = Humanities, GS = General Sciences, LS = Life Sciences, SE =
Sociology and Economics,
LH = Literature and Humanities.
Alongside the efforts to reform the Lebanese educational system, there
has been some activity in educational research, in general, and science
education research more specifically. A comprehensive review of the science
education literature in Lebanon between 1992 and 2002
(Author & Abd-El-Khalick, 2004) reveals several limitations in this body of
literature. First, even though at least ten universities in Lebanon offer
undergraduate and/or graduate degrees in education, the number of empirical
studies conducted in these universities is rather small.
Actually, the vast majority of the empirical studies in the review came from
two universities, the American University in Beirut and the Lebanese University.
Additionally, this body of research is poorly disseminated. Only about one third of
all reviewed studies were published in accessible resources including refereed
journals, international databases, book chapters, and conference proceedings.
The rest of the studies were theses or projects available in university libraries
with limited access. Moreover, research conducted in Lebanon is limited in terms
26
Page 27
of its exclusive focus on intermediate and secondary school students. Only a
handful of the reviewed studies focused on elementary students. Another
limitation is that several of the reviewed studies did not have substantial mass.
For instance, several of the studies that examined science textbooks were limited
to the analysis of a few chapters from a single textbook. Finally, there was a clear
lack of studies focusing on documenting and investigating classroom practices
related to science teaching and of large-scale national studies that aim, for
example, to implement and assess curricular innovations or generate
comprehensive reports on the status of science education in
Lebanon. This is despite the fact those investigating teachers’ classroom
practices and the possible links of these practices to student academic
performance might provide insights into improving the quality of science teaching
and learning at all educational levels as suggested by Anderson and Helms
(2001), She (1999), Princeton (2000), and Wenglinsky (2000).
On the international scene a number of educational research projects have
investigated science teachers’ classroom practices. One of the established
projects is the large scale National
The survey of Science and Mathematics Education, conducted in the USA over a
number of years to gauge the status of science and mathematics education in
the USA. Reports from these studies written by Weiss (1987, 1988, 1994),
Weiss, Banilower, McMahon, Kelly & Smith (2001), and
Weiss, Pasley, Smith, Banilower & Heck (2003) have attempted to answer the
following questions using data from questionnaires distributed to stratified
27
Page 28
random samples of teachers from all states in the USA: 1) How well prepared are
science and mathematics teachers in terms of both content and pedagogy? 2)
What are teachers trying to accomplish in their science and mathematics
instruction, and what activities do they use to meet these objectives? 3) To what
extent do teachers support reform notions embodied in the National Research
Council’s National Science Education Standards and the National Council of
Teachers of Mathematics’ Principles and Standards for School Mathematics? And
4) what are the barriers to effective and equitable science and mathematics
education? It is worth noting that no classroom observations were conducted in
these studies and all data sources were based on teachers’ self reports.
Analysis of the trends between 1993 and 2000 in the above studies showed that
science teachers’ classroom practices have seen some changes. These changes
include the reduction in the amount of time spent on reading about science
during class and doing textbook/worksheet problems. Approximately 50% of
teachers at all grade levels reported in 2000 that their students completed
textbook/worksheet problems in the most recent lesson, representing a small
decrease from 1993. Moreover, while there was some increase in the use of
hands-on activities at the
Grade 1-4 level (from 41% to 50% of classes), the percentage of classes in
which hands-on and laboratory activities took place have remained stable and
amounted to approximately two thirds of the classes. There does not seem to be
a change in the percentage of classes in which computers were used: teachers
reported that 10 percent or fewer science lessons included students using
28
Page 29
computers in 1993 and 2000. However, many more teachers reported using
other instructional technologies such as CD-ROMs in 2000 than in 1993.
Another international project that has investigated science and mathematics
teachers classroom practices in science and mathematics is the TIMSS 1999
video study, the science results of which were released in 2006 (Roth, Druker,
Garnier, Lemmens, Chen, Kawanaka, Okamoto, Rasmussen, Trubacova, Warvi,
Gonzales, Stigler, & Gallimore, 2006). This study examined patterns of science
and mathematics teaching practices in 439 videotapes of eighth grade science
lessons in five countries: Australia, the Czech Republic, Japan, the Netherlands,
and the United States. Results of the study showed that there were variations
across the five countries in the organization of science lessons, development of
science content for students, and student involvement in doing science. For
example, the study results showed that students in the
Czech Republic were required to master challenging and theoretical science
content and that classes were mostly focused on talking about science in whole
class settings. In Japan the focus was on presenting science in conceptually
coherent ways while stressing the identification of patterns, making connections
among ideas, and the interplay between evidence and ideas in an inquiry-
oriented approach to teaching. Australian students were mostly involved in
making connections between ideas, evidence, and real-life situations using
inquiry approaches to teaching similar to those used in Japan. Students in the
29
Page 30
Netherlands were held accountable for independent learning of science content
with emphasis on homework and independent seatwork.
Finally, in the United States students experienced variety in instructional
approaches, organizational structures, content, and activities with less emphasis
on developing coherent science ideas and content. The focus of the activities
was on engaging and motivating students rather than on developing challenging
content knowledge.
As evident from the above, there is important research on classroom
practices being conducted worldwide; research that has the potential to provide
useful recommendations for improving science teaching and learning. Even
though the Lebanese Association for Educational
Studies has conducted a number of research projects that aimed to evaluate the
Lebanese curriculum 2, there is a conspicuous absence of research in Lebanon
on teachers’ backgrounds, classroom practices, and barriers they face during
their teaching; research that has the potential to provide information that is
necessary, among other things, for planning teacher training programs and for
evaluating the results of implementing new curricula. Consequently, there is a
need for research to answer the following questions: 1) How well prepared are
chemistry teachers in terms of content and pedagogy, 2) What are chemistry
teachers trying to accomplish in their teaching and what activities do they use to
meet their objectives and 3) What are the barriers to effective chemistry teaching
identified by teachers?
30
Page 31
A basic premise behind the present study is that educational systems are
extremely complex, and a full understanding of all their components is beyond
the scope of this investigation. However, we have adopted a simplified
conceptual model of educational systems used by the National Research Council
Committee on Indicators of Pre-college Science andMathematics Education
(Weiss, 1988) that consider teachers’ quality and quantity with its curriculum
content as inputs, instructional factors as processes, and student achievement as
the primary outcome of any system. This study focused on studying two
components of the model, namely science teachers’ quality and instructional
processes.
D. LOCAL STUDIES
A related study on the use of games as learning in mathematics was
conducted by Aragon (1991). She discovered the greater attention of students to
the lesson and there is interest where enhanced. She also found the strategy as
a very effective motivational learning material that makes recreational and
learning objectives easily attainable. Letting the study of grade V, Aragon agreed
that the games are useful in assisting the learning process by providing
opportunity to see familiar materials in new setting; that makes them excellent
motivation tools in acquiring new skills that breaks the classroom routine in a
pleasant way, making uninterested students become a part of the chase in
permanent learning. Aragon also found that games enables student to appreciate
the value of sportsmanship, fair play, how to follow rules, team work, cooperation,
respect for authorities and selfless sharing of skills for the success of the group.
31
Page 32
Zulueta F. M.(2006)Principles and Teaching Mandaluyong National Bookstore
The lecture method probably is the most common method used in importing
knowledge and information among the students in the secondary and tertiary
levels.
Salandahan G.G (1985), The teaching of science Quezon City Phoenix
Publishing House. Many science educators recognize the positive outcomes of
inquiry teaching despite the limited experimental evidence as to its effectiveness
in leading children to acquire a deeper understanding of science knowledge,
encouraging children to learn by such a method insures the attainment of one of
the most significant outcomes of science developing a scientific mind as well as
desirable social values. Article XIV Section 11 Educational act of 1982
According to education act of 1982 one of the rights of the students is he “right
to receive” primarily through component instruction, relevant quality education in
line with National goals and conducive to their full development as human
persons with human dignity “Aquino 1989"
Cognitive Development and Achievement in science through traditional
and inquiry Approaches of teaching General Chemistry by Rosalinda T. Agton
(1991). Most of the students in today’s college and universities have been
exposed to a method of teaching which is best described as exposition, or the
formal, or the commonly called Traditional method in which the teacher tells the
students what they are expected to know. The assumption is made by curriculum
planners that if the student are to learn the concepts from the content, they have
to rely on printed materials. Traditional procedures in the classroom are those
32
Page 33
that are use to present in a logical sequence, facts, principle, and data needed
thoroughly to expose the students concept. The other various classroom
procedures that could be used in the traditional method are oral explanation
sessions, demonstrations, motion picture and film strips, textbooks, supervised
studies or board work.
CHAPTER 3: METHODOLOGY
Methods and Procedure of Research
This chapter present the methods used in the study, the
respondents of the study, the research instrument, and statistical treatment of
data.
Research Method Used
The researchers use experimental method as a tool in documentary
analysis in gathering data. The researchers analyze and interpreted the results of
pre-test/post-test given to EARIST Laboratory High School students before/after
the instructional process. With regards to the application of scientific games in
teaching chemistry to the third year high school students. The study described,
discovered and interpreted assessment and evaluation of the third year students
and the presented facts concerning to promote better teaching-learning process
through the used of scientific games in chemistry.
Respondents of the study
33
Page 34
The respondents of this study were twenty two (22) third year high
school students with the age starts from fourteen to seventeen years old. They
will be divided into two groups, the control group and the experimental group. The
control group of students is the one who will not have motivation, while the
experimental group is the one who teaches motivations through scientific
games.
Sources of data
The population which constituted sample of the respondents in this
study are consists of f twenty two (22) third year high school students at EARIST
laboratory high School, Nagtahan, Sampaloc, Manila during school year 2008-
2009.
Data Gathering and Instruments
The data gathered for this research were taken from the results of
the pre-test and post-test of the control and experimental group from the selected
topics in chemistry. We, researchers were the one who administered the tests.
The improvised Scientific Games with the corresponding lesson plan was
prepared before the experimental study was made and conducted. The letter of
permission was also presented to the teacher of this research for correction.
Data Gathering procedure
The researcher requested permission from the college DEAN and
Science instructors of EARIST laboratory high school for the use of the student’s
34
Page 35
time to lend their ear on the lecture about scientific games in chemistry. They
were requested to answer the pretests/posttests before/after the session. During
the lecture, researchers were the one to facilitate the classroom instructions. At
the end of the selected topics, the students will be evaluated, which strategy in
teaching chemistry they had learned better.
Statistical Treatment
For the analysis of the data gathered, the following statistical tools
are used:
1. The mean pre-test and post-test to determine the performance of the
experimental and control group.
2.The standard deviation is use to determine the homogeneity or scatters of the
scores of the two groups.
2. Standard Error difference SEdiff= SD1+ SD2/
3. Computed t-test value=
35
Page 36
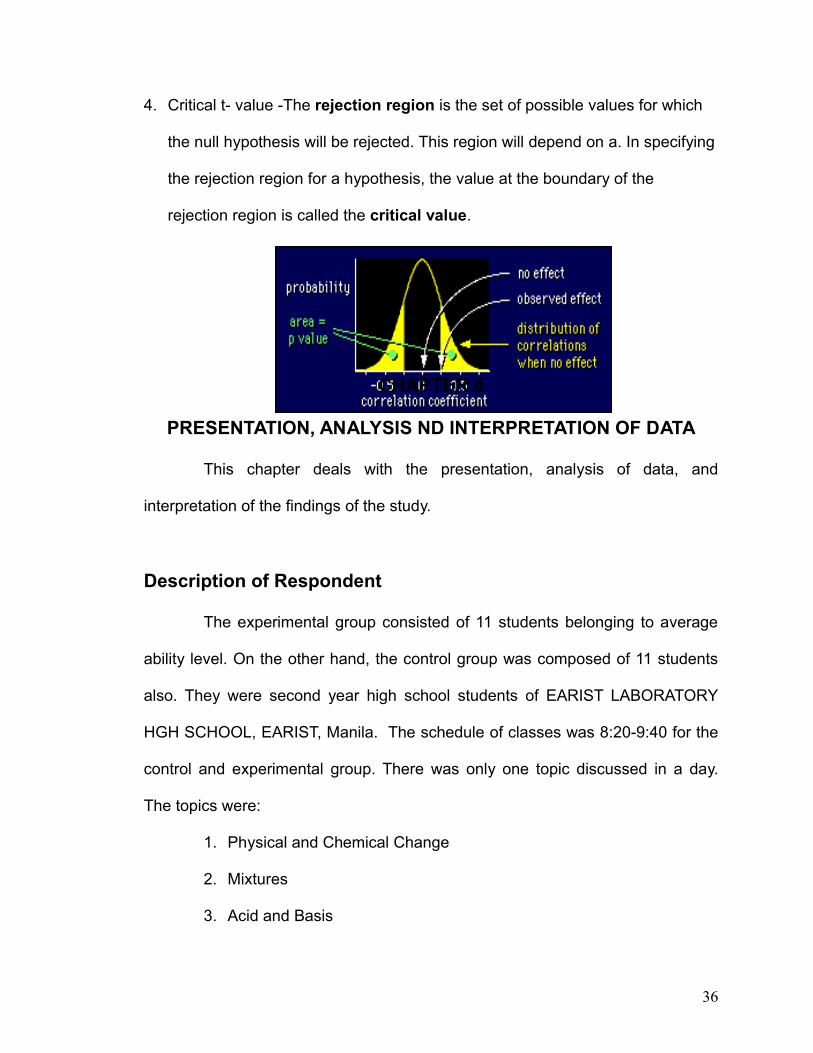
4. Critical t- value -The rejection region is the set of possible values for which
the null hypothesis will be rejected. This region will depend on a. In specifying
the rejection region for a hypothesis, the value at the boundary of the
rejection region is called the critical value.
CHAPTER 4
PRESENTATION, ANALYSIS ND INTERPRETATION OF DATA
This chapter deals with the presentation, analysis of data, and
interpretation of the findings of the study.
Description of Respondent
The experimental group consisted of 11 students belonging to average
ability level. On the other hand, the control group was composed of 11 students
also. They were second year high school students of EARIST LABORATORY
HGH SCHOOL, EARIST, Manila. The schedule of classes was 8:20-9:40 for the
control and experimental group. There was only one topic discussed in a day.
The topics were:
1. Physical and Chemical Change
2. Mixtures
3. Acid and Basis
36
Page 37
The evaluation of the student was done before and after the
experimental period. The achievement test served as the pre-test and post-test.
Data were analyzed by using descriptive statistics like mean and standard
deviation. The hypothesis was tested by using T-test for uncorrelated groups.
FINDINGS OF THE STUDY
1. Performance of the students in the Pre-test
TABLE 1 .Comparison of the Pre-test Mean scores of the Experimental and the Control group
GROUP MEAN Standard deviation
Mean differenc
e
p-value
degrees of
freedom
Computed T-value
EXPERIMENTAL GROUP
18.5 4.34
CONTROL GROUP
18.5 3.70 0 0.831 10 0.219
Table 1 shows the comparison of the pre-test mean scores of the experimental and control groups.
The experimental and control groups had common entry competencies as
shown by their pre-test scores with the highest of 27 out 30 items for the control
group and 26 for the experimental group. The lowest score of the experimental
was 13, while the control group got 15 as the lowest.
37
Page 38
The computed t- value, 0.219 is much lower than the critical value based
on the table of t=1.812. Where p= 0.831 > 0.05 level of significance indicating
that the difference between the mean is not significant. . There is greater than a
5% probability that was obtained in this result by chance, which is exceeds the
acceptable level of error for ecological experiments
This reveals that the two groups are comparable as far as their initial
knowledge about the three topics is concerned.
The standard deviation of experimental and control groups are 4.34 and
3.7 respectively. It shows that the scores of the pre-test of the two groups do not
vary greatly.
2. Performance of the students in the post-test
TABLE- 2.Comparison of the Post-test Mean Scores of the Two Groups
EXPERIMENTALGROUP
CONTROL GROUP
MEAN DIFFERENCE
COMPUTEDT-VALUE
MEAN 25.2 24.3
STANDARDDEVIATION
2.89 3.170.9 2.09
Table -2 reveals the post-test mean scores of the experimental and the
control groups. The mean of the experimental group appear to have a higher
mean value than the control group, which indicates that the interactive method of
teaching using improvised scientific games/motivations is very effective in
teaching Chemistry.
Base on the computed t-test, there is a significant difference statistically
between the two groups with the value of 2.09 which is higher than the critical
value of (t) based on the t- distribution table at the appendices which is equal to
38
Page 39
1.812 with the probability (p) =0.064 (>) and the degrees of freedom, which is 10
which is not so greater than 0.05 level of significance. This indicates that there is
small significant difference in the post-test performance of the two groups based
on the computed t-value. The experimental group appeared to have good
performance compared to the control group based on the mean scores. There
was greater than 5% probability obtained in the result of the post-test of control
group that might occurred only by chance, which exceeds the acceptable level of
error for ecological experiments. It can be interpreted in this way: The students
belong to the control group did their best during the examination. They learned
chemistry concept same as experimental group but in the practical application,
they would no longer know how apply it.
Therefore the null hypothesis that states, there is a significant difference in
the chemistry achievement of students exposed to interactive method using
scientific games as strategy and those who were taught using traditional method
is accepted. It warrants the students exposed to improvised scientific games
used as motivation learned very well not only theory/concept in chemistry but
also skills because they apply their knowledge of the subject into actual situation.
The above findings support the statistical hypothesis or alternative hypothesis of
the researchers that want to find-out.
3. Performance of the two groups based on their achievements on the On the pre-test and post test
3.1 Comparison of the Pre-test and Post-test Mean Scores of the
Experimental and Control Groups
39
Page 40
Table.3 T-test Result of the Pre-test and Post-test Mean scores of the two
Groups
Group TypeMean
pre-testMeanPost-test
Mean difference
standard deviation
P1 P2
t-value
Experimental
group
18.5 25.2 6.7 4.34 2.81 10.5
control
Group
18.3 24.3 6 3.7 3.17 8.49
Table 2 present the pre-test and post-test mean of the experimental and
control groups. The mean difference of experimental group is 6.7 as compared
to 6 mean difference for the control group which tend to show that the
experimental group learned very well with the lesson after the experimental
period, using improvised scientific games compare to the control group who
taught on the traditional method of teaching only. The t-test value for the pre-test
and post test of the experimental group is 10.5 which are higher from the critical
value of 1.812 at a 0.05 level of significance. It has a p- value of 0.0004 < which
is much lower than the significant level 0.05; it shows that the achievement of the
performance of the experimental group during post test in chemistry is less than
5% probability occurred by chance in their scores. While the control group has a
computed t-test value of 8.49 which is higher also compare to the critical t- value
in the table which is equal to 1.812 with a p value=0.000 at 0.05 level of
significant. It means that there is a significant difference statistically and
mathematically in the pre-test and post-test of control group. The result revealed
that they learned concept in chemistry even without games.
40
Page 41
Based on the observation and results of the test, the experimental group is
excellent in terms of knowledge and skills as well as concept in chemistry after
the interactive teaching-learning process. Although the control group learned
also, but they need actual application and motivations to enhance and arouse
their interests in the subject matter. The findings of the control group supports
that whether they were not taught with motivations using scientific games, they
would still be able to learn science concept but not skills.
The careful analysis of data, indicates that there were difference between the
pre-test and post-test scores results of the performance of students in both
control and experimental group because they excelled the same after the
achievement test.
CHAPTER 5
SUMMARY, CONCLUSION AND RECOMMENDATION
This chapter presents the summary of findings, conclusion and
recommendation of the study.
Summary of Findings
The goal of this research study is to determine the effectiveness of the use of
scientific games as a strategy in teaching Chemistry in third year students.
To meet this goal the study revealed the following:
1. There is no significant different of the pre-test mean scores of the control
41
Page 42
and experimental groups based on their initial or store knowledge about the
three topic that were discussed to them. The computed t- value, 2.09 is above
the critical value of t=1.812 and 0.05 level of significance indicating that the
difference between the mean is significant. The results warrants that the null
hypothesis stating that there is no significance between the mean score of the
achievements of the experimental and control group is rejected.
2. There is no significant difference in the post-test mean scores of the
students taught using the lecture and scientific games methods as shown by
the computed t-value of 2.09 which is lower than the critical value of t which is
1.812 at the 0.05 level of significance.
3. There is a significant gain in achievement scores of the students both
taught using the traditional method and interactive teaching method using
scientific games as motivation. The computed t-value for the difference
between the means of the pre-test and post-test of the experimental and control
groups are 10.5 and 8.45 respectively. They are both higher than the critical
value of t which is 1.812 at a 0.05 level of significance.
Conclusions
From the above findings the following conclusion are made.
1. Interactive method using scientific games and traditional methods of teaching
are effective in teaching selected topics in chemistry like physical and
chemical changes, mixtures and acids and bases. But the students on the
42
Page 43
experimental group learned very well not only theories but also skills on how
to apply a particular example of each topic.
2. Students in both experimental and control group share similar achievement
before and after the experiment. Whether science teachers used traditional
method in teaching, the students were capable to learn the theories and
concept but not the skills.
3. But when the science teachers used scientific games in teaching chemistry
to students, they will be active and participative in the teaching-learning process
since they were enjoy to play that is helpful and relevant for them in acquiring
science concepts and skills.
Recommendation
Based from the findings and conclusion formulated in this research
study, the following recommendations are hereby proposed:
1. Science teachers can use games to enrich their science teaching. This
strategy can be used to arouse and enhance their interests to learn the
subject matter.
2. Science teachers should explore the used of other enrichment activities that
could be used to teach science concepts and skills.
3. A more extensive study to be conducted in terms of longer exposure time to
scientific games strategy and the inclusion of more topics that can be taught
using games to arrive at more accurate conclusions.
43
Page 44
APPENDICES
A.Critical Values of t
PERCENTAGE POINTS OF THE T DISTRIBUTION
Tail ProbabilitiesOne Tail 0.10 0.05 0.025 0.01 0.005 0.001 0.0005Two Tails 0.20 0.10 0.05 0.02 0.01 0.002 0.001-------+---------------------------------------------------------+-----
D 1 | 3.078 6.314 12.71 31.82 63.66 318.3 637 | 1
E 2 | 1.886 2.920 4.303 6.965 9.925 22.330 31.6 | 2
G 3 | 1.638 2.353 3.182 4.541 5.841 10.210 12.92 | 3
R 4 | 1.533 2.132 2.776 3.747 4.604 7.173 8.610 | 4
E 5 | 1.476 2.015 2.571 3.365 4.032 5.893 6.869 | 5
E 6 | 1.440 1.943 2.447 3.143 3.707 5.208 5.959 | 6
S 7 | 1.415 1.895 2.365 2.998 3.499 4.785 5.408 | 7
8 | 1.397 1.860 2.306 2.896 3.355 4.501 5.041 | 8
O 9 | 1.383 1.833 2.262 2.821 3.250 4.297 4.781 | 9
F 10 | 1.372 1.812 2.228 2.764 3.169 4.144 4.587 | 10
11 | 1.363 1.796 2.201 2.718 3.106 4.025 4.437 | 11
F 12 | 1.356 1.782 2.179 2.681 3.055 3.930 4.318 | 12
R 13 | 1.350 1.771 2.160 2.650 3.012 3.852 4.221 | 13
E 14 | 1.345 1.761 2.145 2.624 2.977 3.787 4.140 | 14
E 15 | 1.341 1.753 2.131 2.602 2.947 3.733 4.073 | 15
44
Page 45
D 16 | 1.337 1.746 2.120 2.583 2.921 3.686 4.015 | 16
O 17 | 1.333 1.740 2.110 2.567 2.898 3.646 3.965 | 17
M 18 | 1.330 1.734 2.101 2.552 2.878 3.610 3.922 | 18
19 | 1.328 1.729 2.093 2.539 2.861 3.579 3.883 | 19
20 1.325 1.725 2.086 2.528 2.845 3.552 3.850 |
21 | 1.323 1.721 2.080 2.518 2.831 3.527 3.819 | 21
22 | 1.321 1.717 2.074 2.508 2.819 3.505 3.792 | 22
23 | 1.319 1.714 2.069 2.500 2.807 3.485 3.768 | 23
24 | 1.318 1.711 2.064 2.492 2.797 3.467 3.745 | 24
25 | 1.316 1.708 2.060 2.485 2.787 3.450 3.725 | 25
26 | 1.315 1.706 2.056 2.479 2.779 3.435 3.707 | 26
27 | 1.314 1.703 2.052 2.473 2.771 3.421 3.690 | 27
28 | 1.313 1.701 2.048 2.467 2.763 3.408 3.674 | 28
29 | 1.311 1.699 2.045 2.462 2.756 3.396 3.659 | 29
30 | 1.310 1.697 2.042 2.457 2.750 3.385 3.646 | 30
32 | 1.309 1.694 2.037 2.449 2.738 3.365 3.622 | 32
34 | 1.307 1.691 2.032 2.441 2.728 3.348 3.601 | 34
36 | 1.306 1.688 2.028 2.434 2.719 3.333 3.582 | 36
38 | 1.304 1.686 2.024 2.429 2.712 3.319 3.566 | 38
40 | 1.303 1.684 2.021 2.423 2.704 3.307 3.551 | 40
42 | 1.302 1.682 2.018 2.418 2.698 3.296 3.538 | 42
44 | 1.301 1.680 2.015 2.414 2.692 3.286 3.526 | 44
46 | 1.300 1.679 2.013 2.410 2.687 3.277 3.515 | 46
48 | 1.299 1.677 2.011 2.407 2.682 3.269 3.505 | 48
50 | 1.299 1.676 2.009 2.403 2.678 3.261 3.496 | 50
55 | 1.297 1.673 2.004 2.396 2.668 3.245 3.476 | 55
60 | 1.296 1.671 2.000 2.390 2.660 3.232 3.460 | 60
65 | 1.295 1.669 1.997 2.385 2.654 3.220 3.447 | 65
45
Page 46
70 | 1.294 1.667 1.994 2.381 2.648 3.211 3.435 | 70
80 | 1.292 1.664 1.990 2.374 2.639 3.195 3.416 | 80
100 | 1.290 1.660 1.984 2.364 2.626 3.174 3.390 | 100
150 | 1.287 1.655 1.976 2.351 2.609 3.145 3.357 | 150
200 | 1.286 1.653 1.972 2.345 2.601 3.131 3.340 | 200
-------+---------------------------------------------------------+-----
Two Tails 0.20 0.10 0.05 0.02 0.01 0.002 0.001
One Tail 0.10 0.05 0.025 0.01 0.005 0.001 0.000
UMMARY COMPUTATION OF THE PRE-TEST OF EXPERIMENTAL
AND CONTROL GROUP
Paired Student's t-Test: Results
The results of a paired t-test performed at 12:33 on 25-FEB-2008
t= 0.219
degrees of freedom = 10
The probability of this result, assuming the null hypothesis, is 0.831
Group A: Number of items= 11
13.0 13.0 15.0 16.0 16.0 18.0 20.0 22.0 22.0 23.0 26.0
Mean = 18.5
95% confidence interval for Mean: 15.63 thru 21.46
Standard Deviation = 4.34
46
Page 47
High score = 26.0 Low score= 13.0
Median = 18.0
Average Absolute Deviation from Median = 3.64
Group B: Number of items= 11
15.0 15.0 15.0 16.0 16.0 18.0 19.0 20.0 21.0 21.0 27.0
Mean = 18.5
95% confidence interval for Mean: 15.97 thru 20.94
Standard Deviation = 3.70
Highest score = 27.0 Lowest score = 15.0
Median = 18.0
Average Absolute Deviation from Median = 2.82
Group A-B: Number of items= 11
-2.00 -2.00 -1.00 0.00 0.00 0.00 0.00 1.00 1.00 2.00 2.00
Mean = 9.091E-02
95% confidence interval for Mean: -0.8329 thru 1.015
Standard Deviation = 1.38
Highest score difference = 2.00 Lowest score difference = -2.00
Median = 0.00
Average Absolute Deviation from Median = 1.00
47
Page 48
POST –TEST OF THE EXPERIMENTAL AND CONTROL GROUP
Paired Student's t-Test: Results
The results of a paired t-test performed at 12:39 on 25-FEB-2008
t= 2.09
degrees of freedom = 10
The probability of this result, assuming the null hypothesis, is 0.064
Group A: Number of items= 11
21.0 21.0 22.0 23.0 26.0 26.0 27.0 27.0 27.0 28.0 29.0
Mean = 25.2
95% confidence interval for Mean: 23.24 thru 27.12
Standard Deviation = 2.89
Hi = 29.0 Low = 21.0
Median = 26.0
Average Absolute Deviation from Median = 2.27
Group B: Number of items= 11
17.0 21.0 23.0 24.0 25.0 25.0 25.0 25.0 26.0 27.0 29.0
48
Page 49
Mean = 24.3
95% confidence interval for Mean: 22.15 thru 26.40
Standard Deviation = 3.17
Hi = 29.0 Low = 17.0
Median = 25.0
Average Absolute Deviation from Median = 2.00
Group A-B: Number of items= 11
-1.00 -1.00 0.00 0.00 1.00 1.00 1.00 1.00 2.00 2.00 4.00
Mean = 0.909
95% confidence interval for Mean: -6.2337E-02 thru 1.881
Standard Deviation = 1.45
Hi = 4.00 Low = -1.00
Median = 1.00
Average Absolute Deviation from Median = 1.00
SUMMARY COMPUTATION OF SCORES BETWEEN PRE-TEST AND
POST-TEST OF EXPERIMENTAL GROUP
Paired Student's t-Test: Results
The results of a paired t-test performed at 12:44 on 25-FEB-2008
49
Page 50
t= -10.5
degrees of freedom = 10
The probability of this result, assuming the null hypothesis, is 0.000
Group A: Number of items= 11
13.0 13.0 15.0 16.0 16.0 18.0 20.0 22.0 22.0 23.0 26.0
Mean = 18.5
95% confidence interval for Mean: 15.63 thru 21.46
Standard Deviation = 4.34
Hi = 26.0 Low = 13.0
Median = 18.0
Average Absolute Deviation from Median = 3.64
Group B: Number of items= 11
21.0 21.0 22.0 23.0 26.0 26.0 27.0 27.0 27.0 27.0 29.0
Mean = 25.1
95% confidence interval for Mean: 23.20 thru 26.98
Standard Deviation = 2.81
Hi = 29.0 Low = 21.0
Median = 26.0
Average Absolute Deviation from Median = 2.18
50
Page 51
Group A-B: Number of items= 11
-10.0 -8.00 -8.00 -8.00 -7.00 -7.00 -7.00 -5.00 -5.00 -4.00 -3.00
Mean = -6.55
95% confidence interval for Mean: -7.934 thru -5.157
Standard Deviation = 2.07
Hi = -3.00 Low = -10.0
Median = -7.00
Average Absolute Deviation from Median = 1.55
SUMMARY COMPUTATION OF SCORES BETWEEN PRE-TEST AND
POST-TEST CONTROL GROUP
Paired Student's t-Test: Results
The results of a paired t-test performed at 13:19 on 25-FEB-2008
t= -8.49
degrees of freedom = 10
The probability of this result, assuming the null hypothesis, is 0.000
Group A: Number of items= 11
15.0 15.0 15.0 16.0 16.0 18.0 19.0 20.0 21.0 21.0 27.0
51
Page 52
Mean = 18.5
95% confidence interval for Mean: 15.97 thru 20.94
Standard Deviation = 3.70
Hi = 27.0 Low = 15.0
Median = 18.0
Average Absolute Deviation from Median = 2.82
Group B: Number of items= 11
17.0 21.0 23.0 24.0 25.0 25.0 25.0 25.0 26.0 27.0 29.0
Mean = 24.3
95% confidence interval for Mean: 22.15 thru 26.40
Standard Deviation = 3.17
Hi = 29.0 Low = 17.0
Median = 25.0
Average Absolute Deviation from Median = 2.00
Group A-B: Number of items= 11
-9.00 -8.00 -8.00 -7.00 -6.00 -6.00 -6.00 -5.00 -5.00 -2.00 -2.00
Mean = -5.82
95% confidence interval for Mean: -7.345 thru -4.292
Standard Deviation = 2.27
Highest score diff = -2.00 Lowest score diff = -9.00
52
Page 53
Median = -6.00
Average Absolute Deviation from Median = 1.64
Bibliography
Agton, Rosalinda T. Cognitive Development and Achievement in Science through
the Traditional and Inquiry Approaches of Teaching General Chemistry.
November 1991.
Beran, Maria Teresa E. Chemistry Problem Solving Performance and Strategies
of Deep and Surface Learners: An Analysis. June 30, 2005
Donnelly, Richard et al., 1958 Action Games and Contest, 2nd ed. New York :
Ronald Press Company.
Ellington, Henry, Addinal, Eric, Fred Persival; 1981, Games Conden: Kogon page
limited.
Hebron, Rigoberta T., 1980, “ The effect of Games on the Learning of Geometry
in rad Time” University of the Philippines , Diliman Q.C.
Salazar, Zenaida, 1980, “Try –out Games in Science”, University of the
Philippines Q.C
Journals
53
Page 54
CSU.LAL-LO, Research journal, Vol. 1, no.1 jan-dec.2003
CURRICULUM VITAE
NAME: Glenda C. Perlota
ADDRESS: 27Panatag rd. Blk. 37 Welfareville Compound Mandaluyong City
DATE OF BIRTH: March 18, 1985
PLACE OF BIRTH: Cabuyao, Batan, Alkan 5615
AGE: 22
RELIGION: Jehovah’s Witnesses
MOTHER’S NAME: Sonia C. Perlota
OCCUPATION: Housewife
FATHER’S NAME: Restituto C. Perlota OCCUPATION: Farmer
EDUCATIONAL ATTAINMENT:
ELEMENTARY: Cabugao Elementary School
YEAR: 1990-1996
HIGH SCHOOL: Rizal J. Rodriguez sr. National High School
YEAR: 1996-2000
COLLEGE: Eulogio “AMANG” Rodriguez Institute of Science and
Technology
54
Page 55
YEAR: 2004-present
SEMINARS ATTENDED: Vegetarian Diet by Dr. Tam
CURRICULM VITAE
NAME: Reymund G. Reyes
ADDRESS: 2446 Isagani Sta.cruz Manila
DATE OF BIRTH: May 16, 1986
PLACE OF BIRTH: Sta.cruz Manila
AGE: 21
RELIGION: Christian
MOTHER’S NAME: Remegia G. Reyes
OCCUPATION: deceased
FATHER’S NAME: Antonio C. Reyes OCCUPATION: diseased
EDUCATIONAL ATTAINMENT:
ELEMENTARY: P. Gomez Elementary School
YEAR: 1992-1999
HIGH SCHOOL: Manuel L. Quezon High School
YEAR: 1999-2003
COLLEGE: Eulogio ”AMANG” Roidriguez Institute of Science and Technology
YEAR: 2004-present
55
Page 56
SEMINARS ATTENDED: Vegetarian Diet by Dr. Tam
National Health Expo: 2007
CURRICULM VITAE
NAME: Jay-Ar D. Rivera
ADDRESS: 2422 Pedroo Gil St. Sta. ana Manila
DATE OF BIRTH: June 12, 1985
PLACE OF BIRTH: 20 Almasen St. Hermosa Bataan
AGE: 22
RELIGION: Roman Catholic
MOTHER’S NAME: Neneth D. Rivera
OCCUPATION: housewife
FATHER’S NAME: Ricardo C. Rivera OCCUPATION: deceased
EDUCATIONAL ATTAINMENT:
ELEMENTARY: Darangan Elementary School
YEAR: 2001
HIGH SCHOOL: Vicente Madrigal National High School
YEAR: 2005
COLLEGE: Eulogio ”AMANG” Roidriguez Institute of Science and
Technology
YEAR: 2004-present
56
Page 57
SEMINARS ATTENDED: Vegetarian Diet by Dr. Tam
CURRICULM VITAE
NAME: Ronald A. Sato ADDRESS: 1587-C Duhat St.. Nagtahan, Sampaloc, Manila
DATE OF BIRTH: November 11, 1984
PLACE OF BIRTH: Bais City , Negros Oriental
AGE: 23
RELIGION: Born Again Christian
MOTHER’S NAME: Martina Abrasaldo
OCCUPATION: none
FATHER’S NAME: Pablo Sato OCCUPATION: deceased
EDUCATIONAL ATTAINMENT:
ELEMENTARY: Bais Elem. School
YEAR: 1994-1999
HIGH SCHOOL: Ismael Mathay Sr, High School
YEAR: 2004-2005
COLLEGE: Eulogio ”AMANG” Roidriguez Institute of Science and
Technology
YEAR: 2004-present
57
Page 58
SEMINARS ATTENDED: Vegetarian Diet by Dr. Tam
CURRICULM VITAE
NAME: Macel T. Solis
ADDRESS: 27 Kasayahan St. Batsan Hills Quezon City
DATE OF BIRTH: September 18, 1988
PLACE OF BIRTH: Aguada, Placer, Masbate
AGE: 19
RELIGION: Roman Catholic
MOTHER’S NAME: Miguela T. Solis
OCCUPATION: housekeeper
FATHER’S NAME: Egnacio O. Solis OCCUPATION: Carpenter
EDUCATIONAL ATTAINMENT:
ELEMENTARY: San Diego Elementary School
YEAR: 1994-2000
HIGH SCHOOL: Batasan Hills National High School
YEAR: 2000-2004
COLLEGE: Eulogio ”AMANG” Roidriguez Institute of Science and
Technology
YEAR: 2004-present
58
Page 59
SEMINARS ATTENDED: Vegetarian Diet by Dr. Tam
CURRICULM VITAE
NAME: Avegail B. Vega
ADDRESS: 1317-D Kalimbas St. Sta.Cruz Manila
DATE OF BIRTH: May 31, 1986
PLACE OF BIRTH: Panikihan, Pala Oriental Mindoro
AGE: 21
RELIGION: Roman Catholic
MOTHER’S NAME: Imelda B. Vega
OCCUPATION: HOUSEWIFE
FATHER’S NAME: Andie D. Vega OCCUPATION: Farmer
EDUCATIONAL ATTAINMENT:
ELEMENTARY: Panikihan Elementary School
YEAR: 1992-1998
HIGH SCHOOL: Domingo Xu Chu National High School
YEAR: 1998-2003
COLLEGE: Eulogio ”AMANG” Roidriguez Institute of Science and
Technology
59
Page 60
YEAR: 2004-present
SEMINARS ATTENDED: Vegetarian Diet by Dr. Tam
60