23
22nd Annual Piper Jaffray Health Care Conference November 30, 2010 Walter Hosp, CFO Contact: Christine Saenz [email protected] 212.857.5986
| Date post: | 02-Jan-2016 |
| Category: |
Documents |
| Upload: | ashley-mccormick |
| View: | 213 times |
| Download: | 0 times |

22nd Annual Piper Jaffray Health Care Conference
November 30, 2010
Walter Hosp, CFO
Contact:Christine Saenz

What We Do
We provide cost containment services for healthcare payors.
We help ensure that claims are paid correctly (Program Integrity) and by the responsible party (Coordination of Benefits).
As a result, our clients spend more of their healthcare dollars on the people entitled to them.
2
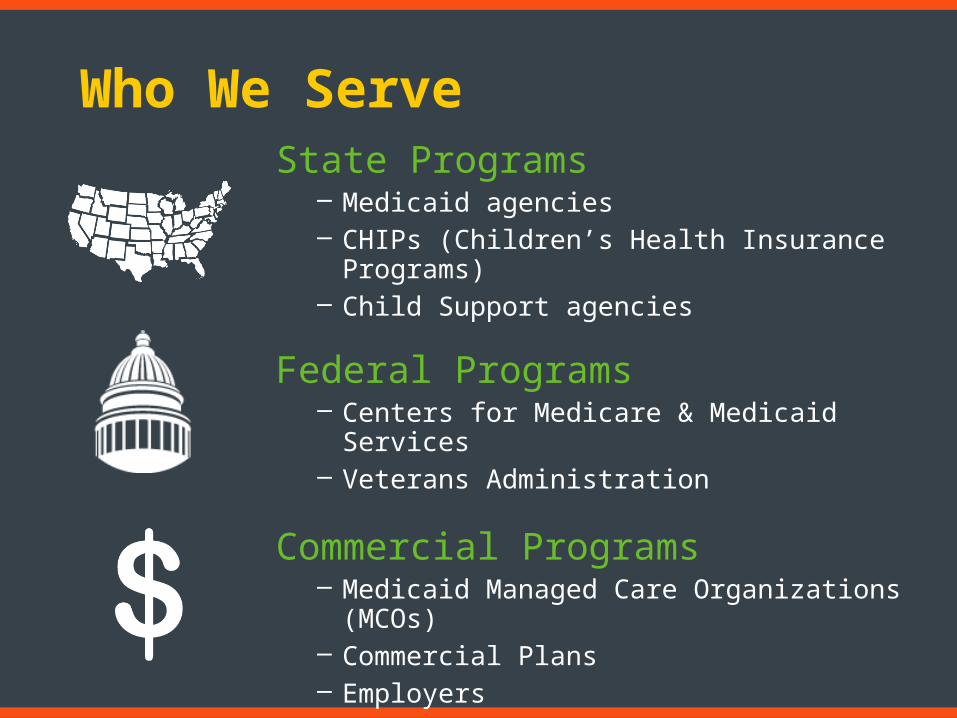
Who We Serve
Federal Programs– Centers for Medicare & Medicaid Services– Veterans Administration
3
State Programs– Medicaid agencies– CHIPs (Children’s Health Insurance Programs)– Child Support agencies
Commercial Programs– Medicaid Managed Care Organizations (MCOs)– Commercial Plans– Employers

COMMERCIAL
$847 billion164 million lives
Source: 2009 CMS Office of the Actuary
4
MEDICARE
$515.5 billion 47 million lives
MEDICAID
$436 billion 57 million lives
UNINSURED46 million lives
Coordination of Benefits

5
How We Grow
55
Capture more lives
Ride the Medicaid growth wave
Add new products, enter new markets
Upsell to existing customers
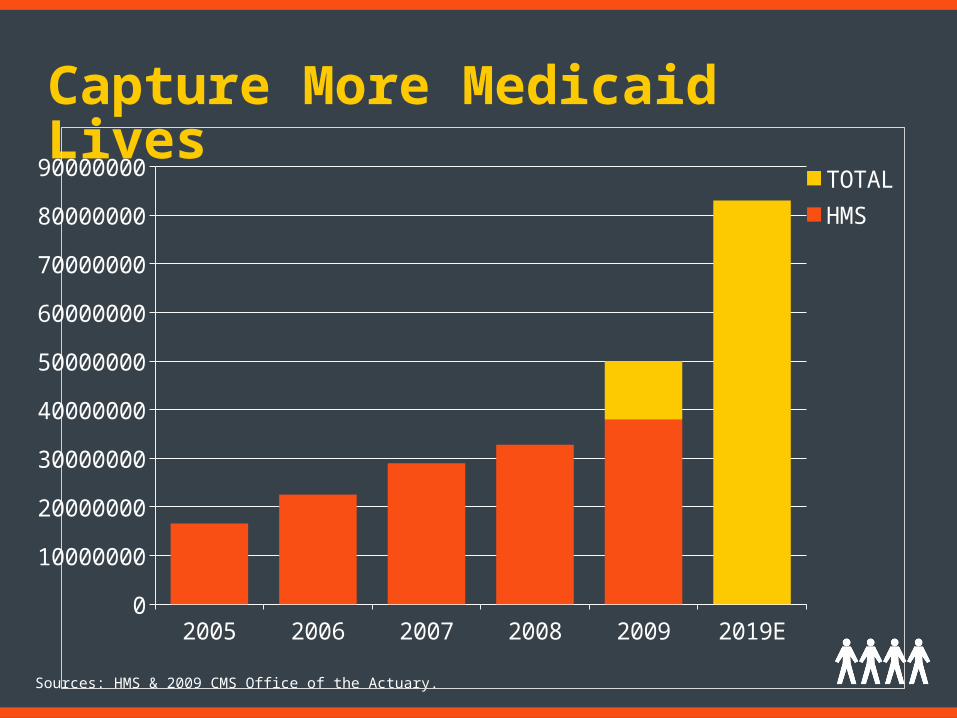
Capture More Medicaid Lives
Sources: HMS & 2009 CMS Office of the Actuary.
2005 2006 2007 2008 2009 2019E0
10000000
20000000
30000000
40000000
50000000
60000000
70000000
80000000
90000000 TOTAL
HMS
6

Ride the Medicaid Growth Wave
Actual Projected
7
1995-2008 data, 2008 CMS Office of the Actuary2010-2019 data, 2009 CMS Office of the Actuary
With reform
2001 2002 2003 2004 2005 2006 2007 2008 2009 2010 2011 2012 2013 2014 2015 2016 2017 2018 20190
200
400
600
800
1000
1200
Historical and Projected Medicaid Expeditures
Fiscal Year
$ b
illio
ns

8
2005 2006 2007 2008 2009 2010 & Beyond
Acquired Permedion
Hospital Audits
CHIP Enrollment Integrity
Acquired BSPA
Premium Assistance
Real-time COB
Managed Care
Acquired PrudentRx
Federal MIC
Clinical Review
M & A
Market
Service
Acquired IntegriGuard
Acquired Verify Solutions
Behavioral Health
Long-term Care Audits
Pharmacy Audits
Acquired AMG
Acquired Chapman Kelly
Medicare
Employers
Commercial Insures
Dependent Eligibility Audits
New Product Development
Healthcare Reform Products
Add New Products, Enter New Markets

Upsell to existing customers

Upsell to existing customers
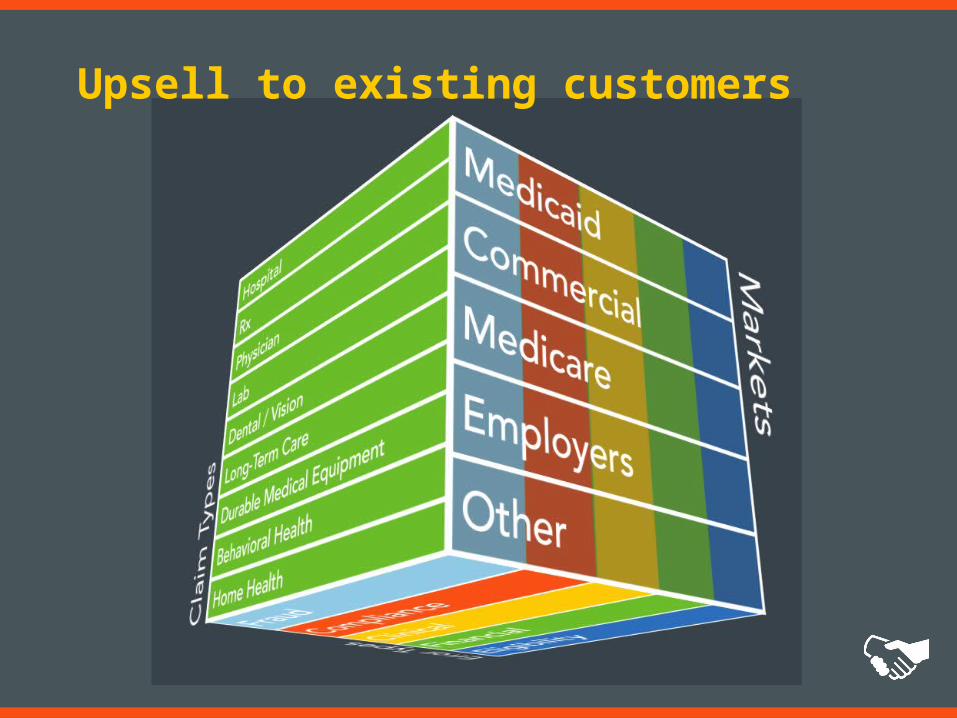
Upsell to existing customers

Impact of Health Reform Law
Medicaid/Medicare expansion
New pathways to coverage
Emphasis on program integrity
Employer requirements12

COMMERCIAL
$847 billion164 million lives
Source: 2009 CMS Office of the Actuary
13
MEDICARE
$515.5 billion 47 million lives
MEDICAID
$436 billion 57 million lives
UNINSURED46 million lives
Medicaid/Medicare Expansion
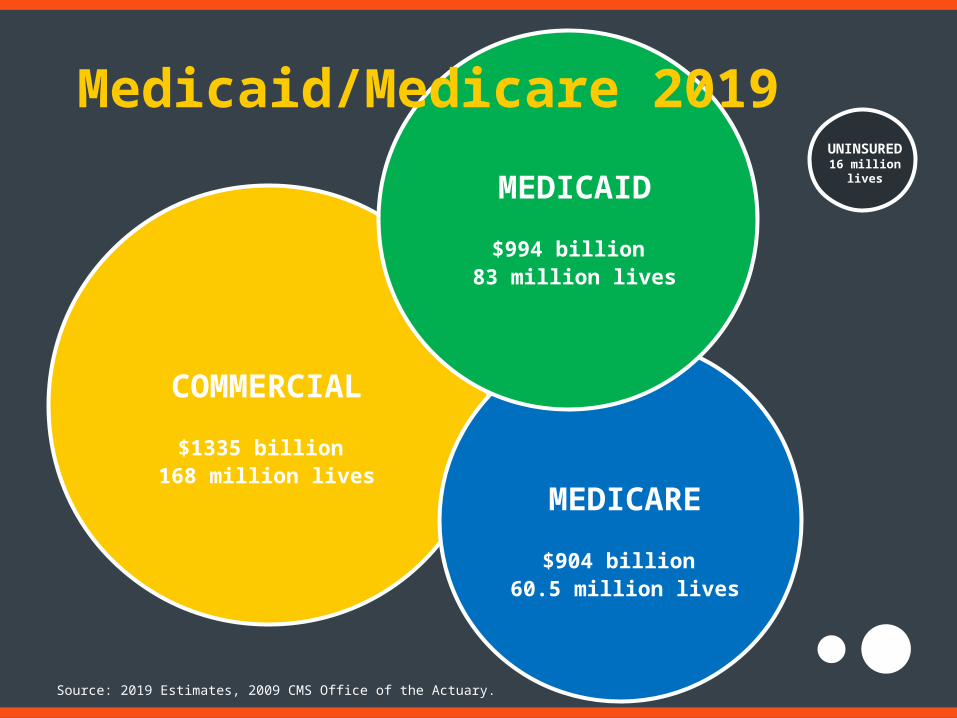
COMMERCIAL
$1335 billion 168 million lives
Source: 2019 Estimates, 2009 CMS Office of the Actuary.
MEDICARE
$904 billion 60.5 million lives
14
UNINSURED16 million
livesMEDICAID
$994 billion 83 million lives
Medicaid/Medicare 2019

New Pathways to Coverage
State and Regional exchanges
Tax credits and cost-sharing assistance
Eligibility in multiple plans
Coordination of benefits with Medicaid
Find the “Right Insurance Home”
15
Emphasis on Program Integrity
Increase in funding
Expansion of RAC program to Medicaid
Data, technology and services needed to support reductions in fraud, waste, and abuse
16
Employer Requirements
New coverage requirements and employer penalties
Automatic enrollment of employees into health plans
Reporting mandates
17
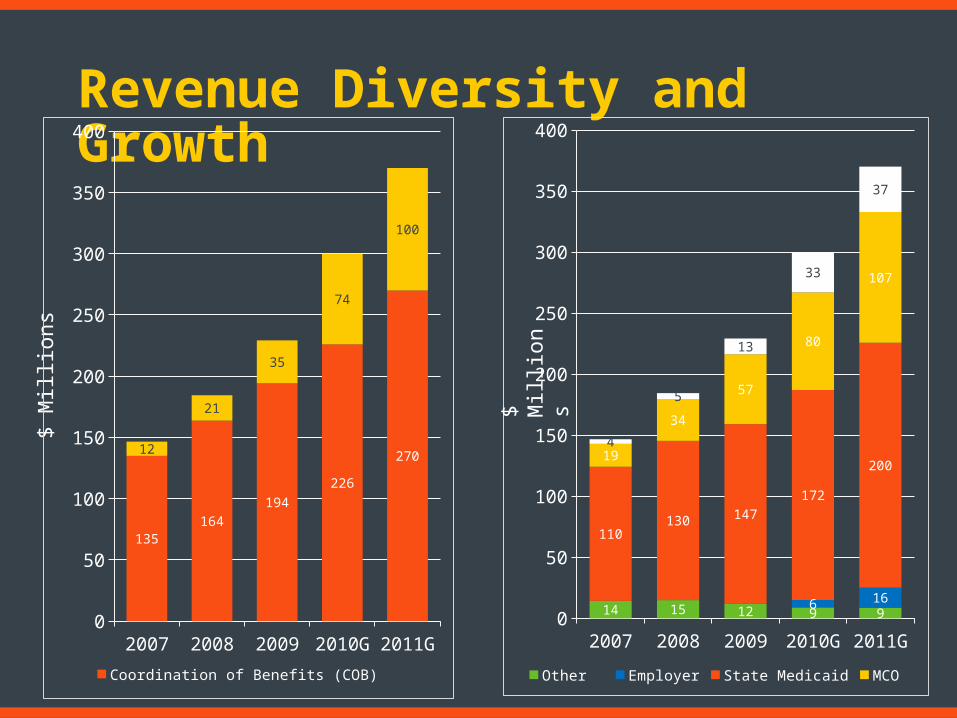
Revenue Diversity and Growth
18
$ M
illio
ns
2007 2008 2009 2010G 2011G0
50
100
150
200
250
300
350
400
135164
194
226
27012
21
35
74
100
Coordination of Benefits (COB) Program Integrity (PI)
2007 2008 2009 2010G 2011G0
50
100
150
200
250
300
350
400
14 15 12 9 9
110130 147
172
20019
34
57
80
107
4
5
13
33
37
6 16
Other Employer State Medicaid MCO Federal
$ M
illio
ns

Key Financial IndicatorsRolling Four Quarters
19
Q4 07
Q1 08
Q2 08
Q3 08
Q4 08
Q1 09
Q2 09
Q3 09
Q4 09
Q1 10
Q2 10
Q3 10
130.0
150.0
170.0
190.0
210.0
230.0
250.0
270.0
290.0 Revenue
($ m
illio
ns)
Q4 07
Q1 08
Q2 08
Q3 08
Q4 08
Q1 09
Q2 09
Q3 09
Q4 09
Q1 10
Q2 10
Q3 10
$0.50 $0.60 $0.70 $0.80 $0.90 $1.00 $1.10 $1.20 $1.30 $1.40
Earning Per Share
Q4 07
Q1 08
Q2 08
Q3 08
Q4 08
Q1 09
Q2 09
Q3 09
Q4 09
Q1 10
Q2 10
Q3 10
25.0
30.0
35.0
40.0
45.0
50.0
55.0
60.0
65.0 Operating Profit
($ m
illio
ns)
Q4 07
Q1 08
Q2 08
Q3 08
Q4 08
Q1 09
Q2 09
Q3 09
Q4 09
Q1 10
Q2 10
Q3 10
$35.0 $40.0 $45.0 $50.0 $55.0 $60.0 $65.0 $70.0 $75.0 $80.0 $85.0
EBITDA
($ m
illio
ns)

Guidance
Revenue 2010 2011$ $300.0 $370.0
% change y/y 30.9% 23.0%
Operating Profit$ $66.9 $85.0
% change y/y 29.0% 26.8%
Margin 22.3% 23.0%
GAAP EPS$ $1.40 $1.74
% change y/y 28.7% 23.6%
Adjusted EPS$ $1.68 $2.03
% change y/y 25.9% 20.1%
20
21
Investment Considerations
Low risk, high growth core business- Proprietary data and technologies- High barriers to entry
High growth Program integrity business in early stage
Well positioned in current healthcare environment
Multiple new growth opportunities- Products- Acquisitions - Markets
Recurring, transparent and diversified revenue
Strong financial position
21

22
Safe Harbor Statement
Certain statements in this presentation constitute “forward-looking statements” within the meaning of the Private
Securities Litigation Reform Act of 1995 (the “Reform Act”). Such forward-looking statements involve known and
unknown risks, uncertainties, and other factors that may cause the actual results, performance, or achievements of
HMSY, or industry results, to be materially different from any future results, performance, or achievements expressed or
implied by such forward-looking statements. The important factors that could cause actual results to differ materially from
those indicated by such forward-looking statements include, but are not limited to (i) the information being of a preliminary
nature and therefore subject to further adjustment; (ii) the uncertainties of litigation; (iii) HMSY’s dependence on
significant customers; (iv) changing conditions in the healthcare industry which could simplify the reimbursement process
and adversely affect HMSY’s business; (v) government regulatory and political pressures which could reduce the rate of
growth of healthcare expenditures and/or discourage the assertion of claims for reimbursement against and delay the
ultimate receipt of payment from third party payors; (vi) competitive actions by other companies, including the
development by competitors of new or superior services or products or the entry into the market of new competitors; (vii)
all the risks inherent in the development, introduction, and implementation of new products and services; and (viii) other
risk factors described from time to time in HMSY’s filings with the SEC, including HMSY’s Form 10-K for the year ended
December 31, 2009. HMSY assumes no responsibility to update the forward-looking statements contained in this release
as a result of new information, future events or otherwise. When/if used in this presentation, the words “ focus,” “
believe, ” “ confident, ” “ anticipate, ” “ expected, ” “ strong, ” “ potential, ” and similar expressions are intended to
identify forward-looking statements, and the above described risks inherent therein.

23
NASDAQ: HMSY

