139
ANNUAL REPORT 2012 ANNUAL REPORT 2012

AN
NU
AL
REP
OR
T 2
012
ANNUAL REPORT 2012

SHARE INFORMATION 2012 2011
(Share price in EUR)
High 34.50 38.46
Low 23.27 20.67
Close 34.00 28.39
Average daily trading volume 331,617 390,069
Number of issued ordinary shares at year-end (x 1,000) 107,284 103,472
Average number of outstanding shares (x 1,000) 105,644 102,391
Stock market capitalization (in EUR billions) 3.648 2.938
KEY FIGURES
(in EUR million, unless stated otherwise) 2012 2011
Revenue (work done)* 3,081 2,801
Order book (work to be done) 4,106 3,489
Operating profit 336.9 354.1
EBITDA* 568.2 590.5
Net profit 250.2 254.3
Net group profit* 253.1 261.0
Depreciation, amortization and impairment losses 231.3 236.4
Cash flow* 484.4 497.4
Shareholders’ equity 1,898 1,733
Personnel (headcount) 15,653 13,935
RATIOS (IN PERCENTAGES)
Operating result as % of revenue 10.9 12.6
Return on capital employed* 11.1 12.1
Return on equity* 13.8 15.4
Solvency* 39.2 37.4
FIGURES PER SHARE (IN EUR)
Profit 2.37 2.48
Dividend 1.24 1.24
Cashflow* 4.59 4.86
* Refer to glossary for defi nitions
Boskalis AEX
DEVELOPMENT BOSKALIS SHARE PRICE 2012,AEX INDEX REBASED TO BOSKALIS (in EUR)
JAN FEB MAR APR MAY JUN JUL AUG SEP OCT NOV DEC20
22
24
26
28
30
32
34
AN
NU
AL
REP
OR
T 2
01
2 —
BO
SKA
LIS
KEY
FIG
UR
ES

REVENUE (in EUR million) NET PROFIT (in EUR million) CAPITAL EXPENDITURE (in EUR million)
ORDER BOOK (in EUR million) ACQUIRED ORDERS (in EUR million) FLEET UTILIZATION (in weeks per year)
REVENUE BY SEGMENT (in EUR million) REVENUE BY GEOGRAPHICAL AREA (in EUR million)
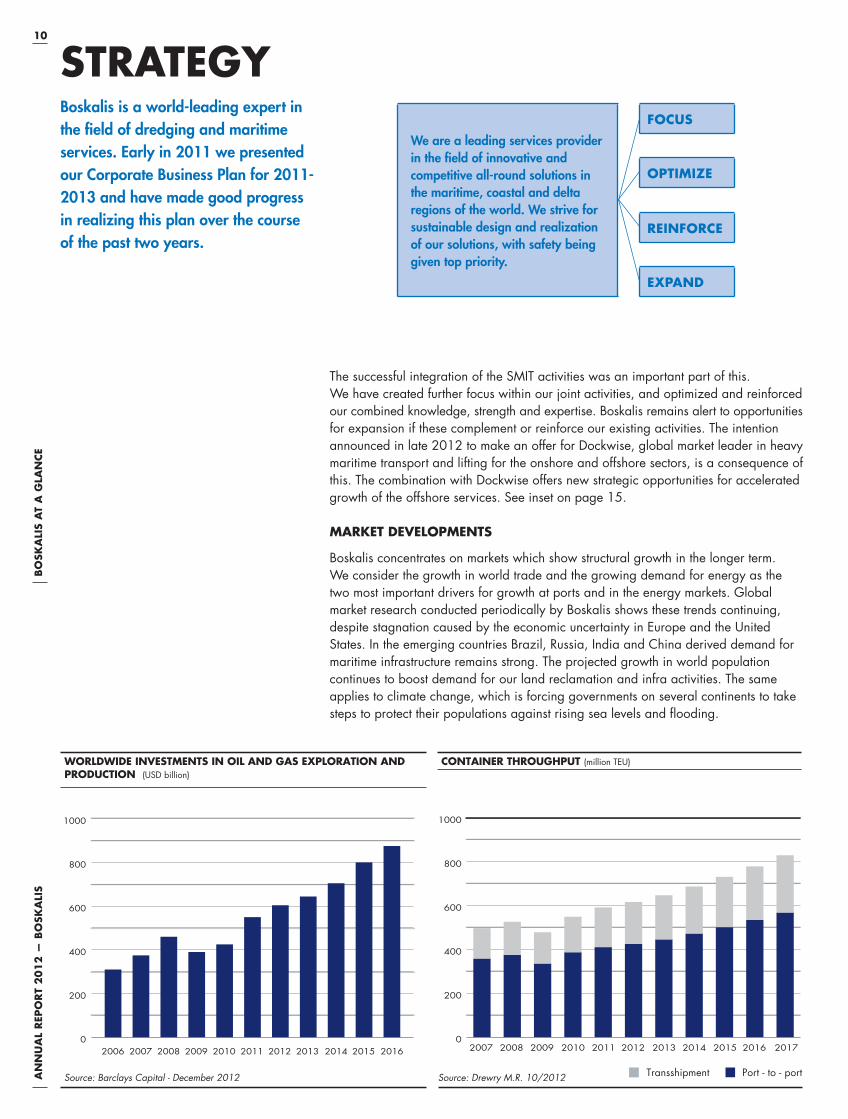
2010
2,674
2011
2,801
2012
3,081
2010
3,248
2011
3,489
2012
4,106
2010 2011 2012
2,617
2,083 2,620 3,436
534* 422*
3,042
3,436
2010 2011 2012
43
3941
19
2527
2010
310.5
2011
254.3
2012
250.2
2010 2011 2012
297 260 286
33
32
28
* one-off (de)consolidation effect(s) Hoppers Cutters
Disposals Net capital expenditure
North and South America
Africa
Middle East
Australia / Asia
Rest of Europe
The Netherlands763
570
484
341
428
495
1,290
481
777
533
Towage & Salvage
Inland Infra
Offshore Energy
Dredging

ANNUAL REPORT 2012
This Annual Report contains forward-looking statements. These statements are
based on current expectations, estimates and projections of Boskalis’ management
and information currently available to the company. These forecasts are not
certain and contain elements of risk that are diffi cult to predict and therefore
Boskalis does not guarantee that its expectations will be realized. Boskalis is under
no obligation to update the statements contained in this Annual Report.
Some of the projects referred to in this report were carried out in cooperation with
other companies.
This is an English translation of the offi cial Annual Report in the Dutch language.
In the event of discrepancies between the two, the Dutch version shall prevail.
1

TABLE OF CONTENTS
4 CHAIRMAN'S STATEMENT
7 BOSKALIS AT A GLANCE
21 REPORT OF THE SUPERVISORY BOARD
31 REPORT OF THE BOARD OF MANAGEMENT
61 FINANCIAL STATEMENTS 2012
121 OTHER INFORMATION
3
4A
NN
UA
L R
EPO
RT
20
12
— B
OSK
ALI
SCH
AIR
MA
N'S
STA
TEM
ENT
CHAIRMAN'SSTATEMENT
ECONOMIC CONDITIONS
Many of us had hoped that 2012 would be the year of revival. That the global
economy, and in particular Europe, would start to recover after the downturn in 2008
and the ailing years that followed. The crisis has unfortunately turned out to be quite
persistent. The euro was close to collapsing and the resulting uncertainty has weighed
heavily on the economy and consumer confi dence.
The Dutch economy continues to be under pressure and belts are being tightened –
also when it comes to investments in infrastructure. We have been seeing this trend
throughout Europe – particularly in Southern European countries. Even the Chinese
growth engine started to show signs of weakness in the course of 2012, something
that had an immediate effect on the prices of raw materials like iron ore, bauxite and
copper. Developments that impact our industry, because they affect the investments of
large mining companies.
All these developments illustrate that the economic conditions did not make it easy for
Boskalis in 2012. Nevertheless we were successful in executing and securing projects.
We have been able to fi ll the order book to a historical record high of EUR 4.1 billion
well-spread across our activities and our core markets.
ENERGY
In 2012 we merged all Offshore energy-related activities in a new Offshore Energy
division offering one compelling proposition to the energy markets.
In Australia we technically concluded the complex and impressive Gorgon project.
Construction of the LNG port of Cuyutlán in Mexico was also completed during the
year. In Brazil we worked hard on the extremely challenging project Superporto do
Açu, a completely new port and supply base for the country’s explosively growing
offshore industry.
Dear shareholders,Despite the challenging market conditions Boskalis had a good year. We realized a 10% revenue increase to a new record high of EUR 3.1 billion. Net profi t came in at EUR 250 million and the order book increased to EUR 4.1 billion. In addition, we successfully completed the integration of SMIT and have further strengthened our fi nancial position. We also made important steps towards the realization of our strategic objectives.
5
AN
NU
AL
REP
OR
T 2
01
2 —
BO
SKA
LIS
Important new projects we contracted in the energy segment
include the Ichthys offshore gas project in Australia, the West of
Duddon Sands wind park in the Irish Sea – an interesting
combination of transport, heavy lift and rock installation activities,
and the replacement of the Shell Bukom pipeline in Singapore
– a combination of dredging and subsea services. In December
we also signed various multi-year contracts worth EUR 100 million
with Maersk relating to subsea services in the North Sea and the
Norwegian Sea, and with Statoil for rock installation activities.
Inaddition, we were awarded various contracts for laying cables
in cooperation with partners.
This past year, Smit Lamnalco really took shape. The merging of
the two organizations is bearing fruit: Smit Lamnalco successfully
acquired a USD 120 million contract in Papua New Guinea and
a USD 200 million contract in Iraq.
PORTS
In 2012 we were busy completing the Maasvlakte 2 project,
the main highlight of which was the closing of the seawall in
the presence of Her Majesty Queen Beatrix. We have made
the Netherlands 2,000 hectares larger and moved the coastline
3.5 km further into the sea. This involved using 240 million m³ of
sand. We were also active in other parts of the world with the
deepening and construction of ports in Bahía Blanca in Argentina,
Mombasa in Kenya and Gävle in Sweden, and were awarded
the contract to widen and deepen the access channel and port of
Mumbai in India.
We can also look back on a good year with regard to our harbour
towage services. In particular in Brazil, Canada and Singapore
we were busy. In addition, we also successfully broadened and
expanded our position in Zeebrugge, Belgium.
DRY INFRASTRUCTURE
In this segment, the acquisition of MNO Vervat was immediately
fruitful in the fi rst year with the A1/A6 project Diemen-Almere
being awarded to the SAAone consortium, which includes
Boskalis/MNO. Our share amounts to EUR 300 million.
The Boskalis Netherlands organization had a very good year
under diffi cult market conditions – both with regard to the
execution and the awarding of new contracts.
Archirodon had a year characterized by a relatively large number
of smaller contracts, often also under diffi cult market conditions.
A large amount of work was awarded in the second half of the
year and the order book is now fi lled for the next two years.
At the end of 2012, we were approached by a party from the
Middle East with regard to a potential sale of our 40% stake in
Archirodon. We are currently in talks about this matter.
SALVAGE
It was also a busy and eventful year for Salvage. At the start of
2012 we successfully removed more than 2,000 tonnes of fuel
from the cruise ship Costa Concordia, which ran aground on the
Italian coast. During the year and across the world ship wrecks
were cleared and assistance was provided to ships in distress.
SAFETY
All projects that we executed and that were contracted are subject
to strict requirements with regard to safety systems and culture.
In projects and tenders we were able to distinguish ourselves with
our safety program NINA (No Injuries No Accidents) that we
successfully continued to implement throughout the organization in
the past year. And it is paying off, because our dredging-related
LTIF rate continued to fall in 2012, from 0.3 to 0.2 lost time
injuries per 200,000 hours worked. Only two years ago, this rate
was 0.7. We would like to extend this very positive development
in the future, and will therefore continue to emphasize that safety
always comes fi rst at all times.
EXPANDING THE COMPANY
Despite being occupied in carrying out and securing new works
and contracts over the past year we also spent a lot of time on
expanding the company within the framework of the Corporate
Business Plan 2011-2013. We concluded the integration with SMIT
this year with the move of the corporate staff and business units to
Papendrecht. In proper consultation with the Works Council that has
now also been integrated, we have harmonized the HR conditions
of the respective 220 SMIT employees.
At the end of the year we decided to take a major step in
strengthening and expanding our company in the offshore energy
sector. On 26 November we announced our intention to make an
offer for Dockwise. With the support of more than 92% of the
shares we presented the offer document to the remaining
shareholders on 8 February. The offer closed just ahead of the
publication of this report, at which point 99% of the shares had
been tendered and therefore effectively completing the acquisition.
Dockwise is the global market leader in heavy dry marine transport.
With a fl eet of 25 semi-submersible vessels, 1,400 employees and
offi ces around the world, Dockwise makes a welcome addition to
our activities, organization and equipment. With the acquisition of
Dockwise we open a new chapter in the expansion of our beautiful
company – a development that opens new windows for growth.
On behalf of the Board of Management I would like to thank all
our colleagues for their efforts. I would also like to thank our
clients, partners and shareholders for putting their trust in us.
Peter Berdowski

SMIT tugs provide assistance to a tanker in the Port of Rotterdam, the Netherlands
7
AN
NU
AL
REP
OR
T 2
01
2 —
BO
SKA
LIS
7
AN
NU
AL
REV
IEW
20
12
— B
OSK
ALI
S
BOSKALIS AT A GLANCE
8 COMPANY PROFILE
9 ACTIVITIES
10 STRATEGY
16 SHAREHOLDER INFORMATION
7
8A
NN
UA
L R
EPO
RT
20
12
— B
OSK
ALI
SB
OSK
ALI
S A
T A
GLA
NCE
In addition to our dredging activities we offer a broad range of maritime services, such
as harbour towage, emergency response and salvage related services, heavy transport
and lifting as well as services for the offshore energy sector.
As a partner we are able to realize complex infrastructural works for our clients within
the chain of design, project management and execution, on time and within budget,
even at vulnerable or remote locations around the world. We strive for sustainable
design and realization of our solutions.
Demand for our services is driven by growing energy consumption, growth in global
trade, growth in world population and climate change. Boskalis operates worldwide
but concentrates on six geographic regions which have the highest growth
expectations for the energy and ports markets. This spread gives us both a solid
foundation and the fl exibility to be able to secure a wide range of projects, as well as
providing excellent prospects for balanced and sustained growth. Our main clients are
oil, gas and power companies, port operators, governments, shipping companies,
international project developers, insurance companies and mining companies.
Boskalis has around 15,600 employees, including our share in associate companies.
The safety of our own employees and those of our subcontractors is paramount.
Boskalis operates a progressive global safety program which is held in high regard in
the industry and by our clients. We operate on behalf of our clients in over 75
countries across six continents. Our versatile fl eet consists of over 1,100 vessels and
equipment. Our head offi ce is based in the Dutch city of Papendrecht.
Royal Boskalis Westminster N.V. shares have been listed on NYSE Euronext Amsterdam
since 1971.
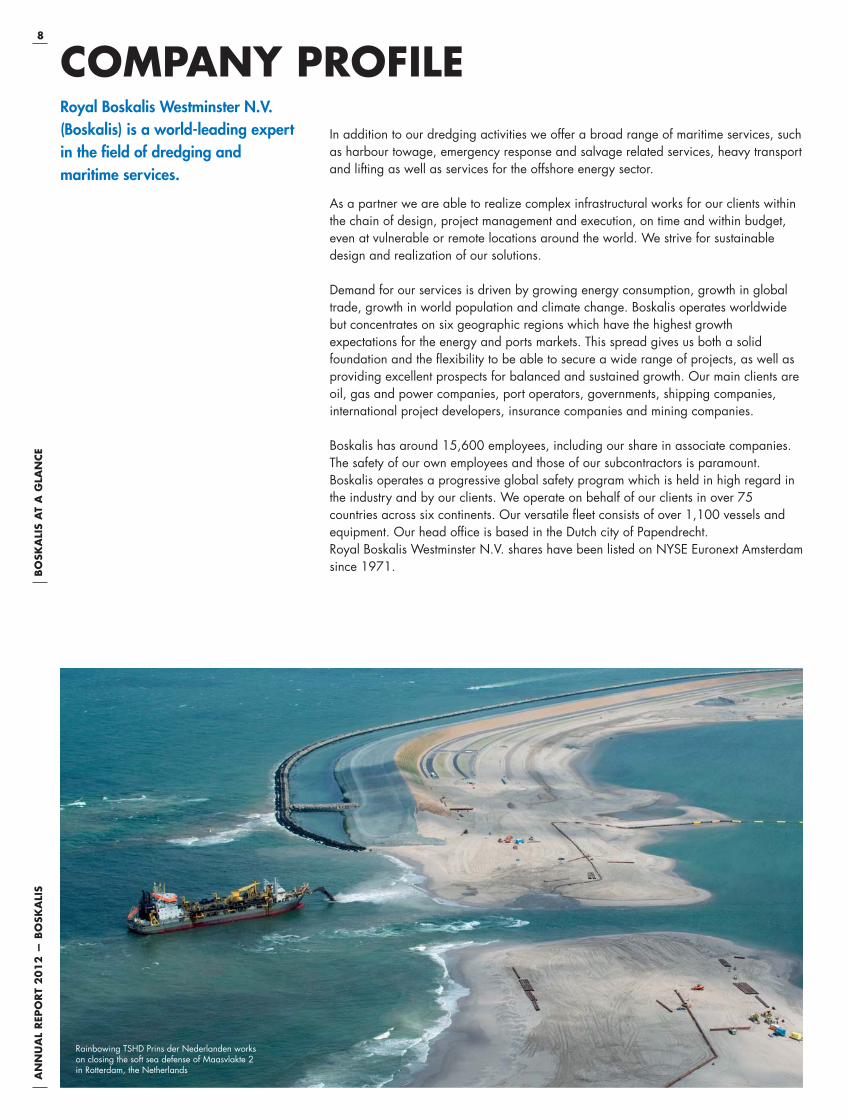
COMPANY PROFILERoyal Boskalis Westminster N.V. (Boskalis) is a world-leading expert in the fi eld of dredging and maritime services.
Rainbowing TSHD Prins der Nederlanden works on closing the soft sea defense of Maasvlakte 2 in Rotterdam, the Netherlands
9
AN
NU
AL
REP
OR
T 2
01
2 —
BO
SKA
LIS
ACTIVITIESDREDGING
Traditionally, dredging is the core activity of Boskalis. It involves
all activities required to remove silt, sand and other layers from
the water bed and in some cases utilizing them elsewhere, for
example for land reclamation. The services we provide also include
the construction and maintenance of ports and waterways, and
coastal defense and riverbank protection, as well as associated
specialist services such as underwater rock fragmentation.
In addition, Boskalis is active in the extraction of raw materials
using dredging techniques. We already apply this onshore, but
are also looking into the possibilities of mining raw materials from
the seabed. Our global spread, high professional standards,
versatile state-of-the-art fl eet and conscious focus on cost effi ciency
have earned us a recognized position as a global market leader
in dredging. We are renowned for our innovative approach and
specialist knowledge of environmentally friendly dredging
techniques. With our great expertise, multidisciplinary approach
and extensive experience in engineering and project management
we have proven time and again that we are able to realize complex
projects on time and within budget, even at diffi cult locations.
OFFSHORE ENERGY
With our offshore services we support the activities of the
international energy sector, including oil and gas companies
and providers of renewable energy such as wind power.
We are involved in the development, construction, maintenance
and decommissioning of oil and LNG-import/export facilities,
offshore platforms, pipelines and cables and offshore wind farms.
In performing these activities Boskalis applies its expertise in the
areas of dredging, offshore pipeline, cable and rock installation,
heavy transport, lift and installation work, as well as diving
and ROV services.
INLAND INFRA
Boskalis also operates as a contractor of dry and maritime
infrastructure projects. In the area of dry infrastructure we are
involved mainly in the Netherlands in the design, preparation
(by means of dry earthmoving) and execution of large-scale
civil infra works, such as the construction of roads and railroads,
bridges, dams, viaducts and tunnels. In doing so, we also perform
specialist works such as soil improvement and land remediation.
Maritime infrastructure projects are conducted through our
strategic partner Archirodon (40% owned), primarily in the Middle
East and North Africa. As a maritime contractor Archirodon has
extensive experience in designing and constructing quay walls,
jetties, breakwaters and oil and LNG terminals. In addition, the
company is an all-rounder in the civil infrastructure and industrial
installations markets, building for example water purifi cation
plants, sewer systems, dams, bridges, power stations, desalination
plants and pumping stations.
TOWAGE
In the world’s biggest ports SMIT Harbour Towage provides
assistance to incoming and outgoing oceangoing vessels. With a
versatile fl eet of over 200 tugs we assist vessels including RoRo
ships, oil and chemical tankers, container ships, reefers and mixed
cargo ships. We operate our tug services in the Netherlands,
Belgium, the United Kingdom, Canada, Brazil, Panama, Australia,
Singapore, Malaysia, Indonesia, Vietnam, China and Taiwan. In
addition, we offer a full range of services for the operation and
management of onshore and offshore terminals through Smit
Lamnalco, which is 50% owned by Boskalis. These include
assistance with the berthing and unberthing of tankers at oil and
LNG terminals and additional support services such as pilotage,
subsea inspection and maintenance, fi refi ghting, and the coupling
and uncoupling of terminal connections.
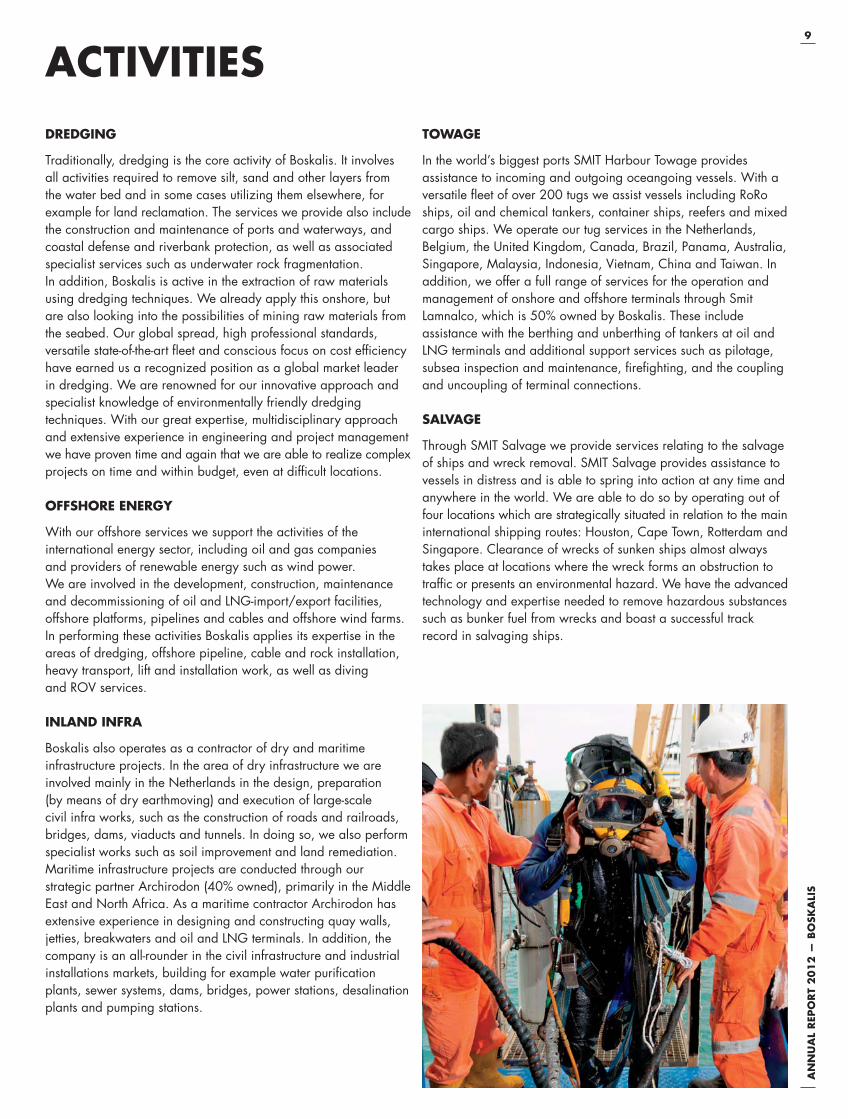
SALVAGE
Through SMIT Salvage we provide services relating to the salvage
of ships and wreck removal. SMIT Salvage provides assistance to
vessels in distress and is able to spring into action at any time and
anywhere in the world. We are able to do so by operating out of
four locations which are strategically situated in relation to the main
international shipping routes: Houston, Cape Town, Rotterdam and
Singapore. Clearance of wrecks of sunken ships almost always
takes place at locations where the wreck forms an obstruction to
traffi c or presents an environmental hazard. We have the advanced
technology and expertise needed to remove hazardous substances
such as bunker fuel from wrecks and boast a successful track
record in salvaging ships.
10A
NN
UA
L R
EPO
RT
20
12
— B
OSK
ALI
SB
OSK
ALI
S A
T A
GLA
NCE
FOCUS
OPTIMIZE
REINFORCE
EXPAND
STRATEGY
The successful integration of the SMIT activities was an important part of this.
We have created further focus within our joint activities, and optimized and reinforced
our combined knowledge, strength and expertise. Boskalis remains alert to opportunities
for expansion if these complement or reinforce our existing activities. The intention
announced in late 2012 to make an offer for Dockwise, global market leader in heavy
maritime transport and lifting for the onshore and offshore sectors, is a consequence of
this. The combination with Dockwise offers new strategic opportunities for accelerated
growth of the offshore services. See inset on page 15.
MARKET DEVELOPMENTS
Boskalis concentrates on markets which show structural growth in the longer term.
We consider the growth in world trade and the growing demand for energy as the
two most important drivers for growth at ports and in the energy markets. Global
market research conducted periodically by Boskalis shows these trends continuing,
despite stagnation caused by the economic uncertainty in Europe and the United
States. In the emerging countries Brazil, Russia, India and China derived demand for
maritime infrastructure remains strong. The projected growth in world population
continues to boost demand for our land reclamation and infra activities. The same
applies to climate change, which is forcing governments on several continents to take
steps to protect their populations against rising sea levels and fl ooding.
Boskalis is a world-leading expert in the fi eld of dredging and maritime services. Early in 2011 we presented our Corporate Business Plan for 2011-2013 and have made good progress in realizing this plan over the course of the past two years.
We are a leading services provider in the fi eld of innovative and competitive all-round solutions in the maritime, coastal and delta regions of the world. We strive for sustainable design and realization of our solutions, with safety being given top priority.
WORLDWIDE INVESTMENTS IN OIL AND GAS EXPLORATION AND PRODUCTION (USD billion)
Source: Barclays Capital - December 2012
CONTAINER THROUGHPUT (million TEU)
Source: Drewry M.R. 10/2012 Transshipment Port - to - port
0
200
400
600
800
1000
2006 2007 2008 2009 2010 2011 2012 2013 2014 2015 2016
0
200
400
600
800
1000
2007 2008 2009 2010 2011 2012 2013 2014 20162015 2017
11
AN
NU
AL
REP
OR
T 2
01
2 —
BO
SKA
LIS
We see the demand for integrated solutions for complete maritime
infrastructures growing, with attention to sustainable solutions
taking an ever more prominent place on the agenda.
STRATEGIC FRAMEWORK Boskalis’ strategic agenda stems from our mission:
We are a leading services provider in the fi eld of innovative and
competitive all-round solutions in the maritime, coastal and delta
regions of the world. We strive for sustainable design and
realization of our solutions, with safety being given top priority.
Our strategy for achieving this mission is focused on growth.
The implementation of our strategy is based on four pillars:
Focus, Optimize, Reinforce and Expand.
FOCUS
On Value-Adding Assets
On market segments
On geographic regions
Value-Adding AssetsBoskalis focuses on Value-Adding Assets through a combination
of activities and equipment which enables us both to operate
cost-effectively at the lower end of the market and to be successful
in the complex turnkey/multidisciplinary integrated projects at
the top end of the market.
Market segmentsThe markets which we target with our core activities are chosen
based on the analysis of where our opportunities for growth and
expansion are greatest. In each of these markets we provide our
products and services both in combination and separately.
Energy
The oil and gas market is very important in terms of both size and
growth potential. Boskalis designs and builds new ports for this
market. For oil and gas companies we create new land, realize
pipeline infrastructures and take care of their maintenance. We also
execute offshore projects for these clients and provide a broad range
of maritime services, including subsea, heavy transport, lift and
installation. Through our associate company Smit Lamnalco we
provide onshore and offshore terminal services. In addition to this
traditional segment, the energy market comprises the strongly
growing sustainable energy segment, where the emphasis for
Boskalis lies on the foundations, construction and cabling of
offshore wind farms. We also see growth potential in the use of
(traditional) dredging solutions for the mining of raw materials.
Ports
For the design and construction of new ports as well as for
the expansion and maintenance of existing ports, on behalf of
governments and port operators, we call into play our main
activities of dredging and earthmoving, with civil engineering
work also playing a major role. At the operating stage we provide
shipping companies and agents in these ports with services such
as harbour towage. In addition, we can be of service to these
same shipping companies and their underwriting agents with our
salvage activities.
Infra
Infra comprises the construction of civil infrastructures and the
defense and creation of new land. Our main clients in this area
are governments and project developers. This market segment
covers both wet and dry activities: land reclamation and coastal
defense, the realization of maritime infrastructures through our
partnership with Archirodon and large civil infrastructure projects
in the Dutch market through our Dutch subsidiary MNO Vervat.
Geographic regionsWithin the three market segments we target our services at a
number of geographic regions. The choice for these regions is
based on our market analysis, which shows where the main
developments are taking place in the coming period and where
the best opportunities lie for our combined activities.
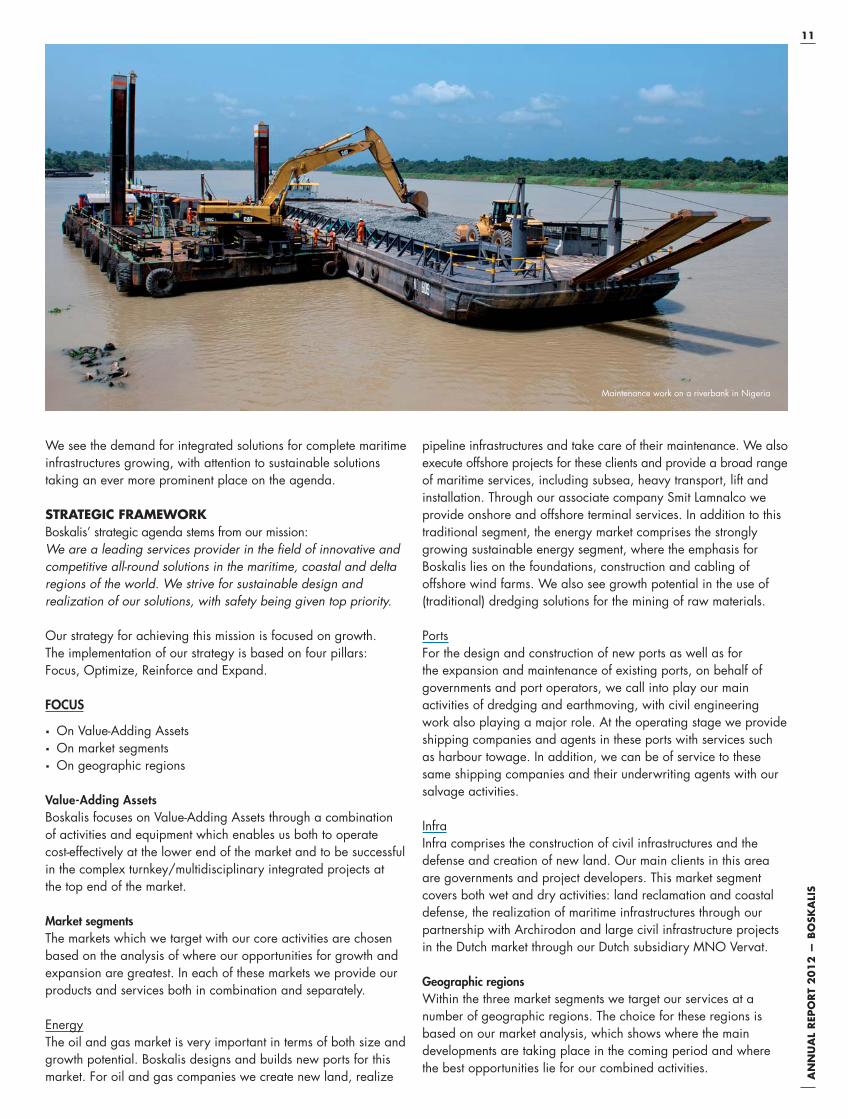
Maintenance work on a riverbank in Nigeria
12A
NN
UA
L R
EPO
RT
20
12
— B
OSK
ALI
SB
OSK
ALI
S A
T A
GLA
NCE
We concentrate our activities on the following six geographic
regions:
1. Northwest Europe
2. South and West Africa
3. Central and South America
4. Middle East
5. Southeast Asia
6. Australia
OPTIMIZE
Expansion of cost leadership
Further integration of activities
Invest in developing competencies
As an expert Boskalis occupies a unique position on the global
maritime market. There is no other company that offers such a broad
and integrated range of maritime products and services. We want
to reinforce and expand this position by fully leveraging the synergy
benefi ts of the combinations within the group. We improve our
chances in the high-end segment by investing in developing
competencies which strengthen our position as a Design, Construct
& Maintenance contractor. At the same time, our focus on effi ciency
improvements and cost savings allows us to remain strongly
competitive.
Cost leadershipThe integration with SMIT has resulted in demonstrable economies
of scale and has increased our purchasing power towards suppliers.
Benchmarking and sharing best practices allowed us to further
reduce costs.
Integration of activitiesOur broader range of products and services and our global
presence create new commercial opportunities with both new and
existing clients. In the business the two organizations are moving
closer together and we are acting in concert in the market. The
combining of the Boskalis and SMIT activities for the offshore oil
and gas sector is a good example of this, offering major synergy
benefi ts. Moreover, our support organization is becoming ever more
effi cient as we further integrate various corporate support activities
and where possible physically accomodate them at one location.
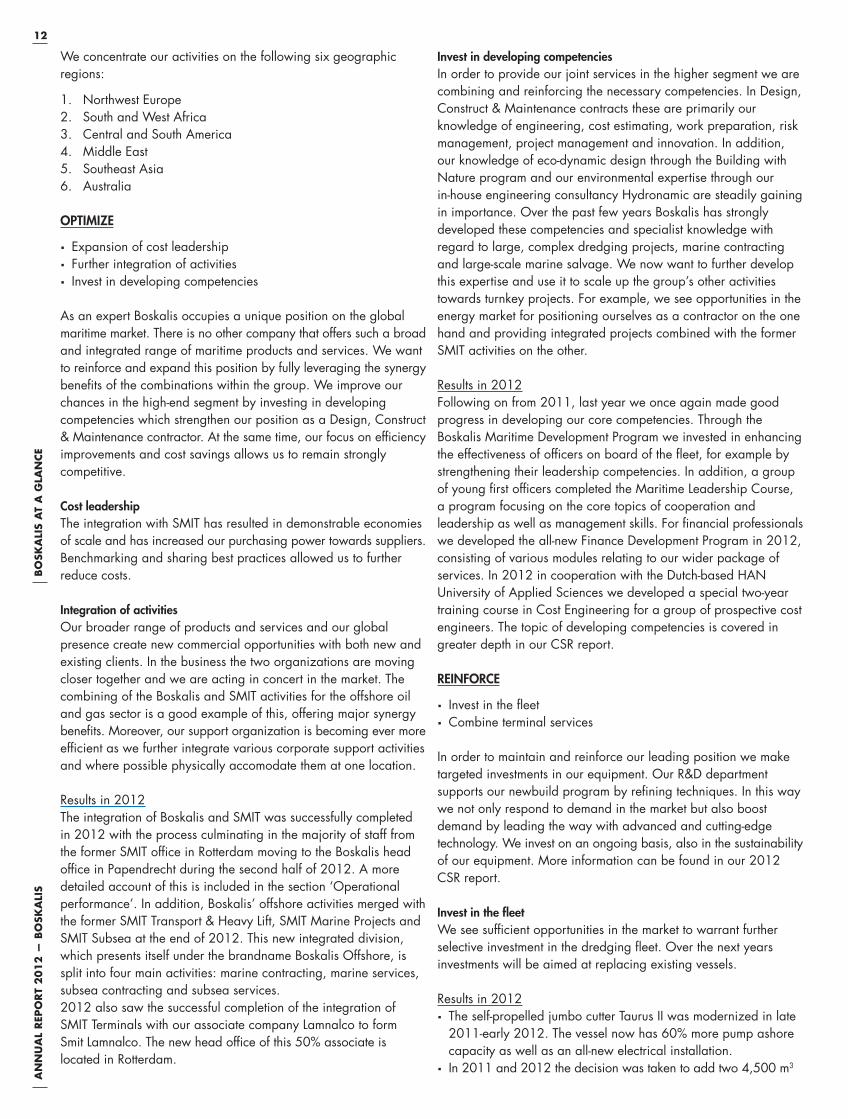
Results in 2012
The integration of Boskalis and SMIT was successfully completed
in 2012 with the process culminating in the majority of staff from
the former SMIT offi ce in Rotterdam moving to the Boskalis head
offi ce in Papendrecht during the second half of 2012. A more
detailed account of this is included in the section ‘Operational
performance’. In addition, Boskalis’ offshore activities merged with
the former SMIT Transport & Heavy Lift, SMIT Marine Projects and
SMIT Subsea at the end of 2012. This new integrated division,
which presents itself under the brandname Boskalis Offshore, is
split into four main activities: marine contracting, marine services,
subsea contracting and subsea services.
2012 also saw the successful completion of the integration of
SMIT Terminals with our associate company Lamnalco to form
Smit Lamnalco. The new head offi ce of this 50% associate is
located in Rotterdam.
Invest in developing competenciesIn order to provide our joint services in the higher segment we are
combining and reinforcing the necessary competencies. In Design,
Construct & Maintenance contracts these are primarily our
knowledge of engineering, cost estimating, work preparation, risk
management, project management and innovation. In addition,
our knowledge of eco-dynamic design through the Building with
Nature program and our environmental expertise through our
in-house engineering consultancy Hydronamic are steadily gaining
in importance. Over the past few years Boskalis has strongly
developed these competencies and specialist knowledge with
regard to large, complex dredging projects, marine contracting
and large-scale marine salvage. We now want to further develop
this expertise and use it to scale up the group’s other activities
towards turnkey projects. For example, we see opportunities in the
energy market for positioning ourselves as a contractor on the one
hand and providing integrated projects combined with the former
SMIT activities on the other.
Results in 2012
Following on from 2011, last year we once again made good
progress in developing our core competencies. Through the
Boskalis Maritime Development Program we invested in enhancing
the effectiveness of offi cers on board of the fl eet, for example by
strengthening their leadership competencies. In addition, a group
of young fi rst offi cers completed the Maritime Leadership Course,
a program focusing on the core topics of cooperation and
leadership as well as management skills. For fi nancial professionals
we developed the all-new Finance Development Program in 2012,
consisting of various modules relating to our wider package of
services. In 2012 in cooperation with the Dutch-based HAN
University of Applied Sciences we developed a special two-year
training course in Cost Engineering for a group of prospective cost
engineers. The topic of developing competencies is covered in
greater depth in our CSR report.
REINFORCE
Invest in the fleet
Combine terminal services
In order to maintain and reinforce our leading position we make
targeted investments in our equipment. Our R&D department
supports our newbuild program by refi ning techniques. In this way
we not only respond to demand in the market but also boost
demand by leading the way with advanced and cutting-edge
technology. We invest on an ongoing basis, also in the sustainability
of our equipment. More information can be found in our 2012
CSR report.
Invest in the fleetWe see suffi cient opportunities in the market to warrant further
selective investment in the dredging fl eet. Over the next years
investments will be aimed at replacing existing vessels.
Results in 2012
The self-propelled jumbo cutter Taurus II was modernized in late
2011-early 2012. The vessel now has 60% more pump ashore
capacity as well as an all-new electrical installation.
In 2011 and 2012 the decision was taken to add two 4,500 m3
13
AN
NU
AL
REP
OR
T 2
01
2 —
BO
SKA
LIS
hoppers, the Causeway and the Strandway, to the fleet. The first
hopper is currently nearing completion and we expect to
commission it in mid-2013. Construction work is underway on
the second vessel, which is expected to be taken into service in
first quarter of 2014.
Following renovation, the megahopper Fairway will be
recommissioned in the second half of 2013. The ship was taken
out of service following a collision in 2007.
In order to increase our chances of securing contracts in the
energy market, both in the oil and gas sector and in offshore wind
parks, we are investing in expanding our fl eet of specialist
equipment and tugboats.
Results in 2012
The fleet was augmented by the Rockpiper, a fallpipe vessel (for
the covering and protection of pipelines and cables) which was
commissioned in the first quarter of 2012. The fallpipe is made
of a lightweight composite material which enhances the vessel’s
efficiency.
To reinforce our cable-laying activities we invested in two
multifunctional cable laying/rock installation vessels, the Ndeavor
and the Ndurance, which will be commissioned in mid-2013,
respectively.
Two nearly new heavy anchor-handling tugs were purchased,
the Union Princess and the Union Sovereign. The ships are
suitable for towage work at sea, positioning and repositioning
anchors and heavy chains as well as for supporting offshore
activities such as performing inspections, repairs and
maintenance work on offshore platforms.
In China construction work on two anchor handlers, the Sentosa
and the Seraya, is nearing completion. The two vessels will be
commissioned in the second quarter of 2013.
In connection with the expansion of our harbour towage activities
in Brazil we placed a local order for six tugboats. The first vessel
was delivered in January 2013, with the remaining tugs set to be
commissioned subsequently at a rate of one every three months.
Two heavier tugboats were purchased to carry out towage
operations in the port of Zeebrugge, Belgium.
For Asian Lift Singapore, a joint venture with Keppel Corporation
Singapore, the Asian Hercules III is currently under construction,
a large floating crane with a lift capacity of 5,000 tonnes.
From the end of 2013, the Asian Hercules III is expected to be
used for heavy lift work associated with the assembly of FPSOs
in Singapore.
In 2012 Smit Lamnalco invested in the construction of 14 ships
for use on existing and new terminal services contracts.
Reinforce terminal services The integration of SMIT Terminals with our associate company
Lamnalco has created a new global leader in terminal services.
Smit Lamnalco, in which Boskalis holds a 50% stake, has a fl eet
of over 190 ships, 50 current terminal contracts on its books
and around 2,200 employees.
Results in 2012
Global leader in terminal services: the sale of the activities of SMIT
Terminals to Lamnalco was effected at the end of 2011. During
2012 we worked on structuring the new organization and getting
the new head offi ce established in Rotterdam. We see further
growth opportunities for Smit Lamnalco in regions such as the
Middle East, West Africa, Russia and Australia, with the primary
focus on the oil and gas market.
EXPAND
Strengthen regional position
Expand regional position
Add global activities
Strengthen regional position using existing activities We want to strengthen our position in the six geographic focus
areas. By leveraging our market presence and strong client
relationships we will be able to offer a wider range of activities.
For example at remote locations, where we are building large-
scale maritime infrastructures, we see opportunities to also offer
terminal services and subsea diving services. We also see good
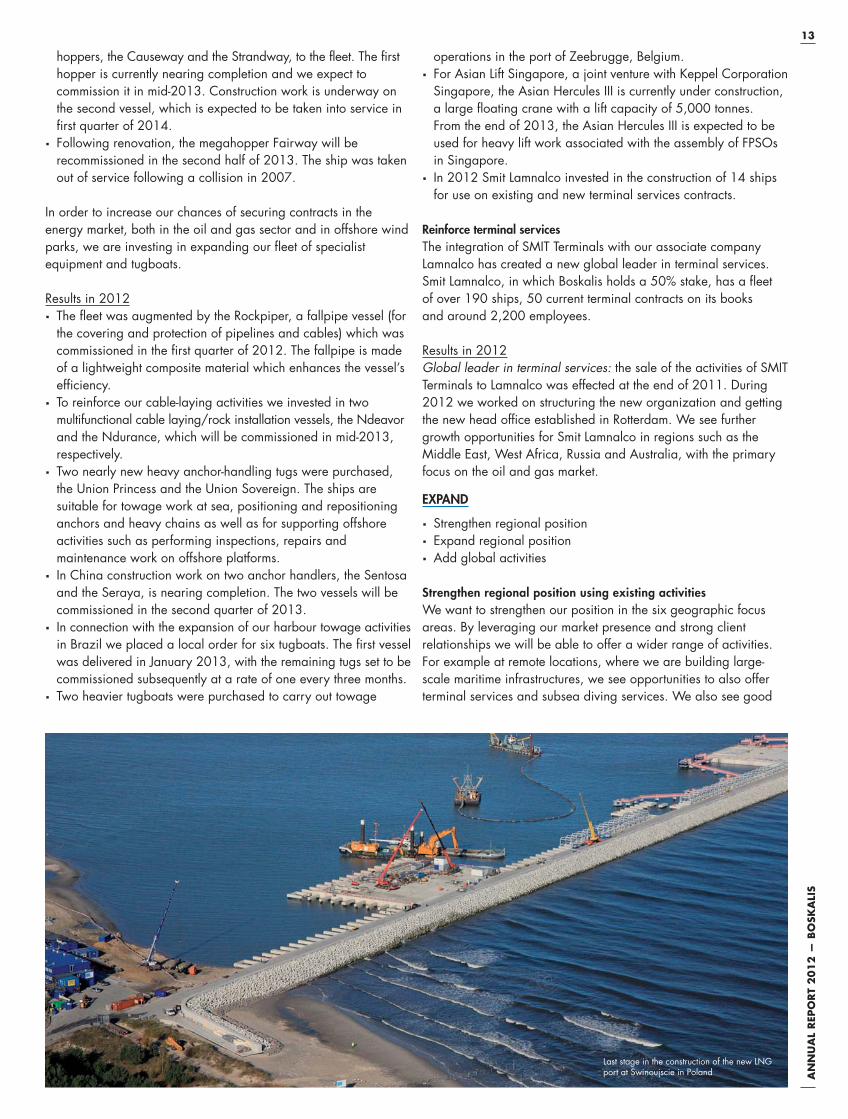
Last stage in the construction of the new LNG port at Swinoujscie in Poland

14A
NN
UA
L R
EPO
RT
20
12
— B
OSK
ALI
SB
OSK
ALI
S A
T A
GLA
NCE
opportunities for developing a broader range of activities in South
America. In West Africa, where we have been successfully
providing dredging and terminal services for many decades,
we see opportunities for expanding our offshore activities in
the area of transport and heavy lift.
Results in 2012
Over the past few years Boskalis has successfully completed
several maritime infrastructure projects in Brazil. In addition, we
are currently constructing a new port, including the revetments at
the entrance of the harbor, in the country’s biggest industrial port
complex, Superporto do Açu. Boskalis also has a strong local
presence as a provider of towage services for ports and terminals,
with SMIT providing these services in six Brazilian ports. In the
Netherlands Boskalis, along with its subsidiary MNO Vervat, has
strengthened its position in the infra market with the acquisition of
the sizeable project for the repositioning, broadening and
maintenance of the Schiphol Airport-Amsterdam-Almere section of
the A1 and A6 motorways. Boskalis has a 30% share in this
DBFM (Design, Build, Finance, Maintain) contract worth in excess
of EUR 1 billion, which it won in consortium with VolkerWessels,
Hochtief and DIF.
Expand regional position with new activities In our focus regions we also see demand arising for new activities
to which we can apply our combined expertise. This demand is
mainly fuelled by the developments in the energy market, with
examples being the construction of offshore wind parks, the
integration of the European gas and electricity markets and the
removal of old oil platforms in the North Sea. We are increasingly
involved in the laying of cabling infrastructures and the dismantling
of oil platforms on a turnkey basis. In addition, the growing demand
for raw materials also presents an opportunity to develop new
activities, such as mineral extraction.
In the area of ordnance clearance Boskalis Hirdes expanded and
reinforced its fi eld of work in Germany with offshore ordnance
clearance, deploying equipment including ROV's. This is done in
close cooperation with Subsea Services, part of the Offshore
Energy division.
We position ourselves as a provider of all-round solutions for
maritime infrastructures, including the realization of maritime civil
constructions. We have already been successfully providing these
activities in the Middle East for many years, through our associate
company Archirodon. We also want to offer this expertise in other
parts of the world, partly through our subsidiary MNO Vervat.
Given their complementarity with the dredging and earthmoving
activities we see opportunities for expanding these activities in
Northwest Europe and eventually also providing them
internationally.
Results in 2012
In 2012 we contracted various projects which enabled us to
strengthen our regional position with new activities.
Onshore and offshore mining: in Suriname we are currently
executing an integrated mining project for the excavation of
bauxite. In New Zealand we have successfully developed a
concept for the deep-sea mining of phosphates. In the next few
years we want to put this concept into practice together with
Chatham Rock Phosphate Ltd, a New Zealand-based company in
which Boskalis has also acquired a stake of nearly 20%.
Offshore energy: in Northwest Europe we expanded our position
with activities for the offshore energy sector. In the Irish Sea we are
constructing a large part of the West of Duddon Sands offshore
wind park for DONG Energy and Scottish Power Renewables.
The work includes the preparation of the seabed and the
transportation and installation of 108 turbine foundations.
In addition, Boskalis is to carry out rock installation work for the
Meerwind offshore wind park under development by WindMW
in the German section of the North Sea. In 2012 Boskalis also
won a contract to carry out inspection, repair and maintenance
work on around 20 offshore oil production platforms and related
infrastructure owned by Maersk Oil in the Danish section of the
North Sea. For this client we will also execute preparatory
activities and construction work on oil production platforms in the
same part of the North Sea. In addition, Boskalis will execute
various rock installation works at a depth of up to 600 meters for
for Statoil in the North Sea and Norwegian Sea until the end of
2015. In Asia we have been awarded a contract to perform
transport, installation and dredging work on behalf of Shell
Eastern Petroleum Ltd. The work relates to the partial replacement
of a Single Point Mooring subsea pipeline in Singapore.
Add global activities Boskalis wants to strengthen its leading position in existing
activities at a regional and global level through organic growth
and/or acquisitions. We are also open to acquisitions which allow
us to add promising activities to our portfolio. However, we will
only do this provided they are a good fi t with the existing activities
in a number of key aspects and add value in the top segment of
the market.
Results in 2012
In late November 2012 we announced our intention to launch an
offer for the shares of the stock listed company Dockwise and in
the days following the announcement acquired 33% of the shares
on the market. Combining our strengths will enable us to offer
customers across the world unique added value with regard to
the transportation and installation of equipment, such as offshore
platforms and FPSOs. See inset on the next page.

15
AN
NU
AL
REP
OR
T 2
01
2 —
BO
SKA
LIS
DOCKWISE
On 26 November 2012 Boskalis announced its intention to
launch an offer for Dockwise, which provides maritime services
including transport services to the offshore and onshore industries
and installation of extremely heavy offshore platforms.
The combination of the two companies offers new strategic
opportunities for accelerated growth of our offshore services.
The addition of the Dockwise activities creates a service
provider with a broad range of services for clients in the oil and
gas sector. The new combination will be even better able to
cater to its clients worldwide under increasingly complex
circumstances with optimum deployment of personnel and
equipment. In addition, combining the Dockwise fl eet with
Boskalis’ project management experience and engineering
knowledge allows for accelerated realization of our strategic
ambition of being able to execute Transport & Installation (T&I)
projects. We also see possibilities for the wider deployment of
Dockwise vessels within the group, for example on dredging,
offshore and salvage projects. Dockwise employs over 1,400
people and has a fl eet of 25 specially built semi-submersible
vessels at its disposal.

16A
NN
UA
L R
EPO
RT
20
12
— B
OSK
ALI
SB
OSK
ALI
S A
T A
GLA
NCE
OPEN DIALOG
Transparent and regular communication with our stakeholders is something we value
highly. We consider our fi nancial stakeholders to include existing and potential
shareholders, other investors and their brokers as well as the media. It is important to
us to provide them with clear and accessible information. The Boskalis share is
covered by the major Dutch brokers as well as a number of foreign brokers and their
analysts, whom we also consider as belonging to our fi nancial stakeholders. They
want to provide their clients with good advice and information about our company,
the dredging and maritime services markets and general developments in our markets.
Questions from stakeholders are answered candidly; wherever possible we take the
initiative when it comes to raising important issues. For example following an
important announcement we proactively contact shareholders by phone, as we did
last year in connection with the proposed offer for Dockwise. We maintain regular
contact with major investors and analysts, for example by organizing annual visits to
project sites. In 2012 we held approximately 300 meetings with investors from
Western Europe, the United States, Australia and Canada, both during roadshows
and conferences and in one-on-ones. Meetings with investors and analysts are held
using publicly available presentations (www.boskalis.com) and stock price-sensitive
information is never shared.
SHAREHOLDER INFORMATIONIt is important to us that the value of our share adequately refl ects our performance and the development in our markets. We therefore strive to inform our stakeholders as completely and transparently as possible about our strategy and policy and the ensuing fi nancial performance.
Construction of the Gorgon LNG port in Australia, completed in 2012
17
AN
NU
AL
REP
OR
T 2
01
2 —
BO
SKA
LIS
CORPORATE WEBSITE
Our corporate website provides a constantly updated source
of information about our core activities and ongoing projects.
The Investor Relations section offers share information and other
information relevant to shareholders, as well as the latest and
archived press releases and analyst and company presentations.
SHARE INFORMATION
Boskalis’ authorized share capital of EUR 240 million is divided
into 200 million shares, comprising 150 million ordinary shares
and 50 million cumulative protective preference shares. The issued
capital as at 1 January 2012 consisted of 103.5 million ordinary
shares. Seventy per cent (70%) of shareholders opted to have their
2011 dividend distributed in the form of a stock dividend, in light
of which we issued over 3.8 million new shares in 2012.
On balance, the issued share capital as at 31 December 2012
consisted of 107.3 million ordinary shares.
Royal Boskalis Westminster N.V. shares are listed on NYSE Euronext
Amsterdam. Indices of which the share is a component include the
Euronext Next 150 index and the Dow Jones STOXX 600 Index.
Tickers: Bloomberg: BOKA:NA, Reuters: BOSN.AS
In 2012, around 85 million Boskalis shares were traded on NYSE
Euronext Amsterdam (2011: 100 million). The average daily trading
volume in 2012 was over 330,000 shares. In the course of 2012
the share price rose by 20% from EUR 28.31 to EUR 34.00.
The market capitalization increased by 24% compared to the end
of 2011 to EUR 3.65 billion.
SHAREHOLDERS
The following shareholders are known to have been holders of at
least 5% in Boskalis as at 31 December 2012:
HAL Investments B.V.: 33.88%
Mondrian Investment Partners Limited: 5.18%
Sprucegrove Investment Management Limited: 5.18%
Besides these large shareholders, an estimated 14% of the shares
are held by shareholders in the United States and Canada, 16%
in the United Kingdom, 13% in the Netherlands and the remainder
in mainly France, Germany and Scandinavia.
DIVIDEND POLICY
The main principle underlying the Boskalis dividend policy is to
distribute 40% to 50% of the net profi t from ordinary operations
as dividend. At the same time Boskalis aims to achieve a stable
development of the dividend in the longer term. The choice of
dividend (in cash and/or entirely or partly in shares) takes into
account both the company’s desired balance sheet structure and
the interests of shareholders.
FINANCIAL AGENDA 2013
14 March Publication of 2012 annual results
8 May Trading update on fi rst quarter of 2013
8 May Annual General Meeting of Shareholders
10 May Ex-dividend date
14 May Record date for dividend entitlement (after
market close)
27 May Final date for stating of dividend preference
30 May Determination and publication of conversion rate
for dividend based on the average share price
on 28 and 29 and 30 May (after market close)
4 June Date of dividend payment and delivery of shares
15 August Publication of 2013 half-year results
15 November Trading update on third quarter of 2013
SHARE ISSUE
On 10 January 2013 Boskalis successfully placed a EUR 320 million
share issue at a price of EUR 33.00 per share amid very strong
interest. The proceeds of the issue, which was given the green light
by an Extraordinary General Meeting of Shareholders held earlier
that day, will be used towards partly fi nancing the acquisition of
Dockwise Ltd. A total of 4,896,180 new ordinary shares were
placed with institutional investors at home and abroad by means
of an accelerated bookbuild (ABB) offering. Another 4,800,789
shares were placed with HAL Investments B.V. and Project Holland
Fund by means of a private placement. Following the share issue
the stake held by HAL Investments remains unchanged at 33.88%.
After completion of the ABB offering and the private placement
Boskalis’ total number of outstanding shares equals 116,980,648.
18A
NN
UA
L R
EPO
RT
20
12
— B
OSK
ALI
S18A
NN
UA
L R
EVIE
W 2
01
2—
BO
SKA
LIS
WORKING ON SAFETY BY MAKING ROOM FOR RIVERS

19
AN
NU
AL
REP
OR
T 2
01
2 —
BO
SKA
LIS
CA
SE
Rivers in the Netherlands are having to deal with growing amounts of rain
and meltwater, which led to fl ooding in 1993 and 1995. The Dutch
government’s Room for the River program is designed to provide more space
for the IJssel, Rhine, Lek and Waal rivers in over 30 places. The extra space
lowers the water level and thus provides 4 million Dutch people with better
protection against fl ooding. Boskalis has been contracted by Rijkswaterstaat,
the executive arm of the Dutch Ministry of Infrastructure and the Environment,
to participate in several of these projects.
Expanding the rivers rather than raising the dikes marks a turning point in
the approach to fl ood protection. Rijkswaterstaat has opted for various
solutions, including widening the fl ood plains, building dams and lowering
groins. A unique aspect is the combination of fl ood protection and area
development: the river expansion is seen as an opportunity to enhance the
spatial quality of the river area, through urban and landscape embellishment
and more recreational facilities.
One of the projects Boskalis is working on is the broadening of the river
IJssel, which is being widened in eight places. “Digging ditches in the fl ood
plains over a distance of 10 kilometers near the city of Deventer will allow
more water to drain off,” explained project leader Gerrit Jan van den
Bosch. “Connecting up the groundfl ows is one of the big challenges in this
project, which involves moving a total of 2.7 million cubic meters of soil,
sand and clay. We are aiming to reuse this as effectively as possible; some
of it will be transported to the town of Urk, where it will be used to build a
1,100 meter breakwater in the IJsselmeer lake, and some will be used to
build mounds.”
Work is also underway to adapt four fl ood plains along the Lower Rhine.
Here Rijkswaterstaat has contracted Boskalis as head of integrated project
management, including environment management. Building support is
crucial to the smooth progress of infrastructure projects. Boskalis was chosen
to lead the project because “We had already built up lots of contacts and
relationships with stakeholders here, we didn’t want to just throw these
overboard when we handed over control,” explained Marita Cals,
environment manager at Rijkswaterstaat. A measurable benchmark for
support is the number of opinions submitted and especially whether people
lodge objections and appeals with the Council of State. These have a direct
impact on the execution timetable. “Boskalis has continued the dialog with
groups of government offi cials, administrators and local residents,”
continued Cals. “Very hands-on and with a great deal of personal contact.
The clarity that they have conveyed right from the start has been greatly
appreciated by all those involved.”

20A
NN
UA
L R
EPO
RT
20
12
— B
OSK
ALI
SR
EPO
RT
OF
THE
SUPER
VIS
ORY
BO
AR
D20A
NN
UA
L R
EVIE
W 2
01
2 —
BO
SKA
LIS
REP
OR
T O
F TH
E SU
PER
VIS
ORY
BO
AR
D
Work on pipeline for the construction of artifi cial island off Punta Pacifi ca in Panama

21
AN
NU
AL
REP
OR
T 2
01
2 —
BO
SKA
LIS
21
AN
NU
AL
REV
IEW
20
12
— B
OSK
ALI
S
REPORT OF THE SUPERVISORY BOARD
21
22A
NN
UA
L R
EPO
RT
20
12
— B
OSK
ALI
SR
EPO
RT
OF
THE
SUPER
VIS
ORY
BO
AR
D
In accordance with Article 27 of the Articles of Association of Royal Boskalis
Westminster N.V., the Supervisory Board presents the 2012 annual report to the
Annual General Meeting of Shareholders. The annual report, including the fi nancial
statements and the management statement, was drawn up by the Board of Management.
The fi nancial statements are accompanied by the report of the company’s external
auditor KPMG Accountants N.V., which is included on page 118 of this report.
We recommend the following to the Annual General Meeting of Shareholders:
The adoption of the financial statements, including the proposed profit appropriation;
The discharge of the members of the Board of Management in respect of their
management activities during 2012;
The discharge of the members of the Supervisory Board for their supervision of
management during 2012; and
The distribution to shareholders of a dividend of EUR 1.24 per ordinary share to be
paid in ordinary shares, unless the shareholder opts for a cash dividend.
COMPOSITION OF THE BOARD OF MANAGEMENT
At the start of the 2012 reporting year the Board of Management consisted of three
members. On 10 May 2012 the Supervisory Board appointed Mr. F.A. Verhoeven to
the Board of Management for a period of three years. There were no other changes
to the composition of the Board of Management during the year under review.
COMPOSITION OF THE SUPERVISORY BOARD
In 2012 the Supervisory Board consisted of six members.
Op 10 May 2012 the Annual General Meeting considered the re-appointment of Mr.
M. Kramer, on the recommendation of the Supervisory Board. Supported by the Works
Council, the Annual General Meeting re-appointed Mr. Kramer to the Supervisory Board
for a period of four years.
There were no other changes to the composition of the Supervisory Board during
the year under review.
The Supervisory Board wishes to express its appreciation of the efforts shown by the Board of Management and all employees in the strategic development of the company and extends its compliments for the results achieved in 2012.
REPORT OF THE SUPERVISORY BOARD
23
AN
NU
AL
REP
OR
T 2
01
2 —
BO
SKA
LIS
ACTIVITIES OF THE SUPERVISORY BOARD
The Supervisory Board held six meetings with the Board of
Management of the company. The attendance rate at the fi ve
regular meetings of the Supervisory Board was 100%. In view of
a potential confl ict of interest Mr. Van Wiechen did not take part
in the meeting concerning the offer for Dockwise Ltd., nor in those
parts of the regular meetings dealing with this topic. Mr. Van
Wiechen is director of HAL Investments B.V., the principal
shareholder in Boskalis and Dockwise Ltd., and a non-executive
director of Dockwise Ltd. The Supervisory Board also met several
times without the Board of Management being present.
Permanent items on the agenda of the Supervisory Board are: the
development of the results, the balance sheet, and industry and
market developments. With regard to with the market developments,
the order book and potential large projects as well as the status of
material projects contracted are discussed. During the year under
review subjects discussed included the contracting of large projects
such as JNPT in the port of Mumbai in India, the A1/A6 road-
building project and the offshore project for Ichthys in Australia,
as well as the execution of projects such as Maasvlakte 2 in the
Netherlands, Gorgon in Australia and the removal of oil from
the cruise liner Costa Concordia.
Other topics under scrutiny in 2012 included the corporate budget,
liquidity, acquisition and investment proposals, the organizational
structure and the staffi ng policies. Special attention was paid to
the company’s policy on safety, health and the environment, with
extensive discussion of the company’s safety program, NINA (No
Injuries No Accidents), and how this program is being implemented
within the organization and with subcontractors. The Board also
discussed the revised Statement of General Business Principles and
the new Supplier Code of Conduct as well as the company’s
compliance with the newly effective UK Bribery Act.
The Supervisory Board examined the company’s strategy and
the risks associated with it. In this context the Supervisory Board
assessed the development of the strategy against the Corporate
Business Plan for the years 2011-2013. Another regular topic of
discussion concerned the principal risks inherent to the
management of the company, such as the risks associated with
contracting. Further information about this can be found on pages
47 to 51 of this report. The Audit Committee regularly assessed
the structure and operation of the associated internal risk
management and control systems and discussed these with the
Supervisory Board. No signifi cant changes were made to the
internal risk management and control systems during the year
under review. The meetings to discuss the annual and semi-annual
results were held in the presence of the external auditor.
In 2012 the Supervisory Board gave extensive consideration to
the Board of Management’s proposals for the intended acquisition
of Dockwise Ltd. The Supervisory Board approved the issuing of
an offer subject to the customary conditions after determining that
such would be consistent with the company’s strategy and will
deliver the desired further expansion and reinforcement of the
company’s position as a maritime services provider, in particular
SMIT tugs provide assistance to a tanker in the Port of Rotterdam, the Netherlands
24A
NN
UA
L R
EPO
RT
20
12
— B
OSK
ALI
SR
EPO
RT
OF
THE
SUPER
VIS
ORY
BO
AR
D
in the offshore energy market. The Supervisory Board also devoted
attention to the potential divestment of the company’s 40 per cent
stake in Archirodon.
During the year under review the Supervisory Board paid a working
visit to Brazil. During this visit the Supervisory Board familiarized
itself with the hydraulic engineering activities being performed in
that country at the OSX project in the port of Campos, as well as
the port and terminal towage services provided by the subsidiary
SMIT Brasil. Furthermore, extensive attention was paid to the
market trends and possible new projects in Brazil in the area of
marine infrastructure and maritime services development.
Two members of the Supervisory Board followed an introduction
program at SMIT in order to become better acquainted with
the company.
A number of Supervisory Board members met with the Works
Council to discuss the results, the corporate strategy, the market
developments, the current situation in relation to the pension funds
as well as the effects of the merger and integration with Smit
Internationale N.V.
The Supervisory Board has instituted three core committees – the
Audit Committee, the Remuneration Committee and the Selection
and Appointment Committee. They performed their tasks as follows:
AUDIT COMMITTEE
Members of the Audit CommitteeThe Audit Committee consists of two members: Mr. M. Niggebrugge
(chairman) and Mr. J. van Wiechen.
Duties and responsibilities of the Audit Committee The main duties of the Audit Committee are to advise the
Supervisory Board on:
Supervising and monitoring, and advising the Board of
Management concerning, the operation of the internal risk
management and control systems, including the supervision of
compliance with the relevant legislation and regulations, and
supervision of the operation of the codes of conduct.
Supervising the provision of financial information by the
company, its tax planning, the application of information,
communication and communication technology, and the
financing of the company.
Maintaining regular contacts with the external auditor and
supervising the relationship with the external auditor as well as
the compliance with and implementation of the external auditor’s
recommendations.
Nominating an external auditor for appointment by the General
Meeting of Shareholders.
The financial statements, the annual budget and significant
capital investments by the company.
Supervising the functioning of the internal audit function.
Activities during 2012 The Audit Committee met on three occasions during 2012,
with both members as well as Mr. Hessels always being present.
Regular topics discussed during these meetings included: the 2011
fi nancial statements, the (interim) fi nancial reporting for the 2012
fi nancial year, the introduction of a new grouping of the segmented
fi nancial information, the results relating to large projects,
developments in IFRS, in particular those relating to joint venture
accounting, risk management and cost control, developments in the
order book, the fi nancing and liquidity of the company. Other topics
of discussion included the impact of the situation on the fi nancial
markets, insurance matters, the company’s tax position, the internal
control procedures and administrative organization, the relevant
legislation and regulations and the Corporate Governance Code.
Another regular item was the new Dutch legislation governing the
rotation of the external auditor. The follow-up of the Management
Letter issued by the auditor as part of the audit of the 2011
fi nancial statements was also discussed.
In addition, the Audit Committee focused more specifi cally on
the integration of MNO Vervat B.V., acquired at the end of 2011,
and the effects of the transfer of the SMIT Terminals and AHTS
transport activities to the joint venture Smit Lamnalco, in which
Boskalis holds a 50% stake. Extra attention was also paid to the
integration of the accounting and reporting processes and systems
at Boskalis and SMIT in the context of the takeover. The Audit
Committee also discussed at length the development of the fi nancial
position of the pension funds with which Boskalis is involved.
Together with the internal auditor the Audit Committee discussed
the activities performed by the internal auditor during 2012 as
well as the internal Audit Plan for 2013.
In addition to the chairman of the Board of Management and
the Chief Financial Offi cer, the Group Controller and the external
auditor were also present at the meetings of the Audit Committee.
During the year under review meetings were also held with the
external auditor without the company’s Board of Management
being present. The Audit Committee discussed the audit fees and
the audit approach with the external auditor. The Audit Committee
also established the independence of the external auditor. The
evaluation of KPMG’s functioning as external auditor was completed
and discussed, with the outcome being that KPMG’s functioning as
independent auditor is deemed satisfactory. KPMG delivers
high-quality work, based on thorough risk analyses, an effective
approach to control and a good knowledge of the business and
international context in which Boskalis operates. It performs its
activities with a high degree of expertise and professionalism.
It maintains good relationships with the Supervisory Board, Audit
Committee and Board of Management, with due preservation of
its independence. Given the further international expansion of
Boskalis the further permanent strengthening of the management
with regard to the use of international KPMG offi ces is of
importance. Another permanent point for attention is ensuring that
the core team at KPMG retains suffi cient experience with and
knowledge of the Boskalis control environment.
Reports and fi ndings of the meetings of the Audit Committee were
presented to the entire Supervisory Board.

25
AN
NU
AL
REP
OR
T 2
01
2 —
BO
SKA
LIS
REMUNERATION COMMITTEE
Members of the Remuneration CommitteeThe Remuneration Committee consists of two members: Mr. C. van
Woudenberg (chairman) and Mr. M.P. Kramer.
The Remuneration Committee regularly avails itself of the services of
an independent remuneration adviser selected by the Supervisory
Board, and ascertained that this remuneration adviser does not
provide advice to the members of the Board of Management.
Duties and responsibilities of the Remuneration Committee The Remuneration Committee performs the following duties:
Submitting proposals to the Supervisory Board concerning the
remuneration policy to be pursued for the members of the Board
of Management. The policy is submitted to the General Meeting
of Shareholders for approval.
Investigating whether the agreed remuneration policy is still up
to date and if necessary proposing policy amendments.
Submitting proposals to the Supervisory Board concerning the
remuneration of individual members of the Board of
Management (in accordance with the remuneration policy
adopted by the General Meeting of Shareholders).
Preparing the remuneration report on the remuneration policy
pursued, subject to adoption by the Supervisory Board.
Activities during 2012The Remuneration Committee met on two occasions during 2012,
with both members attending all the meetings. In addition the
committee also held regular consultations outside these meetings.
Reports and findings of the meetings of the Remuneration
Committee were presented to the entire Supervisory Board.
Remuneration policy for the Board of ManagementThe remuneration policy for the Board of Management was
adopted by the Extraordinary General Meeting of Shareholders
on 21 January 2011. The remuneration policy is consistent with
the strategy and core values of Boskalis, which are centered on
long-term orientation and continuity, and take into account the
interests of Boskalis’ shareholders, clients, employees as well as
the ‘wider environment’. Throughout 2012 the remuneration policy
was executed in accordance with the remuneration policy as
adopted by the General Meeting of Shareholders. The full text of
the remuneration policy as well as the remuneration report can be
found on the website (www.boskalis.com).
Remuneration policy for the Supervisory BoardThe remuneration policy for the Supervisory Board was adopted
by the General Meeting of Shareholders on 10 May 2012. From
1 July 2012 the remuneration policy was executed in accordance
with the remuneration policy as adopted in May.
SELECTION AND APPOINTMENT COMMITTEE
Members of the Selection and Appointment CommitteeThe Selection and Appointment Committee consists of two members:
Mr. J.M. Hessels (chairman) and Mr. C. van Woudenberg.
Duties and responsibilities of the Selection and Appointment CommitteeThe duties of the Selection and Appointment Committee concern
the following matters:
Drawing up selection criteria and appointment procedures with
respect to members of the Supervisory Board and members of
the Board of Management of the company.
Conducting a periodic assessment of the size and composition
of the Supervisory Board and the Board of Management and
drawing up the profile.
Conducting a periodic assessment of the functioning of
individual members of the Supervisory Board and Board of
Management and reporting thereon to the Supervisory Board.
Proposing appointments and re-appointments.
Supervising the policy of the Board of Management with respect
to selection criteria and appointment procedures for the senior
management of the company.
Activities during 2012In 2012 the Selection and Appointment Committee met on one
occasion, with both members attending. In addition, the committee
also consulted by telephone. During the year under review, the
Selection and Appointment Committee discussed a balanced
composition of the Board of Management, diversity, and the
composition and size of the Supervisory Board, bearing in mind
the Board’s profi le and retirement rota. In addition the Selection and
Appointment Committee discussed the implications of the Dutch Act
on Management and Supervision in preparation of this act coming
into force. The committee has put forward a proposal to amend
the Supervisory Board profi le in order to incorporate the aim to
arrive at a balanced distribution of seats on the Supervisory Board
between men and women. In addition, the Selection and
Appointment Committee analyzed the criteria for the new
restrictions on supervisory roles at large public and private limited
companies and foundations, and the implications this will have for
future appointments and re-appointments.
According to the Supervisory Board retirement rota, the term of
offi ce of Mr. Kramer ended in 2012. The Supervisory Board
simultaneously informed both the shareholders and the Works
Council of the resulting vacancy. Mr. Kramer let it be known that he
was available for re-appointment. The Supervisory Board proposed
to the General Meeting of Shareholders that Mr. Kramer be
re-appointed to the Supervisory Board. The proposal to re-appoint
rested on the fact that Mr. Kramer has extensive experience as a
member of the Supervisory Board and puts this membership into
practice with great expertise. The recommendation to re-appoint
Mr. Kramer was in accordance with the law and the Company’s
Articles of Association. The recommendation to re-appoint
Mr. Kramer had the full support of the Works Council. On 10 May
2012, the General Meeting of Shareholders re-appointed
Mr. Kramer for a period of four years.
Furthermore, the Selection and Appointment Committee discussed
the appointment of Mr. F.A. Verhoeven as a member of the Board
of Management. The Supervisory Board adopted the proposal for
his appointment and, having sought the opinion of the General
Meeting of Shareholders, on 10 May 2012 appointed Mr. Verhoeven
to the Board of Management for a period of three years.

26A
NN
UA
L R
EPO
RT
20
12
— B
OSK
ALI
SR
EPO
RT
OF
THE
SUPER
VIS
ORY
BO
AR
D
Reports and findings of the meetings of the Selection and
Appointment Committee were presented to the entire Supervisory
Board.
DUTCH CORPORATE GOVERNANCE CODE
Since the introduction of the Dutch Corporate Governance Code
(the ‘Code’) in 2004, the principles of proper corporate governance
and best practice provisions set out in the Code have regularly
been discussed at Supervisory Board meetings. The principal
points of the Boskalis Corporate Governance policy can be found
on pages 54 and 55 of this annual report.
In the opinion of the Supervisory Board, the provisions of the Code
regarding the independence of the members of the Supervisory
Board have been complied with. The Supervisory Board considers
Mr. van Wiechen not to be independent in the sense of the Code.
Outside the presence of the board members, the Supervisory Board
discussed the performance of the Board of Management and its
individual members. It also discussed the performance of the
Supervisory Board, the chairman of the Supervisory Board, the three
committees and the individual members of the Supervisory Board
as compared to the profi le. This evaluation took place with the aid
of a questionnaire as well as through collective and bilateral
discussions of the Supervisory Board, the chairman of the
Supervisory Board and the individual members of the Board of
Management.
The Supervisory Board wishes to express its appreciation of the
efforts shown by the Board of Management and all employees in the
strategic development of the company and extends its compliments
for the results achieved in 2012.
Papendrecht / Sliedrecht, 13 March 2013
Supervisory Board
Mr. J.M. Hessels, chairman
Mr. H.J. Hazewinkel, deputy chairman
Mr. M.P. Kramer
Mr. M. Niggebrugge
Mr. J. van Wiechen
Mr. C. van Woudenberg

27
AN
NU
AL
REP
OR
T 2
01
2 —
BO
SKA
LIS
27
AN
NU
AL
REV
IEW
20
12
— B
OSK
ALI
S
Floating sheerlegs Taklift 7 dismantles an old drilling rig in the North Sea
28A
NN
UA
L R
EPO
RT
20
12
— B
OSK
ALI
S28A
NN
UA
L R
EVIE
W 2
01
2—
BO
SKA
LIS
WEST OF DUDDON SANDS: OPTIMUM SYNERGY
Preparing the transportation of transition pieces for wind turbines

29
AN
NU
AL
REP
OR
T 2
01
2 —
BO
SKA
LIS
CA
SE
Since the end of 2012 we have been presenting ourselves as a global
expert in the fi eld of offshore projects and services under the name of
Boskalis Offshore. A clear profi le towards the market and a perfect example
of optimum synergy, with activities which were previously marketed under
the name of both Boskalis and SMIT now being provided jointly under a
single name. “The activities of the integrated Boskalis Offshore comprise
both projects (contracting) and services. In addition we work both above
(marine) and below (subsea) the water surface. We now approach the
market with four core activities: marine contracting, marine services, subsea
contracting and subsea services,” said Wim Vogelaar, business unit
manager of Marine Contracting & Marine Services.
The construction of the West of Duddon Sands offshore wind farm in the Irish
Sea is just one example of optimum synergy resulting from the integration of
the aforementioned activities. We are executing the work in collaboration
with our partner Volker Construction International under the name of
Offshore Windforce for our client, a joint venture between DONG Energy
and Scottish Power Renewables. The work includes the preparation of the
seabed and the transportation and installation of 108 turbine foundations.
Our oceangoing fl at-top barges and tugs will transport monopiles and
transition pieces from Aalborg in Denmark to Belfast, a distance of 1,500
kilometers. A Boskalis fallpipe vessel will apply an initial scour protection
fi lter layer on the seabed, after which the wind turbine sections will be
transported from Belfast to the wind park. Once they have been installed we
will apply a further layer of scour protection around the piles. We will also
lay the cables connecting the 108 wind turbines.
Frank Verhoeven, member of the Board of Management, said: “In support of
the execution of integrated offshore energy projects by Boskalis Offshore we
deploy new advanced vessels, such as the fallpipe vessel Rockpiper
commissioned in 2012. We also have great expectations for the
multifunctional N-class vessels set to enter service in 2013. In addition to
cable laying and rock installation, these can be used as diving support
vessels or offshore construction vessels on FPSO projects.”

30A
NN
UA
L R
EPO
RT
20
12
— B
OSK
ALI
SR
EPO
RT
OF
THE
BO
AR
D O
F M
AN
AG
EMEN
T30A
NN
UA
L R
EVIE
W 2
01
2 —
BO
SKA
LIS
REP
OR
T O
F TH
E B
OA
RD
OF
MA
NA
GEM
ENT
TSHD Prins der Nederlanden and CSD Edax apply sand for the seawall of Maasvlakte 2 in Rotterdam, the Netherlands

31
AN
NU
AL
REP
OR
T 2
01
2 —
BO
SKA
LIS
3131
AN
NU
AL
REV
IEW
20
12
— B
OSK
ALI
S
REPORT OF THE BOARD OF MANAGEMENT
32 MARKET DEVELOPMENTS
33 FINANCIAL PERFORMANCE
42 OPERATIONAL PERFORMANCE
46 CORPORATE SOCIAL RESPONSIBILITY
47 RISK MANAGEMENT
54 CORPORATE GOVERNANCE
56 OUTLOOK
57 STATEMENT OF DIRECTORS’ RESPONSIBILITIES
31
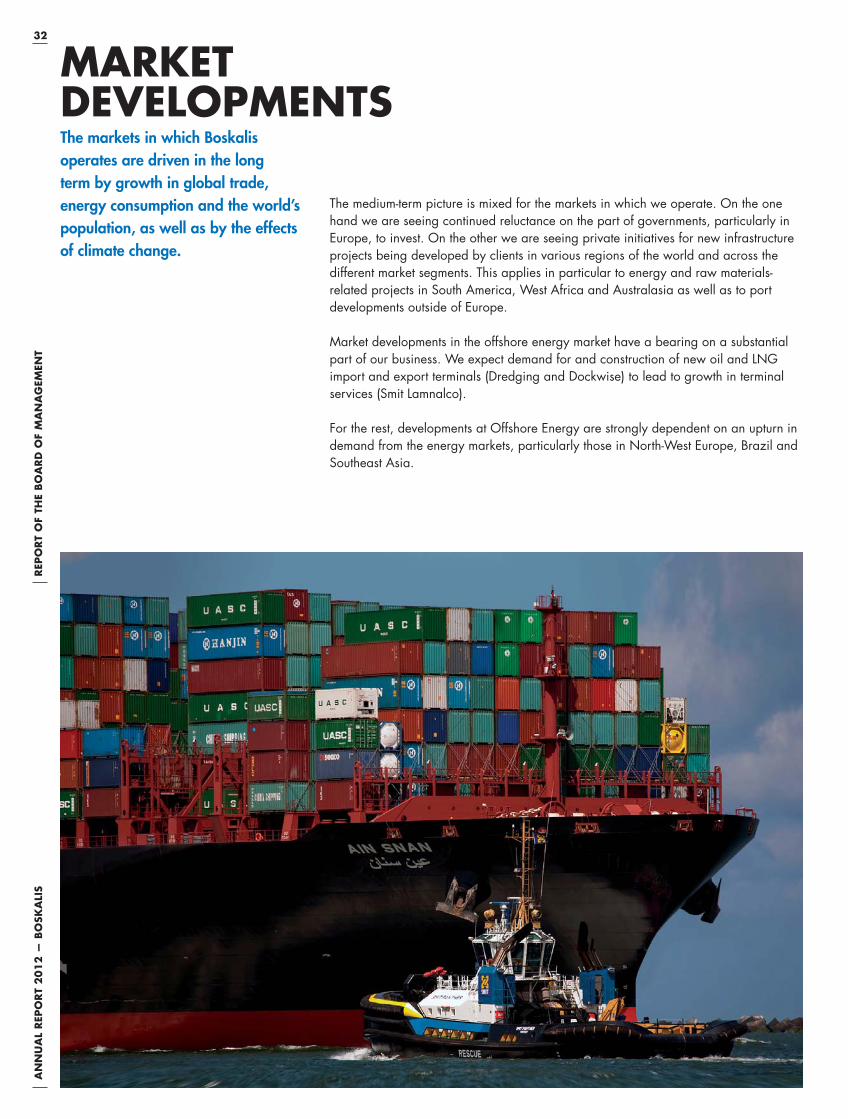
32A
NN
UA
L R
EPO
RT
20
12
— B
OSK
ALI
SR
EPO
RT
OF
THE
BO
AR
D O
F M
AN
AG
EMEN
T
MARKET DEVELOPMENTS
The medium-term picture is mixed for the markets in which we operate. On the one
hand we are seeing continued reluctance on the part of governments, particularly in
Europe, to invest. On the other we are seeing private initiatives for new infrastructure
projects being developed by clients in various regions of the world and across the
different market segments. This applies in particular to energy and raw materials-
related projects in South America, West Africa and Australasia as well as to port
developments outside of Europe.
Market developments in the offshore energy market have a bearing on a substantial
part of our business. We expect demand for and construction of new oil and LNG
import and export terminals (Dredging and Dockwise) to lead to growth in terminal
services (Smit Lamnalco).
For the rest, developments at Offshore Energy are strongly dependent on an upturn in
demand from the energy markets, particularly those in North-West Europe, Brazil and
Southeast Asia.
The markets in which Boskalis operates are driven in the long term by growth in global trade, energy consumption and the world’s population, as well as by the effects of climate change.

33
AN
NU
AL
REP
OR
T 2
01
2 —
BO
SKA
LIS
FINANCIAL PERFORMANCE
OPERATIONAL AND FINANCIAL DEVELOPMENTS
REVENUE
During the year under review revenue rose by 10% to
EUR 3.08 billion (2011: EUR 2.80 billion), with the increase
being mainly attributable to the effect of the consolidation of
MNO Vervat, acquired at the end of 2011. Adjusted for this and
for the effect of transferring the terminal activities to Smit Lamnalco
in October 2011, the increase in revenue was just over 1%.
Revenue in the Dredging segment declined by 15%, impacted by
BY SEGMENT 2012 2011
(in millions of EUR)
Dredging 1,290 1,525
Offshore Energy 481 371
Inland Infra 777 382
Towage & Salvage 533 519
Non-allocated group revenue - 4
Group 3,081 2,801
BY GEOGRAPHICAL AREA 2012 2011
(in millions of EUR)
The Netherlands 763 633
Rest of Europe 570 494
Australia / Asia 484 690
Middle East 341 318
Africa 428 296
North and South America 495 370
Group 3,081 2,801
the conclusion of large projects in the Netherlands and Australia.
The Offshore Energy segment saw revenue increase by 30%, with
growth spread broadly across the activities in this segment. The
Inland Infra segment recorded a sharp rise in revenue, mainly as a
result of the aforementioned acquisition of MNO Vervat. Revenue
in the Towage & Salvage segment rose slightly, mainly as a result
of the increased revenue of the harbour towage activities.
Royal Boskalis Westminster N.V. (Boskalis) achieved a record revenue of EUR 3.1 billion in 2012
(2011: EUR 2.8 billion). Net profi t amounted to EUR 250 million, thus remaining virtually stable
compared to 2011 (EUR 254 million). Despite the slight decline in net profi t and a substantial increase
in the number of outstanding shares as a consequence of the recent equity issue in connection with the
acquisition of Dockwise, Boskalis intends to pay-out an unchanged dividend of EUR 1.24 per share.
EBITDA dropped to EUR 568 million (2011: EUR 591 million) and the operating result (EBIT) fell to
EUR 337 million (2011: EUR 354 million). The contribution from Dredging declined as a consequence of
lower volume of work. Challenging market conditions in Inland Infra led to a lower result with an increase
in revenue. The remaining activities, Offshore Energy and Towage & Salvage, achieved a respectively
virtually stable and slightly higher operating result.
The order book increased to EUR 4.106 million as per end-2012 (end-2011: EUR 3.489 million).
Compared to the 2012 mid-year level the order book was also higher at the end of the year.
763
570
484
341
428
495
1,290
481
777
533

34A
NN
UA
L R
EPO
RT
20
12
— B
OSK
ALI
SR
EPO
RT
OF
THE
BO
AR
D O
F M
AN
AG
EMEN
T
RESULT
The operating result excluding the result of associated companies and
before interest, taxes, depreciation, amortization and impairments
(EBITDA) was EUR 568 million (2011: EUR 591 million).
The operating result (EBIT) in 2012 was EUR 337 million
(2011: EUR 354 million).
RESULT BY SEGMENT 2012 2011
(in millions of EUR)
Dredging 200.6 216.6
Offshore Energy 60.3 62.1
Inland Infra 38.1 47.7
Towage & Salvage 74.0 69.1
Non-allocated group costs –36.1 –41.4
Total 336.9 354.1
The decline in the operating result was mainly attributable to
the lower results in the Dredging and Inland Infra segments.
NET PROFIT
The operating profi t (EBIT) was EUR 337 million. Net of fi nancing
expenses of EUR 34.5 million and EUR 0.3 million in results from
associated companies, pretax profi t came to EUR 303 million.
Net profi t attributable to shareholders totaled EUR 250 million
(2011: EUR 254 million).
ORDER BOOK
In the course of 2012 Boskalis acquired, on balance,
EUR 3,436 million worth of new contracts, broadly spread across
the world and the various segments. At the end of 2012 the total
order book stood at EUR 4,106 million, setting a new record high
(end-2011: EUR 3,489 million).
ORDER BOOK 31 dec 2012 31 dec 2011
(in millions of EUR)
Dredging 1,260 1,333
Offshore Energy 820 411
Inland Infra 1,416 1,149
Towage & Salvage 610 596
Total 4,106 3,489
DREDGING
Construction, maintenance and deepening of ports and waterways,
land reclamation, coastal defense and riverbank protection,
underwater rock fragmentation and the extraction of minerals using
dredging techniques.
The composition of the Dredging segment changed in 2012.
Previously (up to and including the 2012 half-year results) a
sub-category of specialist niche services was presented within this
segment, comprising the energy-related activities of Boskalis
Offshore and the dry earthmoving-related activities of Boskalis

35
AN
NU
AL
REP
OR
T 2
01
2 —
BO
SKA
LIS
Environmental and Cofra. With effect from 2012 Boskalis Offshore
is part of the Offshore Energy segment and the dry earthmoving-
related activities are part of the Inland Infra segment. The
comparative fi gures for 2011 have been adjusted to refl ect this
new segment structure.
DREDGING 2012 2011
(in millions of EUR)
Revenue 1,290 1,525
EBITDA 286.0 301.9
Operating result 200.6 216.6
Order book 1,260 1,333
REVENUE
Revenue in the Dredging segment totaled EUR 1,290 million
(2011: EUR 1,525 million).
REVENUE BY MARKETS 2012 2011
(in millions of EUR)
European home markets 468 523
Non-European home markets 143 191
International projects 679 811
Total 1,290 1,525
European home marketsRevenue in the European home markets (the Netherlands,
Germany, United Kingdom, Nordic countries) declined by 11% to
EUR 468 million (2011: EUR 523 million). The decline was mainly
attributable to the lower activity level in the Netherlands as a result
of the conclusion of work on the Maasvlakte 2 project and a lower
volume of coastal defense projects. The Maasvlakte 2 project will
be technically concluded in the course of 2013, followed by a
10-year maintenance period for the soft sea defense. Projects
contributing to revenue in the Netherlands included coastal defense
work along the Wadden islands (Texel) and maintenance work on
the access channel to Europoort in the Port of Rotterdam. In the
other European home markets work took place on a large number
of maintenance projects in ports and waterways, as well as on a
number of coastal defense projects in the United Kingdom.
In addition in Germany Boskalis Hirdes, with its expertise in the
area of onshore ordnance clearance, was engaged in a lot of
offshore ordnance clearance work by combining its own expertise
with that of Subsea Services, part of the Offshore Energy division
(formerly SMIT Subsea).
Non-European home marketsRevenue in the home markets outside Europe (Nigeria and Mexico)
fell by 25% to EUR 143 million (2011: EUR 191 million). The
decline in revenue is attributable to a lower activity level in
Mexico, where the sizable Cuyutlán project came to an end. In
Nigeria the activity level was comparable to 2011, with a strong
contribution coming from the Onno Port project, which involves
expanding the port for the offshore industry. While the prospects
for further growth in Nigeria remain good, decision-making
processes at oil and gas companies with regard to major
investment decisions are proving to be slower than has tended to
be the case in the past.
International project marketRevenue from the international project market was EUR 679 million
(2011: EUR 811 million). The second half of the year saw the
technical conclusion of the sizable Gorgon project in Western
Australia, but it is expected that the fi nancial settlement of this
project will take at least the rest of 2013. It was a busy year in
Central and South America, with work including the port
development at Complex Superporto do Açu in Brazil and the
Lelydorp total mining project in Suriname.
Fleet developmentsGood utilization of the hopper fl eet in the second half of the year
resulted in an annual utilization rate of 41 weeks (2011: 39 weeks).
The utilization rate of the cutter fl eet was in line with the fi rst half
of the year and stood at 25 weeks for the whole of 2012 (2011:
19 weeks).
SEGMENT RESULT
The operating result (EBIT) of the Dredging segment totaled
EUR 201 million (2011: EUR 217 million). The decline in the result
was less than the drop in revenue; this was due to good results on
a number of large projects reaching completion as well as results
from the fi nancial settlement of projects that had previously been
technically completed and which do not make a substantial
contribution to revenue.
ORDER BOOK
In 2012 on balance EUR 1,217 million of new work was acquired.
ORDER BOOK BY MARKETS 31 dec 2012 31 dec 2011
(in millions of EUR)
European home markets 354 469
Non-European home markets 51 108
International projects 855 756
Total 1,260 1,333
In addition to a large number of smaller ports and waterways
maintenance projects, several noteworthy contracts were acquired.
These included a substantial project acquired in India for the
deepening and widening of the access channel of the port of
Mumbai and one in Kenya for the expansion of the container
terminal by reclaiming land in the port of Mombasa.
At the end of 2012 the order book stood at EUR 1,260 million
(end-2011: EUR 1,333 million).
OFFSHORE ENERGY
Offshore dredging and rock installation projects, heavy transport,
lift and installation work, diving and ROV services in support of
the development, construction, maintenance and decommissioning
of oil and LNG import/export facilities, offshore platforms,
pipelines and cables and offshore wind farms.
The Offshore Energy segment is a new segment, established in
2012 to combine all the existing activities that directly and
indirectly support the offshore industry. The segment comprises
services in the areas of subsea contracting (formerly the specialist
niche activity Boskalis Offshore, part of the old Dredging
36A
NN
UA
L R
EPO
RT
20
12
— B
OSK
ALI
SR
EPO
RT
OF
THE
BO
AR
D O
F M
AN
AG
EMEN
T
segment), subsea services (formerly SMIT Subsea, part of the old
Transport & Heavy Lift segment) and marine contracting & marine
services (formerly SMIT Marine Projects and SMIT Transport, both
part of the former Transport & Heavy Lift segment). Since the end
of 2012 all these activities are marketed under the name Boskalis
Offshore. The comparative fi gures for 2011 have been adjusted to
refl ect this new segment structure.
OFFSHORE ENERGY 2012 2011
(in millions of EUR)
Revenue 481 371
EBITDA 95.4 107.8
Operating result 60.3 62.1
Order book 820 411
REVENUE
Revenue in the Offshore Energy segment rose by 30% compared
to 2011 to EUR 481 million (2011: EUR 371 million).
At subsea contracting there was a high activity level with offshore
dredging projects in various countries in addition to rock installation
work to protect pipelines in for example Norway and on the
Macedon project in Australia. At marine contracting, preparations
started in the second half of the year for the West of Duddon Sands
offshore wind farm in the Irish Sea as well as for the installation of
an FPSO in Brazil.
The transport division of marine services experienced good
capacity utilization in both Europe and Singapore. Capacity
utilization of the fl oating sheerleg cranes showed a mixed picture,
with Europe under performing but the Asian Lift joint venture in
Singapore performing well by contrast. With regard to the diving
and inspection activities (subsea services) a busy year drew to a
close including a strong capacity utilization of the diving support
vessels on the North Sea.
SEGMENT RESULT
The operating result could not match the growth in revenue, totaling
EUR 60.3 million (2011: EUR 62.1 million). Diffi cult working
conditions on a number of projects in progress had a negative
impact on the result.
ORDER BOOK
Compared to the end of 2011 the order book doubled to
EUR 820 million (end-2011 EUR 411 million). A large number of
projects were acquired in 2012, including the West of Duddon
Sands offshore wind farm project, various rock installation works for
companies including Statoil, subsea inspection and maintenance
contracts for companies including Maersk Oil and a substantial
offshore contract from Impex for the Ichthys project in Australia.
INLAND INFRA
Construction of roads and railways, bridges, dams, overpasses
and terminals including earthmoving, soil improvement and
remediation. Through a strategic partner also civil infrastructure
projects such as quay walls, breakwaters, water purifi cation
plants, sewer systems and the industrial construction of facilities
such as power plants and desalination plants.
The former Dry Infrastructure and Maritime Infrastructure segments
were combined in 2012 to create the new Inland Infra segment, in
light of the fact that their activities, margin profi le and capital
requirement are similar. The dry earthmoving-related activities of
Boskalis Environmental and Cofra have also been added to this
segment. Previously these activities were part of the specialist
niche services within the Dredging segment.
INLAND INFRA 2012 2011
(in millions of EUR)
Revenue 777 382
EBITDA 78.8 68.0
Operating result 38.1 47.7
Order book 1,416 1,149
REVENUE
Revenue in the Inland Infra segment more than doubled to
EUR 777 million (2011: EUR 382 million). The activities acquired
from MNO Vervat at the end of 2011 contributed EUR 324 million
to revenue in the year under review, thus accounting for a major
part of the revenue growth. The remaining growth was evenly
spread between the dry earthmoving activities in the Netherlands
and the civil activities of our strategic partner Archirodon, in which
Boskalis holds a 40% stake.
SEGMENT RESULT
The operating result in the Inland Infra segment, including the
proportionate consolidation of joint venturess, was EUR 38.1 million
(2011: EUR 47.7 million). Results in the Netherlands were under
pressure from the diffi cult market conditions, particularly in the local
and regional infra markets. Despite the addition of MNO Vervat
the result came in lower than in 2011, when an exceptionally good
result which included the results of previously completed projects
and payment for a project that was prematurely terminated.
Following careful preparation in 2012 the Boskalis-MNO Vervat
integration process began in earnest in early 2013. The integration
is aimed at phasing out the regional/local activities of MNO Vervat
in the Netherlands and merging the operational support and staff
departments. In addition to taking on smaller projects in the western
part of the Netherlands the new organization’s main focus will be
on contracting complex projects capitalizing on the combined
strength and distinctive capabilities of both organizations.
Archirodon, which mainly operates in Saudi Arabia and a number
of other countries in the Middle East and North Africa, experienced
increased competition in several countries, resulting in lower margins
in these countries. This meant that a lower result was achieved on
increased revenue compared to 2011.
37
AN
NU
AL
REP
OR
T 2
01
2 —
BO
SKA
LIS
ORDER BOOK
In line with the strategic focus of the new Boskalis-MNO Vervat
organization on the Dutch market the SAAone project was
successfully acquired in late 2012. This project, which takes the
form of a DBFM (Design, Build, Finance & Maintain) contract,
concerns the reconstruction, widening and maintenance of the A1
and A6 motorways between Diemen and Almere in the Netherlands.
The capital works of the project amounting EUR 187 million has
been included in the order book.
On balance EUR 1,044 million worth of new work was acquired
in 2012, boosting the order book by EUR 267 million. At the end
of 2012 outstanding orders totaled EUR 1,416 million (end-2011:
EUR 1,149 million). This includes our 40% share in the order book
of Archirodon, which amounted to EUR 579 million.
TOWAGE & SALVAGE
Towage: towage services and berthing and unberthing of
oceangoing vessels in ports and at offshore terminals, management
and maintenance both above and below the surface of onshore
and offshore oil and gas terminals and associated maritime and
management services.
Salvage: providing assistance to vessels in distress, wreck clearance,
environmental care services and advice.
In the year under review the former Harbour Towage and Terminal
Services segments were combined under the name Towage. The
nature of these activities and the type of equipment deployed is
very similar. The salvage activities, which were formerly a part of
the Transport, Heavy Lift & Salvage segment, were also added to
this segment. Salvage relies on a close-knit global network of
contacts for tugboats and other equipment so as to be able to
provide rapid assistance to a vessel in distress. Equipment from the
Harbour Towage and Terminal Services activities of this segment is
also regularly deployed.
TOWAGE & SALVAGE 2012 2011
(in millions of EUR)
Revenue 533 519
EBITDA 142 149
Operating result 74.0 69.1
Order book 610 596
REVENUE
Revenue in the Towage & Salvage segment rose to EUR 533 million
in 2012 (2011: EUR 519 million).
Boskalis is active in providing towage services through SMIT
Harbour Towage in the port of Rotterdam and in countries including
Belgium, Brazil, Panama, Canada, Australia and Singapore.
Revenue from the harbour towage activities rose in 2012, mainly
as a result of growth in a number of specifi c maritime transport
segments, such as agribulk in South America, offshore shipbuilding
activities in Singapore and the deployment of equipment in
connection with salvage projects.
Boskalis is also active, mainly through its 50% stake in Smit
Lamnalco, in providing towage and additional services around
offshore terminals, often under long-term contracts. At the end of
2011 the SMIT Terminals activities were sold to (Smit) Lamnalco,
in which Boskalis already held a 50% interest. In 2012 the
terminal activities experienced a slight decline in revenue, wholly
attributable to the SMIT Terminals deconsolidation effect.
Organically Smit Lamnalco experienced strong revenue growth.
In spite of a few high-profi le successful salvage operations 2012
was a relatively quiet year for Salvage. Noteworthy projects
which were successfully completed include the salvage of a VLOC
(Very Large Ore Carrier), the cruise ship Costa Concordia (oil
removal and environmental protection work, Italy), the Sep Orion
(oil removal from a capsized jack-up, Brazil), the Ocean Eclipse
(refl oating a diving support vessel at the yard in Singapore), the
Stolt Valor (extinguishing a fi re on a chemical tanker and preparing
the vessel for towage) and the MSC Flaminia (fi refi ghting on the
Atlantic Ocean, towage and delivery to Wilhelmshaven, Germany
as port of refuge).
SEGMENT RESULT
The operating result, including the proportionate consolidation
of associates, was EUR 74.0 million (2011: EUR 69.1 million).
ORDER BOOK
The order book grew slightly to EUR 610 million (end-2011:
EUR 596 million) and contains only terminal contracts. In the fi rst
half of 2012 Smit Lamnalco won a 10-year contract for the provision
of terminal services to an ExxonMobil LNG terminal in Papua New
Guinea. Later in the year another sizeable contract was acquired
in Iraq.
HOLDINGNon-allocated head offi ce activities.
HOLDING 2012 2011
(in millions of EUR)
Revenue - 4.0
Operating result -36.1 -41.4
SEGMENT RESULT
The operating result for the reporting period mainly includes
the usual non-allocated head offi ce costs, as well as various
non-allocated (mainly non-recurring) costs. The latter include costs
connected with the integration and relocation of most of the SMIT
organization from Rotterdam to the head offi ce in Papendrecht.
In 2011 the result was also affected by costs connected with the
integration and reorganization of the (former) SMIT activities.
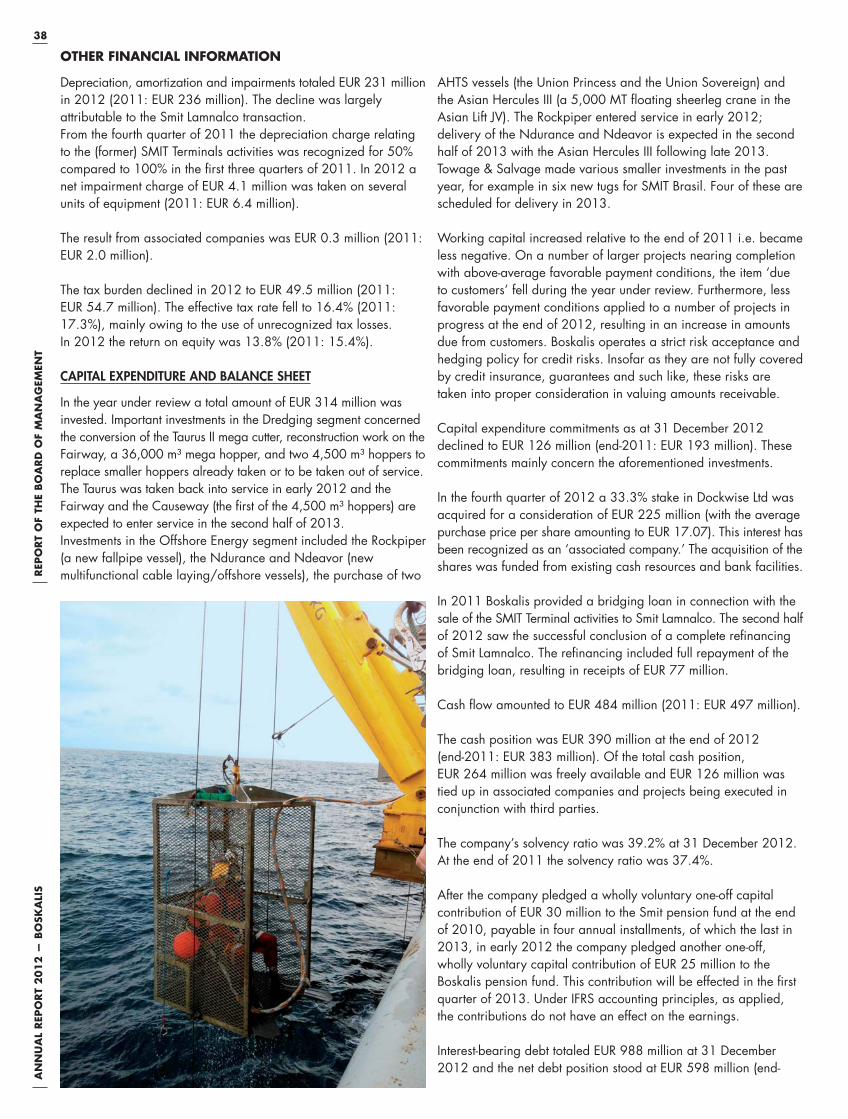
38A
NN
UA
L R
EPO
RT
20
12
— B
OSK
ALI
SR
EPO
RT
OF
THE
BO
AR
D O
F M
AN
AG
EMEN
T
OTHER FINANCIAL INFORMATION
Depreciation, amortization and impairments totaled EUR 231 million
in 2012 (2011: EUR 236 million). The decline was largely
attributable to the Smit Lamnalco transaction.
From the fourth quarter of 2011 the depreciation charge relating
to the (former) SMIT Terminals activities was recognized for 50%
compared to 100% in the fi rst three quarters of 2011. In 2012 a
net impairment charge of EUR 4.1 million was taken on several
units of equipment (2011: EUR 6.4 million).
The result from associated companies was EUR 0.3 million (2011:
EUR 2.0 million).
The tax burden declined in 2012 to EUR 49.5 million (2011:
EUR 54.7 million). The effective tax rate fell to 16.4% (2011:
17.3%), mainly owing to the use of unrecognized tax losses.
In 2012 the return on equity was 13.8% (2011: 15.4%).
CAPITAL EXPENDITURE AND BALANCE SHEET
In the year under review a total amount of EUR 314 million was
invested. Important investments in the Dredging segment concerned
the conversion of the Taurus II mega cutter, reconstruction work on the
Fairway, a 36,000 m³ mega hopper, and two 4,500 m³ hoppers to
replace smaller hoppers already taken or to be taken out of service.
The Taurus was taken back into service in early 2012 and the
Fairway and the Causeway (the fi rst of the 4,500 m³ hoppers) are
expected to enter service in the second half of 2013.
Investments in the Offshore Energy segment included the Rockpiper
(a new fallpipe vessel), the Ndurance and Ndeavor (new
multifunctional cable laying/offshore vessels), the purchase of two
AHTS vessels (the Union Princess and the Union Sovereign) and
the Asian Hercules III (a 5,000 MT fl oating sheerleg crane in the
Asian Lift JV). The Rockpiper entered service in early 2012;
delivery of the Ndurance and Ndeavor is expected in the second
half of 2013 with the Asian Hercules III following late 2013.
Towage & Salvage made various smaller investments in the past
year, for example in six new tugs for SMIT Brasil. Four of these are
scheduled for delivery in 2013.
Working capital increased relative to the end of 2011 i.e. became
less negative. On a number of larger projects nearing completion
with above-average favorable payment conditions, the item ‘due
to customers’ fell during the year under review. Furthermore, less
favorable payment conditions applied to a number of projects in
progress at the end of 2012, resulting in an increase in amounts
due from customers. Boskalis operates a strict risk acceptance and
hedging policy for credit risks. Insofar as they are not fully covered
by credit insurance, guarantees and such like, these risks are
taken into proper consideration in valuing amounts receivable.
Capital expenditure commitments as at 31 December 2012
declined to EUR 126 million (end-2011: EUR 193 million). These
commitments mainly concern the aforementioned investments.
In the fourth quarter of 2012 a 33.3% stake in Dockwise Ltd was
acquired for a consideration of EUR 225 million (with the average
purchase price per share amounting to EUR 17.07). This interest has
been recognized as an ‘associated company.’ The acquisition of the
shares was funded from existing cash resources and bank facilities.
In 2011 Boskalis provided a bridging loan in connection with the
sale of the SMIT Terminal activities to Smit Lamnalco. The second half
of 2012 saw the successful conclusion of a complete refi nancing
of Smit Lamnalco. The refi nancing included full repayment of the
bridging loan, resulting in receipts of EUR 77 million.
Cash fl ow amounted to EUR 484 million (2011: EUR 497 million).
The cash position was EUR 390 million at the end of 2012
(end-2011: EUR 383 million). Of the total cash position,
EUR 264 million was freely available and EUR 126 million was
tied up in associated companies and projects being executed in
conjunction with third parties.
The company’s solvency ratio was 39.2% at 31 December 2012.
At the end of 2011 the solvency ratio was 37.4%.
After the company pledged a wholly voluntary one-off capital
contribution of EUR 30 million to the Smit pension fund at the end
of 2010, payable in four annual installments, of which the last in
2013, in early 2012 the company pledged another one-off,
wholly voluntary capital contribution of EUR 25 million to the
Boskalis pension fund. This contribution will be effected in the fi rst
quarter of 2013. Under IFRS accounting principles, as applied,
the contributions do not have an effect on the earnings.
Interest-bearing debt totaled EUR 988 million at 31 December
2012 and the net debt position stood at EUR 598 million (end-
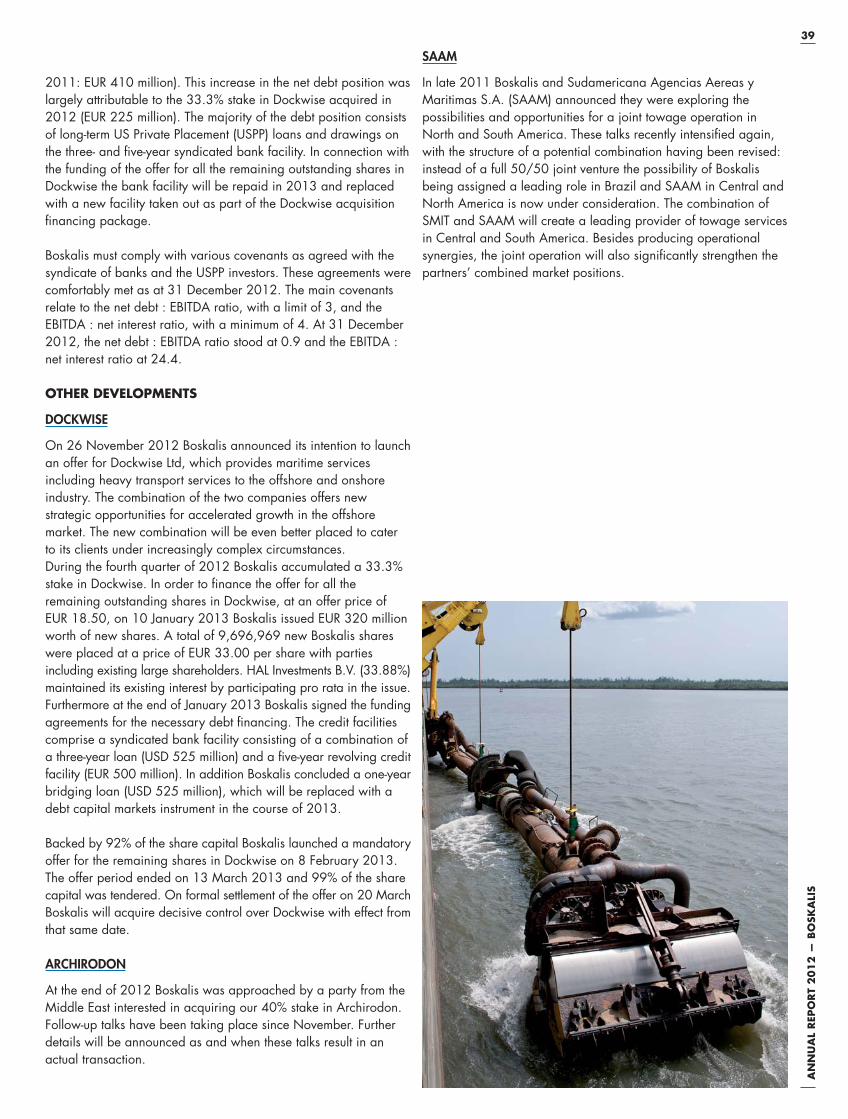
39
AN
NU
AL
REP
OR
T 2
01
2 —
BO
SKA
LIS
SAAM
In late 2011 Boskalis and Sudamericana Agencias Aereas y
Maritimas S.A. (SAAM) announced they were exploring the
possibilities and opportunities for a joint towage operation in
North and South America. These talks recently intensifi ed again,
with the structure of a potential combination having been revised:
instead of a full 50/50 joint venture the possibility of Boskalis
being assigned a leading role in Brazil and SAAM in Central and
North America is now under consideration. The combination of
SMIT and SAAM will create a leading provider of towage services
in Central and South America. Besides producing operational
synergies, the joint operation will also signifi cantly strengthen the
partners’ combined market positions.
2011: EUR 410 million). This increase in the net debt position was
largely attributable to the 33.3% stake in Dockwise acquired in
2012 (EUR 225 million). The majority of the debt position consists
of long-term US Private Placement (USPP) loans and drawings on
the three- and fi ve-year syndicated bank facility. In connection with
the funding of the offer for all the remaining outstanding shares in
Dockwise the bank facility will be repaid in 2013 and replaced
with a new facility taken out as part of the Dockwise acquisition
fi nancing package.
Boskalis must comply with various covenants as agreed with the
syndicate of banks and the USPP investors. These agreements were
comfortably met as at 31 December 2012. The main covenants
relate to the net debt : EBITDA ratio, with a limit of 3, and the
EBITDA : net interest ratio, with a minimum of 4. At 31 December
2012, the net debt : EBITDA ratio stood at 0.9 and the EBITDA :
net interest ratio at 24.4.
OTHER DEVELOPMENTS
DOCKWISE
On 26 November 2012 Boskalis announced its intention to launch
an offer for Dockwise Ltd, which provides maritime services
including heavy transport services to the offshore and onshore
industry. The combination of the two companies offers new
strategic opportunities for accelerated growth in the offshore
market. The new combination will be even better placed to cater
to its clients under increasingly complex circumstances.
During the fourth quarter of 2012 Boskalis accumulated a 33.3%
stake in Dockwise. In order to fi nance the offer for all the
remaining outstanding shares in Dockwise, at an offer price of
EUR 18.50, on 10 January 2013 Boskalis issued EUR 320 million
worth of new shares. A total of 9,696,969 new Boskalis shares
were placed at a price of EUR 33.00 per share with parties
including existing large shareholders. HAL Investments B.V. (33.88%)
maintained its existing interest by participating pro rata in the issue.
Furthermore at the end of January 2013 Boskalis signed the funding
agreements for the necessary debt fi nancing. The credit facilities
comprise a syndicated bank facility consisting of a combination of
a three-year loan (USD 525 million) and a fi ve-year revolving credit
facility (EUR 500 million). In addition Boskalis concluded a one-year
bridging loan (USD 525 million), which will be replaced with a
debt capital markets instrument in the course of 2013.
Backed by 92% of the share capital Boskalis launched a mandatory
offer for the remaining shares in Dockwise on 8 February 2013.
The offer period ended on 13 March 2013 and 99% of the share
capital was tendered. On formal settlement of the offer on 20 March
Boskalis will acquire decisive control over Dockwise with effect from
that same date.
ARCHIRODON
At the end of 2012 Boskalis was approached by a party from the
Middle East interested in acquiring our 40% stake in Archirodon.
Follow-up talks have been taking place since November. Further
details will be announced as and when these talks result in an
actual transaction.

40A
NN
UA
L R
EPO
RT
20
12
— B
OSK
ALI
S40A
NN
UA
L R
EVIE
W 2
01
2—
BO
SKA
LIS
BUILDING SOUTH AMERICA’S BIGGEST PORT
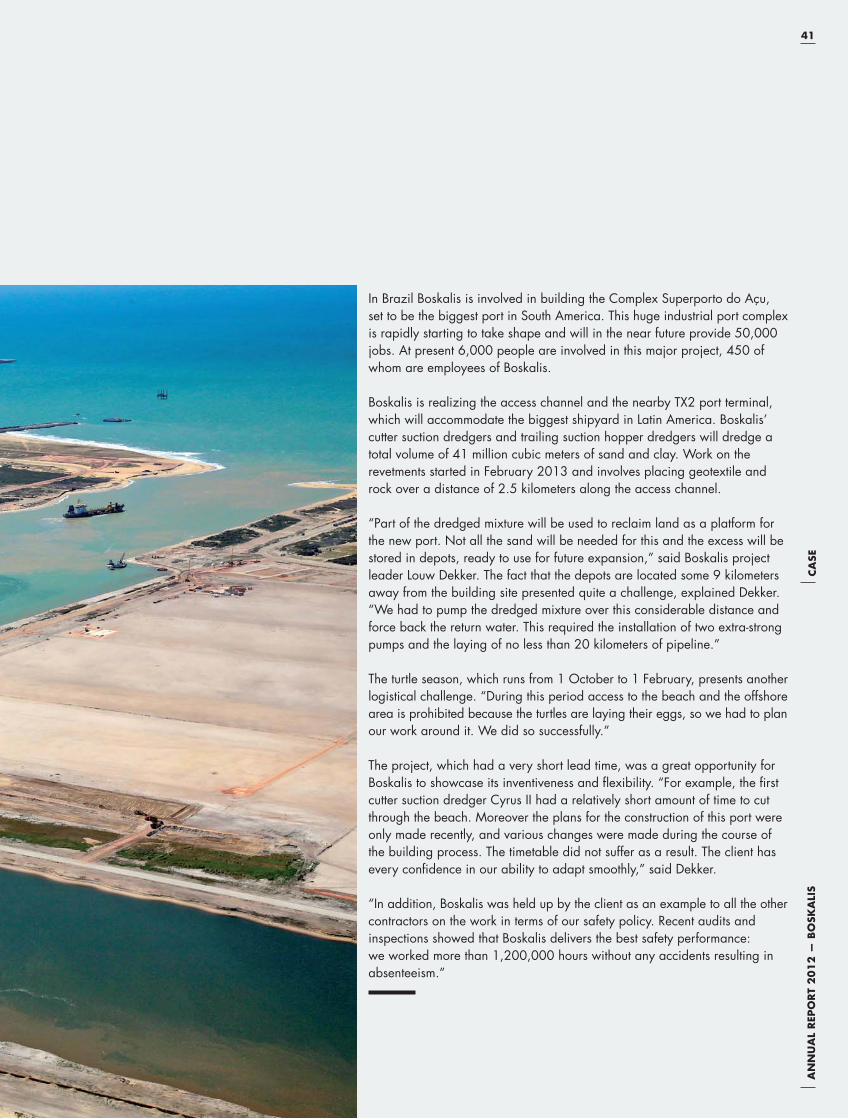
41
AN
NU
AL
REP
OR
T 2
01
2 —
BO
SKA
LIS
CA
SE
In Brazil Boskalis is involved in building the Complex Superporto do Açu,
set to be the biggest port in South America. This huge industrial port complex
is rapidly starting to take shape and will in the near future provide 50,000
jobs. At present 6,000 people are involved in this major project, 450 of
whom are employees of Boskalis.
Boskalis is realizing the access channel and the nearby TX2 port terminal,
which will accommodate the biggest shipyard in Latin America. Boskalis’
cutter suction dredgers and trailing suction hopper dredgers will dredge a
total volume of 41 million cubic meters of sand and clay. Work on the
revetments started in February 2013 and involves placing geotextile and
rock over a distance of 2.5 kilometers along the access channel.
“Part of the dredged mixture will be used to reclaim land as a platform for
the new port. Not all the sand will be needed for this and the excess will be
stored in depots, ready to use for future expansion,” said Boskalis project
leader Louw Dekker. The fact that the depots are located some 9 kilometers
away from the building site presented quite a challenge, explained Dekker.
“We had to pump the dredged mixture over this considerable distance and
force back the return water. This required the installation of two extra-strong
pumps and the laying of no less than 20 kilometers of pipeline.”
The turtle season, which runs from 1 October to 1 February, presents another
logistical challenge. “During this period access to the beach and the offshore
area is prohibited because the turtles are laying their eggs, so we had to plan
our work around it. We did so successfully.”
The project, which had a very short lead time, was a great opportunity for
Boskalis to showcase its inventiveness and fl exibility. “For example, the fi rst
cutter suction dredger Cyrus II had a relatively short amount of time to cut
through the beach. Moreover the plans for the construction of this port were
only made recently, and various changes were made during the course of
the building process. The timetable did not suffer as a result. The client has
every confi dence in our ability to adapt smoothly,” said Dekker.
“In addition, Boskalis was held up by the client as an example to all the other
contractors on the work in terms of our safety policy. Recent audits and
inspections showed that Boskalis delivers the best safety performance:
we worked more than 1,200,000 hours without any accidents resulting in
absenteeism.”
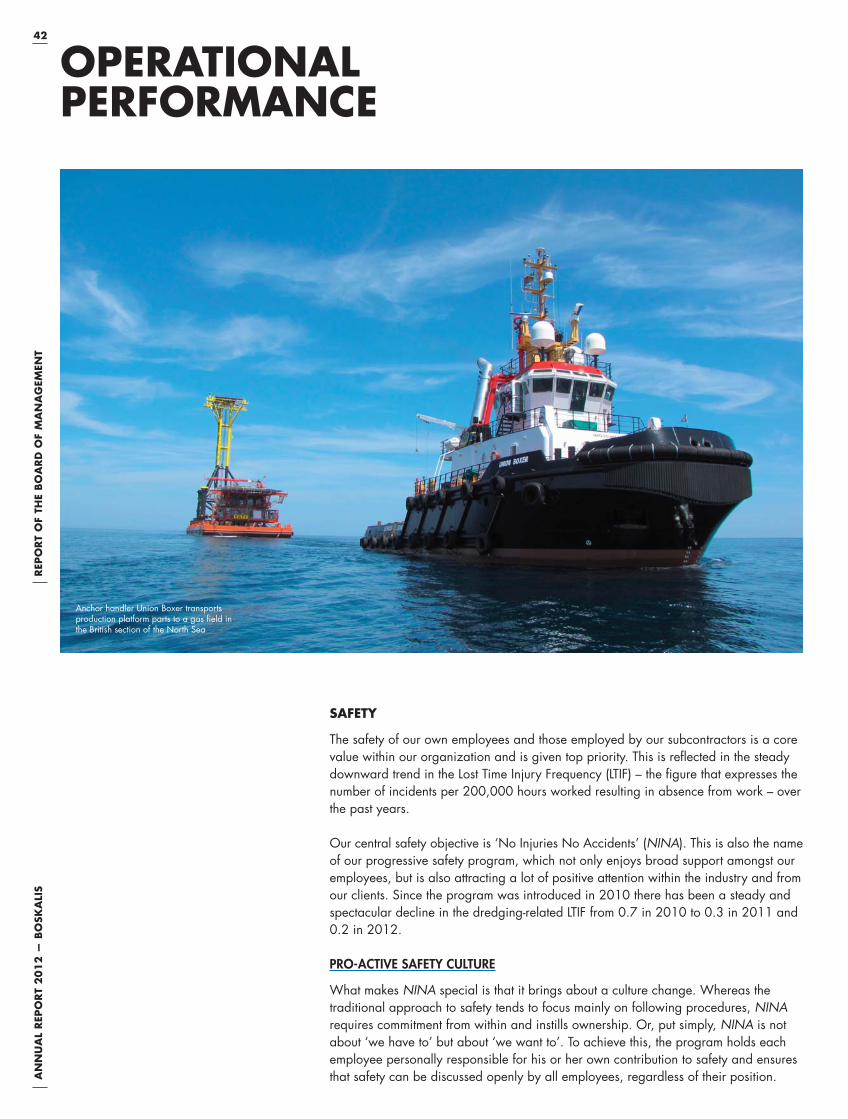
42A
NN
UA
L R
EPO
RT
20
12
— B
OSK
ALI
SR
EPO
RT
OF
THE
BO
AR
D O
F M
AN
AG
EMEN
T
SAFETY
The safety of our own employees and those employed by our subcontractors is a core
value within our organization and is given top priority. This is refl ected in the steady
downward trend in the Lost Time Injury Frequency (LTIF) – the fi gure that expresses the
number of incidents per 200,000 hours worked resulting in absence from work – over
the past years.
Our central safety objective is ‘No Injuries No Accidents’ (NINA). This is also the name
of our progressive safety program, which not only enjoys broad support amongst our
employees, but is also attracting a lot of positive attention within the industry and from
our clients. Since the program was introduced in 2010 there has been a steady and
spectacular decline in the dredging-related LTIF from 0.7 in 2010 to 0.3 in 2011 and
0.2 in 2012.
PRO-ACTIVE SAFETY CULTURE
What makes NINA special is that it brings about a culture change. Whereas the
traditional approach to safety tends to focus mainly on following procedures, NINA
requires commitment from within and instills ownership. Or, put simply, NINA is not
about ‘we have to’ but about ‘we want to’. To achieve this, the program holds each
employee personally responsible for his or her own contribution to safety and ensures
that safety can be discussed openly by all employees, regardless of their position.
OPERATIONAL PERFORMANCE
Anchor handler Union Boxer transports production platform parts to a gas fi eld in the British section of the North Sea

43
AN
NU
AL
REP
OR
T 2
01
2 —
BO
SKA
LIS
Five short and sharply worded values with fi ve supporting rules
provide the framework aimed at preventing incidents. In just two
years we have achieved a clear and very positive development in
the safety experience. Everyone in a management position has
received training and NINA has been embraced and has become
a household name both within our organization and beyond.
There is no question as to the benefi ts and necessity of NINA, and
further embedding the program within the organization will be a
matter of constant attention in the coming years.
INTRODUCTION OF NINA AT SMIT
The integration of Boskalis and SMIT was completed in 2012. The
organizational structure is clear and cooperation is developing in
all areas. For a successful introduction of NINA at the former SMIT
units the conditions must allow for suffi cient calm and focus. The
new Offshore division, which combines various Boskalis and SMIT
units, is the fi rst integrated business unit to have reached a logical
point for the introduction of NINA. The management systems are
being harmonized and we have started conducting internal audits.
In consultation with the business units we are making preparations
for the introduction of NINA and adopting it as the joint approach
to safety.
For more detailed information about SHE-Q, please refer to our
CSR report.
PERSONNEL & ORGANIZATION
INTEGRATION OF STAFF DEPARTMENTS
With effect from 1 January 2012 shore and offi ce staff of SMIT
became part of the Boskalis workforce through a so-called Transfer
of Undertaking. During 2012 all SMIT head offi ce staff relocated
to the offi ce in Papendrecht. They work according to the new
organizational model based on integrated departments. The next
step was to harmonize the HR conditions. In June a proposal to
this effect was submitted to the Works Council, which granted its
consent in September. The subsequent period was spent on
providing information and staff meetings, after which all SMIT
employees in this group were issued with a new employment
contract. The harmonization process allows for a three-year
transition period to the Boskalis system.
In 2012 preparations were made for the integration of MNO Vervat
with the Dutch Boskalis organization which will take further shape
in 2013.
PERSONNEL POLICY
The expansion of our activities, both at sea and onshore, means a
transformation for our company. This also calls for a fundamental
rethink of our strategic staff deployment planning, labor market
policy and conditions of employment. We need more professionals
with different knowledge and expertise for the equipment in our new
Offshore Energy division for example, such as fallpipe vessels,
cable-laying vessels and Diving Support Vessels. The new activities
are compelling us to think further about a tailored personnel
policy. In any case it is placing demands on our training program,
which we are continually developing. It is our policy to use our
own training programs to fast-track staff to the required level. This
applies to shore staff and employees on projects as well as crew
members aboard the ships.
For a more detailed account of our social performance please
refer to our CSR report.
EQUIPMENT
During the year under review the Boskalis and SMIT Fleet
Management departments were combined to form a single
department based at head offi ce. This department is responsible
for the management and maintenance of the dredging fl eet and
the SMIT vessels used for Heavy Lift & Transport. Equipment used
for the terminal and harbour towage activities is managed locally.
Employees of the new Fleet Management department were
already working closely together during 2012 and the move into
the same offi ce in Papendrecht will further encourage cross-
pollination of knowledge between the various teams. The objective
of Fleet Management remains the same: to ensure that the
equipment is reliable and available for deployment on projects.
The fl eet management activities of SMIT Transport Antwerp will
also be integrated in 2013.
Fleet Management is also responsible for carrying out the
newbuild and maintenance program. The Strategy section
provides a summary of the progress on the fl eet investment
program. Fleet Management also sees to it that decommissioned
ships are dismantled in an environmentally friendly way.
RESEARCH AND DEVELOPMENT
Boskalis makes targeted investments in applied (scientifi c) research
and the development of new techniques to keep us ahead of the
fi eld. Innovations in working methods and equipment allow for the
effi cient and sustainable deployment of our people and resources.
New activities we have added to our portfolio in the past few years
call for new ideas and applications or the refi nement of existing
techniques.
DEEP-SEA MINING
Boskalis sees possibilities for mining raw materials from the seabed.
In New Zealand, in tandem with our client and partner Chatham
Rock Phosphate Limited (CRP), we are conducting an engineering
study into phosphate mining. This raw material, a key component
in artifi cial fertilizer, is in increasingly short supply. The agriculture
sector in New Zealand needs a million tonnes of phosphates a

44A
NN
UA
L R
EPO
RT
20
12
— B
OSK
ALI
SR
EPO
RT
OF
THE
BO
AR
D O
F M
AN
AG
EMEN
T
year for fertilization; at present a large part of this is imported.
It would therefore appear that deep-sea mining of this mineral has
great economic potential and offers considerable environmental
benefi ts. Boskalis and CRP are co-developing a technical concept
for profi table and sustainable seabed mining of rock phosphate.
The feasibility study has been completed and the basic engineering
is in a completion phase, in which we are looking at how dredging
equipment and working methods need to be adapted. The results
of this phase, expected in mid-2013, and obtaining the required
legal permits should provide the certainty for future investment
decisions. In 2012 Boskalis acquired a stake of almost 20% in
Chatham Rock Phosphate, which is in turn seeking funding from
private parties for the further elaboration of this promising concept.
APPLYING EXISTING KNOWLEDGE TO NEW ACTIVITIES
Accurate underwater positioning is becoming increasingly
important to our activities. We have built up a great deal of
knowledge and expertise in this area in the course of our
dredging work. Boskalis has teams of surveyors and specialist
equipment at its disposal. We are now rapidly adapting our
organization so that this knowledge can also be applied to our
offshore and cable-laying projects, subsea work and salvage
activities. The new activities are also raising new research
questions, mainly in relation to activities in the Offshore Energy
segment. For example, our knowledge of soil composition,
earthmoving techniques and surveying comes in extremely useful
in connection with the laying of cables and installation of
constructions on the seabed.
SCIENTIFIC RESEARCH
Boskalis has for many years supported fundamental scientifi c
research relevant to our industry, sometimes at sector level, and
sometimes through individual funding of a study. At present there
are various doctorate research projects underway which should
produce interesting fi ndings for our activities. In 2013 a doctorate
study will be completed into the impact of clay jetting; this involves
the draghead of a trailing suction hopper dredger using a high-
pressure jet spray to cut the clay loose. We believe that such
techniques can also be applied to very hard or frozen soil.
Together with Van Oord, IHC and Delft University of Technology
we have launched a study into cutting soil at great depth and thus
under high pressure (hyperbaric conditions) for the purpose of
deep-sea mining. In the context of this same partnership we are
supporting two doctorate research studies into wear and tear of
dredging equipment. The part involving research into the effect of
mixture fl ows on wear and tear started in 2012, with the study into
equipment behavior to follow at a later date.
In the framework of the Dutch government’s top sector policy (Top
Sector Water) Boskalis is also involved in follow-up research to the
Building with Nature innovation program which we supported for
many years. The fi rst study will be into the environmental impact of
projects under extreme conditions. At present there are no clear
rules and guidelines for this. The study will look at how knowledge
of the ecosystem can be translated into an impact assessment, in
order to demonstrate whether a maritime project can be carried
out responsibly.
For a more detailed account of our involvement in scientifi c
research please refer to our CSR report.
ICT
In 2012 a new offi ce building was realized at our head offi ce
site in Papendrecht to accommodate the SMIT offi ce and shore
staff. This group of colleagues started moving in from the summer.
This was also the starting signal for a major internal relocation
process aimed at housing employees according to the integrated
organizational structure. In total some 800-1,000 workstations
were rearranged, including ICT facilities. In the last few months of
the year preparations were made for the forthcoming integration
of the ICT workstations of MNO Vervat.

45
AN
NU
AL
REP
OR
T 2
01
2 —
BO
SKA
LIS
45
AN
NU
AL
REV
IEW
20
12
— B
OSK
ALI
S
Building the seawall at the artifi cial island off Punta Pacifi ca in Panama

46A
NN
UA
L R
EPO
RT
20
12
— B
OSK
ALI
SR
EPO
RT
OF
THE
BO
AR
D O
F M
AN
AG
EMEN
T
In our CSR report we account for material and relevant non-fi nancial aspects of our
performance arising from our strategy and core activities. We report in accordance
with the international guidelines set out by the Global Reporting Initiative (version G3-1).
In selecting the performance indicators and compiling our CSR report, we take the
information requirement of our main stakeholders into account.
Our strategy is aimed at sustainable design and execution of our solutions around the
globe. In order to safeguard our social, societal and environmental responsibility as
much as possible, our CSR policy focuses on the key areas where our impact is greatest:
Our social performance is mainly concerned with our employees, with the objectives
being to promote their safety, opportunities for self-development and well-being.
Our societal performance is expressed in contributions to local communities,
investment in education, research and knowledge transfer, and social sponsorship
and donations.
Our environmental performance is mainly concerned with limiting and preventing a
negative impact on the environment, with objectives being the further expansion of
our environmental expertise, the provision of eco-dynamic designs and the ongoing
investment in and deployment of environmentally friendly equipment.
In 2012 we took part in the CDP (Carbon Disclosure Project) for the fi rst time. Early
2013 Boskalis Nederland reached the highest level of the CO2 performance ladder
(level 5).
The 2012 CSR report (at GRI level B) is available on the corporate website
www.boskalis.com/csr.
Our strategy is aimed at sustainable design and execution of our solutions around the globe.
CORPORATE SOCIAL RESPONSIBILITY
CSD Orion carries out dredging work in preparation of bauxite mining in Suriname
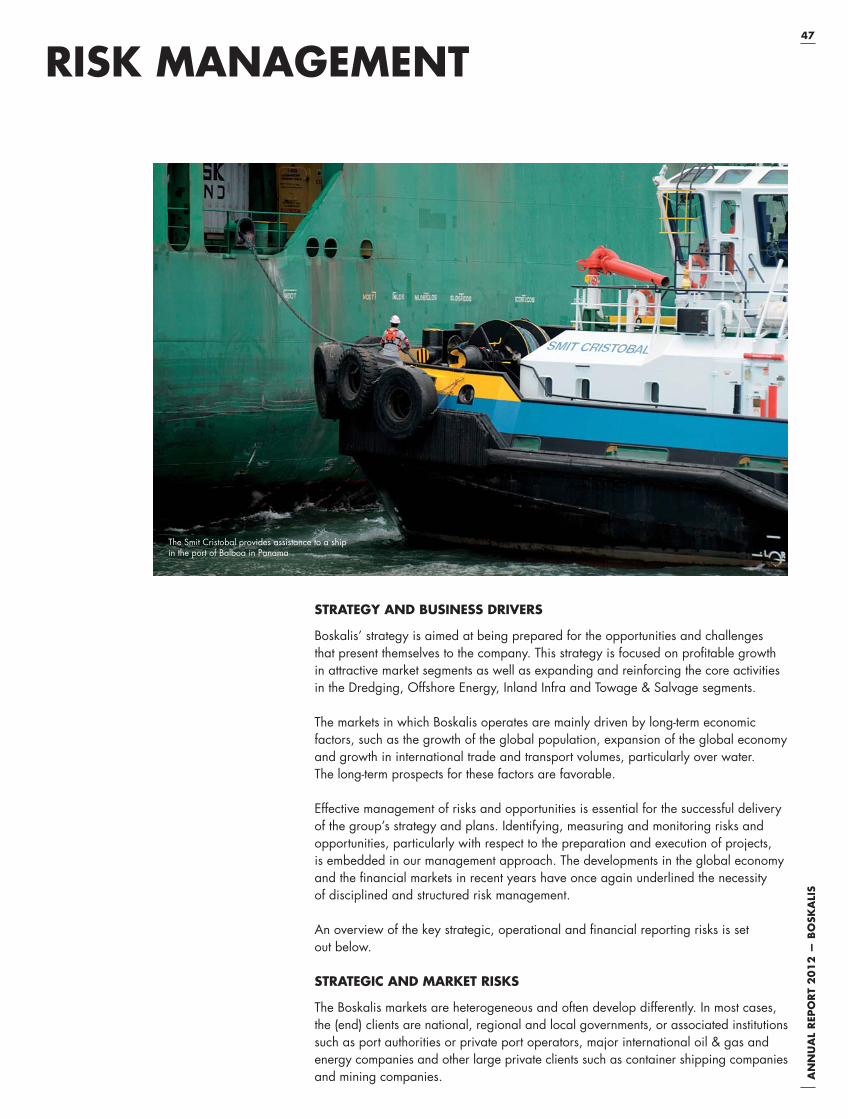
47
AN
NU
AL
REP
OR
T 2
01
2 —
BO
SKA
LIS
STRATEGY AND BUSINESS DRIVERS
Boskalis’ strategy is aimed at being prepared for the opportunities and challenges
that present themselves to the company. This strategy is focused on profi table growth
in attractive market segments as well as expanding and reinforcing the core activities
in the Dredging, Offshore Energy, Inland Infra and Towage & Salvage segments.
The markets in which Boskalis operates are mainly driven by long-term economic
factors, such as the growth of the global population, expansion of the global economy
and growth in international trade and transport volumes, particularly over water.
The long-term prospects for these factors are favorable.
Effective management of risks and opportunities is essential for the successful delivery
of the group’s strategy and plans. Identifying, measuring and monitoring risks and
opportunities, particularly with respect to the preparation and execution of projects,
is embedded in our management approach. The developments in the global economy
and the financial markets in recent years have once again underlined the necessity
of disciplined and structured risk management.
An overview of the key strategic, operational and fi nancial reporting risks is set
out below.
STRATEGIC AND MARKET RISKS
The Boskalis markets are heterogeneous and often develop differently. In most cases,
the (end) clients are national, regional and local governments, or associated institutions
such as port authorities or private port operators, major international oil & gas and
energy companies and other large private clients such as container shipping companies
and mining companies.
RISK MANAGEMENT
The Smit Cristobal provides assistance to a ship in the port of Balboa in Panama

48A
NN
UA
L R
EPO
RT
20
12
— B
OSK
ALI
SR
EPO
RT
OF
THE
BO
AR
D O
F M
AN
AG
EMEN
T
Despite the favorable long-term growth prospects, our markets
may – certainly in the short and medium term – be negatively
impacted by factors outside our control. These include general or
regional geopolitical developments, such as political unrest,
piracy, regime changes, government-imposed trade barriers,
turmoil on financial markets or crises in the fi nancial sector, and
similar developments. Such developments may negatively affect
our activities in certain regions or even globally if they have major
negative consequences for the economic developments in certain
regions or for the global economy, or for exploration and
exploitation activities in the energy products and commodities
markets. Boskalis aims to respond as effectively as possible to both
positive and negative developments in individual market segments
by means of a global spread of its activities, an extensive and
versatile fl eet operating out of various international locations, and
strong positions in our home markets. Moreover, our activities are
largely focused on the development, construction and maintenance
of infrastructure, which means that longer-term developments will
generally outweigh short-term economic fl uctuations.
Boskalis does not include contracts in the order book until agreement
has been reached with the client. Although experience shows that
once agreement has been reached cancellations or substantial
reductions in the size of contracts are rare, such cancellations or
substantial reductions of work in the portfolio cannot be ruled out.
As a consequence, if such cancellation or substantial reduction
occurs, losses may arise from the unwinding or settlement of the
fi nancial derivatives which were taken out to cover the related
currency risks and/or fuel cost risks but for which the underlying
transaction or cash fl ows will no longer be realized.
Boskalis deals with large, internationally operating competitors
as well as more regional and local competitors with activities
restricted to one or several submarkets. In most cases, projects and
service contracts are awarded through public or private tender
procedures. Competition for most contracts is price-based.
However, clients – particularly in the oil & gas sector and private
port operators – are increasingly taking other factors, including
qualitative ones such as assuring safety and environmental
guidelines and policy, into consideration when awarding contracts.
We have appropriate approval processes in place for the
submission of tenders, including the evaluation of identifi ed risks
and/or potential risk factors associated with the execution of a
particular project.
Boskalis’ activities are capital-intensive, with dredging in particular
being a capital-intensive business with high entry and exit barriers,
especially for companies operating globally. Because of the capital-
intensive nature of the activities, market prices are to a great extent
infl uenced by the relationship between the demand for services
and the available capacity or utilization levels of the equipment.
This means that a broad international spread of market positions
as well as a leadership position in terms of equipment, costs and
standardization of equipment are key success factors. Boskalis
places a great deal of emphasis on these, both as a critical point
of attention in operational management and in terms of investment
strategy. A sound evaluation and approval process is in place for
individual investment proposals.
A key principle of our tender policy is to aim for a good balance
in terms of project size and type (Dredging, Offshore Energy,
Inland Infra and Towage & Salvage) and as even as possible a
spread in geographical terms.
In the course of implementing its strategy, Boskalis also acquires
other companies. In order to be able to realize the anticipated
results, Boskalis attaches great importance to integrating such
acquisitions with care. Creating value for our stakeholders and
retaining key personnel are important elements in this process.
OPERATIONAL RISKS
The operational risks faced by Boskalis are varied in nature,
particularly as the group operates in various activity segments
around the world. This means that the activities are exposed to
economic, legal and political risks in the countries where the
company operates.
The main operational risks for Boskalis concern the contracting
and execution of projects for clients, as outlined above. For most
of our activities, particularly in the Dredging, Offshore Energy
(Subsea Contracting and Marine Contracting) and Inland Infra
segments as well as several activities in the Towage & Salvage
segment, such as the salvage of sunken or stranded vessels
(Salvage), the most common contract type is ‘fi xed price/lump sum’.
With this type of contract, the contractor’s price must include
virtually all the operational risks as well as the cost risks associated
with the procurement of materials and subcontractor services.
Normally it is diffi cult or impossible to charge clients for any
unexpected costs arising during the course of a project.
Furthermore, many contracts include ‘milestones’ as well as
associated penalty clauses if they are not achieved. For these
reasons, considerable emphasis is placed on identifying, analyzing
and quantifying operating, cost and delay risks of this kind during
the tendering procedure and when calculating the cost price.
Operational risks mainly relate to unexpected soil and settlement
conditions, variable weather or working conditions, technical
suitability of the equipment, wear and tear on equipment (for
example due to the processing of dredged materials), damage
to third-party equipment and property and the performance of
subcontractors and suppliers. Boskalis focuses on proactively
controlling such risks, fi rst of all by adopting a structured approach
in the tender phase to identify risks and their possible consequences.
Contracts are assigned to various risk categories based on size
and risk profi le. Each risk category has its own specifi c tender
procedures and requirements for authorizing the tender price and
conditions. Above a certain level of risk, these need to be
authorized at Board of Management/Group Director level.
In the preparatory phase of the tender, and depending on the risk
classifi cation and nature of the projects, we use resources such as
subsea and soil investigations, readily accessible databases
containing historical data, and extensive risk analysis techniques.
The results of the risk analysis are then used as a factor in
determining the cost price and/or selling price, and in establishing
the tender and/or contract conditions. When a contract is awarded,
an updated risk analysis is part of the thorough project preparation
process, based upon which concrete actions are taken as
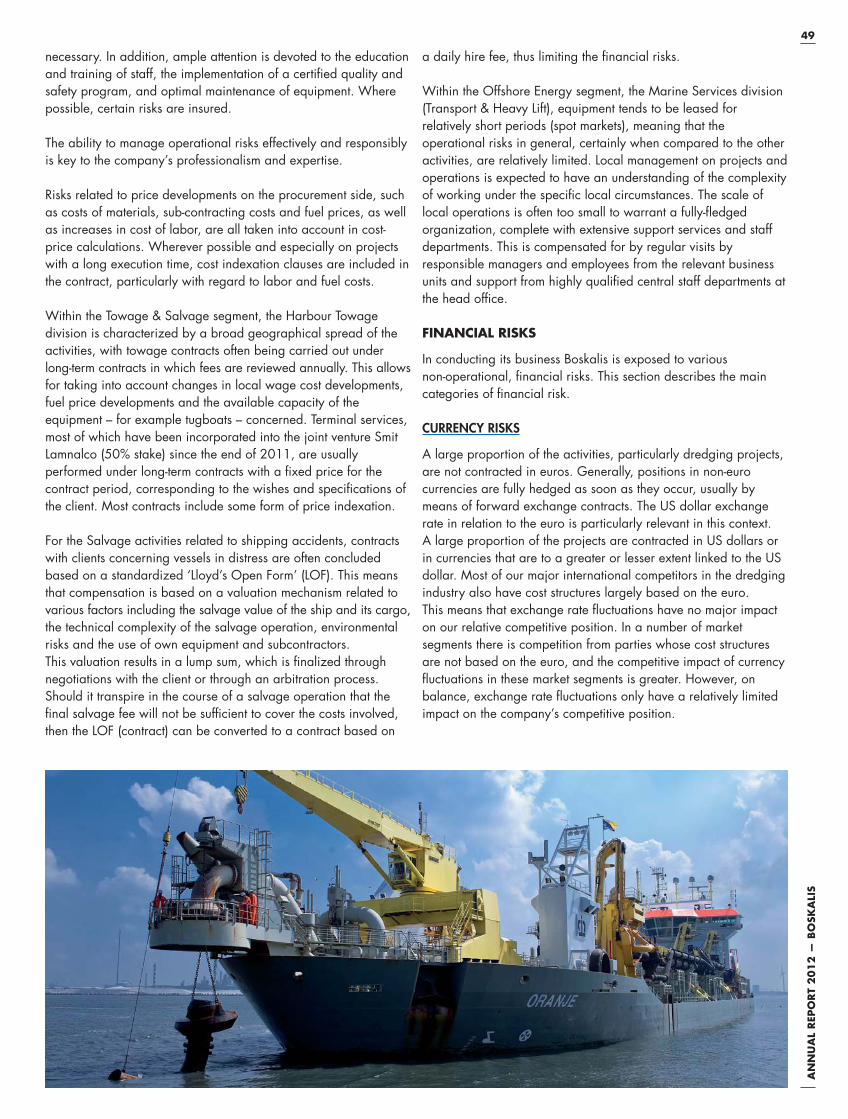
49
AN
NU
AL
REP
OR
T 2
01
2 —
BO
SKA
LIS
necessary. In addition, ample attention is devoted to the education
and training of staff, the implementation of a certifi ed quality and
safety program, and optimal maintenance of equipment. Where
possible, certain risks are insured.
The ability to manage operational risks effectively and responsibly
is key to the company’s professionalism and expertise.
Risks related to price developments on the procurement side, such
as costs of materials, sub-contracting costs and fuel prices, as well
as increases in cost of labor, are all taken into account in cost-
price calculations. Wherever possible and especially on projects
with a long execution time, cost indexation clauses are included in
the contract, particularly with regard to labor and fuel costs.
Within the Towage & Salvage segment, the Harbour Towage
division is characterized by a broad geographical spread of the
activities, with towage contracts often being carried out under
long-term contracts in which fees are reviewed annually. This allows
for taking into account changes in local wage cost developments,
fuel price developments and the available capacity of the
equipment – for example tugboats – concerned. Terminal services,
most of which have been incorporated into the joint venture Smit
Lamnalco (50% stake) since the end of 2011, are usually
performed under long-term contracts with a fi xed price for the
contract period, corresponding to the wishes and specifi cations of
the client. Most contracts include some form of price indexation.
For the Salvage activities related to shipping accidents, contracts
with clients concerning vessels in distress are often concluded
based on a standardized ‘Lloyd’s Open Form’ (LOF). This means
that compensation is based on a valuation mechanism related to
various factors including the salvage value of the ship and its cargo,
the technical complexity of the salvage operation, environmental
risks and the use of own equipment and subcontractors.
This valuation results in a lump sum, which is fi nalized through
negotiations with the client or through an arbitration process.
Should it transpire in the course of a salvage operation that the
fi nal salvage fee will not be suffi cient to cover the costs involved,
then the LOF (contract) can be converted to a contract based on
a daily hire fee, thus limiting the fi nancial risks.
Within the Offshore Energy segment, the Marine Services division
(Transport & Heavy Lift), equipment tends to be leased for
relatively short periods (spot markets), meaning that the
operational risks in general, certainly when compared to the other
activities, are relatively limited. Local management on projects and
operations is expected to have an understanding of the complexity
of working under the specifi c local circumstances. The scale of
local operations is often too small to warrant a fully-fl edged
organization, complete with extensive support services and staff
departments. This is compensated for by regular visits by
responsible managers and employees from the relevant business
units and support from highly qualifi ed central staff departments at
the head offi ce.
FINANCIAL RISKS
In conducting its business Boskalis is exposed to various
non-operational, fi nancial risks. This section describes the main
categories of fi nancial risk.
CURRENCY RISKS
A large proportion of the activities, particularly dredging projects,
are not contracted in euros. Generally, positions in non-euro
currencies are fully hedged as soon as they occur, usually by
means of forward exchange contracts. The US dollar exchange
rate in relation to the euro is particularly relevant in this context.
A large proportion of the projects are contracted in US dollars or
in currencies that are to a greater or lesser extent linked to the US
dollar. Most of our major international competitors in the dredging
industry also have cost structures largely based on the euro.
This means that exchange rate fl uctuations have no major impact
on our relative competitive position. In a number of market
segments there is competition from parties whose cost structures
are not based on the euro, and the competitive impact of currency
fl uctuations in these market segments is greater. However, on
balance, exchange rate fl uctuations only have a relatively limited
impact on the company’s competitive position.

50A
NN
UA
L R
EPO
RT
20
12
— B
OSK
ALI
SR
EPO
RT
OF
THE
BO
AR
D O
F M
AN
AG
EMEN
T
Several important associate companies of Boskalis (Archirodon,
Smit Lamnalco, Keppel Smit Towage, Asian Lift) are largely or
entirely based on the US dollar or Singapore dollar. However, both
the revenue structure and the cost structure of these companies are
also largely or entirely based on these same currencies. These
holdings are viewed from a long-term perspective. Exchange rate
risks related to the investments in these holdings are not hedged as
it is assumed that currency fl uctuations and developments in
interest rates and infl ation will offset each other in the long term.
The income statements of these associate companies are translated
at average exchange rates. Translation differences are charged or
credited directly to shareholders’ equity.
POLITICAL AND CREDIT RISKS
These risks include unrest or disruption due to political
developments and violence, and the risk of non-payment by
clients. Boskalis operates a strict acceptance and hedging policy
with regard to political and payment risks. Except where fi rst-class
clients with an excellent credit rating are involved, these risks are
in principle covered by measures such as credit insurance, bank
guarantees and advance payments. As a matter of principle,
revenue and profi ts are only accounted for once it is suffi ciently
certain they will be realized. In situations where clients take the
form of specially established investment or operating companies
(special purpose vehicles) increased attention is paid to identifying
and managing potentially atypical risks.
FUEL PRICE RISKS
Material fuel costs are hedged in a number of different ways.
Where possible, fuel cost variation clauses are included in the
contract. Some contracts may require fuel to be supplied by the
client. In other cases, where substantial fuel risks exist, these are
usually hedged with fi nancial instruments such as forward
contracts or futures.
Financial derivatives (such as forward contracts, options, interest
rate swaps and futures) are only used to hedge currency risks, fuel
cost risks and/or other risks where there is a physical underlying
transaction. However, there is a risk that, as a consequence of a
cancellation or substantial downsizing of contracts, losses may
arise from the unwinding or settlement of the fi nancial derivatives
taken out to hedge the underlying transaction or cash fl ows which
will now no longer be realized.
LIQUIDITY AND FUNDING RISKS
As is customary in the contracting industry, Boskalis also has large
amounts outstanding in the form of bank guarantees and surety
bonds (guarantees from insurance companies), mainly in favor of
clients. Given that the availability of suffi cient credit and bank
guarantee facilities is essential to the continuity of the business,
Boskalis’ funding policy is aimed at maintaining a solid fi nancial
position. Solid balance sheet ratios and the use of diversifi ed
sources of funding provide for suffi cient capacity to absorb
liquidity risks and guarantee constant availability of adequate
borrowing capacity and guarantee facilities. The company has
ample credit and bank guarantee facilities at its disposal and
operates well within the applicable covenants in fi nancing
agreements. With reference to the developments on the fi nancial
markets, in particular the problems affecting the European banking
sector and the euro, additional specifi c control measures have
been or will be taken if there is reason to do so, particularly with
regard to liquidity management.
INTEREST RATE RISKS
We have limited our exposure to interest rate fl uctuations by
agreeing a fi xed interest rate on our US private placement and
by using interest rate swaps.
DAMAGE AND LIABILITIES
Boskalis has taken out an appropriate package of insurance
facilities to cover its tangible fi xed assets and potential third-party
liabilities.
INTERNAL RISK MANAGEMENT AND CONTROL SYSTEMS
The internal risk management and control systems are based on the
principles of effective management control at various levels in the
organization and tailored to the day-to-day working environment in
which Boskalis operates worldwide. One of the main foundations
for risk control is the internal culture of the company, which is
characterized by a high degree of transparency with regard to
the timely identifi cation, evaluation and reporting of risks and the
avoidance of potentially perverse incentives. Given the hands-on
nature of our company and our short lines of communication, there
are three important factors in assessing and evaluating the internal
risk management and control systems and practices at Boskalis:
1. In our daily operations the backbone of our operational risk
management and control is formed by an extensive framework
of quality assurance rules, procedures and systems, including
clear guidelines for responsibilities, decision making and risk
control. The adequacy of this framework is reviewed regularly,
also in light of the increasing diversity of our contracting and
project activities we perform in line with our strategy. In
addition to audits by external certifi cation agencies, Boskalis
also performs regular internal audits under the auspices of the
SHE-Q department. Reports of these audits are a regular topic
of discussion at meetings between the Board of Management
and the business unit managers.
2. The daily management of the organization is based on clear
responsibilities and short, clear lines of command which are
unambiguously defi ned. Speed, know-how and decisiveness
are of the essence, both competitively and in project implemen-
tation. Daily management is hands-on.
3. The progress and development of the operating results and the
company’s fi nancial position, as well as the operational and
fi nancial risks, are monitored by means of structured periodical
reporting, analysis of the fi nancial results and performance re-
views at Board of Management and senior management levels.

51
AN
NU
AL
REP
OR
T 2
01
2 —
BO
SKA
LIS
RISKS WITH REGARD TO FINANCIAL REPORTING
STRUCTURE OF THE FINANCIAL REPORTING
Financial reporting at Boskalis is structured within a tight framework
of budgeting, reporting and forecasting. A distinction is made
between reports for internal and external use. External reporting
at group level consists of an annual report, including fi nancial
statements audited by the external auditor, as well as a half-yearly
report containing summarized fi nancial information, both
consolidated and segmented. The external reports are set up in
accordance with EU-IFRS on the basis of the internal fi nancial
reporting.
Internal fi nancial reporting or ‘management reporting’ consists
of extensive consolidated quarterly reports in which current
developments are compared to the quarterly (cumulative) budgets.
In addition, each quarter forecasts are drawn up of the annual
results, cash fl ows and balance sheet positions at the end of the
fi nancial year. The quarterly budgets are part of the annual group
budget, which is set every year by the Supervisory Board and
the Board of Management. The internal fi nancial reporting has
a layered structure - in accordance with the internal allocation of
management responsibilities - with consolidation taking place at
successive levels, starting with the projects, through the business
units and divisions and ending with the consolidated group reports.
The fi nancial and operating results are analyzed and clarifi ed at
each of these levels. Project and contract managers are responsible
for budgets, income statements and balance sheets for their projects
or contracts, and these are drawn up in accordance with the
applicable guidelines and instructions. In turn, business unit
managers are responsible for their business unit's fi nancial reports.
Boskalis holds substantial investments in associate companies and
is represented on the board of companies in which it holds
signifi cant participating interests. This gives it access to (interim)
reporting. The fi gures of signifi cant holdings are verifi ed by an
external auditor.
The Board of Management discusses the quarterly reports with
the relevant business unit managers in formal quarterly meetings.
These meetings are minuted. The consolidated group reports are
discussed with the Supervisory Board on a quarterly basis.
The structure and quality of the fi nancial accounting and control
systems of Boskalis and its group companies are assured by
unambiguous periodical internal and external audits. Relevant
aspects of the fi nancial accounting and control systems are set out
in manuals, guidelines and procedures, all of which are available
electronically. Staff are trained in how to apply accounting
standards, guidelines and procedures. Internal audits to monitor
and improve quality and discipline are conducted on the basis of
random and ad hoc investigations (‘fi nancial audits’) that also
encompass internal procedures and training. Moreover, the quality
of the fi nancial control systems is evaluated regularly in the context
of the activities of the external auditors, who report on it in the
management letter.
STATEMENT REGARDING THE RISKS RELATING TO FINANCIAL REPORTING
Despite the risk management and control systems that Boskalis has
put in place, there can be no absolute certainty that mistakes, losses,
fraud or unlawful activities can be prevented.
The effectivesness and functioning of the internal risk management
and control systems have been discussed with the Supervisory
Board. No material changes were introduced in the risk management
and internal control systems during the course of the year under
review. Having considered the structure and operation of the
fi nancial reporting and control systems at Boskalis, the Board of
Management is of the opinion that:
the internal risk management and control systems provide a
reasonable degree of assurance that the financial reporting
does not contain any errors of material importance; and
the risk management and control systems have worked properly
during the year under review.
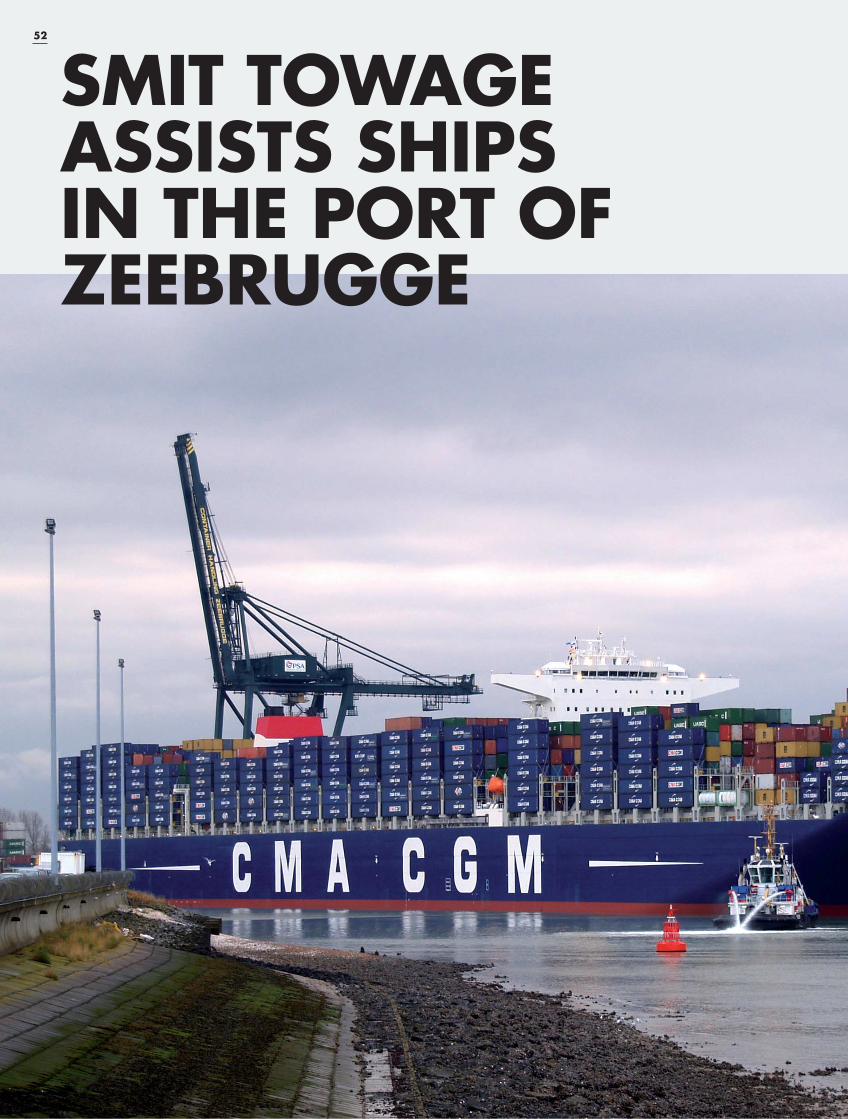
52A
NN
UA
L R
EPO
RT
20
12
— B
OSK
ALI
S52A
NN
UA
L R
EVIE
W 2
01
2—
BO
SKA
LIS
SMIT TOWAGE ASSISTS SHIPS IN THE PORT OF ZEEBRUGGE

53
AN
NU
AL
REP
OR
T 2
01
2 —
BO
SKA
LIS
CA
SE
SMIT Towage Northwest Europe has traditionally held a strong position in
the seaports along the river Scheldt, and in the ports of Rotterdam and
Liverpool, occupying an important position with a fl eet of 50 tugboats. In
late 2011 SMIT won the tender for all towage activities issued by the
Zeebrugge Port Authority (MBZ), making it the only operator licensed to
carry out towage operations in this port for a period of seven years.
Powerful tugsZeebrugge mainly handles large seagoing container vessels, RoRo carriers
and LNG tankers. “In order to cope with the growth in the number of
shipping movements and be able to provide effective assistance to the
increasingly large ships, we have added three heavier tugboats to our
fl eet,” said Mark van Dongen, Manager Commercial at SMIT Towage
Northwest Europe. In all, SMIT operates six tugboats of various power
classes (65-95 ton bollard pull) supported by a fi reboat in the Port of
Zeebrugge, with a total of 60 crew.
The kiwi port of EuropeThe Port of Zeebrugge is able to handle various types of cargo but primarily
holds an important position for fresh foodstuffs, explained Van Dongen.
“Kiwis in particular are supplied through Zeebrugge, which is the offi cial
European distribution center for Zespri kiwis from New Zealand. Which is
why we have named one of our new tugs the Smit Kiwi.”
Ready for the biggest ships“In December the world’s biggest container ship, the CMA/CGM Marco
Polo, sailed into Zeebrugge. At 396 meters long – around four soccer
pitches – and almost 54 meters wide, the Marco Polo’s dimensions are
huge. With a capacity of 16,020 TEU, the ship is capable of loading a
string of containers measuring 97 kilometers. Thanks to our powerful tugs
we were able to assist this ship into the port without any problems.”
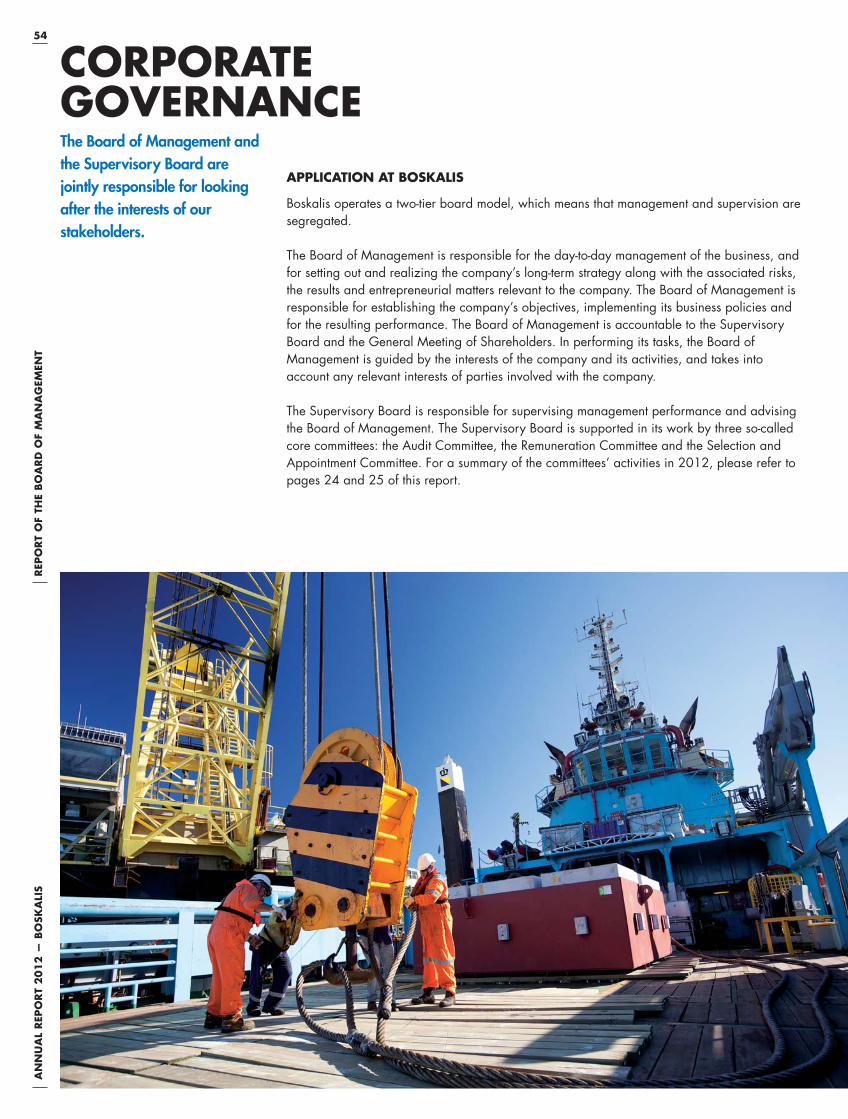
54A
NN
UA
L R
EPO
RT
20
12
— B
OSK
ALI
SR
EPO
RT
OF
THE
BO
AR
D O
F M
AN
AG
EMEN
T
APPLICATION AT BOSKALIS
Boskalis operates a two-tier board model, which means that management and supervision are
segregated.
The Board of Management is responsible for the day-to-day management of the business, and
for setting out and realizing the company’s long-term strategy along with the associated risks,
the results and entrepreneurial matters relevant to the company. The Board of Management is
responsible for establishing the company’s objectives, implementing its business policies and
for the resulting performance. The Board of Management is accountable to the Supervisory
Board and the General Meeting of Shareholders. In performing its tasks, the Board of
Management is guided by the interests of the company and its activities, and takes into
account any relevant interests of parties involved with the company.
The Supervisory Board is responsible for supervising management performance and advising
the Board of Management. The Supervisory Board is supported in its work by three so-called
core committees: the Audit Committee, the Remuneration Committee and the Selection and
Appointment Committee. For a summary of the committees’ activities in 2012, please refer to
pages 24 and 25 of this report.
The Board of Management and the Supervisory Board are jointly responsible for looking after the interests of our stakeholders.
CORPORATE GOVERNANCE
55
AN
NU
AL
REP
OR
T 2
01
2 —
BO
SKA
LIS
At Boskalis there is close collaboration between the Supervisory
Board and its committees, the Board of Management and the
stakeholders. The Board of Management and the Supervisory Board
are jointly responsible for looking after the interests of our stake-
holders, which includes creating shareholder value in the long term.
Our stakeholders are those groups and individuals that directly or
indirectly infl uence the company’s activities, or are infl uenced by
them. They include the employees, shareholders and other fi nanciers,
suppliers, clients, government bodies and the communities in which
Boskalis operates.
At least one General Meeting of Shareholders takes place every
year. Its tasks include the adoption of fi nancial statements and it
holds authority with regard to the appointment and dismissal of
Supervisory Board members.
The interests of employees are promoted by the Works Council,
which provides ongoing employee representation as required
under the Dutch Works Councils Act. It is the task of the Works
Council to ensure that management objectives correspond to those
of the employees.
The general standards and values relating to our business activities
are set out in the Statement of General Business Principles which
can be found on the company’s website. At the beginning of the
year under review this statement was revised, partly to refl ect the UK
Bribery Act coming into force. We have also adopted a Supplier
Code of Conduct. In addition, the core values and rules for safety
at work are set out in our safety program, NINA (No Injuries, No
Accidents). The Board of Management regularly stresses the
importance of complying with the general business principles and
the NINA principles. The Board of Management also provides
employees with the opportunity to report any alleged irregularities
of a general, operational or fi nancial nature to an independent
confi dential counsellor, without jeopardizing their legal position.
COMPLIANCE
Boskalis shares are listed and traded on NYSE Euronext
Amsterdam N.V.
The Dutch Corporate Governance Code (the ‘Code’) applies to all
Dutch companies listed on the stock exchange and comprises a
code of conduct for governance best practice. This Code includes
both specifi c principles and best practice provisions, as well as
guidelines for their proper supervision.
Boskalis subscribes to the notion that a sound and transparent
system of checks and balances is key to maintaining confi dence in
companies operating on the capital market. Boskalis believes
clarity and openness in accountability and supervision are the
cornerstones of good management and entrepreneurship.
As required since the introduction of the Code in 2004, Boskalis
published an ‘Apply or Explain’ report that sets out how the
principles and best practice provisions are applied at Boskalis.
This report is available on the website and copies can also be
requested from the company.
Boskalis subscribes to and applies all the principles and best
practice provisions contained in the Corporate Governance Code,
with the exception of the following provisions:
In deviation of best practice II.1.1., the chairman of the Board
of Management has been appointed for an indefinite period.
This appointment predates the introduction of the Corporate
Governance Code. The contract was also entered into prior to
the introduction of the Corporate Governance Code and applies
for an indefinite period. Boskalis does apply this best practice
provision to the other members as well as new members of the
Board of Management.
The contracts between the company and two members of the
Board of Management deviate from best practice provision II.2.8.
The contract of the chairman provides for a severance payment
equal to 18 months and the contract of the Chief Financial Officer
provides for a 24-month severance payment. Boskalis does apply
this best practice provision to the contracts of all other members
as well as new members of the Board of Management.
The Dutch Act on Management and Supervision came into force
on 1 January 2013. Boskalis has amended the Supervisory Board
regulations and profi le to incorporate both the change with regard
to confl icts of interest and the objective to achieve gender balance
on the Supervisory Board.
The size and composition of the Board of Management are based on
the profi le and strategy of the company. The expertise, experience
and various competencies of the members of the Board of
Management should contribute to this profi le and strategy. In the
year under review the combination of these elements resulted in the
four members of the current Board of Management being male,
meaning that the Board of Management, partly due to the nature of
the company, is a refl ection of the company’s employee population.
When drafting the profi le for new members of the Board of
Management emphasis will be placed on diversity in view of the
objective of achieving a balanced gender representation on the
Board of Management.
The composition and size of the Supervisory Board are based on
the company’s profi le and strategy. As stated in the Profi le drawn
up by the Board of Management, the expertise, experience and
various competencies of members of the Supervisory Board should
contribute to proper supervision of the company’s management and
general performance. In the year under review, the combination of
these elements resulted in the six members of the current
Supervisory Board being male. In view of the objective to achieve
gender balance, the Supervisory Board has added to the Profi le
that every effort will be made to achieve a balanced composition,
where possible in terms of both age and gender. The Supervisory
Board has the specifi c objective of appointing a female member to
its ranks from 2015, or sooner if possible.
When making appointments in the coming reporting year, the
Supervisory Board will take into account the new restrictions on
supervisory roles at large public and private limited companies and
foundations, and will further fl esh out the conditions for agreements
between the company and members of the Board of Management.
The Corporate Governance Declaration can be found on the
corporate website www.boskalis.com.

56A
NN
UA
L R
EPO
RT
20
12
— B
OSK
ALI
SR
EPO
RT
OF
THE
BO
AR
D O
F M
AN
AG
EMEN
T56A
NN
UA
L R
EVIE
W 2
01
2 —
BO
SKA
LIS
REP
OR
T O
F TH
E B
OA
RD
OF
MA
NA
GEM
ENT
OUTLOOK
Capital expenditure for the coming year is expected to be around EUR 325 million, excluding Dockwise.
Dockwise which can be funded from the cash fl ow. The acquisition fi nancing for Dockwise and the
refi nancing of existing Dockwise and Boskalis bank facilities will push up the total debt position.
Subsequent to the (re)fi nancing, Boskalis will retain a solid fi nancial position.
For 2013, we expect that the current market developments will once again have a dampening effect on
the structurally positive trends that underpin our strategy. Current information suggests that the year ahead
will bring little change to the market picture compared to 2012. At Dredging we expect to see healthy
fl eet utilization levels and a stable operating margin development. The same outlook also applies to the
other activities Offshore Energy, Inland Infra and Towage & Salvage.
The project-based nature of a signifi cant part of our activities tends to make it diffi cult to give a specifi c
quantitative forecast of the full-year result early on in the year. In addition the 2013 result will be strongly
infl uenced by the consolidation of Dockwise (from the beginning of the second quarter of 2013), the
possible sale of our 40% stake in Archirodon and the customary exceptional (one-off) effects associated
with an acquisition. In light of these factors we are currently unable to provide quantitative guidance with
regard to the 2013 full-year result.
Beach replenishment work on the Dutch Wadden island of Texel

57
AN
NU
AL
REP
OR
T 2
01
2 —
BO
SKA
LIS
57
AN
NU
AL
REV
IEW
20
12
— B
OSK
ALI
S
The Board of Management of Royal Boskalis Westminster N.V. hereby declares, in accordance with
article 5:25c of the Dutch Financial Supervision Act, that to the best of its knowledge:
(1) the fi nancial statements, which have been prepared in accordance with the applicable standards for
preparing fi nancial statements and as included on pages 61 to 116 of the Annual Report, provide a
true and fair view of the assets, liabilities and fi nancial position as at 31 December 2012 as well as the
profi t or loss of Royal Boskalis Westminster N.V. and all the business undertakings included in the
consolidation;
(2) the annual report provides a true and fair view of the condition, the business performance during the
fi nancial year of Royal Boskalis Westminster N.V. and the companies associated with it whose details
are included in the fi nancial statements, as at the balance sheet date of 31 December 2012;
(3) the annual report provides a description of the material risks faced by the company.
Papendrecht / Sliedrecht, 13 March 2013
Board of Management
dr. P.A.M. Berdowski, chairman
T.L. Baartmans
J.H. Kamps, CFO
F.A. Verhoeven
STATEMENT OF DIRECTORS’ RESPONSIBILITIES
Building a viaduct near Schiphol airport in the Netherlands

58A
NN
UA
L R
EPO
RT
20
12
— B
OSK
ALI
S58A
NN
UA
L R
EVIE
W 2
01
2—
BO
SKA
LIS
SALVAGING THE FLAMINIA A JOB SKILLFULLY DONE
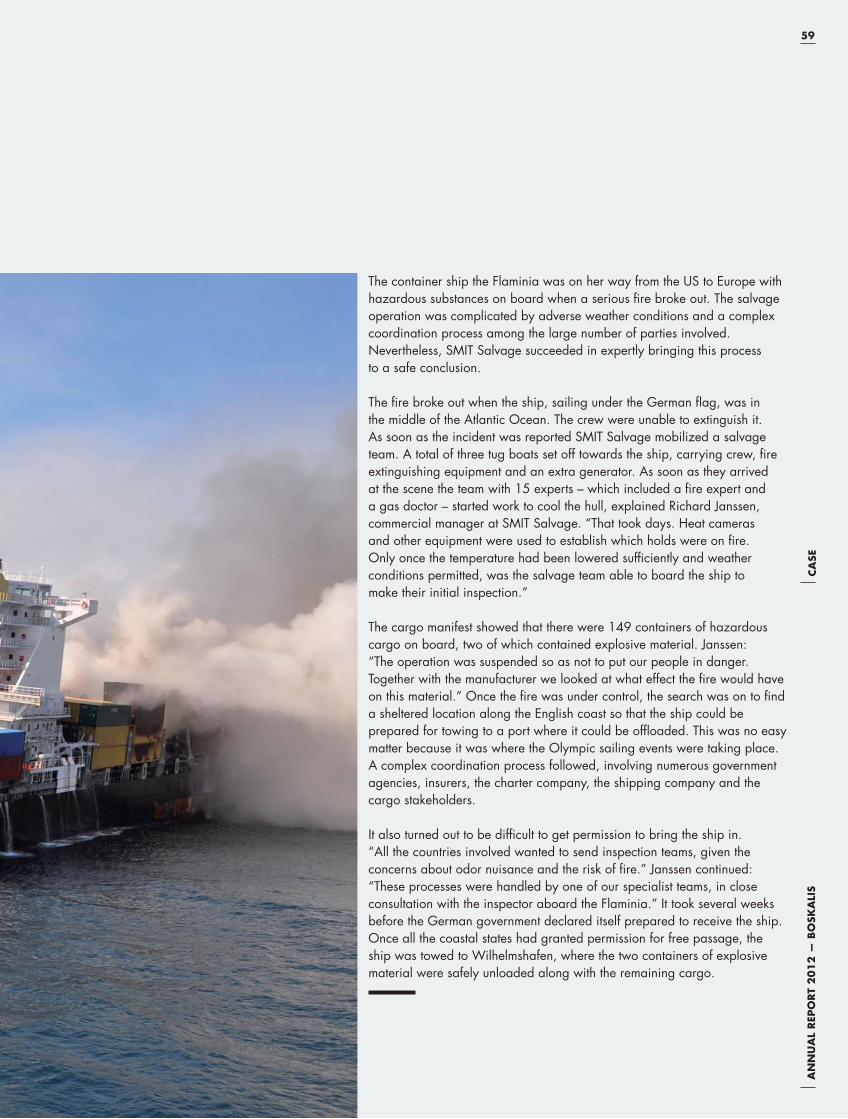
59
AN
NU
AL
REP
OR
T 2
01
2 —
BO
SKA
LIS
CA
SE
The container ship the Flaminia was on her way from the US to Europe with
hazardous substances on board when a serious fi re broke out. The salvage
operation was complicated by adverse weather conditions and a complex
coordination process among the large number of parties involved.
Nevertheless, SMIT Salvage succeeded in expertly bringing this process
to a safe conclusion.
The fi re broke out when the ship, sailing under the German fl ag, was in
the middle of the Atlantic Ocean. The crew were unable to extinguish it.
As soon as the incident was reported SMIT Salvage mobilized a salvage
team. A total of three tug boats set off towards the ship, carrying crew, fi re
extinguishing equipment and an extra generator. As soon as they arrived
at the scene the team with 15 experts – which included a fi re expert and
a gas doctor – started work to cool the hull, explained Richard Janssen,
commercial manager at SMIT Salvage. “That took days. Heat cameras
and other equipment were used to establish which holds were on fi re.
Only once the temperature had been lowered suffi ciently and weather
conditions permitted, was the salvage team able to board the ship to
make their initial inspection.”
The cargo manifest showed that there were 149 containers of hazardous
cargo on board, two of which contained explosive material. Janssen:
“The operation was suspended so as not to put our people in danger.
Together with the manufacturer we looked at what effect the fi re would have
on this material.” Once the fi re was under control, the search was on to fi nd
a sheltered location along the English coast so that the ship could be
prepared for towing to a port where it could be offl oaded. This was no easy
matter because it was where the Olympic sailing events were taking place.
A complex coordination process followed, involving numerous government
agencies, insurers, the charter company, the shipping company and the
cargo stakeholders.
It also turned out to be diffi cult to get permission to bring the ship in.
“All the countries involved wanted to send inspection teams, given the
concerns about odor nuisance and the risk of fi re.” Janssen continued:
“These processes were handled by one of our specialist teams, in close
consultation with the inspector aboard the Flaminia.” It took several weeks
before the German government declared itself prepared to receive the ship.
Once all the coastal states had granted permission for free passage, the
ship was towed to Wilhelmshafen, where the two containers of explosive
material were safely unloaded along with the remaining cargo.

60A
NN
UA
L R
EPO
RT
20
12
— B
OSK
ALI
SSU
MM
ARY
FIN
AN
CIA
L IN
FOR
MA
TIO
N 2
01
260A
NN
UA
L R
EVIE
W 2
01
2 —
BO
SKA
LIS
SUM
MA
RY
FIN
AN
CIA
L IN
FOR
MA
TIO
N 2
01
2The new fallpipe vessel Rockpiper at a quarry in Norway

6161
BOSKALISFINANCIAL STATEMENTS 2012
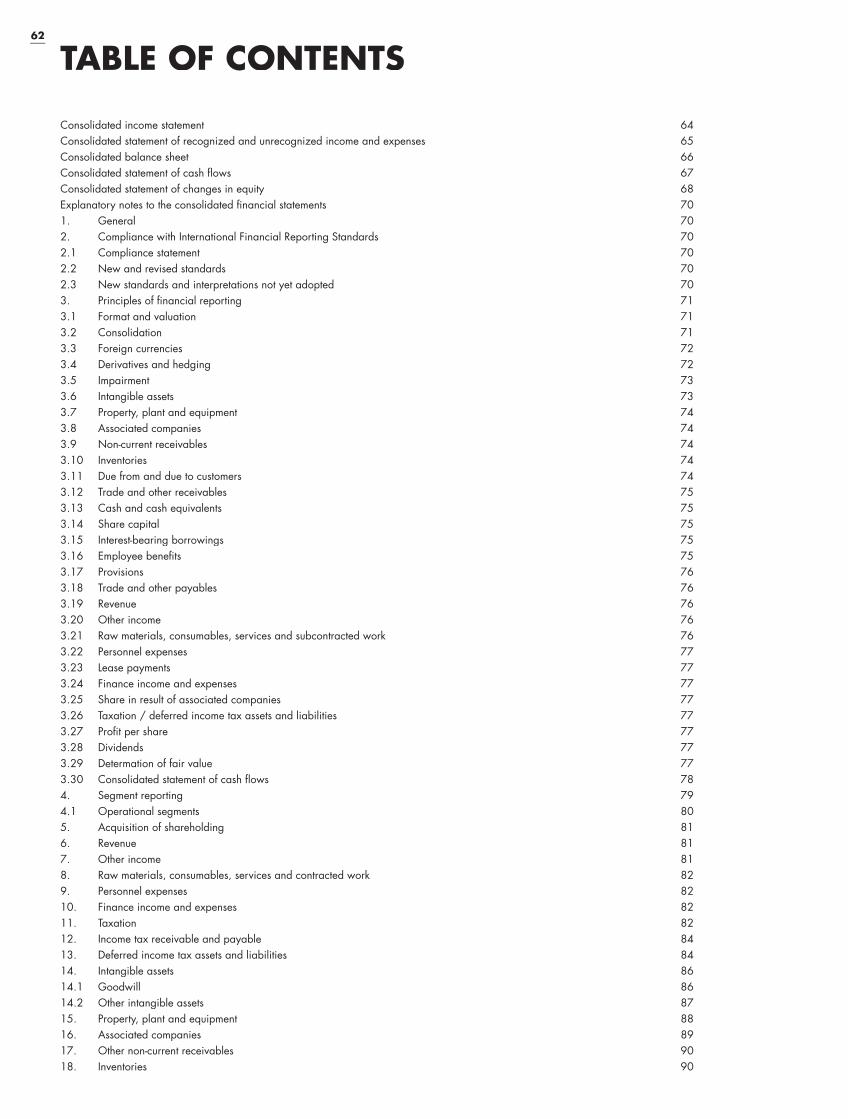
62
TABLE OF CONTENTS
Consolidated income statement 64
Consolidated statement of recognized and unrecognized income and expenses 65
Consolidated balance sheet 66
Consolidated statement of cash fl ows 67
Consolidated statement of changes in equity 68
Explanatory notes to the consolidated fi nancial statements 70
1. General 70
2. Compliance with International Financial Reporting Standards 70
2.1 Compliance statement 70
2.2 New and revised standards 70
2.3 New standards and interpretations not yet adopted 70
3. Principles of fi nancial reporting 71
3.1 Format and valuation 71
3.2 Consolidation 71
3.3 Foreign currencies 72
3.4 Derivatives and hedging 72
3.5 Impairment 73
3.6 Intangible assets 73
3.7 Property, plant and equipment 74
3.8 Associated companies 74
3.9 Non-current receivables 74
3.10 Inventories 74
3.11 Due from and due to customers 74
3.12 Trade and other receivables 75
3.13 Cash and cash equivalents 75
3.14 Share capital 75
3.15 Interest-bearing borrowings 75
3.16 Employee benefi ts 75
3.17 Provisions 76
3.18 Trade and other payables 76
3.19 Revenue 76
3.20 Other income 76
3.21 Raw materials, consumables, services and subcontracted work 76
3.22 Personnel expenses 77
3.23 Lease payments 77
3.24 Finance income and expenses 77
3.25 Share in result of associated companies 77
3.26 Taxation / deferred income tax assets and liabilities 77
3.27 Profi t per share 77
3.28 Dividends 77
3.29 Determation of fair value 77
3.30 Consolidated statement of cash fl ows 78
4. Segment reporting 79
4.1 Operational segments 80
5. Acquisition of shareholding 81
6. Revenue 81
7. Other income 81
8. Raw materials, consumables, services and contracted work 82
9. Personnel expenses 82
10. Finance income and expenses 82
11. Taxation 82
12. Income tax receivable and payable 84
13. Deferred income tax assets and liabilities 84
14. Intangible assets 86
14.1 Goodwill 86
14.2 Other intangible assets 87
15. Property, plant and equipment 88
16. Associated companies 89
17. Other non-current receivables 90
18. Inventories 90
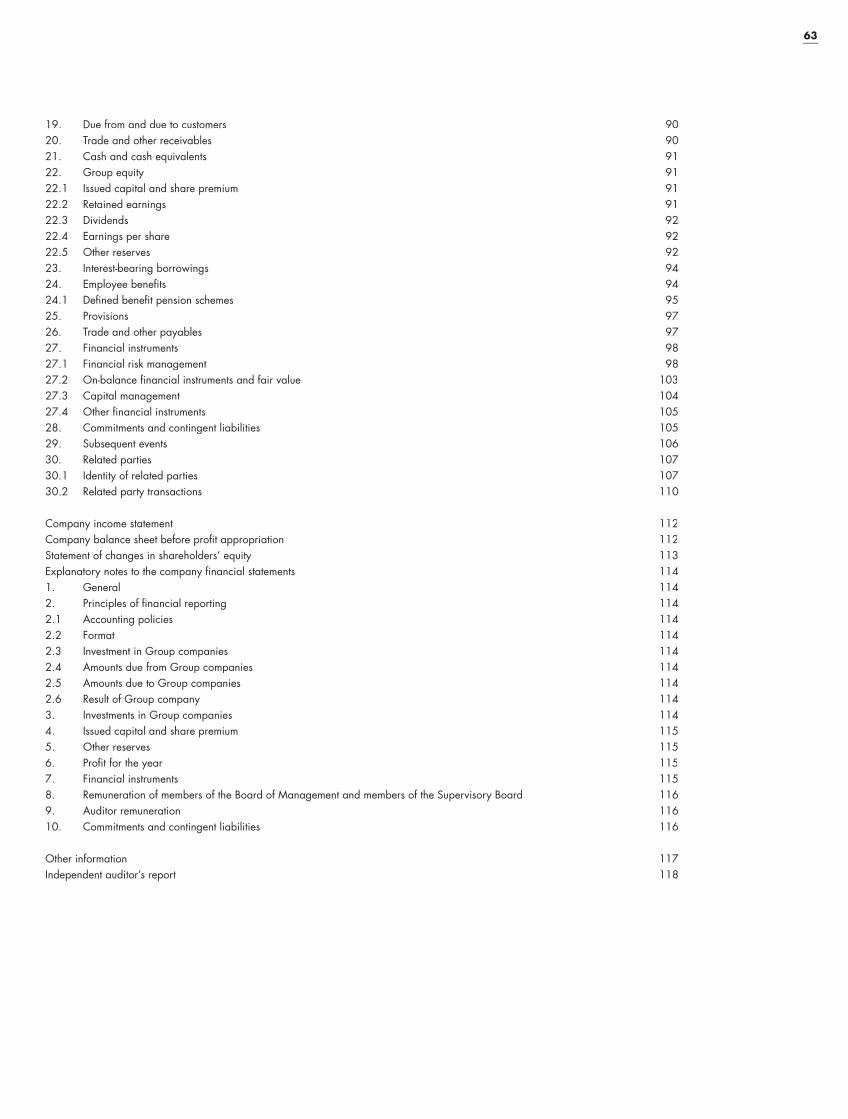
63
19. Due from and due to customers 90
20. Trade and other receivables 90
21. Cash and cash equivalents 91
22. Group equity 91
22.1 Issued capital and share premium 91
22.2 Retained earnings 91
22.3 Dividends 92
22.4 Earnings per share 92
22.5 Other reserves 92
23. Interest-bearing borrowings 94
24. Employee benefi ts 94
24.1 Defi ned benefi t pension schemes 95
25. Provisions 97
26. Trade and other payables 97
27. Financial instruments 98
27.1 Financial risk management 98
27.2 On-balance fi nancial instruments and fair value 103
27.3 Capital management 104
27.4 Other fi nancial instruments 105
28. Commitments and contingent liabilities 105
29. Subsequent events 106
30. Related parties 107
30.1 Identity of related parties 107
30.2 Related party transactions 110
Company income statement 112
Company balance sheet before profi t appropriation 112
Statement of changes in shareholders’ equity 113
Explanatory notes to the company fi nancial statements 114
1. General 114
2. Principles of fi nancial reporting 114
2.1 Accounting policies 114
2.2 Format 114
2.3 Investment in Group companies 114
2.4 Amounts due from Group companies 114
2.5 Amounts due to Group companies 114
2.6 Result of Group company 114
3. Investments in Group companies 114
4. Issued capital and share premium 115
5. Other reserves 115
6. Profi t for the year 115
7. Financial instruments 115
8. Remuneration of members of the Board of Management and members of the Supervisory Board 116
9. Auditor remuneration 116
10. Commitments and contingent liabilities 116
Other information 117
Independent auditor’s report 118

64A
NN
UA
L R
EPO
RT
20
12
— B
OSK
ALI
S64
(in thousands of EUR) Note 2012 2011
OPERATING INCOME
Revenue [6] 3,080,862 2,801,037
Other income [7] 14,460 8,780
3,095,322 2,809,817
OPERATING EXPENSES
Raw materials, consumables, services and subcontracted work [8] - 1,947,497 - 1,669,675
Personnel expenses [9] - 579,658 - 549,661
Depreciation, amortization and impairment losses [14/15] - 231,310 - 236,388
- 2,758,465 - 2,455,724
OPERATING RESULT 336,857 354,093
FINANCE INCOME AND EXPENSES
Finance income [10] 14,968 22,987
Finance expenses [10] - 49,448 - 63,355
- 34,480 - 40,368
Share in result of associated companies (after taxation) [16] 252 2,020
PROFIT BEFORE TAXATION 302,629 315,745
Taxation [11] - 49,502 - 54,735
NET GROUP PROFIT 253,127 261,010
NET GROUP PROFIT ATTRIBUTABLE TO:
Shareholders 250,193 254,254
Non-controlling interests 2,934 6,756
253,127 261,010
Average number of shares [22.4] 105,644,024 102,390,642
Earnings per share [22.4] EUR 2.37 EUR 2.48
Diluted earnings per share [22.4] EUR 2.37 EUR 2.48
The notes on pages 70 to 111 are an integral part of these consolidated fi nancial statements.
CONSOLIDATED INCOME STATEMENT

65
AN
NU
AL
REP
OR
T 2
01
2 —
BO
SKA
LIS
(in thousands of EUR) Note 2012 2011
NET GROUP PROFIT FOR THE PERIOD 253,127 261,010
UNRECOGNIZED INCOME AND EXPENSES FOR THE PERIOD
Currency translation differences on foreign operations - 2,976 - 823
Actuarial gains and losses and asset limitation on defined benefit pension schemes [24.1] - 34,322 - 58,789
Movement in fair value of cash flow hedges [27.2] - 18,988 6,074
Income tax on unrecognized income and expenses [13] 11,601 10,847
Unrecognized income and expenses for the period, net of income tax - 44,685 - 42,691
TOTAL RECOGNIZED AND UNRECOGNIZED INCOME AND EXPENSES FOR THE PERIOD 208,442 218,319
ATTRIBUTABLE TO:
Shareholders 203,686 212,528
Non-controlling interests 4,756 5,791
TOTAL RECOGNIZED AND UNRECOGNIZED INCOME AND EXPENSES FOR THE PERIOD 208,442 218,319
The notes on pages 70 to 111 are an integral part of these consolidated fi nancial statements.
CONSOLIDATED STATEMENT OF RECOGNIZED AND UNRECOGNIZED INCOME AND EXPENSES
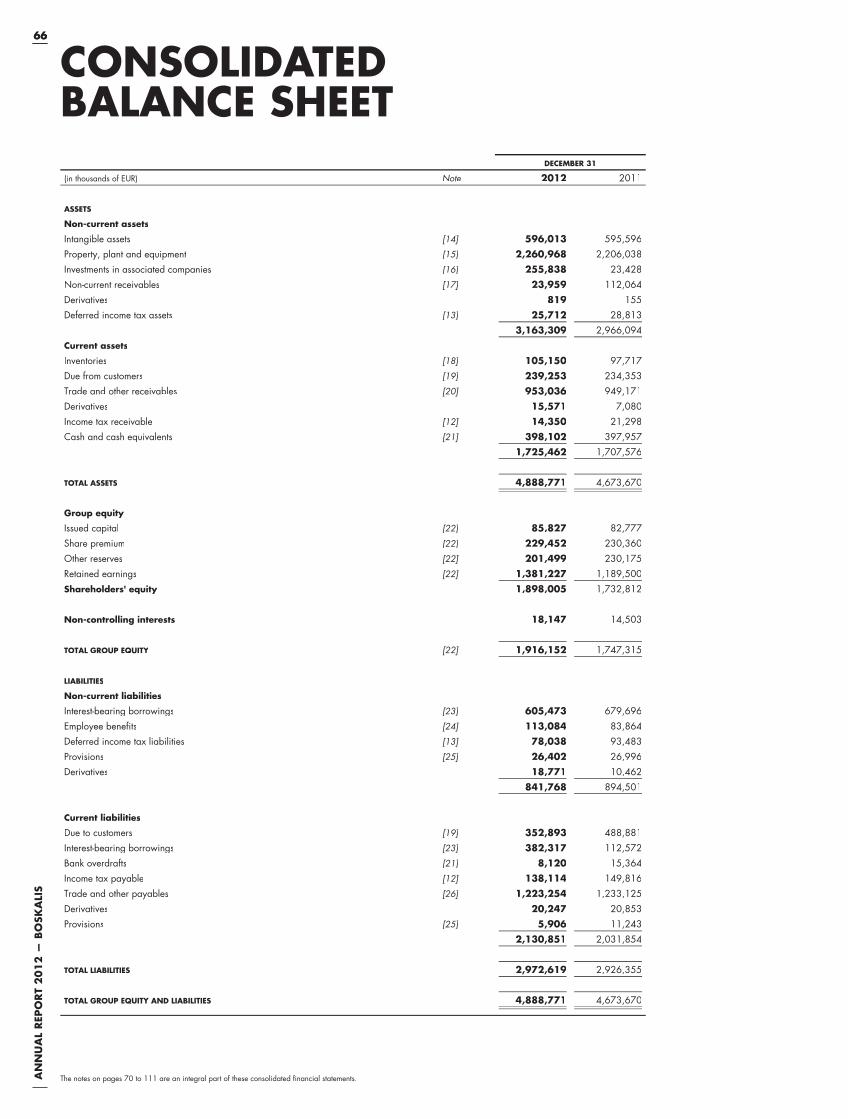
66A
NN
UA
L R
EPO
RT
20
12
— B
OSK
ALI
S66
DECEMBER 31
(in thousands of EUR) Note 2012 2011
ASSETS
Non-current assets
Intangible assets [14] 596,013 595,596
Property, plant and equipment [15] 2,260,968 2,206,038
Investments in associated companies [16] 255,838 23,428
Non-current receivables [17] 23,959 112,064
Derivatives 819 155
Deferred income tax assets [13] 25,712 28,813
3,163,309 2,966,094
Current assets
Inventories [18] 105,150 97,717
Due from customers [19] 239,253 234,353
Trade and other receivables [20] 953,036 949,171
Derivatives 15,571 7,080
Income tax receivable [12] 14,350 21,298
Cash and cash equivalents [21] 398,102 397,957
1,725,462 1,707,576
TOTAL ASSETS 4,888,771 4,673,670
Group equity
Issued capital [22] 85,827 82,777
Share premium [22] 229,452 230,360
Other reserves [22] 201,499 230,175
Retained earnings [22] 1,381,227 1,189,500
Shareholders' equity 1,898,005 1,732,812
Non-controlling interests 18,147 14,503
TOTAL GROUP EQUITY [22] 1,916,152 1,747,315
LIABILITIES
Non-current liabilities
Interest-bearing borrowings [23] 605,473 679,696
Employee benefits [24] 113,084 83,864
Deferred income tax liabilities [13] 78,038 93,483
Provisions [25] 26,402 26,996
Derivatives 18,771 10,462
841,768 894,501
Current liabilities
Due to customers [19] 352,893 488,881
Interest-bearing borrowings [23] 382,317 112,572
Bank overdrafts [21] 8,120 15,364
Income tax payable [12] 138,114 149,816
Trade and other payables [26] 1,223,254 1,233,125
Derivatives 20,247 20,853
Provisions [25] 5,906 11,243
2,130,851 2,031,854
TOTAL LIABILITIES 2,972,619 2,926,355
TOTAL GROUP EQUITY AND LIABILITIES 4,888,771 4,673,670
The notes on pages 70 to 111 are an integral part of these consolidated fi nancial statements.
CONSOLIDATEDBALANCE SHEET

67
AN
NU
AL
REP
OR
T 2
01
2 —
BO
SKA
LIS
(in thousands of EUR) Note 2012 2011
CASH FLOWS FROM OPERATING ACTIVITIES
Net group profit 253,127 261,010
Depreciation, amortization and impairment losses 231,310 236,388
Cash flow 484,437 497,398
Adjustments for:
Finance income and expenses 34,480 40,368
Taxation 49,502 54,735
Results from disposals of property, plant and equipment - 11,094 - 4,101
Movement non-current receivables 10,959 5,488
Movement provisions (including direct equity movements) - 7,899 - 20,712
Movement in inventories - 5,647 - 4,635
Movement trade and other receivables 10,093 - 64,014
Movement trade and other payables - 57,588 72,505
Movement due from and due to customers - 149,833 - 14,390
Result of associated companies - 252 - 2,020
Cash generated from operating activities 357,158 560,622
Dividends received 2,109 729
Interest received 8,576 8,324
Interest paid - 38,842 - 44,578
Income taxes paid - 50,181 - 75,915
Net cash from operating activities 278,820 449,182
CASH FLOWS FROM INVESTING ACTIVITIES
Purchases of intangible assets and property, plant and equipment, excluding capitalizedborrowing costs - 313,893 - 293,326
Proceeds from disposals of property, plant and equipment 39,447 35,831
Investment in group companies, net of cash acquired — - 105,256
Disposal of (a part of) group companies, net of cash disposed and loans issued — 82,953
Repayment of outstanding loan by joint venture 77,299 —
Net investments in associated companies - 232,664 1,772
Net cash used in investing activities - 429,811 - 278,026
CASH FLOWS FROM FINANCING ACTIVITIES
Proceeds from loans 696,403 529,088
Repayment of loans - 495,413 - 607,195
Transaction costs paid relating to the arrangement of credit facilities - 2,226 - 2,149
Net investment in non-controlling interests 10 - 19,939
Dividends paid to the Company's shareholders - 38,493 - 44,686
Dividends paid to non-controlling interests - 1,122 - 5,673
Net cash used in / from financing activities 159,159 - 150,554
NET INCREASE IN CASH AND CASH EQUIVALENTS 8,168 20,602
Net cash and cash equivalents as at January 1 [21] 382,593 356,269
Net increase in cash and cash equivalents 8,168 20,602
Currency translation differences - 779 5,722
MOVEMENT IN NET CASH AND CASH EQUIVALENTS 7,389 26,324
NET CASH AND CASH EQUIVALENTS AS AT DECEMBER 31 [21] 389,982 382,593
The notes on pages 70 to 111 are an integral part of these consolidated fi nancial statements.
CONSOLIDATED STATEMENT OF CASH FLOWS

68A
NN
UA
L R
EPO
RT
20
12
— B
OSK
ALI
S68
(in thousands of EUR)ISSUED
CAPITALSHARE
PREMIUMOTHER
RESERVESRETAINED
EARNINGS TOTAL
NON-CONTROLLING
INTEREST
TOTALGROUPEQUITY
Note [22.1] [22.1] [22.5] [22.2]
Balance as at January 1, 2012 82,777 230,360 230,175 1,189,500 1,732,812 14,503 1,747,315
TOTAL RECOGNIZED AND UNRECOGNIZED INCOMEAND EXPENSES FOR THE PERIOD
Net group profit for the period 250,193 250,193 2,934 253,127
Unrecognized income and expenses for theperiod
Foreign currency translation differencesfor foreign operations, after taxation - 4,974 — - 4,974 1,822 - 3,152
Effective cash flow hedges, after taxation - 14,239 — - 14,239 — - 14,239
Defined benefit plan actuarial gains (losses) andasset limitation, after taxation - 27,294 — - 27,294 — - 27,294
Realization through sale of underlying asset - 716 716 — — —
Movement other legal reserve 18,547 - 18,547 — — —Total unrecognized income and expenses for
the period - 28,676 - 17,831 - 46,507 1,822 - 44,685
Total recognized and unrecognized incomeand expenses for the period - 28,676 232,362 203,686 4,756 208,442
TRANSACTIONS WITH SHAREHOLDERS,RECOGNIZED DIRECTLY IN EQUITY
Distributions to shareholders
Cash dividend — — — - 38,493 - 38,493 - 1,122 - 39,615
Stock dividend 3,050 - 908 — - 2,142 — — —
Movements in interests in subsidiaries
New in consolidation — — — — — 10 10
Total transactions with shareholders 3,050 - 908 — - 40,635 - 38,493 - 1,112 - 39,605
Balance as at December 31, 2012 85,827 229,452 201,499 1,381,227 1,898,005 18,147 1,916,152
The notes on pages 70 to 111 are an integral part of these consolidated fi nancial statements.
CONSOLIDATED STATEMENT OF CHANGES IN EQUITY

69
AN
NU
AL
REP
OR
T 2
01
2 —
BO
SKA
LIS
(in thousands of EUR)ISSUED
CAPITALSHARE
PREMIUMOTHER
RESERVESRETAINED
EARNINGS TOTAL
NON-CONTROLLING
INTEREST
TOTALGROUPEQUITY
Note [22.1] [22.1] [22.5] [22.2]
Balance as at January 1, 2011 80,779 231,335 150,803 1,102,053 1,564,970 34,324 1,599,294
TOTAL RECOGNIZED AND UNRECOGNIZED INCOMEAND EXPENSES FOR THE PERIOD
Net group profit for the period 254,254 254,254 6,756 261,010
Unrecognized income and expenses for theperiod
Foreign currency translation differencesfor foreign operations, after taxation 2,373 — 2,373 - 965 1,408
Effective cash flow hedges, after taxation 5,153 — 5,153 — 5,153
Defined benefit plan actuarial gains (losses)and asset limitation, after taxation - 49,252 — - 49,252 — - 49,252
Revaluation existing participation prior to businesscombination with SMIT 17,316 - 17,316 — — —
Movement other legal reserve 103,782 - 103,782 — — —
Total unrecognized income and expenses
for the period 79,372 - 121,098 - 41,726 - 965 - 42,691
Total recognized and unrecognized incomeand expenses for the period 79,372 133,156 212,528 5,791 218,319
TRANSACTIONS WITH SHAREHOLDERS,RECOGNIZED DIRECTLY IN EQUITY
Distributions to shareholders
Cash dividend — — — - 44,686 - 44,686 - 5,673 - 50,359
Stock dividend 1,998 - 975 — - 1,023 — — —
Movements in interests in subsidiaries
New in consolidation — — — — — 6 6
Non-controlling interest in Smit Internationale N.V. — — — — — -19,945 -19,945
Total transactions with shareholders 1,998 -975 — -45,709 -44,686 -25,612 -70,298
Balance as at December 31, 2011 82,777 230,360 230,175 1,189,500 1,732,812 14,503 1,747,315
The notes on pages 70 to 111 are an integral part of these consolidated fi nancial statements.
70A
NN
UA
L R
EPO
RT
20
12
— B
OSK
ALI
S
EXPLANATORY NOTESTO THE CONSOLIDATED FINANCIAL STATEMENTS
1. GENERAL
Royal Boskalis Westminster N.V. is a leading global services
provider operating in the dredging, dry and maritime
infrastructure and maritime services sectors. Royal Boskalis
Westminster N.V. (the ‘company’) has its registered office in
Sliedrecht, the Netherlands, and its head office is located in
Papendrecht, the Netherlands. The company is a public
limited company listed on the NYSE Euronext Amsterdam
stock exchange. The consolidated financial statements of
Royal Boskalis Westminster N.V. for 2012 include the
company and group companies (hereinafter referred to
jointly as the ‘Group’ and individually as the ‘Group entities’)
and the interests of the Group in associated companies and
entities over which it has joint control.
The consolidated financial statements were prepared by the
Board of Management and have been signed on March 13,
2013. The financial statements 2012 will be submitted for
approval to the Annual General Meeting of Shareholders of
May 8, 2013.
2. COMPLIANCE WITH INTERNATIONAL FINANCIAL REPORTING STANDARDS
2.1 COMPLIANCE STATEMENTThe consolidated financial statements and the accompanying
explanatory notes have been prepared in accordance with
the International Financial Reporting Standards (IFRS), as
adopted by the European Union, and with Part 9 of Book 2
of the Dutch Civil Code.
2.2 NEW AND REVISED STANDARDSThere are no standards, amendments to standards and
interpretations, that are being applied for the first time in
2012 and that have a significant effect on the financial
statements.
2.3 NEW STANDARDS AND INTERPRETATIONS NOT YET ADOPTEDThe following standards, amendments to standards and
interpretations, are not effective in 2012 and / or not yet
endorsed by the European Committee. They have therefore
not been applied in these consolidated fi nancial statements.
Based on the current insights, the Group does not plan to
adopt these standards and interpretations early and the
extent of the possible impact has not been determined. The
most important possible changes for the Group can be
summarized as follows:
The new IAS 19 Employee Benefits includes a number
of changes with respect to the recognition, presentation
and disclosure, which should make pensionreporting
less complex and more comparable. Key change for the
Group comprises that the expected return on plan assets
and the interest cost on the pensionobligation should be
based on the IAS 19-discount rate (which is derived from
a high quality corporate bond rate) and the disclosure
requirements, mainly related to specific pensionrisks are
strongly extended. If IAS 19R was already applied in 2012,
this would have had a negative effect on Net Group Profit of
EUR 1.1 million.
IFRS 9 Financial instruments: classification and
measurement, has an effective date for annual periods
starting on or after January 1, 2015 with earlier
application being permitted.
IFRS 10 Consolidated financial statements replaces all
the guidance on control and consolidation in IAS 27
and SIC 12. IFRS 10 introduces a single consolidation
model based on control, irrespective the type of entity to
be consolidated. The consequences of the modifications,
which have an effective date for annual periods starting
on or after January 1, 2014, are under review, but are
expected to be not material.
IFRS 11 Joint arrangements revises the accounting for joint
ventures (in the new standard called “joint arrangements”).
Most important change is that for joint arrangements the
option of applying the “equity” method or proportional
consolidation is removed; only the equity method can be
applied for joint ventures and joint operations should be
consolidated proportionally. IFRS 11 and the amended IAS
28 are effective for annual periods beginning on or after
January 1, 2014. The impact of these modifications are
under review, but are expected to be not material on the
net group profit.
IFRS 12 Disclosure of interests in other entities includes the
disclosure requirements for subsidiaries, associates and
joint arrangements, as well as unconsolidated structured
entities. IFRS 12 is effective for annual periods beginning
on or after January 1, 2014. The consequences of the
modifications are under review.
IFRS 13 Fair value measurement establishes a framework
for measuring fair value and sets out disclosure
requirements for fair value measurements, but does not
introduce new fair value measurements.
The amendments in IAS 1 Presentation of items of other
comprehensive income require that an entity presents
separately the items of other comprehensive income that
would be reclassified to profit or loss in the future from
those that would never be reclassified to profit or loss. The
possible consequences of these modifications, which are
effective for annual periods beginning on or after July 1,
2012, are still under review.
71
AN
NU
AL
REP
OR
T 2
01
2 —
BO
SKA
LIS
3 PRINCIPLES OF FINANCIAL REPORTING
The principles for financial reporting subsequently disclosed
are applied consistently for all periods included in these
consolidated financial statements and have been applied
consistently by the Group entities.
3.1 FORMAT AND VALUATIONThe consolidated financial statements are drawn up in euros,
the Group’s functional currency. The consolidated financial
statements are based upon historical cost to the extent that
IFRS does not prescribe another accounting method for
specific items. Preparing financial statements means that
estimates and assumptions made by the management partly
determine the recognized amounts under assets, liabilities,
revenues and costs. The estimates and assumptions are
mainly related to the measurement of intangible assets
(including goodwill), property, plant and equipment, results
on completion of work in progress, pension liabilities,
taxation, provisions and financial instruments. Judgements
made by management within the application of IFRS with an
material effect on the financial statements are the
qualifications of investments as Group companies, joint
ventures or associated companies. Details are incorporated in
the explanatory notes to these items. Next to the elements
already explained in the explanantory notes to the financial
statements, there are no other critical valuation judgements in
the application of the principles that need further explanation.
The estimates made and the related assumptions are based
on management’s experience and understanding and the
development of external factors that can be considered
reasonable under the given circumstances. Estimates and
assumptions are subject to alterations as a result of changes
to facts and understanding and may have different outcomes
per reporting period. Any differences are recognized in the
balance sheet or income statement, depending on the nature
of the item. The actual results may deviate from results
reported previously on the basis of estimates and assumptions.
Unless stated otherwise, all amounts in the notes in these
financial statements are stated in thousands of euros.
3.2 CONSOLIDATION
3.2.1. BUSINESS COMBINATIONS AND ACQUISITIONS OF NON-CONTROLLING INTERESTSBusiness combinations are accounted for using the acquisition
method as at the acquisition date, which is the date on which
control is transferred to the Group. Control is the power to
govern the financial and operating policies of an entity so as
to obtain benefits from its activities. In assessing control, the
Group takes into consideration potential voting rights that
currently are exercisable.
The Group measures goodwill at the acquisition date as:
the fair value of the consideration transferred; plus
the recognized amount of any non-controlling interests in
the acquiree; plus
if the business combination is achieved in stages, the fair
value of the existing equity interest in the acquiree; less
the net recognized amount (generally fair value) of the
identifiable assets acquired and liabilities assumed.
When the excess is negative, a bargain purchase gain is
recognised immediately in the income statement.
The consideration transferred does not include amounts related
to the settlement of preexisting relationships. Such amounts are
recognised in the income statement. Costs related to the
acquisition, other than those associated with the issue of debt
or equity securities, that the Group incurs in connection with
a business combination are expensed as incurred.
Accounting for acquisitions of non-controlling interestsAcquisitions of non-controlling interests are accounted for
as transactions with owners in their capacity as owners
and therefore no goodwill is recognised as a result of
such transactions.
3.2.2 GROUP COMPANIESGroup companies are included in the consolidation for
100% on the basis of existing control, taking into account
any minority interests. The financial statements of Group
companies are included in the consolidated financial
statements from the date that control commences until the
date that control ceases.
On the loss of control, the Group derecognises the assets and
liabilities of the subsidiary, any non-controlling interests and
the other components of equity related to the subsidiary. Any
surplus or deficit arising on the loss of control is recognised
in the income statement. If the Group retains any interest in
the previous subsidiary, then such interest is measured at fair
value at the date that control is lost. Subsequently it is
accounted for as a joint venture or as an associated company
depending on the level and nature of influence retained.
3.2.3 JOINT VENTURESJoint ventures are those entities over which the Group has joint
control, whereby this control has been laid down in a contract
and strategic decisions on financial and operational policy are
taken by unanimous agreement. Joint ventures, both strategic
alliances and contractual project-driven construction
consortiums, are included in the consolidation on a
proportional basis in accordance with the share in joint
control. Amounts receivable from and payable to project-driven
construction consortiums are eliminated in the consolidation.
Elimination differences as a result of imbalances between
partners in current account relation with project-driven
construction consortiums are recognized in the consolidated
balance sheet under other receivables or other creditors.

72A
NN
UA
L R
EPO
RT
20
12
— B
OSK
ALI
S
3.2.4 ASSOCIATED COMPANIESShareholdings that are not eligible for consolidation based
on control, but where there is significant influence on the
financial and operating policy, are recognized under
associated companies. Significant influence is presumed to
exist when the Group holds 20 percent or more of the voting
power of another entity. The consolidated financial
statements include the Group’s share in the result of
associated companies, after adjustments to align the
accounting policies with those of the Group, from the date
that significant influence commences until the date that
significant influence ceases (see note 3.8).
3.2.5 ELIMINATION OF TRANSACTIONS UPON CONSOLIDATIONIntragroup receivables and payables, as well as intragroup
transactions and finance income and expenses and
unrealized results within the Group and with associated
companies and joint ventures, are eliminated in preparing
the consolidated financial statements to the extent of the
Group’s share in the entity.
3.3 FOREIGN CURRENCIESThe assets and liabilities of foreign Group companies and
joint ventures that are denominated in functional currencies
other than the euro have been translated at the exchange
rates as at the end of the reporting period. The income
statement items of the foreign Group companies and joint
ventures concerned have been translated at average
exchange rates, which approximate the applicable exchange
rates at transaction settlement date. Resulting currency
translation differences are added or charged directly to the
currency translation reserve in group equity. Exchange rate
differences as a result of operational transactions are included
in the consolidated income statement of the reporting period.
At the end of each reporting period, monetary items
denominated in foreign currencies are translated at the rates
prevailing at that date. The foreign currency gain or loss on
monetary items is the difference between amortized cost in
the functional currency at the beginning of the year, adjusted
for effective interest and payments during the year, and the
amortized cost in foreign currency translated at the exchange
rate at the end of the year. Non-monetary items that are
measured in terms of historical cost in a foreign currency are
translated using the exchange rate at the date of the
transaction. Foreign currency differences on non-current
receivables, loans and other borrowings are recognized as
finance income and expenses; other foreign currency
differences as a result of transactions are recognized in the
related items within the operating result.
3.4 DERIVATIVES AND HEDGINGIt is the policy of the Group to use cash flow hedges to cover
all operational currency risks that mainly relate to future
cash flows from contracts that are highly probable and
that are denominated in currencies other than the relevant
functional currency. Fuel price risks and interest rate risks
in future cash flows can be hedged from time to time using
specific derivatives.
Hedge accounting is applied to the majority of cash flow
hedges as follows. On initial designation of the hedge, the
Group formally documents the relationship between the
hedging instrument(s) and hedged item(s), including the risk
management objectives and strategy in undertaking the
hedge transaction, together with the methods that will be
used to assess the effectiveness of the hedging relationship.
The Group makes an assessment, both at the inception of the
hedge relationship as well as on an ongoing basis, whether
the hedging instruments are expected to be “effective” in
offsetting the changes in the fair value or cash flows of the
respective hedged items during the period for which the
hedge is designated, and whether the actual results of each
hedge are within a range of 80 - 125 percent. For a cash
flow hedge of a forecast transaction, the transaction should
be highly probable to occur and should present an exposure
to variations in cash flows that could ultimately affect
reported net income.
The application of hedge accounting means that movements
in the market value of cash flow hedges not yet settled –
including results realized on the “rolling forward” of existing
hedges as a result of differences between the duration of the
hedges concerned and the underlying cash flows – will be
directly added or charged to the hedging reserve in group
equity, taking taxation into account. If a cash flow hedge
added or charged to the group equity either expires, is closed
or is settled, or the hedge relation with the underlying cash
flows can no longer be considered effective, the accumulated
result will continue to be recognized in group equity as long
as the underlying cash flow is still expected to take place.
When the underlying cash flow actually takes place, the
accumulated result is included directly in the income statement.
Movements in the market value of cash flow hedges to which
no hedge accounting is applied (ineffective cash flow hedges
and the ineffective portion of effective cash flow hedges) are
included in the income statement for the reporting period.
Results from settled effective cash flow hedges and the
movements in the market value of ineffective cash flow
hedges insofar these relate to non-current receivables, loans
and other borrowings are recognized as finance income and
finance expenses and otherwise in the related items within
operating result. The purchase or sale of financial instruments
is generally recorded at transaction rate. Derivatives y
are stated at fair value; attributable transaction costs are
recognized in the income statement as incurred. Subsequent
to initial recognition, derivatives are measured at fair value,
and changes therein are accounted for as described.
73
AN
NU
AL
REP
OR
T 2
01
2 —
BO
SKA
LIS
3.5 IMPAIRMENTThe book value of the assets of the Group, excluding
inventories, assets arising from employee benefits and
deferred income tax assets is reviewed at each balance
sheet date to determine whether there is any indication of
impairment. If any such indication exists, an estimate of the
realizable amount of the asset is made. For goodwill, assets
with an indefinite useful life, the realizable amount is
estimated annually. An impairment loss is recognized when
the book value of an asset or its cash-generating unit to which
it belongs exceeds its realizable amount.
Impairment losses are recognized in the income statement.
Impairment losses recognized in respect of cash generating
units are allocated first to reduce the book value of any cash-
generating units (or groups of units) goodwill and then
proportionally deducted from the book value of the assets of
the unit (or group of units).
The realizable amount of receivables accounted for at
amortized cost is calculated as the present value of expected
future cash flows, discounted at the effective interest rate. For
the other assets or cash generating units, the realizable
amount equals the fair value less costs to sell or value,
whichever is higher. In determining the value, the present
value of estimated future cash flows is calculated using a
discount rate that reflects current market assessments of the
time value of money and the risks specific to the asset.
Indications of impairment of floating and other construction
material are based on long-term expectations for the utilization
of equipment or of interchangeable equipment. If there is any
indication of impairment, the realizable value of the asset
concerned is determined on the basis of the net realizable
value or present value of the estimated future cash flows.
In respect of goodwill no impairment losses are reversed.
An impairment loss in respect of an receivable account for
at amortized cost is reversed if the reversal can be related
objectively to an event occurring after the impairment loss
was recorded. For other assets, impairment losses are
reversed if the estimates used to determine the realizable
amount give cause to do so, but only to the extent that the
book value of the asset does not exceed the book value net
of depreciation or amortization that would have applied if
no impairment loss had been recognized.
3.6 INTANGIBLE ASSETSGoodwill arises upon acquiring Group companies, joint
ventures and associated companies and is calculated as the
difference between the acquisition price and the fair value of
the assets and liabilities acquired, according to the accounting
principles of Royal Boskalis Westminster N.V. The goodwill
has been allocated to the cash generating unit representing
the lowest level within the Group at which the goodwill is
monitored for internal management purposes, which does not
exceed the level of the Group’s operating units. Goodwill
and other intangible assets are capitalized net of accumulated
amortization and accumulated impairment losses. Goodwill
and intangible assets with an infinite useful life are not
systematically amortized, but are tested for impairment every
year or in case of an indication for impairment (see note 3.5).
Negative goodwill that may arise upon acquisition is added
directly to the income statement. In respect of associated
companies, the book value of goodwill is included in the
book value of the investment.
Other intangible assets are capitalized only when it is
probable that future economic benefits embodied in an asset,
will flow to the Group and the cost of the asset can be reliably
measured. Other intangible assets with a finite useful life are
stated at cost less accumulated amortization and
accumulated impairment losses. Amortization of trademarks
valued at acquisition takes place over four years, the
amortization of customer portfolios and contracts valued
at acquisition takes place over seven to thirteen years.
Expenditure on research activities, undertaken with the
prospect of gaining new scientific or technical knowledge
and understanding, is expensed as incurred. Development
expenditure is capitalized when material. Development
activities are particularly related to investments in dredging
equipment. The limited costs for research and development
are by their nature directly charged to the income statement.
74A
NN
UA
L R
EPO
RT
20
12
— B
OSK
ALI
S
3.7 PROPERTY, PLANT AND EQUIPMENTProperty, plant and equipment are stated at cost price less
accumulated depreciation calculated from the date of
commissioning and accumulated impairment losses. The cost
price is based on the purchase price and / or the internally
generated cost based on directly attributable expenses. The
depreciation, allowing for an assumed residual value, is
calculated over the estimated remaining useful lives assigned
to the various categories of assets. Modifications and
capacity enhancing investments are also capitalized at cost
and amortized over the remaining life of the asset. Property,
plant and equipment under construction are included in the
balance sheet on the basis of installments paid, including
interest during construction. Where property, plant and
equipment consist of components with different useful lives,
they are accounted for as separate items.
Buildings are depreciated over periods ranging from ten to
fifty years. The depreciation periods of the majority floating
and other construction materials ranges from ten to twenty
years. Furnitures and other fixed assets are depreciated over
a period between three and ten years. Land is not depreciated.
The wear of dredging equipment is highly dependent on
unpredictable project-specific combinations of soil conditions,
material to be processed, maritime circumstances, and the
intensity of the deployment of the equipment. As a result of
this erratic and time-independent patterns, the maintenance
and repair expenses for upkeep the assets are charged to
the income statement. In exceptional cases, maintenance
and repair expenses are eligible for capitalization and linear
depreciation.
Upon its disposal the revaluation surplus of an item of
property, plant and equipment is transferred from the
revaluation reserve to the retained earnings.
Methods for depreciation, useful life and residual value are
reassessed at the end of each financial year and amended
if necessary.
Leases in terms of which the Group assumes substantially all
the risks and rewards of ownership are classified as finance
leases. Upon initial recognition the leased asset is measured
at an amount equal to the lower of its fair value and the
present value of the minimum lease payments. Subsequent to
initial recognition, the asset is accounted for in accordance
with the accounting policy applicable to that asset.
Other leases are operating leases and are not recognised in
the Group’s consolidated balance sheet.
3.8 ASSOCIATED COMPANIESAssociated companies are initially recognized at cost
including the goodwill determined at acquisition date.
Subsequently accounted companies are accounted for using
the equity method, adjusted for differences with the
accounting principles of the Group, less any accumulated
impairment. When the Group’s share of losses exceeds the
book value of the associated company, the book value is
reduced to zero and recognition of further losses is
discontinued except to the extent that the Group has incurred
legal or constructive obligations or made payments on behalf
of the associated company.
3.9 NON-CURRENT RECEIVABLESThe non-current receivables are mainly held on a long-term
basis and/or until maturity and are carried at amortized
cost. Accumulated impairment losses are deducted from the
book value.
3.10 INVENTORIESInventories, which mainly consist of fuel, auxiliary materials
and spare parts, are stated at the lower of cost and net
realizable value. Net realizable value is the estimated selling
price in the ordinary course of business, less the estimated
costs of selling.
3.11 DUE FROM AND DUE TO CUSTOMERSDue from and due to customers concerns the gross amount yet
to be charged which is expected to be received from
customers for contractual work done up to the reporting date
(hereinafter: “work in progress”) and services rendered
(mainly salvage work). Work in progress is valued at the cost
price of the work done, plus a part of the expected results
upon completion of the project in proportion to the progress
made and less progress billings, advances and possible
provisions for losses. Provisions are recognized for expected
losses on work in progress as soon as they are foreseen, and
deducted from the cost price; if necessary, any profits already
recognized are reversed. Revenues from additional work are
included in the overall contract revenues if the client has
accepted the sum involved in any way. Claims and incentives
are carried in construction work in progress if negotiations
with the customer are in a sufficiently advanced stage. The
cost price includes project costs, consisting of payroll costs,
materials, costs of subcontracted work, rental charges and
maintenance costs for the equipment used and other project
costs. The rates used are based on the expected average
occupation in the long run. The progress of a project is
determined on the basis of the cost of the work done in
relation to the expected cost price of the project as a whole.
Profits are not recognized unless a reliable estimate can be
made of the result on completion of the project. The balance
of the value of work in progress, progress billings and
advance payments is determined per project. For projects
where the progress billings and advance payments exceed
the value of work in progress, the balance is recognized
under current liabilities instead of under current assets. The
respective balance sheet items are “due from customers for
work in progress” and “due to customers”.
Salvage work that is completed at the balance sheet date, but
for which the proceeds are not yet finally determined between
parties, is recognized at expected proceeds taking into
account the estimation uncertainty less progress billings and
advances. If the revenue of a completed salvage contract
cannot be estimated reliably, revenue is recognized to the

75
AN
NU
AL
REP
OR
T 2
01
2 —
BO
SKA
LIS
maximum of the extent of the recognized expenses. For
expected losses on salvage work, provisions are recognized
as soon as they are foreseen.
3.12 TRADE AND OTHER RECEIVABLESTrade and other receivables are stated initially at fair value
and subsequently at amortized cost less accumulated
impairment losses, such as doubtful debts. Amortized cost is
determined using the effective interest rate.
3.13 CASH AND CASH EQUIVALENTSCash and cash equivalents consist of cash and bank
balances and deposits with terms of no more than three
months. The explanatory notes disclose the extent to which
cash and cash equivalents are not freely available as a result
of transfer restrictions, joint control or other legal restrictions.
Bank overdrafts are included as a component of cash and
cash equivalents for the purpose of the consolidated
statement of cash flows.
3.14 SHARE CAPITALOrdinary shares are classified as equity. Incremental costs
directly attributable to the issue of ordinary shares are
recognized as a deduction from equity, net of any tax effects.
3.15 INTEREST-BEARING BORROWINGSInterest-bearing borrowings are liabilities to financial
institutions. At initial recognition, interest-bearing borrowings
are stated at fair value less transaction costs. Subsequently,
interest-bearing borrowings are stated at amortized cost with
any difference between cost and redemption value being
recognized in the income statement over the period of the
borrowings on an effective interest basis.
3.16 EMPLOYEE BENEFITSDefi ned contribution pension schemes
A defined contribution pension scheme is a post-employment
benefit scheme under which an entity pays fixed contributions
into a separate entity. The entity will have no legal or
constructive obligation to pay further amounts if the pension
fund has insufficient funds to pay employee benefits in
connection with services rendered by the employee in the
current of prior periods. Obligations for contributions to
defined contribution pension schemes are recognized as an
employee benefit expense as part of the personnel expenses
in the income statement when they are due. Prepaid
contributions are recognized as an asset to the extent that a
cash refund or a reduction in future payment is available.
Contributions to a defined contribution pension sheme
payable more than twelve months after the period during
which the employee rendered the services, are discounted.
Defi ned benefi t pension schemes
A defined benefit pension scheme is every post-employment
benefit scheme other than a defined contribution scheme. For
each separate defined benefit pension scheme, the net asset
or liability is determined as the balance of the discounted
value of the future payments to employees and former
employees, less the fair value of plan assets. The calculations
are done by qualified actuaries using the projected unit
credit method. The discount rate equals the yield on high
quality corporate bonds as at the balance sheet date, with
the period to maturity of the bonds approximating the
duration of the liability. If the calculation results in a positive
balance for the group, the asset is included up to an amount
equal to any unrecognized past service pension costs and
the discounted value of economic benefits in the form of
possible future refunds or lower future pension premiums from
the fund. In calculating the discounted value of economic
benefits, the lowest possible financing obligations are taken
into account as applicable to the individual schemes in force
within the group. An economic benefit is receivable by the
Group if it can be realized within the period to maturity of
the scheme or upon settlement of the scheme’s obligations.
Actuarial gains and losses, including any movements in
limitations on the net pension assets, are recognized in the
unrecognized results within the Consolidated statement of
recognized and unrecognized income and expenses. Past
service costs are charged to the income statement on a
straight-line basis over the average period until the benefits
become vested, insofar as the benefits are not granted
unconditionally.
Short-term employee benefi ts
Short-term employee benefit obligations are measured on an
undiscounted basis and are expensed as the related service
is provided.
A liability is recognized for the amount expected to be paid
under short-term cash bonus or profit-sharing plans if the
Group has a present legal or constructive obligation to pay
this amount as a result of past services provided by the
employee, and the obligation can be estimated reliably.
Other long-term employee benefi ts
The other long-term employee benefits consist mainly of
jubilee benefits. The calculation of these liabilities is executed
according to the ‘projected unit method’ using the actuarial
assumptions for the predominant defined benefit scheme.
Share-based remuneration plans
Member of the Board of Management are granted a bonus
scheme that is based on the development of the share price,
whereby the bonus is distributed in cash. The fair value of the
amount payable over the year, is recognised as personnel
expenses in the income statement, with a corresponding
increase in liabilities. The liability is remeasured each
reporting date and at settlement date. Any changes in the
fair value of the liability are recognised as personnel
expenses in the income statement.

76A
NN
UA
L R
EPO
RT
20
12
— B
OSK
ALI
S
3.17 PROVISIONSProvisions are determined on the basis of estimates of future
outflows of economic benefits relating to operational activities
for legal or constructive obligations of an uncertain size or
with an uncertain settlement date that arise from past events
and for which a reliable estimate can be made. Provisions
are discounted insofar as the difference between the
discounted value and nominal value is material. Provisions,
if applicable, relate to reorganization, warranties, provisions
for unfavarouble contracts and onerous contracts, legal
proceedings and submitted claims. Provisions for
reorganization costs are recognized when a detailed and
formal plan is announced at balance sheet date to all those
concerned or when the execution of the plan has commenced.
Provisions for warranties are recognized for warranty claims
relating to completed projects with agreed warranty periods
applying to some of the consolidated/proportionally
consolidated entities. The book value of these provisions is
based on common practice in the industry and the company’s
history of warranty claims over the past ten years for relevant
projects.
A provision for onerous contracts is recognized when the
expected benefits to be derived by the Group form a contract
are lower than the unavoidable cost of meeting its
obligations under the contract.
In accordance with the Group’s policy and applicable legal
requirements, a provision for site restoration in respect of
contaminated land, and the related expenses, is recognized
when the land is contaminated.
3.18 TRADE AND OTHER PAYABLESTrade and other payables are recognized initially at fair
value and subsequently at (amortized) cost. Insofar as the
difference between the discounted and nominal value is not
material, trade and other payables are stated at cost.
3.19 REVENUERevenu of the operational segments Dredging, Offshore
Energy and Inland Infra mainly consists of the cost price of
the work done during the reporting period, plus a part of the
expected results upon completion of the project in proportion
to the progress made during the reporting period, and
including and/or deducting the provisions recognized and/
or used and released during the reporting period for
expected losses. Revenues from additional work are included
in the overall contract revenues if the client has accepted the
sum involved in any way. Claims and incentives are carried
in construction work in progress if negotiations with the
customer are in a sufficiently advanced stage. The applied
“percentage-of-completion” method is, by its nature, based
on an estimation process. Revenue also includes services
rendered to third parties during the reporting period. The
revenue from services relates in particular to activities of
Harbour Towage and to hire or to make available equipment
and/or personnel and this revenue is recognized in the
income statement in proportion to the stage of completion
of the work performed at the reporting date. The stage of
completion is determined based on assessments of the work
performed. Revenue from salvage work that is completed at
the balance sheet date (part of the operational segment
Towage & Salvage), but for which the proceeds are not
finally determined between parties, is recognized at
expected proceeds taking into account the estimation
uncertainty. When it is uncertain whether the economic
benefits of work done or services rendered will flow to the
Group, the relevant revenue is not recognized.
Revenue does not include any direct taxes.
3.20 OTHER INCOMEOther income mainly consists of book profits from disposals
and insurance results.
77
AN
NU
AL
REP
OR
T 2
01
2 —
BO
SKA
LIS
3.21 RAW MATERIALS, CONSUMABLES, SERVICES ANDCONTRACTED WORKRaw materials, consumables, services and contracted work
consist of the cost price of the work done during the reporting
period, excluding personnel expenses, amortization and
depreciation. This item also includes among others equipment
utilization costs, cost of operational leases, general overhead
costs, external costs for research and development where not
capitalized, currency translation differences, fair value
changes of derivatives and other results/late results.
3.22 PERSONNEL EXPENSESPersonnel expenses consist of wages and salaries for own
personnel and the related social security charges and pension
costs, including paid and accrued contributions for defined
pension contribution plans and the movement in the assets and
liabilities from defined benefit plans, excluding actuarial gains
and losses and the limitation on net pension plan assets added
or charged directly to group equity.
3.23 LEASE PAYMENTSPayments made under operating leases are recognised in
profit or loss on a straight-line basis over the term of the
lease. Lease incentives received are recognised as an
integral part of the total lease expense, over the term of
the lease. Minimum lease payments made under finance
leases are apportioned between the finance expense and the
reduction of the outstanding liability. The finance expense is
allocated to each period during the lease term so as to
produce a constant periodic rate of interest on the remaining
balance of the liability.
3.24 FINANCE INCOME AND EXPENSESFinance income comprises interest received and receivable
from third parties, currency gains and gains on financial
instruments to hedge risks of which the results are recognized
through the finance income and expenses. Interest income is
recognized in the income statement as it accrues, using the
effective interest rate method.
Finance costs include interest paid and payable to third
parties, which are allocated to reporting using the effective
interest method, currency losses, arrangement fees, and losses
on financial instruments used to hedge risks of which the
results are recognized through the finance income and
expenses. The interest component of financial lease payments
is recognized in the income statement using the effective
interest rate method.
Borrowing costs not directly attributable to the acquisition,
construction or production of a qualifying asset are
recognized in the income statement.
3.25 SHARE IN RESULT OF ASSOCIATED COMPANIESShare in result of associated companies comprises the share
in the results after taxation of the participating interests not
included in the consolidation and, if applicable, (the reversal
of) impairment losses recognized in the reporting period.
3.26 TAXATION / DEFERRED INCOME TAX ASSETS AND LIABILITIESTaxation is calculated on the basis of the result before taxation
for the reporting period, taking into account the applicable
tax provisions and tax rates, and also includes adjustments
on taxation from previous reporting periods and movements
in deferred taxes recognized in the reporting period.
Taxation is included in the income statement unless it relates
to items directly recognized in equity, in which case taxation
is included in equity. Income tax expense also include the
corporate income taxes which are levied on a deemed profit
basis and revenue bais (withholding tax). Temporary
differences are accounted for in deferred tax assets and/or
deferred tax liabilities. Deferred tax assets are only
recognized to the extent that it is probable that taxable profit
will be available for realization in the foreseeable future.
Deferred tax assets are reviewed at each reporting date and
are reduced to the extent that it is no longer probable that the
related tax benefit will be realized. Deferred tax assets and
liabilities are offset if there is a legally enforceable right to
offset tax liabilities and assets, and they relate to income
taxes levied by the same tax authority on the same taxable
entity, or on different tax entities, but they intend to settle tax
liabilities and assets on a net basis or their tax assets and
liabilities will be realized simultaneously. Deferred income
tax assets and liabilities are recognized at norminal value.
Additional income taxes that arise from the distribution of
dividends are recognized at the same time that the liability to
pay the related dividend is recognized.
3.27 PROFIT PER SHAREThe Group discloses profit per ordinary share as well as
diluted profit per ordinary share. The net profit per ordinary
share is calculated based on the result attributable to the
Group’s shareholders divided by the calculated average
of the number of issued ordinary shares during the reporting
period. In calculating the dilluted profit per share the result
attributable to the Group’s shareholders and the calculated
average number of issued ordinary shares are adjusted for
all potentially diluting effects for ordinary shares.

78A
NN
UA
L R
EPO
RT
20
12
— B
OSK
ALI
S
3.28 DIVIDENDSDividends are recognized as a liability in the period in which
they are declared.
3.29 DETERMATION OF FAIR VALUEA number of the Group’s accounting policies and disclosures
require the determination of fair value, for both financial and
non-financial assets and liabilities. Fair values have been
determined for measurement and/or disclosure purposes
based on the following methods:
Property, plant and equipment
The fair value of property, plant and equipment recognized
as a result of a business combination is based on market
values. The market value of property is the estimated amount
for which a property could be exchanged on the date of
valuation between a willing buyer and a willing seller in an
arm’s length transaction after proper marketing wherein the
parties had each acted knowledgeably, prudently and
without compulsion.
Intangible assets
The fair value of other intangible assets recorded as a result
of a business combination, is based on the discounted cash
flows expected to be derived from the use and eventual sale
of the assets.
(Listed) assocated companies
The fair value is disclosed based on quoted prices.
Trade and other receivables
The fair value of trade and other receivables, exept due from
customers, is estimated as the present value of future cash
flows, discounted at the market rate of interest at the
reporting date.
Share-based payment transactions
The fair value is determined based on quoted prices.
Derivatives
The fair value of derivatives is based on the estimated amount
to be paid or received for a settlement of the contract as at
reporting date taking into account the actual interest rate en
and the credit rating of the counterparty. These fair value is
based on broker quotes. Those quotes are tested for
reasonableness by discounting estimated future cash flows
based on the terms and maturity of each contract and using
market interest rates for a similar instrument at the
measurement date.
Non-derivative fi nancial liabilities
Fair value, which is determined for disclosure purposes, is
calculated based on the present value of future principal and
interest cash flows, discounted at the market rate of interest
at the reporting date.
3.30 CONSOLIDATED STATEMENT OF CASH FLOWSThe consolidated statement of cash flows is drawn up using the
indirect method. Cash is defined as cash and cash equivalents
including bank overdrafts as presented in the explanatory
notes to the cash and cash equivalents and the interest-bearing
borrowings. Cash flows are presented separately in the
statement of cash flows as cash flows from operating activities,
investing activities and financing activities.

79
AN
NU
AL
REP
OR
T 2
01
2 —
BO
SKA
LIS
4. SEGMENT REPORTING
The Group recognizes four operational segments which, as described below, constitute the strategic business units
of the Group. These strategic business units offer different products and services and are managed separately
because they require different strategies. Each of the strategic business units is reviewed by the Board of
Management based on internal management reporting at least once every quarter. The following is a brief summary
of the activities of the operational segments:
Dredging
Traditionally, dredging is the core activity of Boskalis and it still forms the most important operational segment. It
involves all activities required to remove silt, sand and other layers from the water bed and in some cases utilizing
them elsewhere, for example for land reclamation. The services we provide also include the construction and
maintenance of ports and waterways, and coastal defense and riverbank protection, as well as associated
specialist services such as underwater rock fragmentation. In addition, Boskalis is active in the extraction of raw
materials using dredging techniques. This segment is active around the world and can be dvided into home
markets (inside and outside Europe) and international project markets.
Offshore Energy
Within this operational segment Boskalis supports the activities of the international energy sector, including oil and
gas companies and providers of renewable energy such as wind power. Boskalis is involved in the development,
construction, maintenance and decommissioning of oil and LNG-import/export facilities, offshore platforms,
pipelines and cables and offshore wind farms. In performing these activities Boskalis applies its expertise in the
areas of dredging, offshore pipeline, cable and rock installation, heavy transport, lifting and installation work, as
well as diving and ROV services.
Inland Infra
Within this operational segment Boskalis operates as a contractor for dry and maritime infrastructure projects. In
the area of dry infrastructure we are involved mainly in the Netherlands in the design, preparation (by means of
dry earthmoving) and execution of large-scale civil infra works, such as the construction of roads and railroads,
bridges, dams, viaducts and tunnels. In doing so, Boskalis also performs specialist works such as soil improvement
and land remediation. Maritime infrastructure projects are conducted internationally through our strategic partner
Archirodon (40% owned). As a maritime contractor Archirodon has extensive experience in designing and
constructing quay walls, jetties, breakwaters and oil and LNG terminals. In addition, the company is an
all-rounder in the civil infrastructure and industrial installations markets.
Towage & Salvage
In the world’s biggest ports Boskalis, by means of SMIT Harbour Towage, provides assistance to incoming and
outgoing oceangoing vessels. With a versatile fleet of over 200 tugs Boskalis assists vessels including Ro-Ro ships,
oil and chemical tankers, container ships, reefers and mixed cargo ships. In addition, a full range of services for
the operation and management of onshore and offshore terminals is offered through Smit Lamnalco, which is 50%
owned by Boskalis. These include assistance with the berthing and unberthing of tankers at oil and LNG terminals
and additional support services such as pilotage, subsea inspection and maintenance, firefighting, and the
coupling and uncoupling of terminal connections. Through SMIT Salvage services are provided relating to the
salvage of ships and wreck removal. SMIT Salvage provides assistance to vessels in distress and is able to spring
into action at anytime and anywhere in the world. Boskalis is able to do so by operating out of four locations
which are strategically situated in relation to the main international shipping routes: Houston, Cape Town,
Rotterdam and Singapore. Clearance of wrecks of sunken ships almost always takes place at locations where the
wreck forms an obstruction to traffic or presents an environmental hazard.
The operational segments are monitored based on the segment result before finance income and expenses and
taxation. The segment result is used for performance measurement of operational segments, both between segments
and compared to other companies in the same industries. Inter-operational segment services, if any, take place at
arm’s length basis. In the reporting period there were no material inter-operational segment services. In note 4.1
the table regarding 2011 has been adjusted to enable comparison with the new operational segments.

80A
NN
UA
L R
EPO
RT
20
12
— B
OSK
ALI
S
4.1 OPERATIONAL SEGMENTS
2012 DREDGINGOFFSHORE
ENERGY INLAND INFRATOWAGE &
SALVAGEHOLDING &
ELIMINATIONS GROUP
Revenue 1,289,718 480,545 777,454 533,145 — 3,080,862
Segment result 200,604 60,310 38,100 74,012 - 36,169 336,857
Operating result 336,857
Share in result of associated companies - 1,209 - 40 440 658 403 252
Non-allocated finance income and expenses - 34,480
Non-allocated taxation - 49,502
Net group profit 253,127
Segment assets 1,512,259 888,710 714,172 1,507,422 - 46,082 4,576,481
Investments in associated companies 2,564 3,981 4,982 24,851 219,460 255,838
Non-allocated assets 56,452
Total assets 4,888,771
Segment liabilities 1,126,877 213,807 358,179 134,680 - 112,004 1,721,539
Non-allocated liabilities 1,251,080
Total liabilities 2,972,619
Investments in property, plant and equipment 94,296 114,976 45,885 49,239 9,497 313,893
Depreciation on property, plant and equipment 83,580 31,599 39,498 60,974 2,838 218,489
Amortisation on intangible assets — 1,208 1,152 7,036 - 673 8,723
Impairment losses on property, plant and equipment 1,792 2,306 — — — 4,098
231,310
EBITDA 285,976 95,423 78,750 142,022 - 34,004 568,167
2011 DREDGINGOFFSHORE
ENERGY INLAND INFRATOWAGE &
SALVAGEHOLDING &
ELIMINATIONS GROUP
Revenue 1,525,392 370,860 382,067 518,604 4,113 2,801,037
Segment result 216,547 62,105 47,730 69,136 - 41,425 354,093
Operating result 354,093
Share in result of associated companies - 467 1,161 145 1,181 — 2,020
Non-allocated finance income and expenses - 40,368
Non-allocated taxation - 54,735
Net group profit 261,010
Segment assets 1,437,017 860,766 739,810 1,471,492 83,811 4,592,896
Investments in associated companies 5,070 955 4,102 12,664 637 23,428
Non-allocated assets 57,346
Total assets 4,673,670
Segment liabilities 1,117,303 205,026 387,712 235,645 - 101,577 1,844,109
Non-allocated liabilities 1,082,246
Total liabilities 2,926,355
Investments in property, plant and equipment 73,159 124,924 21,883 61,346 10,583 291,895
Depreciation on property, plant and equipment 86,095 37,309 20,231 73,362 2,120 219,118
Amortisation on intangible assets — 1,225 — 6,687 2,927 10,839
Impairment losses on property, plant and equipment - 759 7,190 — — 6,431
236,388
EBITDA 301,883 107,829 67,961 149,185 - 36,378 590,481
The non-allocated assets comprise deferred tax assets, income tax receivable and derivatives. The non-
allocated liabilities comprise deferred tax liabilities, income tax payable, derivatives and interest-bearing
borrowings.

81
AN
NU
AL
REP
OR
T 2
01
2 —
BO
SKA
LIS
5. ACQUISITION OF SHAREHOLDING
By the end of 2012 the Group has acquired 33,3% of the shares and voting rights of Dockwise Ltd
(“Dockwise”). With this, the power to participate in the financial and operating policy decisions of
Dockwise exists and the interest is accounted for as an associated company (reference is made to note 16).
6. REVENUE
The revenue of the segments Dredging, Offshore Energy and Inland Infra mainly comprises revenues from
work in progress. Movements in the value of work in progress, consisting of cumulative incurred costs plus
profit in proportion to progress less provisions for losses, together with the work done and completed
during the reporting period, determine the revenue for these segments. The revenue from services
rendered to third parties is partly realized in the operational segments Offshore Energy and Inland Infra,
but mainly in the segment Towage & Salvage. The revenue from construction contracts (IAS 11) and
services on a project base by analogy with this standard amounts to approximately EUR 2,317 million
(2011: EUR 2,118 million). The revenue from other services amounts to approximately EUR 764 million
(2011: EUR 683 million).
If certain projects are executed together in a joint venture, the segments only report their own share in the
revenue and results recognized, resulting in no material related party transactions that need to be eliminated.
Revenue by region can be specified as follows:
REVENUE
2012 2011
Netherlands 762,563 633,181
Rest of Europe 570,093 494,231
Australia / Asia 483,753 689,503
Middle East 341,314 318,026
Africa 427,845 295,696
North and South America 495,294 370,400
3,080,862 2,801,037
A large part of the Group’s revenue is executed project based for a various group of clients in various
countries and geographical areas. Because of the often incidental character and spread of the contracts
none of these clients qualifies structurally as a material client in relation to the total revenue of the Group.
Revenue includes the movements in work in progress of EUR 29.2 million (2011: EUR 960.2 million).
7. OTHER INCOME
Other income mainly comprises the settlement of equipment related claims (EUR 3.4 million; 2011:
EUR 4.5 million) and book results on the disposal of equipment (EUR 11.1 million; 2011: EUR 4.5 million).

82A
NN
UA
L R
EPO
RT
20
12
— B
OSK
ALI
S8. RAW MATERIALS, CONSUMABLES, SERVICES AND CONTRACTED WORK
During 2012 EUR 5.4 million (2011: EUR 5.2 million) was recognized as an expense in the consolidated
income statement of operating leases through limited partnerships (Dutch: ‘CV-contructions’). The Group
has an option to purchase these vessels eight years after the commencement of the lease period at a fixed
price. In respect of other operational lease agreements EUR 39.7 million was recognized in the consolidated
income statement (2011: EUR 38.2 million).
9. PERSONNEL EXPENSES
2012 2011
Wages and salaries - 484,050 - 469,641
Social security costs - 54,627 - 44,716
Pension costs for defined benefit pension schemes - 21,815 - 17,427
Pension costs for defined contribution pension schemes - 19,166 - 17,877
- 579,658 - 549,661
For the remuneration of the Board of Management and the Supervisory Board reference is made to
note 30.2.
10. FINANCE INCOME AND EXPENSES
2012 2011
Interest income on short-term bank deposits 8,576 8,324
Change in fair value of (hedging instruments regarding) borrowings 6,392 14,663
Finance income 14,968 22,987
Interest expenses - 36,040 - 39,528
Change in fair value of (hedging instruments regarding) borrowings - 10,199 - 17,672
Other finance expenses - 3,209 - 6,155
Finance expenses - 49,448 - 63,355
Net finance expense recognized in consolidated income statement - 34,480 - 40,368
In 2011 Other finance expenses included EUR 3.0 million settlement costs of derivatives, which, due to the
sale of the terminal activities, were no longer effective. The remainder of the other finance expenses mainly
relates to commitment fees.
11. TAXATION
2012 2011
Current tax expense
Current year - 67,685 - 77,686
Over / under(-) provided in prior years 9,472 9,706
Reclassification of deferred taxes regarding prior financial years 7,208 3,196
- 51,005 - 64,784
Deferred tax expense
Origination and reversal of temporary differences 9,937 10,532
Effect of changes in tax rates on deferred taxes 117 - 380
Reclassification of deferred taxes regarding prior financial years - 7,208 - 3,196
Movement of recognized tax losses carried forward - 1,343 3,093
1,503 10,049
Taxation in the consolidated income statement - 49,502 - 54,735

83
AN
NU
AL
REP
OR
T 2
01
2 —
BO
SKA
LIS
The operational activities of the Group are subject to various tax regimes with tax rates varying from
0% to 42% (2011: 0% to 42%). These different tax rates, together with fiscal facilities in various countries
and the treatment of tax losses, results not subject to taxation and non-deductible costs, lead to an effective
tax rate in the reporting period of 16.4% (2011: 17.3%). The effective tax rate is calculated as the tax
charge divided by the profit before tax, as shown in the consolidated income statement. The reconciliation
between the Dutch nominal tax rate and the effective tax rate is as follows:
2012 2011
Nominal tax rate in the Netherlands 25.0% 25.0%
Application of local nominal tax rates - 7.3% - 9.3%
Non-deductible expenses 3.6% 1.0%
Effect of unrecognized tax losses and temporary differences 3.2% 4.6%
Effect of previously unrecognized tax losses - 3.6% - 0.3%
Special taxation regimes - 1.3% - 0.5%
Adjustment in respect of prior years - 3.2% - 3.1%
Effect of share in result of associated companies 0.0% - 0.1%
Effective tax rate 16.4% 17.3%

84A
NN
UA
L R
EPO
RT
20
12
— B
OSK
ALI
S12. INCOME TAX RECEIVABLE AND PAYABLE
The current income tax receivables and income tax payables relate to the fiscal positions of the respective
Group companies and consist of fiscal years still to be settled less withholding taxes or tax refunds.
13. DEFERRED INCOME TAX ASSETS AND LIABILITIES
BALANCE AS ATJANUARY 1, 2012
MOVEMENT IN TEMPORARY DIFFERENCES DURING THE YEAR BALANCE AS ATDECEMBER 31, 2012
Asset Liability
Charged(-)/ added
to net profit
Charged toequity
Businesscombi-nation
In / out consolida-
tion
Currency translationdifferences Asset Liability
Intangible assets — - 23,954 4,281 — — — 253 — - 19,420
Property, plant and equipment 4,628 - 60,674 8,293 — — 403 1,005 4,624 - 50,969
Due from and due to customers — - 6,873 3,564 — — — 59 — - 3,250
Trade and other receivables 172 - 639 727 — — — - 150 148 - 38
Hedging reserve 701 - 1,874 — 4,749 — — 23 3,599 —
Actuarial gains and lossesand asset limitation on definedbenefit pension schemes 20,169 — 87 7,028 — — - 87 27,197 —
Employee benefits 1,718 - 5,727 - 5,816 — — — - 743 1,118 - 11,686
Provisions 7,409 - 438 - 6,638 — — — - 2 1,458 - 1,127
Interest-bearing borrowings 55 — 1,158 — — — - 594 619 —
Trade and other payables 1,593 - 138 - 351 — — — - 496 1,069 - 461
Other assets and liabilities 973 - 2,037 - 1,422 - 176 — — 7 270 - 2,925
Fiscal reserves — - 274 - 1,037 — — — - 57 — - 1,368
Foreign branch results — - 3,137 — — — — — — - 3,137
Tax losses carried forward 3,677 — - 1,343 — — — - 381 1,953 —
41,095 - 105,765 1,503 11,601 — 403 - 1,163 42,055 - 94,381
Offsetting deferred tax assetsand liabilities - 12,282 12,282 - 16,343 16,343
Net in the consolidated balance sheet 28,813 - 93,483 25,712 - 78,038
BALANCE AS ATJANUARY 1, 2011
MOVEMENT IN TEMPORARY DIFFERENCES DURING THE YEAR BALANCE AS ATDECEMBER 31, 2011
Asset Liability
Charged(-)/ added
to net profit
Charged toequity
Businesscombina-
tion
In / out consolida-
tion
Currency translationdifferences Asset Liability
Intangible assets — - 26,890 2,886 — — 70 - 20 — - 23,954
Property, plant and equipment 7,508 - 65,224 672 — - 5,941 1,827 5,112 4,628 - 60,674
Due from and due to customers — - 7,751 1,036 — — — - 158 — - 6,873
Trade and other receivables 239 - 153 76 — - 626 — - 3 172 - 639
Hedging reserve 645 - 887 - 6 - 921 — — - 4 701 - 1,874
Actuarial gains and lossesand asset limitation on definedbenefit pension schemes 10,287 — — 9,882 — — — 20,169 —
Employee benefits 950 - 6,704 2,201 - 345 — — - 111 1,718 - 5,727
Provisions 7,648 - 644 - 1,416 — 1,349 — 34 7,409 - 438
Interest-bearing borrowings 550 - 1,840 65 — 1,081 — 199 55 —
Trade and other payables 2,237 - 130 - 683 — — — 31 1,593 - 138
Other assets and liabilities 476 - 2,007 848 2,231 - 1,147 - 774 - 691 973 - 2,037
Fiscal reserves — - 1,194 212 — — 708 — — - 274
Foreign branch results — - 4,202 1,065 — — — — — - 3,137
Tax losses carried forward 1,659 - 2 3,093 — — — - 1,073 3,677 —
32,199 - 117,628 10,049 10,847 - 5,284 1,831 3,316 41,095 - 105,765
Offsetting deferred tax assetsand liabilities - 13,493 13,493 - 12,282 12,282
Net in the consolidated balance sheet 18,706 - 104,135 28,813 - 93,483
Deferred tax assets are not recognized as long as it is not probable that economic benefits can be expected
in future periods. Deferred tax assets and liabilities within fiscal entities are offset in the balance sheet.
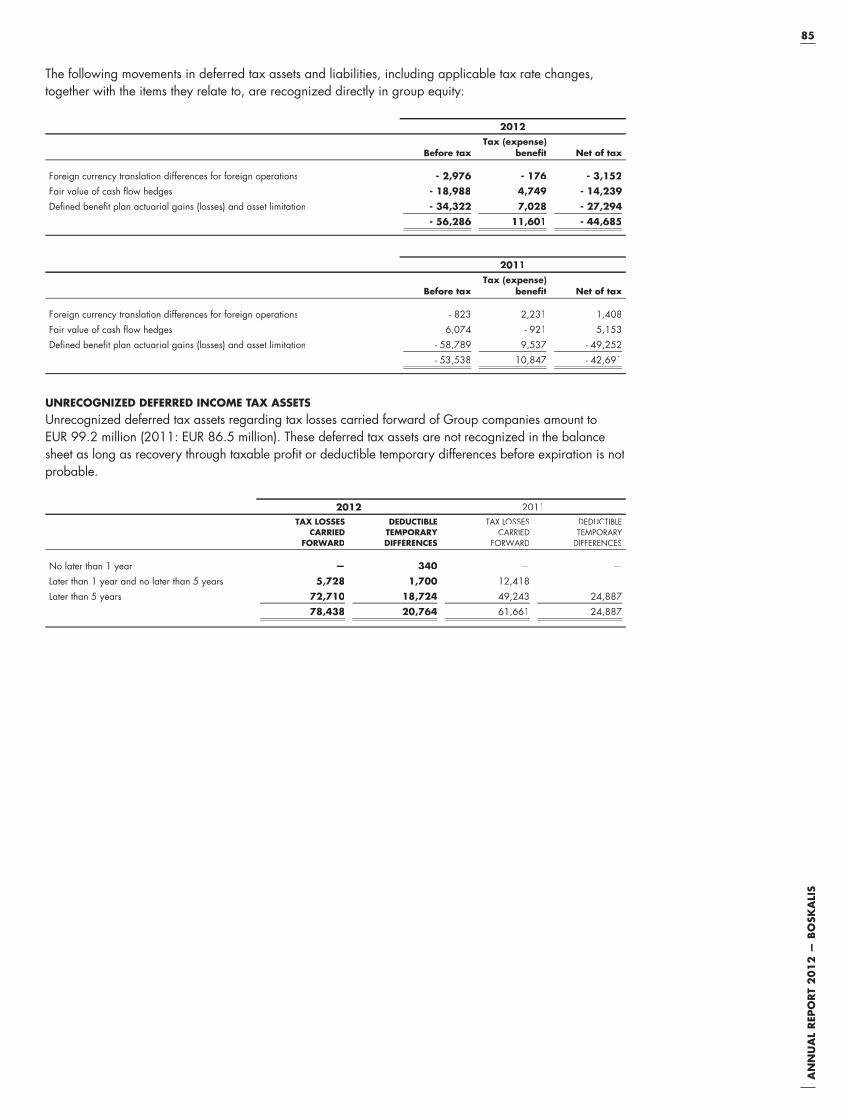
85
AN
NU
AL
REP
OR
T 2
01
2 —
BO
SKA
LIS
The following movements in deferred tax assets and liabilities, including applicable tax rate changes,
together with the items they relate to, are recognized directly in group equity:
2012
Before taxTax (expense)
benefit Net of tax
Foreign currency translation differences for foreign operations - 2,976 - 176 - 3,152
Fair value of cash flow hedges - 18,988 4,749 - 14,239
Defined benefit plan actuarial gains (losses) and asset limitation - 34,322 7,028 - 27,294
- 56,286 11,601 - 44,685
2011
Before taxTax (expense)
benefit Net of tax
Foreign currency translation differences for foreign operations - 823 2,231 1,408
Fair value of cash flow hedges 6,074 - 921 5,153
Defined benefit plan actuarial gains (losses) and asset limitation - 58,789 9,537 - 49,252
- 53,538 10,847 - 42,691
UNRECOGNIZED DEFERRED INCOME TAX ASSETSUnrecognized deferred tax assets regarding tax losses carried forward of Group companies amount to
EUR 99.2 million (2011: EUR 86.5 million). These deferred tax assets are not recognized in the balance
sheet as long as recovery through taxable profit or deductible temporary differences before expiration is not
probable.
2012 2011
TAX LOSSESCARRIED
FORWARD
DEDUCTIBLETEMPORARY DIFFERENCES
TAX LOSSESCARRIED
FORWARD
DEDUCTIBLETEMPORARY
DIFFERENCES
No later than 1 year — 340 — —
Later than 1 year and no later than 5 years 5,728 1,700 12,418 —
Later than 5 years 72,710 18,724 49,243 24,887
78,438 20,764 61,661 24,887
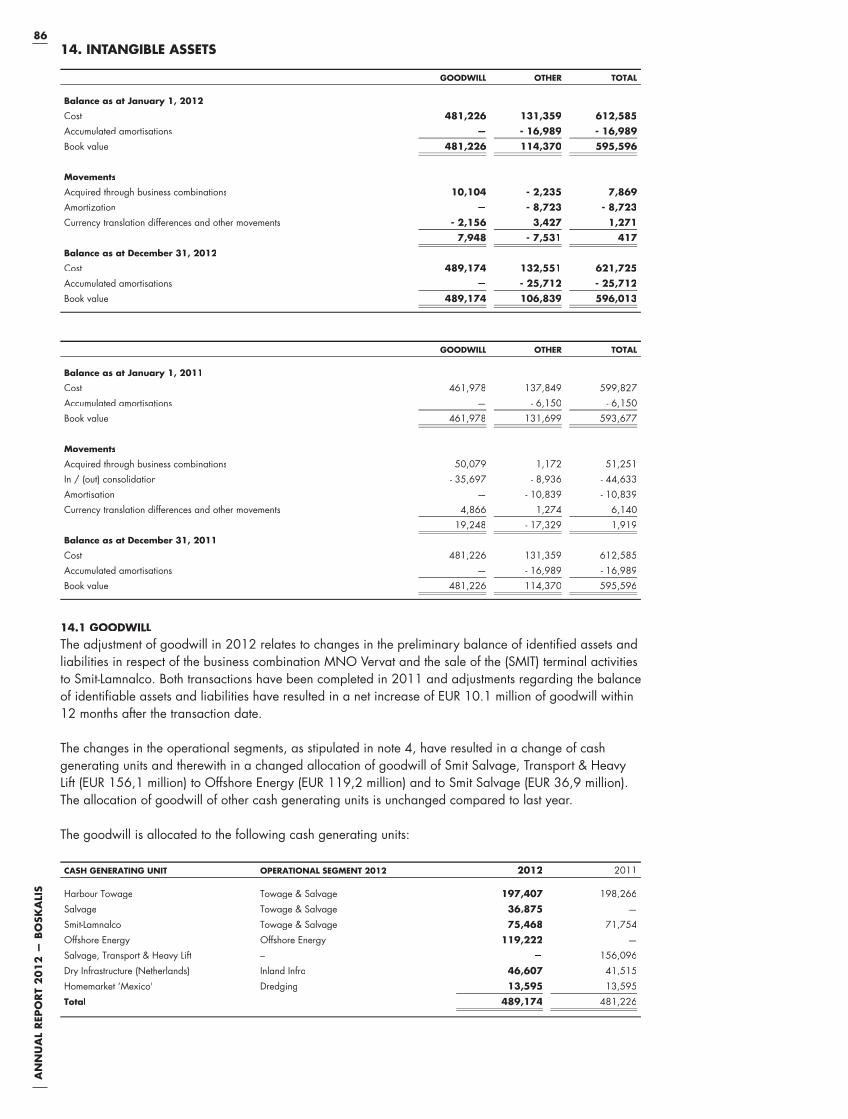
86A
NN
UA
L R
EPO
RT
20
12
— B
OSK
ALI
S14. INTANGIBLE ASSETS
GOODWILL OTHER TOTAL
Balance as at January 1, 2012
Cost 481,226 131,359 612,585
Accumulated amortisations — - 16,989 - 16,989
Book value 481,226 114,370 595,596
Movements
Acquired through business combinations 10,104 - 2,235 7,869
Amortization — - 8,723 - 8,723
Currency translation differences and other movements - 2,156 3,427 1,271
7,948 - 7,531 417
Balance as at December 31, 2012
Cost 489,174 132,551 621,725
Accumulated amortisations — - 25,712 - 25,712
Book value 489,174 106,839 596,013
GOODWILL OTHER TOTAL
Balance as at January 1, 2011
Cost 461,978 137,849 599,827
Accumulated amortisations — - 6,150 - 6,150
Book value 461,978 131,699 593,677
Movements
Acquired through business combinations 50,079 1,172 51,251
In / (out) consolidation - 35,697 - 8,936 - 44,633
Amortisation — - 10,839 - 10,839
Currency translation differences and other movements 4,866 1,274 6,140
19,248 - 17,329 1,919
Balance as at December 31, 2011
Cost 481,226 131,359 612,585
Accumulated amortisations — - 16,989 - 16,989
Book value 481,226 114,370 595,596
14.1 GOODWILLThe adjustment of goodwill in 2012 relates to changes in the preliminary balance of identified assets and
liabilities in respect of the business combination MNO Vervat and the sale of the (SMIT) terminal activities
to Smit-Lamnalco. Both transactions have been completed in 2011 and adjustments regarding the balance
of identifiable assets and liabilities have resulted in a net increase of EUR 10.1 million of goodwill within
12 months after the transaction date.
The changes in the operational segments, as stipulated in note 4, have resulted in a change of cash
generating units and therewith in a changed allocation of goodwill of Smit Salvage, Transport & Heavy
Lift (EUR 156,1 million) to Offshore Energy (EUR 119,2 million) and to Smit Salvage (EUR 36,9 million).
The allocation of goodwill of other cash generating units is unchanged compared to last year.
The goodwill is allocated to the following cash generating units:
CASH GENERATING UNIT OPERATIONAL SEGMENT 2012 2012 2011
Harbour Towage Towage & Salvage 197,407 198,266
Salvage Towage & Salvage 36,875 —
Smit-Lamnalco Towage & Salvage 75,468 71,754
Offshore Energy Offshore Energy 119,222 —
Salvage, Transport & Heavy Lift – — 156,096
Dry Infrastructure (Netherlands) Inland Infra 46,607 41,515
Homemarket ‘Mexico' Dredging 13,595 13,595
Total 489,174 481,226

87
AN
NU
AL
REP
OR
T 2
01
2 —
BO
SKA
LIS
When conducting the impairment testing of goodwill, the value in use of the cash generating unit is
determined by discounting future cash flows from continuing operations of the unit. The calculation
comprises of cash flow projections for a period of five years starting with the budget 2013, after which
the cash flows are extrapolated at the assumed growth rate. The valuation models have been consistently
applied for the different cash generating units.
Management has projected cash flows based on past trends and estimates and of future market
developments. Also it is assumed that cost efficiencies can and will be realized. The key assumptions
relate to the discount rate used and the growth rate applied in the calculation of the terminal value. The
discount rates used are for Harbour Towage 8.6% (2011: 8.3%), for Salvage 11.0%, for Offshore Energy
9.3%, for Smit-Lamnalco 8.8%, for Dry Infrastructure (Netherlands) 11,0% and for Homemarket ‘Mexico’
12,8% (2011: 13,2%). The growth rate applied in the terminal value is, as last year, set at 2% and does
not exceed the long-term average growth rate which may be expected for the activities. The assessment
has indicated that no impairment is required since the recoverable amount is higher than the sum of the
recognized goodwill and the carrying amount of the assets and liabilities attributable to the respective
cash generating unit. Changes that could be reasonably expected in the underlying parameters for
calculating the recoverable amount at year-end such as an increase in the discount rate by 1% or a
decrease in growth rate in the terminal value by 1% do also not give rise to an impairment. Moreover,
considering the sufficient amount of headroom for each cash generating unit, no further, detailed
sensitivity analysis has been presented.
14.2 OTHER INTANGIBLE ASSETSOther intangible assets mainly comprise intangible assets which were recognized as a result of
acquisitions. This item primarily relates to customer portfolios and trademarks resulting from the business
combination of Smit Internationale N.V..
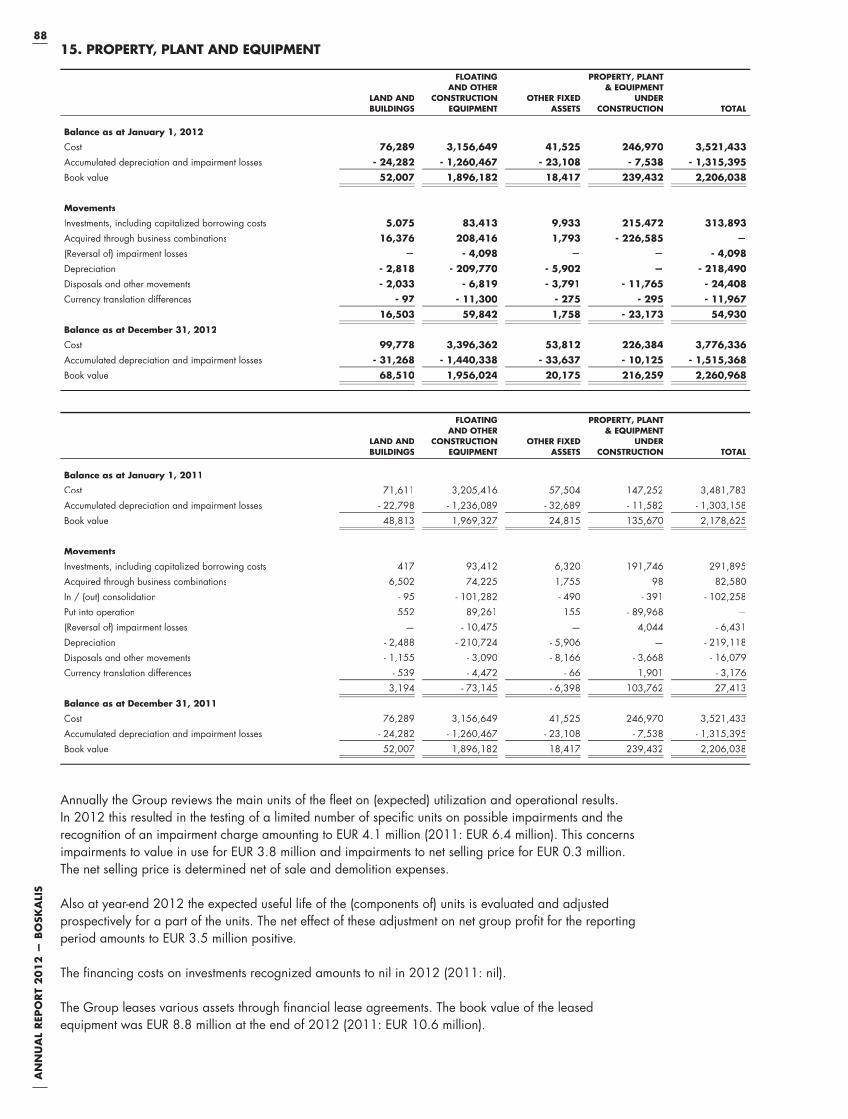
88A
NN
UA
L R
EPO
RT
20
12
— B
OSK
ALI
S15. PROPERTY, PLANT AND EQUIPMENT
LAND ANDBUILDINGS
FLOATINGAND OTHER
CONSTRUCTIONEQUIPMENT
OTHER FIXEDASSETS
PROPERTY, PLANT& EQUIPMENT
UNDER CONSTRUCTION TOTAL
Balance as at January 1, 2012
Cost 76,289 3,156,649 41,525 246,970 3,521,433
Accumulated depreciation and impairment losses - 24,282 - 1,260,467 - 23,108 - 7,538 - 1,315,395
Book value 52,007 1,896,182 18,417 239,432 2,206,038
Movements
Investments, including capitalized borrowing costs 5,075 83,413 9,933 215,472 313,893
Acquired through business combinations 16,376 208,416 1,793 - 226,585 —
(Reversal of) impairment losses — - 4,098 — — - 4,098
Depreciation - 2,818 - 209,770 - 5,902 — - 218,490
Disposals and other movements - 2,033 - 6,819 - 3,791 - 11,765 - 24,408
Currency translation differences - 97 - 11,300 - 275 - 295 - 11,967
16,503 59,842 1,758 - 23,173 54,930
Balance as at December 31, 2012
Cost 99,778 3,396,362 53,812 226,384 3,776,336
Accumulated depreciation and impairment losses - 31,268 - 1,440,338 - 33,637 - 10,125 - 1,515,368
Book value 68,510 1,956,024 20,175 216,259 2,260,968
LAND ANDBUILDINGS
FLOATINGAND OTHER
CONSTRUCTIONEQUIPMENT
OTHER FIXEDASSETS
PROPERTY, PLANT& EQUIPMENT
UNDER CONSTRUCTION TOTAL
Balance as at January 1, 2011
Cost 71,611 3,205,416 57,504 147,252 3,481,783
Accumulated depreciation and impairment losses - 22,798 - 1,236,089 - 32,689 - 11,582 - 1,303,158
Book value 48,813 1,969,327 24,815 135,670 2,178,625
Movements
Investments, including capitalized borrowing costs 417 93,412 6,320 191,746 291,895
Acquired through business combinations 6,502 74,225 1,755 98 82,580
In / (out) consolidation - 95 - 101,282 - 490 - 391 - 102,258
Put into operation 552 89,261 155 - 89,968 —
(Reversal of) impairment losses — - 10,475 — 4,044 - 6,431
Depreciation - 2,488 - 210,724 - 5,906 — - 219,118
Disposals and other movements - 1,155 - 3,090 - 8,166 - 3,668 - 16,079
Currency translation differences - 539 - 4,472 - 66 1,901 - 3,176
3,194 - 73,145 - 6,398 103,762 27,413
Balance as at December 31, 2011
Cost 76,289 3,156,649 41,525 246,970 3,521,433
Accumulated depreciation and impairment losses - 24,282 - 1,260,467 - 23,108 - 7,538 - 1,315,395
Book value 52,007 1,896,182 18,417 239,432 2,206,038
Annually the Group reviews the main units of the fleet on (expected) utilization and operational results.
In 2012 this resulted in the testing of a limited number of specific units on possible impairments and the
recognition of an impairment charge amounting to EUR 4.1 million (2011: EUR 6.4 million). This concerns
impairments to value in use for EUR 3.8 million and impairments to net selling price for EUR 0.3 million.
The net selling price is determined net of sale and demolition expenses.
Also at year-end 2012 the expected useful life of the (components of) units is evaluated and adjusted
prospectively for a part of the units. The net effect of these adjustment on net group profit for the reporting
period amounts to EUR 3.5 million positive.
The financing costs on investments recognized amounts to nil in 2012 (2011: nil).
The Group leases various assets through financial lease agreements. The book value of the leased
equipment was EUR 8.8 million at the end of 2012 (2011: EUR 10.6 million).

89
AN
NU
AL
REP
OR
T 2
01
2 —
BO
SKA
LIS
The securities provided for financing granted by means of mortgage rights on property, plant and
equipment are disclosed in note 23.
In accordance with the characteristics of the Group’s activities property, plant & equipment can be
deployed on a worldwide scale during the reporting period. As a consequence, segmentation of the
property, plant & equipment to geographical areas would not provide additional relevant information.
16. ASSOCIATED COMPANIES
2012 2011
Balance as at January 1 23,428 20,617
Acquired through business combinations — 2,307
Dividends received - 2,109 - 729
Investment Dockwise Ltd 225,288 —
Other net investments 7,376 - 1,772
Share in result 252 2,020
Currency translation differences and other movements 1,603 985
Balance as at December 31 255,838 23,428
The key associated companies of the Group are:
Ownership interest
COMPANY COUNTRY OF INCORPORATION 2012 2011
IRSHAD Abu Dhabi, United Arab Emirates 20% 20%
RW Aggregates Ltd United Kingdom 50% 50%
Taizhou Smit Towage Services Co Ltd China 40% 40%
Damietta for Maritime Services Company S.A.E. Egypt 31% 31%
Fleetcare Services Pte Ltd Singapore 45% 45%
Dockwise Ltd Netherlands 33% —
The fair value (EUR 244.2 million), based on quoted prices, of the investment of the Group in the listed
company Dockwise Ltd is EUR 25.0 million higher than the book value (EUR 219.2 million).
The voting rights in associated companies are equal to the ownership interests. The share of the Group
in assets, liabilities, revenue and result of the aforementioned associated companies is stated below:
2012 2011
Assets 484,043 23,696
Liabilities - 255,438 - 14,828
Equity 228,605 8,868
Revenues 16,450 11,777
Share in result 252 2,020
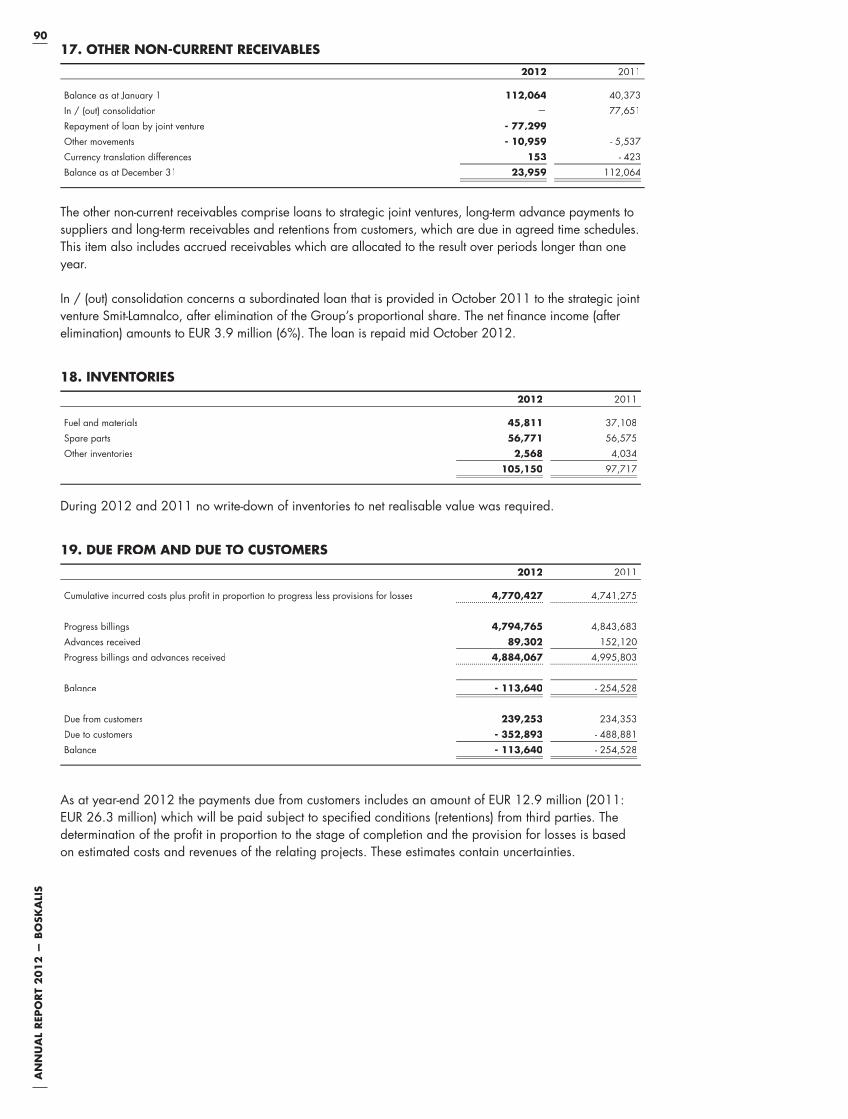
90A
NN
UA
L R
EPO
RT
20
12
— B
OSK
ALI
S17. OTHER NON-CURRENT RECEIVABLES
2012 2011
Balance as at January 1 112,064 40,373
In / (out) consolidation — 77,651
Repayment of loan by joint venture - 77,299 —
Other movements - 10,959 - 5,537
Currency translation differences 153 - 423
Balance as at December 31 23,959 112,064
The other non-current receivables comprise loans to strategic joint ventures, long-term advance payments to
suppliers and long-term receivables and retentions from customers, which are due in agreed time schedules.
This item also includes accrued receivables which are allocated to the result over periods longer than one
year.
In / (out) consolidation concerns a subordinated loan that is provided in October 2011 to the strategic joint
venture Smit-Lamnalco, after elimination of the Group’s proportional share. The net finance income (after
elimination) amounts to EUR 3.9 million (6%). The loan is repaid mid October 2012.
18. INVENTORIES
2012 2011
Fuel and materials 45,811 37,108
Spare parts 56,771 56,575
Other inventories 2,568 4,034
105,150 97,717
During 2012 and 2011 no write-down of inventories to net realisable value was required.
19. DUE FROM AND DUE TO CUSTOMERS
2012 2011
Cumulative incurred costs plus profit in proportion to progress less provisions for losses 4,770,427 4,741,275
Progress billings 4,794,765 4,843,683
Advances received 89,302 152,120
Progress billings and advances received 4,884,067 4,995,803
Balance - 113,640 - 254,528
Due from customers 239,253 234,353
Due to customers - 352,893 - 488,881
Balance - 113,640 - 254,528
As at year-end 2012 the payments due from customers includes an amount of EUR 12.9 million (2011:
EUR 26.3 million) which will be paid subject to specified conditions (retentions) from third parties. The
determination of the profit in proportion to the stage of completion and the provision for losses is based
on estimated costs and revenues of the relating projects. These estimates contain uncertainties.
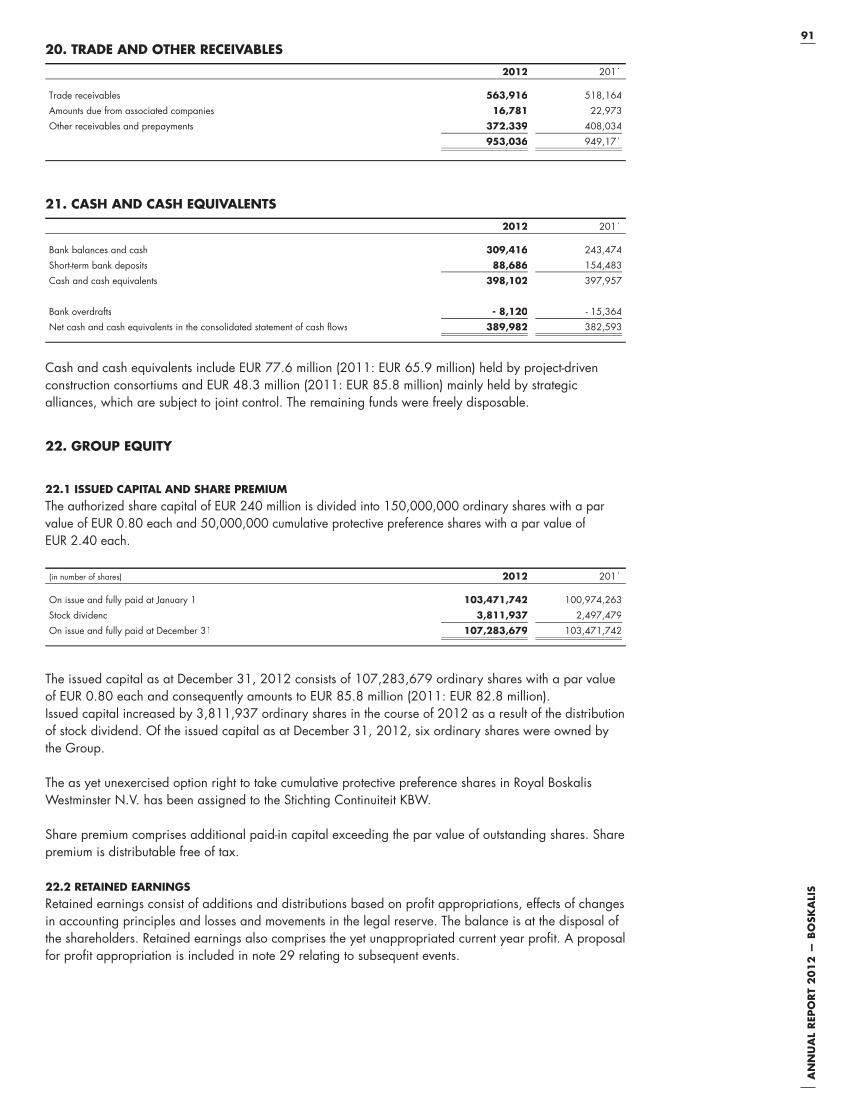
91
AN
NU
AL
REP
OR
T 2
01
2 —
BO
SKA
LIS
20. TRADE AND OTHER RECEIVABLES
2012 2011
Trade receivables 563,916 518,164
Amounts due from associated companies 16,781 22,973
Other receivables and prepayments 372,339 408,034
953,036 949,171
21. CASH AND CASH EQUIVALENTS
2012 2011
Bank balances and cash 309,416 243,474
Short-term bank deposits 88,686 154,483
Cash and cash equivalents 398,102 397,957
Bank overdrafts - 8,120 - 15,364
Net cash and cash equivalents in the consolidated statement of cash flows 389,982 382,593
Cash and cash equivalents include EUR 77.6 million (2011: EUR 65.9 million) held by project-driven
construction consortiums and EUR 48.3 million (2011: EUR 85.8 million) mainly held by strategic
alliances, which are subject to joint control. The remaining funds were freely disposable.
22. GROUP EQUITY
22.1 ISSUED CAPITAL AND SHARE PREMIUMThe authorized share capital of EUR 240 million is divided into 150,000,000 ordinary shares with a par
value of EUR 0.80 each and 50,000,000 cumulative protective preference shares with a par value of
EUR 2.40 each.
(in number of shares) 2012 2011
On issue and fully paid at January 1 103,471,742 100,974,263
Stock dividend 3,811,937 2,497,479
On issue and fully paid at December 31 107,283,679 103,471,742
The issued capital as at December 31, 2012 consists of 107,283,679 ordinary shares with a par value
of EUR 0.80 each and consequently amounts to EUR 85.8 million (2011: EUR 82.8 million).
Issued capital increased by 3,811,937 ordinary shares in the course of 2012 as a result of the distribution
of stock dividend. Of the issued capital as at December 31, 2012, six ordinary shares were owned by
the Group.
The as yet unexercised option right to take cumulative protective preference shares in Royal Boskalis
Westminster N.V. has been assigned to the Stichting Continuiteit KBW.
Share premium comprises additional paid-in capital exceeding the par value of outstanding shares. Share
premium is distributable free of tax.
22.2 RETAINED EARNINGSRetained earnings consist of additions and distributions based on profit appropriations, effects of changes
in accounting principles and losses and movements in the legal reserve. The balance is at the disposal of
the shareholders. Retained earnings also comprises the yet unappropriated current year profit. A proposal
for profit appropriation is included in note 29 relating to subsequent events.

92A
NN
UA
L R
EPO
RT
20
12
— B
OSK
ALI
S
22.3 DIVIDENDSRoyal Boskalis Westminster N.V. announced and distributed the following dividends to holders of ordinary
shares:
2012 2011
Dividends previous year EUR 1.24 respectively EUR 1.24 per ordinary share 128,305 125,208
Total announced and distributed dividend 128,305 125,208
Stock dividend 89,812 80,522
Cash dividend 38,493 44,686
Total distributed dividend 128,305 125,208
22.4 EARNINGS PER SHAREEarnings per share over 2012 amount to EUR 2.37 (2011: EUR 2.48). Because there are no dilution effects,
the diluted earnings per share also amount to EUR 2.37 (2011: EUR 2.48). The calculation of earnings per
share is based on the profit attributable to shareholders of EUR 250.2 million (2011: EUR 254.3 million) and
the weighted average number of ordinary shares for the year 2012, 105,644,024 (2011: 102,390,642).
This number is calculated as follows:
(in number of shares) 2012 2011
Issued ordinary shares as at January 1 103,471,742 100,974,263
Weighted effect of ordinary shares issued due to optional dividend 2,172,282 1,416,379
Weighted average number of ordinary shares during the fiscal year 105,644,024 102,390,642
22.5 OTHER RESERVESMovement in other reserves:
Legal reserves
OTHER LEGALRESERVE
HEDGINGRESERVE
REVALUATIONRESERVE
CURRENCY TRANSLATION
RESERVEACTUARIAL
RESERVETOTAL OTHER
RESERVES
Note [22.5.1] [22.5.2] [22.5.3] [22.5.4] [22.5.5]
Balance as at January 1, 2012 307,306 2,799 21,150 1,740 - 102,820 230,175
Foreign currency translation differencesfor foreign operations, after taxation — — — - 4,974 — - 4,974
Cash flow hedges, after taxation — - 14,239 — — — - 14,239
Defined benefit plan actuarial gains (losses)and asset limitation, after taxation — — — — - 27,294 - 27,294
Realization through sale of underlying asset — — - 716 — — - 716
Movement legal reserve 18,547 — — — — 18,547
Total movement 18,547 - 14,239 - 716 - 4,974 - 27,294 - 28,676
Balance as at December 31, 2012 325,853 - 11,440 20,434 - 3,234 - 130,114 201,499
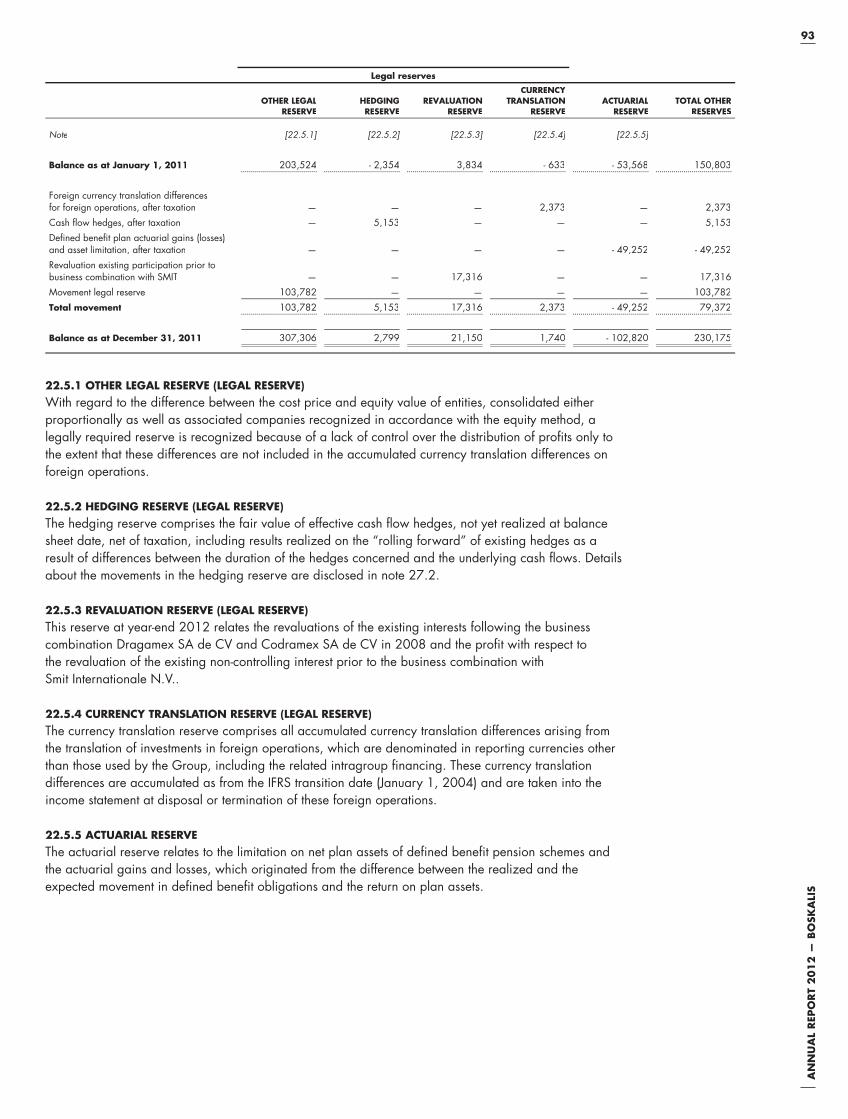
93
AN
NU
AL
REP
OR
T 2
01
2 —
BO
SKA
LIS
Legal reserves
OTHER LEGALRESERVE
HEDGINGRESERVE
REVALUATIONRESERVE
CURRENCY TRANSLATION
RESERVEACTUARIAL
RESERVETOTAL OTHER
RESERVES
Note [22.5.1] [22.5.2] [22.5.3] [22.5.4] [22.5.5]
Balance as at January 1, 2011 203,524 - 2,354 3,834 - 633 - 53,568 150,803
Foreign currency translation differencesfor foreign operations, after taxation — — — 2,373 — 2,373
Cash flow hedges, after taxation — 5,153 — — — 5,153
Defined benefit plan actuarial gains (losses)and asset limitation, after taxation — — — — - 49,252 - 49,252
Revaluation existing participation prior tobusiness combination with SMIT — — 17,316 — — 17,316
Movement legal reserve 103,782 — — — — 103,782
Total movement 103,782 5,153 17,316 2,373 - 49,252 79,372
Balance as at December 31, 2011 307,306 2,799 21,150 1,740 - 102,820 230,175
22.5.1 OTHER LEGAL RESERVE (LEGAL RESERVE)With regard to the difference between the cost price and equity value of entities, consolidated either
proportionally as well as associated companies recognized in accordance with the equity method, a
legally required reserve is recognized because of a lack of control over the distribution of profits only to
the extent that these differences are not included in the accumulated currency translation differences on
foreign operations.
22.5.2 HEDGING RESERVE (LEGAL RESERVE)The hedging reserve comprises the fair value of effective cash flow hedges, not yet realized at balance
sheet date, net of taxation, including results realized on the “rolling forward” of existing hedges as a
result of differences between the duration of the hedges concerned and the underlying cash flows. Details
about the movements in the hedging reserve are disclosed in note 27.2.
22.5.3 REVALUATION RESERVE (LEGAL RESERVE)This reserve at year-end 2012 relates the revaluations of the existing interests following the business
combination Dragamex SA de CV and Codramex SA de CV in 2008 and the profit with respect to
the revaluation of the existing non-controlling interest prior to the business combination with
Smit Internationale N.V..
22.5.4 CURRENCY TRANSLATION RESERVE (LEGAL RESERVE)The currency translation reserve comprises all accumulated currency translation differences arising from
the translation of investments in foreign operations, which are denominated in reporting currencies other
than those used by the Group, including the related intragroup financing. These currency translation
differences are accumulated as from the IFRS transition date (January 1, 2004) and are taken into the
income statement at disposal or termination of these foreign operations.
22.5.5 ACTUARIAL RESERVEThe actuarial reserve relates to the limitation on net plan assets of defined benefit pension schemes and
the actuarial gains and losses, which originated from the difference between the realized and the
expected movement in defined benefit obligations and the return on plan assets.

94A
NN
UA
L R
EPO
RT
20
12
— B
OSK
ALI
S23. INTEREST-BEARING BORROWINGS
2012 2011
Non-current liabilities
Mortgage loans 239,825 146,417
Other interest-bearing loans 365,648 533,279
605,473 679,696
Current liabilities
Mortgage loans (current portion) 25,526 52,060
Other interest-bearing loans (current portion) 356,791 60,512
382,317 112,572
Total interest-bearing borrowings 987,790 792,268
As security for the mortgage loans, denominated partly in other currencies than the Euro, mortgage rights
are vested on property, plant and equipment, mainly vessels, with a book value of EUR 421.0 million
(2011: EUR 326.0 million). For certain loans, additional securities have been provided by means of the
assignment of revenues from rental contracts to third parties and insurance policies regarding this property,
plant and equipment.
The Other interest-bearing loans concern, translated at year-end foreign currency rates, for EUR 341.0 million
an inaugural US dollar 433 million and GBP 11 million US private placement, in July 2010, with
26 institutional investors in the United States and the United Kingdom. The placement consists of three
tranches with maturities of 7, 10 and 12 years, respectively. The US dollar and GBP proceeds have been
swapped into euros, for a total amount of EUR 354 million. Furthermore, in March 2010 the Group
arranged a combination of a three-year and five-year bank facility (EUR 350 million and EUR 300 million)
with a consortium of banks. As at year-end 2012 EUR 223 million was drawn. In 2013, in connection with
the offer on all outstanding Dockwise shares, this three-year and five-year bank facility will be redeemed.
For an explanation on the new financing arrangements that were concluded in January 2013, reference is
made to note 29 Subsequent events.
Where applicable, financial ratio and negative pledge clause requirements are met as at December 31,
2012.
Effective interest rates, remaining terms and currencies of the interest-bearing borrowings are disclosed in
the explanatory notes to the financial instruments in the interest rate risk paragraph. As at December 31,
2012, the average interest rate for the non-current portion of mortgage loans and other interest-bearing
loans was 5.17% (2011: 5.33%) and 2.58% (2011: 3.91%) respectively. The non-current portions of
mortgage loans and other interest-bearing loans due later than five years amount to EUR 82.1 million
(2011: EUR 59.1 million) and EUR 143.9 million (2011: EUR 348.4 million) respectively.
24. EMPLOYEE BENEFITS
The liabilities associated with employee benefits consist of defined benefit pension schemes and other
liabilities relating to a number of defined contribution schemes in foreign countries and jubilee benefits.
They amount to a total of:
Note 2012 2011
Defined benefit pension schemes [24.1] 104,576 76,386
Other liabilities on account of employee benefits 8,508 7,478
Employee benefits 113,084 83,864
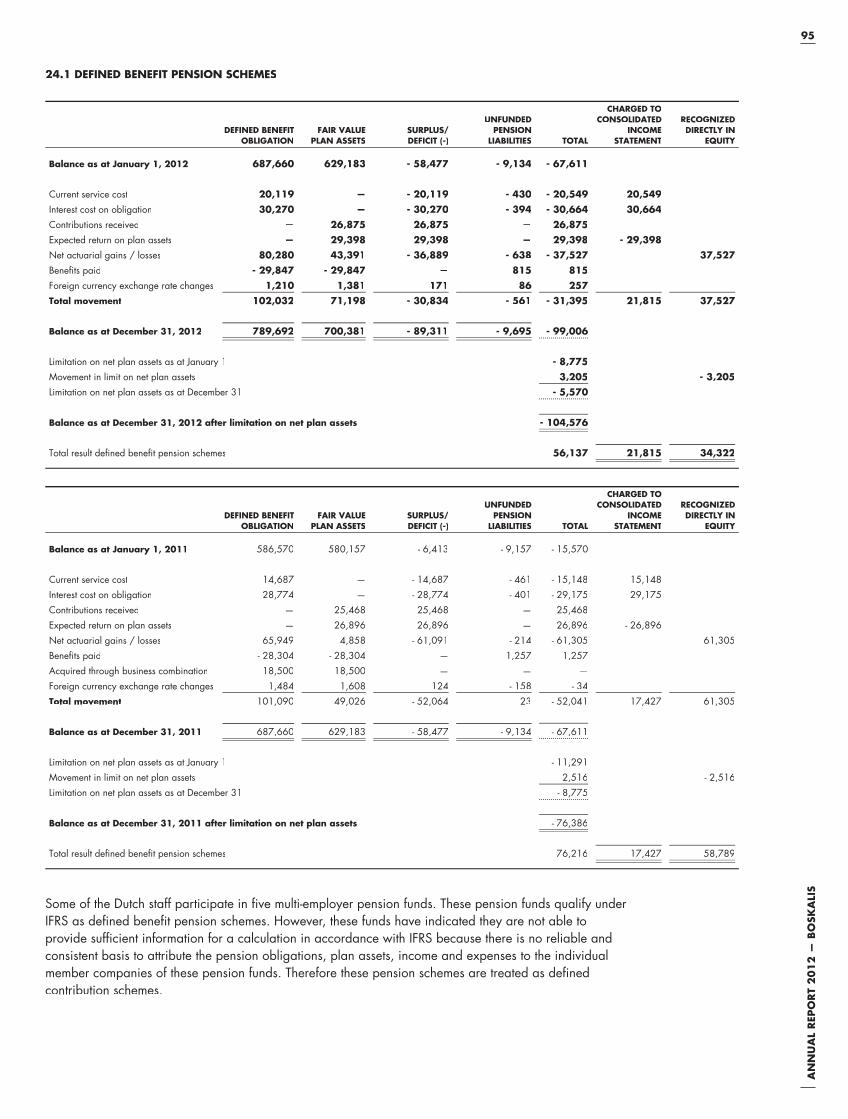
95
AN
NU
AL
REP
OR
T 2
01
2 —
BO
SKA
LIS
24.1 DEFINED BENEFIT PENSION SCHEMES
DEFINED BENEFITOBLIGATION
FAIR VALUEPLAN ASSETS
SURPLUS/DEFICIT (-)
UNFUNDEDPENSION
LIABILITIES TOTAL
CHARGED TOCONSOLIDATED
INCOMESTATEMENT
RECOGNIZEDDIRECTLY IN
EQUITY
Balance as at January 1, 2012 687,660 629,183 - 58,477 - 9,134 - 67,611
Current service cost 20,119 — - 20,119 - 430 - 20,549 20,549
Interest cost on obligation 30,270 — - 30,270 - 394 - 30,664 30,664
Contributions received — 26,875 26,875 — 26,875
Expected return on plan assets — 29,398 29,398 — 29,398 - 29,398
Net actuarial gains / losses 80,280 43,391 - 36,889 - 638 - 37,527 37,527
Benefits paid - 29,847 - 29,847 — 815 815
Foreign currency exchange rate changes 1,210 1,381 171 86 257
Total movement 102,032 71,198 - 30,834 - 561 - 31,395 21,815 37,527
Balance as at December 31, 2012 789,692 700,381 - 89,311 - 9,695 - 99,006
Limitation on net plan assets as at January 1 - 8,775
Movement in limit on net plan assets 3,205 - 3,205
Limitation on net plan assets as at December 31 - 5,570
Balance as at December 31, 2012 after limitation on net plan assets - 104,576
Total result defined benefit pension schemes 56,137 21,815 34,322
DEFINED BENEFITOBLIGATION
FAIR VALUEPLAN ASSETS
SURPLUS/DEFICIT (-)
UNFUNDEDPENSION
LIABILITIES TOTAL
CHARGED TOCONSOLIDATED
INCOMESTATEMENT
RECOGNIZEDDIRECTLY IN
EQUITY
Balance as at January 1, 2011 586,570 580,157 - 6,413 - 9,157 - 15,570
Current service cost 14,687 — - 14,687 - 461 - 15,148 15,148
Interest cost on obligation 28,774 — - 28,774 - 401 - 29,175 29,175
Contributions received — 25,468 25,468 — 25,468
Expected return on plan assets — 26,896 26,896 — 26,896 - 26,896
Net actuarial gains / losses 65,949 4,858 - 61,091 - 214 - 61,305 61,305
Benefits paid - 28,304 - 28,304 — 1,257 1,257
Acquired through business combination 18,500 18,500 — — —
Foreign currency exchange rate changes 1,484 1,608 124 - 158 - 34
Total movement 101,090 49,026 - 52,064 23 - 52,041 17,427 61,305
Balance as at December 31, 2011 687,660 629,183 - 58,477 - 9,134 - 67,611
Limitation on net plan assets as at January 1 - 11,291
Movement in limit on net plan assets 2,516 - 2,516
Limitation on net plan assets as at December 31 - 8,775
Balance as at December 31, 2011 after limitation on net plan assets - 76,386
Total result defined benefit pension schemes 76,216 17,427 58,789
Some of the Dutch staff participate in five multi-employer pension funds. These pension funds qualify under
IFRS as defined benefit pension schemes. However, these funds have indicated they are not able to
provide sufficient information for a calculation in accordance with IFRS because there is no reliable and
consistent basis to attribute the pension obligations, plan assets, income and expenses to the individual
member companies of these pension funds. Therefore these pension schemes are treated as defined
contribution schemes.
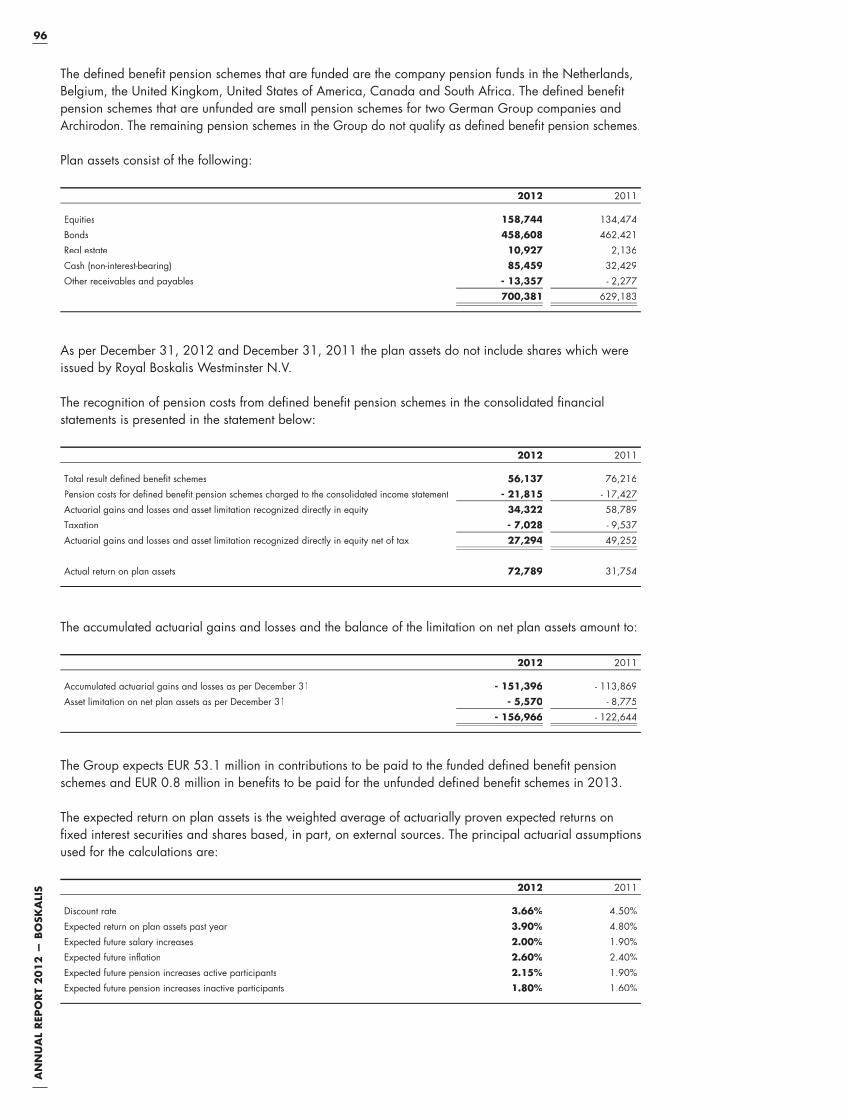
96A
NN
UA
L R
EPO
RT
20
12
— B
OSK
ALI
S
The defined benefit pension schemes that are funded are the company pension funds in the Netherlands,
Belgium, the United Kingkom, United States of America, Canada and South Africa. The defined benefit
pension schemes that are unfunded are small pension schemes for two German Group companies and
Archirodon. The remaining pension schemes in the Group do not qualify as defined benefit pension schemes.
Plan assets consist of the following:
2012 2011
Equities 158,744 134,474
Bonds 458,608 462,421
Real estate 10,927 2,136
Cash (non-interest-bearing) 85,459 32,429
Other receivables and payables - 13,357 - 2,277
700,381 629,183
As per December 31, 2012 and December 31, 2011 the plan assets do not include shares which were
issued by Royal Boskalis Westminster N.V.
The recognition of pension costs from defined benefit pension schemes in the consolidated financial
statements is presented in the statement below:
2012 2011
Total result defined benefit schemes 56,137 76,216
Pension costs for defined benefit pension schemes charged to the consolidated income statement - 21,815 - 17,427
Actuarial gains and losses and asset limitation recognized directly in equity 34,322 58,789
Taxation - 7,028 - 9,537
Actuarial gains and losses and asset limitation recognized directly in equity net of tax 27,294 49,252
Actual return on plan assets 72,789 31,754
The accumulated actuarial gains and losses and the balance of the limitation on net plan assets amount to:
2012 2011
Accumulated actuarial gains and losses as per December 31 - 151,396 - 113,869
Asset limitation on net plan assets as per December 31 - 5,570 - 8,775
- 156,966 - 122,644
The Group expects EUR 53.1 million in contributions to be paid to the funded defined benefit pension
schemes and EUR 0.8 million in benefits to be paid for the unfunded defined benefit schemes in 2013.
The expected return on plan assets is the weighted average of actuarially proven expected returns on
fixed interest securities and shares based, in part, on external sources. The principal actuarial assumptions
used for the calculations are:
2012 2011
Discount rate 3.66% 4.50%
Expected return on plan assets past year 3.90% 4.80%
Expected future salary increases 2.00% 1.90%
Expected future inflation 2.60% 2.40%
Expected future pension increases active participants 2.15% 1.90%
Expected future pension increases inactive participants 1.80% 1.60%

97
AN
NU
AL
REP
OR
T 2
01
2 —
BO
SKA
LIS
Historical information:
2012 2011 2010 2009 2008
Defined benefit obligation - 789,692 - 687,660 - 586,570 - 327,872 - 301,853
Fair value of plan assets 700,381 629,183 580,157 327,935 287,007
Surplus / deficit (-) - 89,311 - 58,477 - 6,413 63 - 14,846
Unfunded pension liabilities - 9,695 - 9,134 - 9,157 - 8,288 - 7,598
Total surplus / deficit (-) - 99,006 - 67,611 - 15,570 - 8,225 - 22,444
Experience adjustments arising on plan liabilities 44,254 - 10,922 - 16,512 - 1,264 7,929
Experience adjustments arising on plan assets 43,391 4,858 18,770 27,081 - 56,011
Experience adjustments are defined as all gains / losses (-) due to changes other than changes in the
discount rate.
25. PROVISIONSUNFAVOURABLEAND ONEROUS
CONTRACTS CLAIMSGUARANTEE
OBLIGATIONS
SOILDECONTAMINA-
TION OTHER TOTAL 2011
Balance as at January 1, 2012 8,558 12,156 7,311 4,302 5,912 38,239 57,493
Acquired through business combinations — — — — — — 2,885
In / (out) consoldiation — — — — — — - 1,589
Provisions made during the year 371 — 276 23 1,477 2,147 5,300
Provisions used during the year — - 20 - 256 — - 1,334 - 1,610 - 17,054
Provisions reversed during the year - 1,725 — — — - 701 - 2,426 - 4,211
Other movements 871 — - 1,513 — - 3,795 - 4,437 - 5,467
Exchange rate differences - 473 — - 111 — 31 - 553 - 93
Discount to present value — 948 — — — 948 975
Balance as at December 31, 2012 7,602 13,084 5,707 4,325 1,590 32,308 38,239
Non-current 5,811 13,084 3,577 2,464 1,466 26,402 26,996
Current 1,791 — 2,130 1,861 124 5,906 11,243
Balance as at December 31, 2012 7,602 13,084 5,707 4,325 1,590 32,308 38,239
The provision for unfavourable and onerous contracts consist mainly of provisions, resulting from business
combinations, for projects or customer contracts which, when valued at fair value, are determined as
unfavourable. The other provisions relate mainly to warranty liabilities, expected costs for cleaning up soil
contamination and claims for completed projects received in the year and in previous years. The Group
disputes these claims and has made an assessment of the projected costs resulting from these claims. The
results of the claims are uncertain and may differ from the above listed provisions.
26. TRADE AND OTHER PAYABLES
2012 2011
Trade payables 260,734 238,039
Taxes and social security payables 67,242 81,286
Amounts due to associated companies 6,211 11,308
Other creditors and accruals 889,067 902,492
1,223,254 1,233,125
The trade and other payables are generally not interest-bearing.

98A
NN
UA
L R
EPO
RT
20
12
— B
OSK
ALI
S27. FINANCIAL INSTRUMENTS
GENERALPursuant to a financial policy maintained by the Board of Management, the Group and its Group companies
use several financial instruments in the ordinary course of business. The policy with respect to financial
instruments is disclosed in more detail in the Annual Report in the “Corporate Governance” chapter. The
Group’s financial instruments are cash and cash equivalents, trade and other receivables, interest-bearing
loans and bank overdrafts, trade and other payables and derivatives. The Group enters into derivative
transactions, mainly foreign currency forward contracts and to a limited extent interest rate swaps, to
hedge against the related risks as the Group’s policy is not to trade in derivatives.
27.1 FINANCIAL RISK MANAGEMENTThe Group has exposure to the following risks from its use of financial instruments:
Credit risk
Liquidity risk
Market risk, existing of: currency risk, interest rate risk and price risk
27.1.1 CREDIT RISKThe Group has a strict acceptance and hedging policy for credit risks, resulting from payment and political
risks. In principle, credit risks are covered by means of bank guarantees, insurance, advance payments,
etcetera, except in the case of creditworthy, first class debtors. These procedures and the (geographical)
diversification of the operations of the Group companies reduce the risk with regard to credit concentration.
Exposure to credit risk
Credit risk is the risk of financial loss to the Group if a customer or counterparty to a financial instrument
fails to meet its contractual obligations, and arises principally from the Group’s trade and other receivables.
The Group’s exposure to credit risk is mainly determined by the individual characteristics of each of the
customers and the location of these customers.
A large part of the Group’s projects in progress within the operational segments Dredging, Offshore
Energy and Inland Infra is directly or indirectly with state controlled authorities and (contractors of) oil and
gas producers in various countries and geograhical areas. Activities relating to Harbor Towage activities TT
(part of Towage & Salvage) are often performed for major ship owing companies and harbor agents.
Receivables relating to terminal services (part of Towage & Salvage) are generally outstanding with oil
and gas producers, therefore a significant portion of the receivables relates to clients from these
industries. Salvage receivables (part of Towage & Salvage) are mainly outstaning with shipping
companies and their Protection & Indemnity Associations, or “P&I Clubs”. In general there is healthy
diversification of receivables with different customers in several countries in which the Group is performing
its activities. Ongoing credit evaluation is performed on the financial condition of accounts receivable.
The credit history of the Group over the recent years indicates that bad debts incurred are insignificant
compared to the level of activities. Therefore, management is of the opinion that credit risk is adequately
controlled through the currently applicable procedures.
The maximum credit risk as per balance sheet date, without taking into account the aforementioned financial
risk coverage instruments and policy, consists of the book values of the financial assets as stated below:
December 31
2012 2011
Non-current receivables 23,959 112,064
Trade receivables 563,916 518,164
Amounts due from associated companies 16,781 22,973
Other receivables and prepayments 372,339 408,034
Derivatives (receivable) 16,390 7,235
Income tax receivable 14,350 21,298
Cash and cash equivalents 398,102 397,957
1,405,837 1,487,725
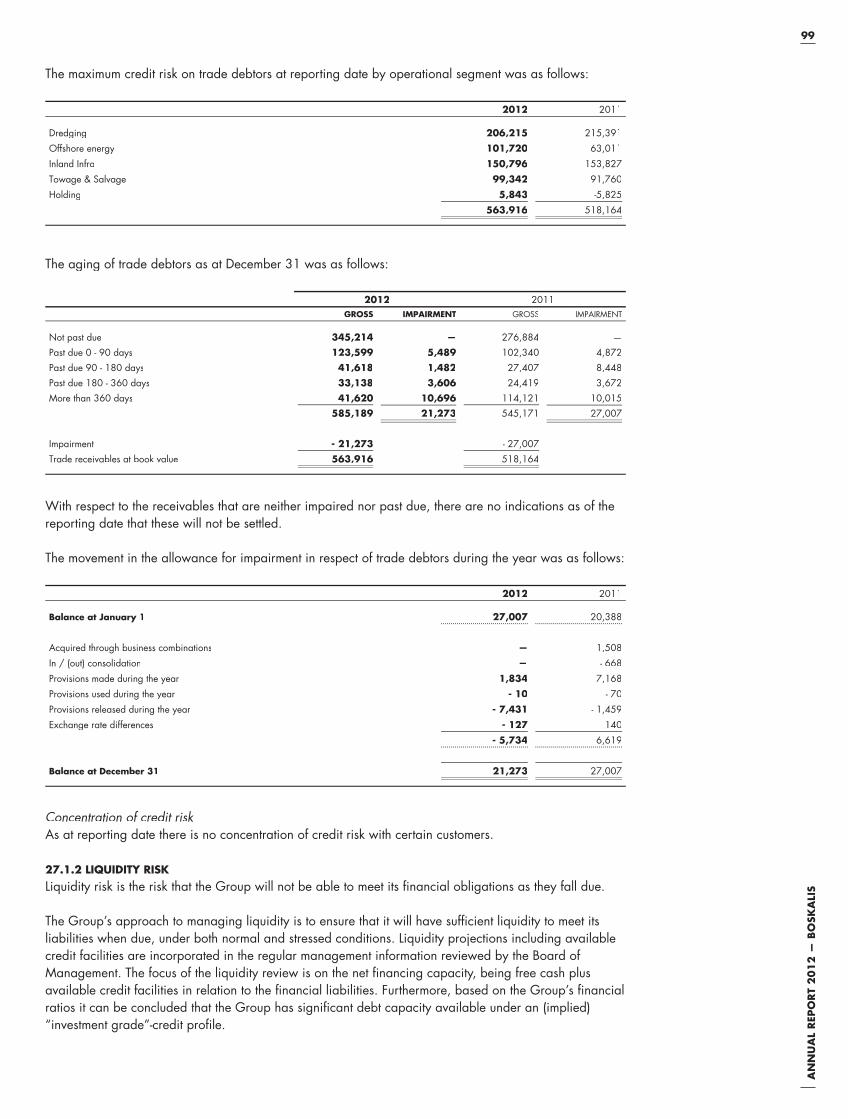
99
AN
NU
AL
REP
OR
T 2
01
2 —
BO
SKA
LIS
The maximum credit risk on trade debtors at reporting date by operational segment was as follows:
2012 2011
Dredging 206,215 215,391
Offshore energy 101,720 63,011
Inland Infra 150,796 153,827
Towage & Salvage 99,342 91,760
Holding 5,843 -5,825
563,916 518,164
The aging of trade debtors as at December 31 was as follows:
2012 2011
GROSS IMPAIRMENT GROSS IMPAIRMENT
Not past due 345,214 — 276,884 —
Past due 0 - 90 days 123,599 5,489 102,340 4,872
Past due 90 - 180 days 41,618 1,482 27,407 8,448
Past due 180 - 360 days 33,138 3,606 24,419 3,672
More than 360 days 41,620 10,696 114,121 10,015
585,189 21,273 545,171 27,007
Impairment - 21,273 - 27,007
Trade receivables at book value 563,916 518,164
With respect to the receivables that are neither impaired nor past due, there are no indications as of the
reporting date that these will not be settled.
The movement in the allowance for impairment in respect of trade debtors during the year was as follows:
2012 2011
Balance at January 1 27,007 20,388
Acquired through business combinations — 1,508
In / (out) consolidation — - 668
Provisions made during the year 1,834 7,168
Provisions used during the year - 10 - 70
Provisions released during the year - 7,431 - 1,459
Exchange rate differences - 127 140
- 5,734 6,619
Balance at December 31 21,273 27,007
Concentration of credit risk
As at reporting date there is no concentration of credit risk with certain customers.
27.1.2 LIQUIDITY RISKLiquidity risk is the risk that the Group will not be able to meet its financial obligations as they fall due.
The Group’s approach to managing liquidity is to ensure that it will have sufficient liquidity to meet its
liabilities when due, under both normal and stressed conditions. Liquidity projections including available
credit facilities are incorporated in the regular management information reviewed by the Board of
Management. The focus of the liquidity review is on the net financing capacity, being free cash plus
available credit facilities in relation to the financial liabilities. Furthermore, based on the Group’s financial
ratios it can be concluded that the Group has significant debt capacity available under an (implied)
“investment grade”-credit profile.

100A
NN
UA
L R
EPO
RT
20
12
— B
OSK
ALI
S
The following are the contractual maturities of financial liabilities, including estimated interest payments
and excluding the impact of netting agreements:
As at December 31, 2012 Book valueContractualcash flows One year or less 1 - 5 years
More than5 years
Mortgage loans - 265,351 - 322,320 - 39,109 - 188,167 - 95,044
Other interest-bearing loans - 722,439 - 800,668 - 375,405 - 257,601 - 167,662
Bank overdrafts - 8,120 - 8,120 - 8,120 — —
Trade and other payables - 1,223,254 - 1,223,254 - 1,223,254 — —
Current tax payable - 138,114 - 138,114 - 138,114 — —
Derivatives - 39,018 - 39,018 - 20,247 - 2,470 - 16,301
- 2,396,296 - 2,531,494 - 1,804,249 - 448,238 - 279,007
As at December 31, 2011 Book valueContractualcash flows One year or less 1 - 5 years
More than5 years
Mortgage loans - 198,477 - 244,316 - 62,503 - 110,501 - 71,312
Other interest-bearing loans - 593,791 - 717,241 - 83,490 - 251,617 - 382,134
Bank overdrafts - 15,364 - 15,364 - 15,364 — —
Trade and other payables - 1,233,125 - 1,233,125 - 1,233,125 — —
Current tax payable - 149,816 - 149,816 - 149,816 — —
Derivatives - 31,315 - 31,315 - 20,853 2,202 - 12,664
- 2,221,888 - 2,391,177 - 1,565,151 - 359,916 - 466,110
27.1.3 MARKET RISKMarket risk concerns the risk that group income or the value of investments in financial instruments is
adversely affected by changes in market prices, such as exchange rates and interest rates. The objective
of managing market risks is to keep the market risk position within acceptable boundaries while achieving
the best possible return.
Currency risk
A significant proportion of the projects is denominated in foreign currencies. That means that reported
financial results and cash flows are exposed to risks ensuing from changes in exchange rates. The Board
of Management has established a detailed currency risk management policy stipulating as main principle
that currency risk, arising from transactions, must be hedged as soon as they occur, usually with forward
contracts. Financial derivatives are used exclusively insofar as there are underlying real transactions,
mainly future cash flows from contracted projects. Hedge accounting is applied to the majority of these
cash flow hedges.
Exposure to currency risk
The Group’s currency risk management policy was carried out during 2012 and resulted in a non-material
sensitivity of the Group to currency transaction risk.
The following significant exchange rates applied during the year under review:
Average rate Reporting date spot rate
Euro 2012 2011 2012 2011
US Dollar 1,291 1,383 1,322 1,298
Arab Emirates Dirham 4,741 5,091 4,856 4,768
Singapore Dollar 1,614 1,738 1,620 1,680
South African Rand 10,601 9,995 11,210 10,480
Australian Dollar 1,250 1,339 1,270 1,270
Brazilian Real 2,519 2,316 2,700 2,420
Indian Rupees 68,710 64,640 72,500 68,900
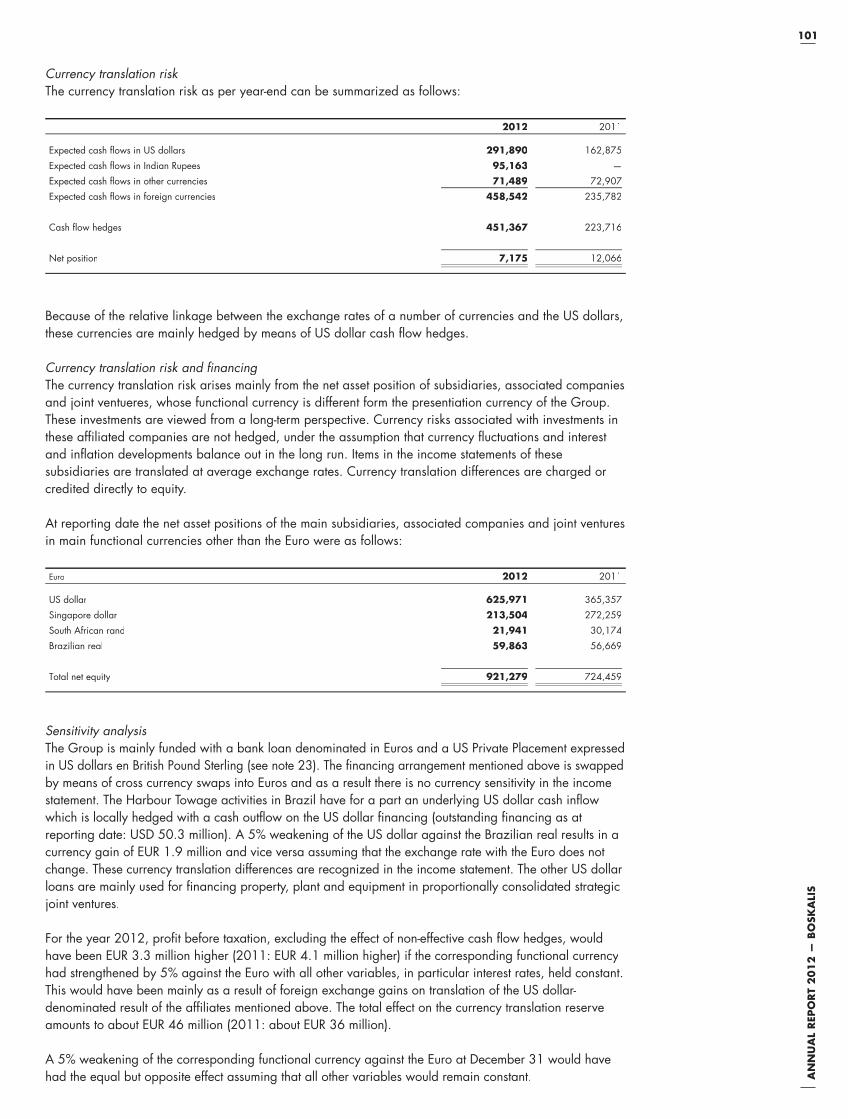
101
AN
NU
AL
REP
OR
T 2
01
2 —
BO
SKA
LIS
Currency translation risk
The currency translation risk as per year-end can be summarized as follows:
2012 2011
Expected cash flows in US dollars 291,890 162,875
Expected cash flows in Indian Rupees 95,163 —
Expected cash flows in other currencies 71,489 72,907
Expected cash flows in foreign currencies 458,542 235,782
Cash flow hedges 451,367 223,716
Net position 7,175 12,066
Because of the relative linkage between the exchange rates of a number of currencies and the US dollars,
these currencies are mainly hedged by means of US dollar cash flow hedges.
Currency translation risk and fi nancing
The currency translation risk arises mainly from the net asset position of subsidiaries, associated companies
and joint ventueres, whose functional currency is different form the presentiation currency of the Group.
These investments are viewed from a long-term perspective. Currency risks associated with investments in
these affiliated companies are not hedged, under the assumption that currency fluctuations and interest
and inflation developments balance out in the long run. Items in the income statements of these
sub sidiaries are translated at average exchange rates. Currency translation differences are charged or
credited directly to equity.
At reporting date the net asset positions of the main subsidiaries, associated companies and joint ventures
in main functional currencies other than the Euro were as follows:
Euro 2012 2011
US dollar 625,971 365,357
Singapore dollar 213,504 272,259
South African rand 21,941 30,174
Brazilian real 59,863 56,669
Total net equity 921,279 724,459
Sensitivity analysis
The Group is mainly funded with a bank loan denominated in Euros and a US Private Placement expressed
in US dollars en British Pound Sterling (see note 23). The financing arrangement mentioned above is swapped
by means of cross currency swaps into Euros and as a result there is no currency sensitivity in the income
statement. The Harbour Towage activities in Brazil have for a part an underlying US dollar cash inflow
which is locally hedged with a cash outflow on the US dollar financing (outstanding financing as at
reporting date: USD 50.3 million). A 5% weakening of the US dollar against the Brazilian real results in a
currency gain of EUR 1.9 million and vice versa assuming that the exchange rate with the Euro does not
change. These currency translation differences are recognized in the income statement. The other US dollar
loans are mainly used for financing property, plant and equipment in proportionally consolidated strategic
joint ventures.
For the year 2012, profit before taxation, excluding the effect of non-effective cash flow hedges, would
have been EUR 3.3 million higher (2011: EUR 4.1 million higher) if the corresponding functional currency
had strengthened by 5% against the Euro with all other variables, in particular interest rates, held constant.
This would have been mainly as a result of foreign exchange gains on translation of the US dollar-
denominated result of the affiliates mentioned above. The total effect on the currency translation reserve
amounts to about EUR 46 million (2011: about EUR 36 million).
A 5% weakening of the corresponding functional currency against the Euro at December 31 would have
had the equal but opposite effect assuming that all other variables would remain constant.
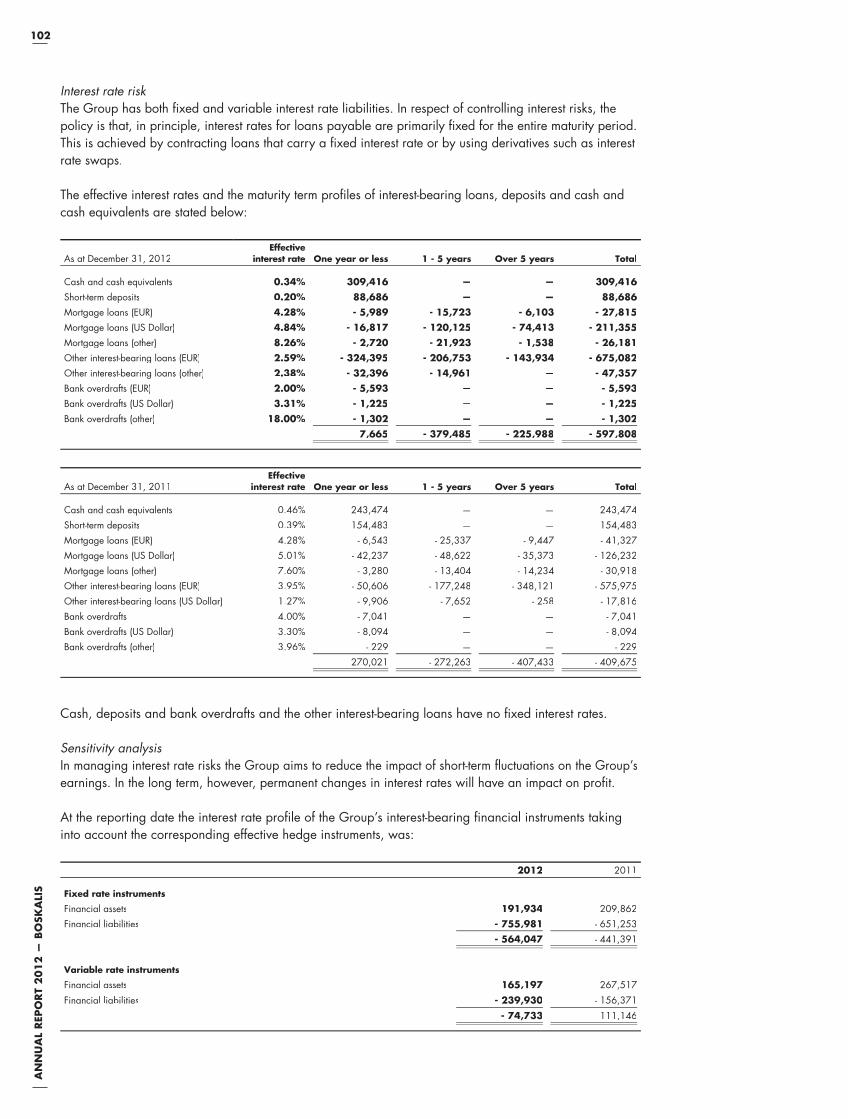
102A
NN
UA
L R
EPO
RT
20
12
— B
OSK
ALI
S
Interest rate risk
The Group has both fixed and variable interest rate liabilities. In respect of controlling interest risks, the
policy is that, in principle, interest rates for loans payable are primarily fixed for the entire maturity period.
This is achieved by contracting loans that carry a fixed interest rate or by using derivatives such as interest
rate swaps.
The effective interest rates and the maturity term profiles of interest-bearing loans, deposits and cash and
cash equivalents are stated below:
As at December 31, 2012Effective
interest rate One year or less 1 - 5 years Over 5 years Total
Cash and cash equivalents 0.34% 309,416 — — 309,416
Short-term deposits 0.20% 88,686 — — 88,686
Mortgage loans (EUR) 4.28% - 5,989 - 15,723 - 6,103 - 27,815
Mortgage loans (US Dollar) 4.84% - 16,817 - 120,125 - 74,413 - 211,355
Mortgage loans (other) 8.26% - 2,720 - 21,923 - 1,538 - 26,181
Other interest-bearing loans (EUR) 2.59% - 324,395 - 206,753 - 143,934 - 675,082
Other interest-bearing loans (other) 2.38% - 32,396 - 14,961 — - 47,357
Bank overdrafts (EUR) 2.00% - 5,593 — — - 5,593
Bank overdrafts (US Dollar) 3.31% - 1,225 — — - 1,225
Bank overdrafts (other) 18.00% - 1,302 — — - 1,302
7,665 - 379,485 - 225,988 - 597,808
As at December 31, 2011Effective
interest rate One year or less 1 - 5 years Over 5 years Total
Cash and cash equivalents 0.46% 243,474 — — 243,474
Short-term deposits 0.39% 154,483 — — 154,483
Mortgage loans (EUR) 4.28% - 6,543 - 25,337 - 9,447 - 41,327
Mortgage loans (US Dollar) 5.01% - 42,237 - 48,622 - 35,373 - 126,232
Mortgage loans (other) 7.60% - 3,280 - 13,404 - 14,234 - 30,918
Other interest-bearing loans (EUR) 3.95% - 50,606 - 177,248 - 348,121 - 575,975
Other interest-bearing loans (US Dollar) 1.27% - 9,906 - 7,652 - 258 - 17,816
Bank overdrafts 4.00% - 7,041 — — - 7,041
Bank overdrafts (US Dollar) 3.30% - 8,094 — — - 8,094
Bank overdrafts (other) 3.96% - 229 — — - 229
270,021 - 272,263 - 407,433 - 409,675
Cash, deposits and bank overdrafts and the other interest-bearing loans have no fixed interest rates.
Sensitivity analysis
In managing interest rate risks the Group aims to reduce the impact of short-term fluctuations on the Group’s
earnings. In the long term, however, permanent changes in interest rates will have an impact on profit.
At the reporting date the interest rate profile of the Group’s interest-bearing financial instruments taking
into account the corresponding effective hedge instruments, was:
2012 2011
Fixed rate instruments
Financial assets 191,934 209,862
Financial liabilities - 755,981 - 651,253
- 564,047 - 441,391
Variable rate instruments
Financial assets 165,197 267,517
Financial liabilities - 239,930 - 156,371
- 74,733 111,146

103
AN
NU
AL
REP
OR
T 2
01
2 —
BO
SKA
LIS
A decrease of 100 basis points in interest rates at December 31, 2012 would have increased the
Group’s profit before income tax by approximately EUR 0.7 million (2011: EUR 1.1 million decrease),
with all other variables, in particular currency exchange rates, held constant.
Price risks
Risks related to price developments on the purchasing side, such as amongst others increased wages,
costs of materials, sub-contracting costs and fuel, which are usually for the Group’s account, are also
taken into account when preparing cost price calculations and tenders. Wherever possible, especially on
projects that extend over a long period of time, price index clauses are included in contracts.
With regard to fuel price risk, the Board of Management has established a fuel price risk management
policy stipulating approved fuel price risk management instruments. These include: delivery of fuel by the
client, price escalation clauses, fixed price supply contracts and financial derivatives (forward, future and
swap contracts).
27.2 ON-BALANCE FINANCIAL INSTRUMENTS AND FAIR VALUEFinancial instruments accounted for under assets and liabilities are financial fixed assets, cash and cash
equivalents, receivables, and current and non-current liabilities. Derivatives are mainly future cash flows
hedged by forward contracts to which hedge accounting is applied. Furthermore, strategic alliances
currently hold a number of interest rate swaps. These are recognized under other derivatives.
The fair value of most of the financial instruments does not differ materialy from the book value, with the
exception of, long term and short term, loans and other payables with a fixed rate. The fair value of these
items exceeds the book value by EUR 37.4 million (2011: EUR 15.0 million).
Fair value hierarchy
For the fair value measurement of the recognized financial instruments a fair value hierarchy is defined in
accordance with IFRS 7:
Level 1: quoted prices (unadjusted) in active markets for identical assets or liabilities.
Level 2: inputs other than quoted prices included within Level 1 that are observable for the asset or liability,
either directly (i.e. as prices) or indirectly (i.e. derived from prices).
Level 3: inputs for the asset or liability that are not based on observable market data (unobservable inputs).
The fair value of the derivatives, which is the only category of financial instruments that qualify for this
approach, is measured using level 2 input (2011: level 2).
The fair value of the forward exchange contracts is based on their listed market price, as at the end of the
year (unadjusted market prices in active markets for identical assets and liabilities). The fair value other
financial instruments is based on the actual interest rate as at balance sheet date, taking into account
terms and maturity. The effective interest does not differ materially from the current market interest. The fair
value of non-interest bearing financial instruments with a maturity of twelve months or less is supposted to
be equal to their book value.

104A
NN
UA
L R
EPO
RT
20
12
— B
OSK
ALI
S
Derivatives
The composition of outstanding derivatives at year-end is presented below.
2012 WITHIN ONE YEAR AFTER ONE YEAR TOTAL
USD forward selling (in US Dollar) 374,080 19,026 393,106
USD forward buying (in US Dollar) 18,238 — 18,238
Forward selling of other currencies (average contract rates in EUR) 132,098 45,284 177,382
Forward buying of other currencies (average contract rates in EUR) 12,929 — 12,929
Fuel hedges (in US Dollar) 507 1,135 1,642
Interest Rate Swaps (in US Dollar) - 786 - 1,726 - 2,512
Interest Rate Swaps (in EUR) 784 - 16,916 - 16,132
2011 WITHIN ONE YEAR AFTER ONE YEAR TOTAL
USD forward selling (in US Dollar) 338,798 18,871 357,669
USD forward buying (in US Dollar) 70,389 — 70,389
Forward selling of other currencies (average contract rates in EUR) 81,355 10,818 92,173
Forward buying of other currencies (average contract rates in EUR) 53,668 — 53,668
Fuel hedges (in US Dollar) - 66 - 115 - 181
Interest Rate Swaps (in US Dollar) - 763 - 1,893 - 2,656
Interest Rate Swaps (in EUR) 1,788 - 5,311 - 3,523
The remaining time to maturity of these derivatives has a direct relation to the remaining time to maturity
of the relating underlying contracts in the order book.
Cash flows from forward currency buyings and sellings can be rolled forward at settlement date when
they differ from the underlying cash flows.
The results on effective cash flow hedges are recognized in group equity as stated below:
2012 2011
Opening balance Hedging reserve as at January 1 2,799 - 2,354
Movement in fair value of effective cash flow hedges recognized in group equity - 15,744 2,937
Transferred to the income statement - 3,244 3,137
Total directly recognized in group equity - 18,988 6,074
Taxation 4,749 - 921
Directly charged to the Hedging reserve (net of taxes) - 14,239 5,153
Balance Hedging reserve as at December 31 - 11,440 2,799
The results on non-effective cash flow hedges are presented within the operational costs and amount to
EUR 0.9 million positive over 2012 (2011: EUR 0.9 million negative).
27.3 CAPITAL MANAGEMENTThe Board of Management’s policy is to maintain a strong capital base so as to maintain customer, investor,
creditor and market confidence and to support future development of the business. The Board of Management
monitors the return on equity, which the Group defines as net operating income divided by total shareholders’
equity, excluding minority interests. The Board of Management also monitors the level of dividend to be paid
to holders of ordinary shares. For the dividendpolicy reference is made to the Shareholdersinformation in the
Annual Report.
The Board of Management seeks to maintain a balance between the higher returns that might be possible
with higher levels of borrowings and the benefits of a sound capital position. The Group’s target is to achieve
a long-term return on equity of at least 12%; in 2012 the return was 13.8% (2011: 15.4%).
Royal Boskalis Westminster N.V. does not have a defined share buy-back plan.
There were no changes in the Group’s approach to capital management during the year.
Neither the Group or any of its Group companies are subject to externally imposed capital requirements.

105
AN
NU
AL
REP
OR
T 2
01
2 —
BO
SKA
LIS
The Group’s net debt (EUR 2,973 million; 2011: EUR 2,926 million) to Group equity (EUR 1,916 million; 2011:
EUR 1,747 million) at the reporting date amounts to 1.55 (2011: 1.67).
27.4 OTHER FINANCIAL INSTRUMENTSPursuant to the decision of the General Meeting of Shareholders held on May 9, 2001, the Stichting
Continuïteit KBW has acquired the right to take cumulative protective preference shares in Royal Boskalis
Westminster N.V. for a nominal amount which shall be equal to the nominal amount of ordinary shares
outstanding at the time of the issue. This right qualifies as a derivative financial liability, with the following
important conditions. The cumulative protective preference shares are to be issued at par against a 25%
cash contribution, the remainder after call-up by the Stichting in consultation with Royal Boskalis
Westminster N.V. After the issue, Royal Boskalis Westminster N.V. has the obligation to buy or cancel the
shares upon the Stichting’s request. The preferential dividend right amounts to Euribor increased by 4% at
most. The interest and credit risk is limited. The fair value of the option right is nil.
28. COMMITMENTS AND CONTINGENT LIABILITIES
Operational lease obligations
The operational lease obligations relate primarily to the operational lease of cars and offices. Additional
clauses are not taken into account presuming that these are not unconditional.
Non-redeemable operating lease contracts are recognized at nominal amounts and are due as follows:
2012 2011
Within one year 36,558 27,152
Between one and five years 31,481 32,592
After more than five years 12,206 5,741
80,245 65,485
Guarantees
The guarantee commitments as at December 31, 2012 amount to EUR 991 million
(2011: EUR 960 million) and can be specified as follows:
2012 2011
Guarantees provided by third parties with respect to:
Associated companies 21,000 10,000
Contracts and joint ventures 968,000 948,000
Lease obligations and other financial obligations 2,000 2,000
991,000 960,000
For the above guarantees outstanding as at December 31, 2012, counter-guarantees have been provided
to financial institutions for approximately EUR 989 million (2011: approximately EUR 958 million).
Nineteen key Group companies are jointly and severally liable in respect of credit facilities and guarantees
provided to several Group companies. In respect of these credit facilities, it has been agreed to limit the
provision of further securities on existing property, plant and equipment. Both the strategic alliances Smit-
Lamnalco and Archirodon have, in relation to subsidiaries of the Group, nonrecourse credit- and
guarantee facilities in place. Within a strategic alliance certain companies are jointly and severally liable
with respect to the credit- and guarantee facilities. Group companies are jointly and severally liable for the
non-consolidated part of the liabilities of their joint ventures: in total EUR 131 million (2011:
EUR 150 million). Group companies are also jointly and severally liable for performance obligations for
contracts with third parties in project-driven construction consortiums. In addition, certain recourse
obligations exist in respect of project financiers and guarantees of deployment relating to equipment.
Where deemed necessary, provisions have been made.
Capital commitments
At year-end 2012, capital commitments amount to EUR 126 million (year-end 2011: EUR 193 million).
106A
NN
UA
L R
EPO
RT
20
12
— B
OSK
ALI
S
Capital contribution obligations
At year-end 2012, capital contribution obligations relating to PPS-companies amount to EUR 12.4 million.
Other
Some legal proceedings and investigations have been instituted against (entities of) Royal Boskalis
Westminster N.V. Where deemed necessary and if a reliable estimate of the future cash flows can
be made, provisions have been made. Dutch companies were part of a fiscal unity. The companies
are therefore liable for the tax obligations of the fiscal unity as a whole.
29. SUBSEQUENT EVENTS
Proposed profi t appropriation 2012
An amount of EUR 105.1 million will be added to the retained earnings. The proposal to the Annual
General Meeting will be to appropriate the remainder, EUR 145.1 million, for a dividend payment of
EUR 1.24 per share.
The dividend will be made payable in ordinary shares to be charged to the tax-exempt share premium
or to be charged to the retained earnings, unless a shareholder expressly requests payment in cash.
Business combination Dockwise
By the end of 2012 a shareholding of 33,3% in Dockwise had been acquired and this interest has been
accounted for as an associated company (see note 16). In 2013 the Group has increased, via the
purchase of shares on the stock market, its interest by 8.9% to 42.2%. As at year-end 2012 83.5% of the
shareholders were committed to offer their shares. On March 8, 2013, with more than 92% of the shares
committed, Boskalis has made a mandatory offer for the remaining shares of Dockwise. The offer period
expires on March 13, 2013 and 99% of the shares has been offered. Only after the settlement date on
March 20, 2013, Boskalis will acquire control over Dockwise, which creates a business combination.
Dockwise is the leading marine contractor providing total transport services to the offshore, onshore and
yachting industries as well as installation services of extremely heavy offshore platforms. Acquiring control
in Dockwise provides new strategic opportunities for accelerated growth of the offshore services. The new
combination will be in a better position to serve clients with the optimal deployment of people and
equipment under increasingly complex circumstances worldwide. The Group also expects synergy effects
to result in cost savings. It is expected that the Group’s potential will be strengthened further through
economies of scale, the use of best practices, the optimization of the regional branch office network and
joint purchasing opportunities.
Equity offering
To finance the public offer on all outstanding shares of Dockwise at a price of EUR 18.50 per share,
Boskalis has raised EUR 320 million of equity at a price of EUR 33 per ordinary share. A total number
of 9,696,969 shares were placed. Of these, 3,258,638 shares were placed at HAL Investments B.V.
Also, Boskalis has signed the agreements for the necessary debt financing. The credit facilities consist of
a combination of a 3-year term loan (USD 525 million) and a 5-year revolving credit facility
(EUR 500 million). In addition to these credit facilities, Boskalis has entered into a bridge credit facility
(USD 525 million). It is expected that this bridge facility will be refinanced by issuing a debt capital
market instrument.

107
AN
NU
AL
REP
OR
T 2
01
2 —
BO
SKA
LIS
30. RELATED PARTIES
30.1 IDENTITY OF RELATED PARTIESThe identified related parties to the Group are its Group companies, its joint ventures, its associated
companies (see note 16), its shareholders with significant influence, its pension funds that are classified as
funded defined benefit pension schemes in accordance with IAS 19 and the members of the Supervisory
Board and Board of Management.
GROUP COMPANIESThe following are the most relevant active Group companies.
COMPANY CITY OF INCORPORATIONCOUNTRY OFINCORPORATION 2012 2011
Baggermaatschappij Boskalis B.V. Papendrecht Netherlands 100% 100%
Baggermaatschappij Holland B.V. Papendrecht Netherlands 100% 100%
Boskalis Finance B.V. Papendrecht Netherlands 100% 100%
Boskalis Holding B.V. Papendrecht Netherlands 100% 100%
Boskalis International B.V. Papendrecht Netherlands 100% 100%
Boskalis Maritime Investments B.V. Papendrecht Netherlands 100% 100%
Boskalis Offshore B.V. Papendrecht Netherlands 100% 100%
Boskalis Westminster Dredging B.V. Papendrecht Netherlands 100% 100%
Boskalis Westminster International B.V. Papendrecht Netherlands 100% 100%
Boskalis Westminster Shipping B.V. Papendrecht Netherlands 100% 100%
Boskalis Zinkcon B.V. Papendrecht Netherlands 100% 100%
BW Marine B.V. Papendrecht Netherlands 100% 100%
BW Soco B.V. Sliedrecht Netherlands 100% 100%
Hydronamic B.V. Sliedrecht Netherlands 100% 100%
Boskalis Dolman B.V. Dordrecht Netherlands 100% 100%
A.H. Breijs & Zonen B.V. Rotterdam Netherlands 100% 100%
Boskalis B.V. Rotterdam Netherlands 100% 100%
Rotterdam Tug B.V. Rotterdam Netherlands 100% 100%
SMIT Harbour Towage Rotterdam B.V. Rotterdam Netherlands 100% 100%
SMIT Heavy Lift Europe B.V. Rotterdam Netherlands 100% 100%
Smit Internationale Beheer B.V. Rotterdam Netherlands 100% 100%
Smit Internationale N.V. Rotterdam Netherlands 100% 100%
Smit Internationale Overseas B.V. Rotterdam Netherlands 100% 100%
SMIT Marine Projects B.V. Rotterdam Netherlands 100% 100%
Smit Netherlands B.V. Rotterdam Netherlands 100% 100%
SMIT Salvage B.V. Rotterdam Netherlands 100% 100%
SMIT Subsea Europe B.V. Rotterdam Netherlands 100% 100%
SMIT Transport Europe B.V. Rotterdam Netherlands 100% 100%
Smit Vessel Management Services B.V. Rotterdam Netherlands 100% 100%
Zuurmond Groen B.V. Acquoy Netherlands 100% 100%
Cofra B.V. Amsterdam Netherlands 100% 100%
Aannemingsbedrijf De Jong & Zoon Beesd B.V. Beesd Netherlands 100% 100%
Kroeze Infra B.V. Beesd Netherlands 100% —
Aannemingsmaatschappij Markus B.V. Halfweg Netherlands 100% 100%
MNO Vervat - International B.V. Nieuw Vennep Netherlands 100% 100%
MNO Vervat B.V. Nieuw Vennep Netherlands 100% 100%
MNO Vervat-Wegen B.V. Nieuw Vennep Netherlands 100% 100%
M.N.O. Vervat Grond- Weg- en Waterbouw B.V. Rotterdam Netherlands 100% 100%
J. van Vliet B.V. Wormerveer Netherlands 100% 100%
SMIT Transport Belgium N.V. Antwerpen Belgium 100% 100%
Unie van Redding- en Sleepdienst Belgium N.V. Antwerpen Belgium 100% 100%
Unie van Redding- en Sleepdienst N.V. Antwerpen Belgium 100% 100%
Dredging & Contracting Belgium N.V. Overijse Belgium 100% 100%
Heinrich Hirdes GmbH Hamburg Germany 100% 100%
Heinrich Hirdes EOD Services GmbH Hamburg Germany 100% 100%
Heinrich Hirdes Kampfmittelräumung GmbH Duisburg Germany 100% 100%
Rock Fall Company Ltd Ayrshire United Kingdom 100% 100%
Boskalis Westminster Ltd Fareham United Kingdom 100% 100%
Cofra Ltd Fareham United Kingdom 100% 100%
Westminster Dredging (Overseas) Ltd Fareham United Kingdom 100% 100%
Westminster Gravels Ltd Fareham United Kingdom 100% 100%
Smit Subsea Africa Ltd. Isle of Man United Kingdom 100% 100%
Smit Harbour Towage (U.K.) Ltd. Londen United Kingdom 100% 100%
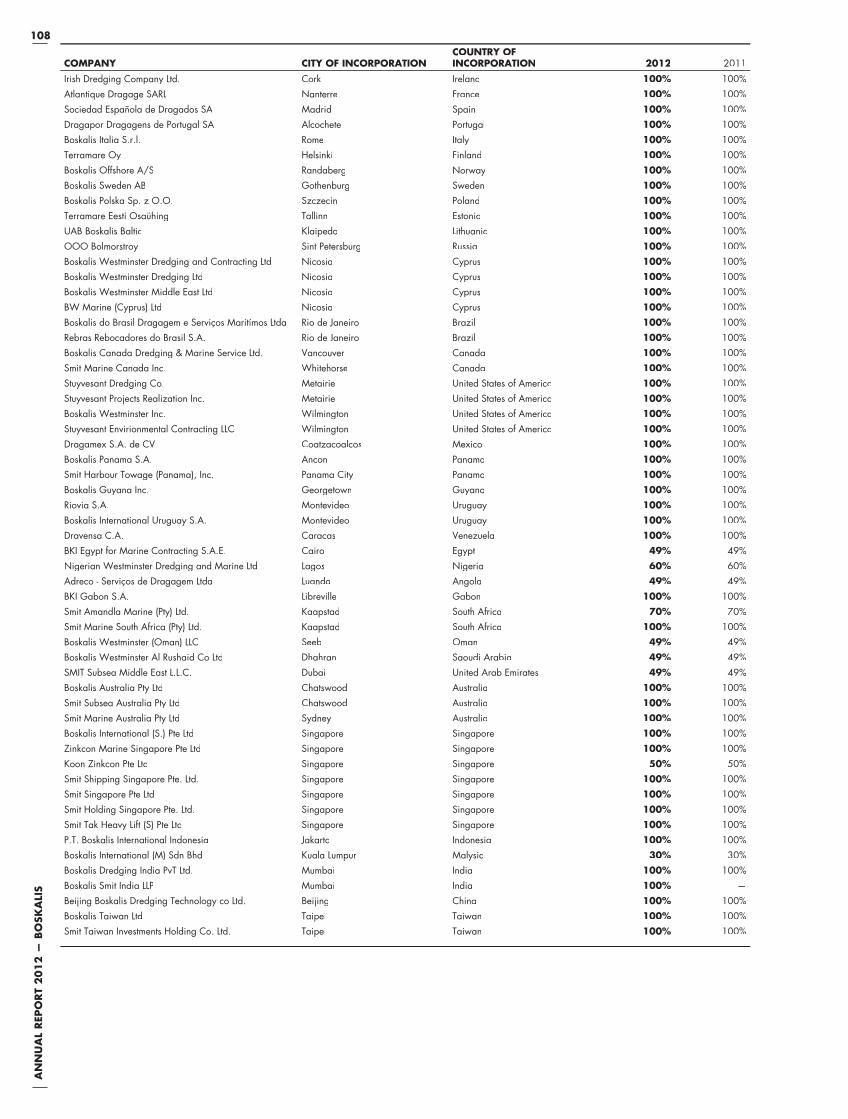
108A
NN
UA
L R
EPO
RT
20
12
— B
OSK
ALI
S
COMPANY CITY OF INCORPORATIONCOUNTRY OFINCORPORATION 2012 2011
Irish Dredging Company Ltd. Cork Ireland 100% 100%
Atlantique Dragage SARL Nanterre France 100% 100%
Sociedad Española de Dragados SA Madrid Spain 100% 100%
Dragapor Dragagens de Portugal SA Alcochete Portugal 100% 100%
Boskalis Italia S.r.l. Rome Italy 100% 100%
Terramare Oy Helsinki Finland 100% 100%
Boskalis Offshore A/S Randaberg Norway 100% 100%
Boskalis Sweden AB Gothenburg Sweden 100% 100%
Boskalis Polska Sp. z O.O. Szczecin Poland 100% 100%
Terramare Eesti Osaühing Tallinn Estonia 100% 100%
UAB Boskalis Baltic Klaipeda Lithuania 100% 100%
OOO Bolmorstroy Sint Petersburg Russia 100% 100%
Boskalis Westminster Dredging and Contracting Ltd Nicosia Cyprus 100% 100%
Boskalis Westminster Dredging Ltd Nicosia Cyprus 100% 100%
Boskalis Westminster Middle East Ltd Nicosia Cyprus 100% 100%
BW Marine (Cyprus) Ltd Nicosia Cyprus 100% 100%
Boskalis do Brasil Dragagem e Serviços Maritímos Ltda Rio de Janeiro Brazil 100% 100%
Rebras Rebocadores do Brasil S.A. Rio de Janeiro Brazil 100% 100%
Boskalis Canada Dredging & Marine Service Ltd. Vancouver Canada 100% 100%
Smit Marine Canada Inc. Whitehorse Canada 100% 100%
Stuyvesant Dredging Co. Metairie United States of America 100% 100%
Stuyvesant Projects Realization Inc. Metairie United States of America 100% 100%
Boskalis Westminster Inc. Wilmington United States of America 100% 100%
Stuyvesant Envirionmental Contracting LLC Wilmington United States of America 100% 100%
Dragamex S.A. de CV Coatzacoalcos Mexico 100% 100%
Boskalis Panama S.A. Ancon Panama 100% 100%
Smit Harbour Towage (Panama), Inc. Panama City Panama 100% 100%
Boskalis Guyana Inc. Georgetown Guyana 100% 100%
Riovia S.A. Montevideo Uruguay 100% 100%
Boskalis International Uruguay S.A. Montevideo Uruguay 100% 100%
Dravensa C.A. Caracas Venezuela 100% 100%
BKI Egypt for Marine Contracting S.A.E. Cairo Egypt 49% 49%
Nigerian Westminster Dredging and Marine Ltd Lagos Nigeria 60% 60%
Adreco - Serviços de Dragagem Ltda Luanda Angola 49% 49%
BKI Gabon S.A. Libreville Gabon 100% 100%
Smit Amandla Marine (Pty) Ltd. Kaapstad South Africa 70% 70%
Smit Marine South Africa (Pty) Ltd. Kaapstad South Africa 100% 100%
Boskalis Westminster (Oman) LLC Seeb Oman 49% 49%
Boskalis Westminster Al Rushaid Co Ltd Dhahran Saoudi Arabia 49% 49%
SMIT Subsea Middle East L.L.C. Dubai United Arab Emirates 49% 49%
Boskalis Australia Pty Ltd Chatswood Australia 100% 100%
Smit Subsea Australia Pty Ltd Chatswood Australia 100% 100%
Smit Marine Australia Pty Ltd Sydney Australia 100% 100%
Boskalis International (S.) Pte Ltd Singapore Singapore 100% 100%
Zinkcon Marine Singapore Pte Ltd Singapore Singapore 100% 100%
Koon Zinkcon Pte Ltd Singapore Singapore 50% 50%
Smit Shipping Singapore Pte. Ltd. Singapore Singapore 100% 100%
Smit Singapore Pte Ltd Singapore Singapore 100% 100%
Smit Holding Singapore Pte. Ltd. Singapore Singapore 100% 100%
Smit Tak Heavy Lift (S) Pte Ltd Singapore Singapore 100% 100%
P.T. Boskalis International Indonesia Jakarta Indonesia 100% 100%
Boskalis International (M) Sdn Bhd Kuala Lumpur Malysia 30% 30%
Boskalis Dredging India PvT Ltd. Mumbai India 100% 100%
Boskalis Smit India LLP Mumbai India 100% —
Beijing Boskalis Dredging Technology co Ltd. Beijing China 100% 100%
Boskalis Taiwan Ltd Taipei Taiwan 100% 100%
Smit Taiwan Investments Holding Co. Ltd. Taipei Taiwan 100% 100%

109
AN
NU
AL
REP
OR
T 2
01
2 —
BO
SKA
LIS
JOINT VENTURESThe following are the most relevant active joint ventures.
Strategic alliances:
ENTITY COUNTRY OF INCORPORATION 2012 2011
Archirodon Group N.V. Netherlands 40% 40%
Deeprock CV Netherlands 50% 50%
Overseas Contracting & Chartering Services B.V. Netherlands 50% 50%
Rock Braz B.V. Netherlands 50% 50%
Adriatic Towage S.r.l. Italy 50% 50%
Lamnalco Ltd Sharjah, United Arab Emirates 50% 50%
Ocean Marine Egypt S.A.E Egypt 50% 50%
Asian Lift Pte. Ltd. Singapore 50% 50%
Keppel Smit Towage Pte. Ltd. Singapore 49% 49%
Maju Maritime Pte. Ltd. Singapore 49% 49%
Donjon-SMIT LLC United States of America 50% 50%
Project-driven construction consortiums:
ENTITY COUNTRY OF INCORPORATION 2012 2011
A4all Netherlands 10% 10%
BOFF-TID NL vof Netherlands 50% 50%
Boskalis International - Dredging International CV Netherlands 50% 50%
Boskalis Offshore AS - Tideway vof Netherlands 50% 50%
Boskalis Offshore/Rohde Nielsen vof Netherlands 50% 50%
Combinatie A2 HoMa Netherlands 38% 38%
Combinatie A4 Steenbergen Netherlands 35% —
Combinatie Amschberg Netherlands 33% 33%
Combinatie Bowegro vof Netherlands 50% 50%
Combinatie BVNN Boskalis Dolman vof Netherlands 50% 50%
Combinatie de Keent Netherlands 50% 50%
Combinatie 'De Trambaan' Netherlands 50% —
Combinatie DGVZ Maasvlakte Netherlands 50% —
Combinatie Grond & Wegen N201 Netherlands 50% 50%
Combinatie Haarrijnse Plas Netherlands 25% 25%
Combinatie KWS Infra - Boskalis N23 Netherlands 30% 30%
Combinatie KWS/Boskalis Westrandweg GWW Netherlands 50% 50%
Combinatie OBM Netherlands 33% —
Combinatie Plas van Heenvliet Netherlands 33% —
Combinatie Smink BKD vof Netherlands 50% 50%
Combinatie Trajectum Novum vof Netherlands 13% 13%
Combinatie Van Kessel - Boskalis Gouwe Park Netherlands 50% 50%
Combinatie Westpoort vof Netherlands 15% 15%
Consortium N11 Netherlands 17% 17%
CV Projectbureau Grensmaas Netherlands 17% 17%
Het Groene Schip Netherlands 50% —
Infrateam N50 Ramspol Netherlands 18% 18%
Joint Venture 'Baltic 2-export' vof Netherlands 50% —
Joint Venture Boskalis - Jac. Rijk Netherlands 50% 50%
Joint Venture 'Meerwind SUD/OST' vof Netherlands 50% —
N201 Aalsmeer - Uithoorn Netherlands 15% 15%
Offshore Windforce vof Netherlands 50% —
Projectorganisatie Uitbreiding Maasvlakte (PUMA) vof Netherlands 50% 50%
SJV Rena vof Netherlands 50% —
Stemat/Boskalis vof Netherlands 50% 50%
Tideway - Boskalis Offshore L9 vof Netherlands 50% 50%
Trajectum Novum Grond & Wegen Netherlands 33% 33%
Vof BKO-TID Netherlands 50% 50%
Binnenhafenkaje Kiel Germany 50% 50%
Offshorebasis Cuxhaven LP8 Germany 50% 50%
Weserunterhaltungsbaggerung Bremerhaven Germany 50% 50%
Swinoujscie Breakwater Poland 60% 60%
OOO Mortekhnika Russia 50% 50%
Britannia Satellites United Kingdom 50% 50%
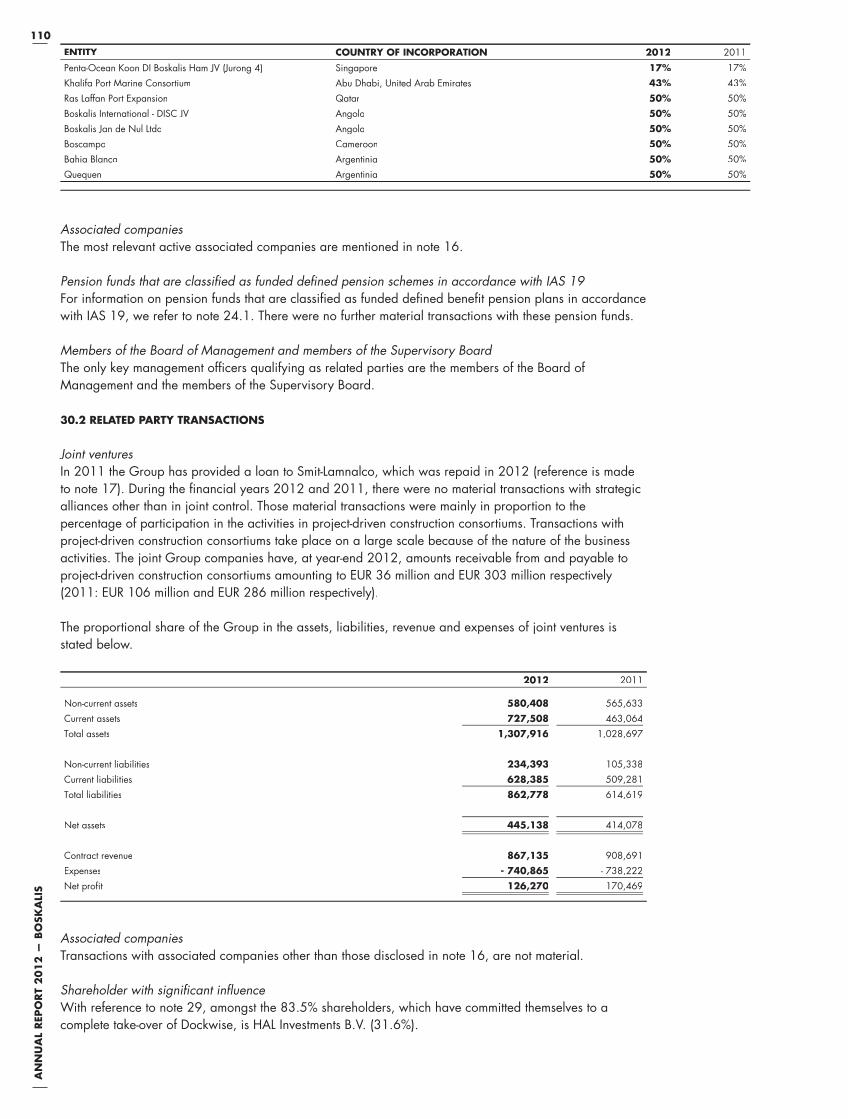
110A
NN
UA
L R
EPO
RT
20
12
— B
OSK
ALI
SENTITY COUNTRY OF INCORPORATION 2012 2011
Penta-Ocean Koon DI Boskalis Ham JV (Jurong 4) Singapore 17% 17%
Khalifa Port Marine Consortium Abu Dhabi, United Arab Emirates 43% 43%
Ras Laffan Port Expansion Qatar 50% 50%
Boskalis International - DISC JV Angola 50% 50%
Boskalis Jan de Nul Ltda Angola 50% 50%
Boscampo Cameroon 50% 50%
Bahia Blanca Argentinia 50% 50%
Quequen Argentinia 50% 50%
Associated companies
The most relevant active associated companies are mentioned in note 16.
Pension funds that are classifi ed as funded defi ned pension schemes in accordance with IAS 19
For information on pension funds that are classified as funded defined benefit pension plans in accordance
with IAS 19, we refer to note 24.1. There were no further material transactions with these pension funds.
Members of the Board of Management and members of the Supervisory Board
The only key management officers qualifying as related parties are the members of the Board of
Management and the members of the Supervisory Board.
30.2 RELATED PARTY TRANSACTIONS
Joint ventures
In 2011 the Group has provided a loan to Smit-Lamnalco, which was repaid in 2012 (reference is made
to note 17). During the financial years 2012 and 2011, there were no material transactions with strategic
alliances other than in joint control. Those material transactions were mainly in proportion to the
percentage of participation in the activities in project-driven construction consortiums. Transactions with
project-driven construction consortiums take place on a large scale because of the nature of the business
activities. The joint Group companies have, at year-end 2012, amounts receivable from and payable to
project-driven construction consortiums amounting to EUR 36 million and EUR 303 million respectively
(2011: EUR 106 million and EUR 286 million respectively).
The proportional share of the Group in the assets, liabilities, revenue and expenses of joint ventures is
stated below.
2012 2011
Non-current assets 580,408 565,633
Current assets 727,508 463,064
Total assets 1,307,916 1,028,697
Non-current liabilities 234,393 105,338
Current liabilities 628,385 509,281
Total liabilities 862,778 614,619
Net assets 445,138 414,078
Contract revenue 867,135 908,691
Expenses - 740,865 - 738,222
Net profit 126,270 170,469
Associated companies
Transactions with associated companies other than those disclosed in note 16, are not material.
Shareholder with signifi cant infl uence
With reference to note 29, amongst the 83.5% shareholders, which have committed themselves to a
complete take-over of Dockwise, is HAL Investments B.V. (31.6%).
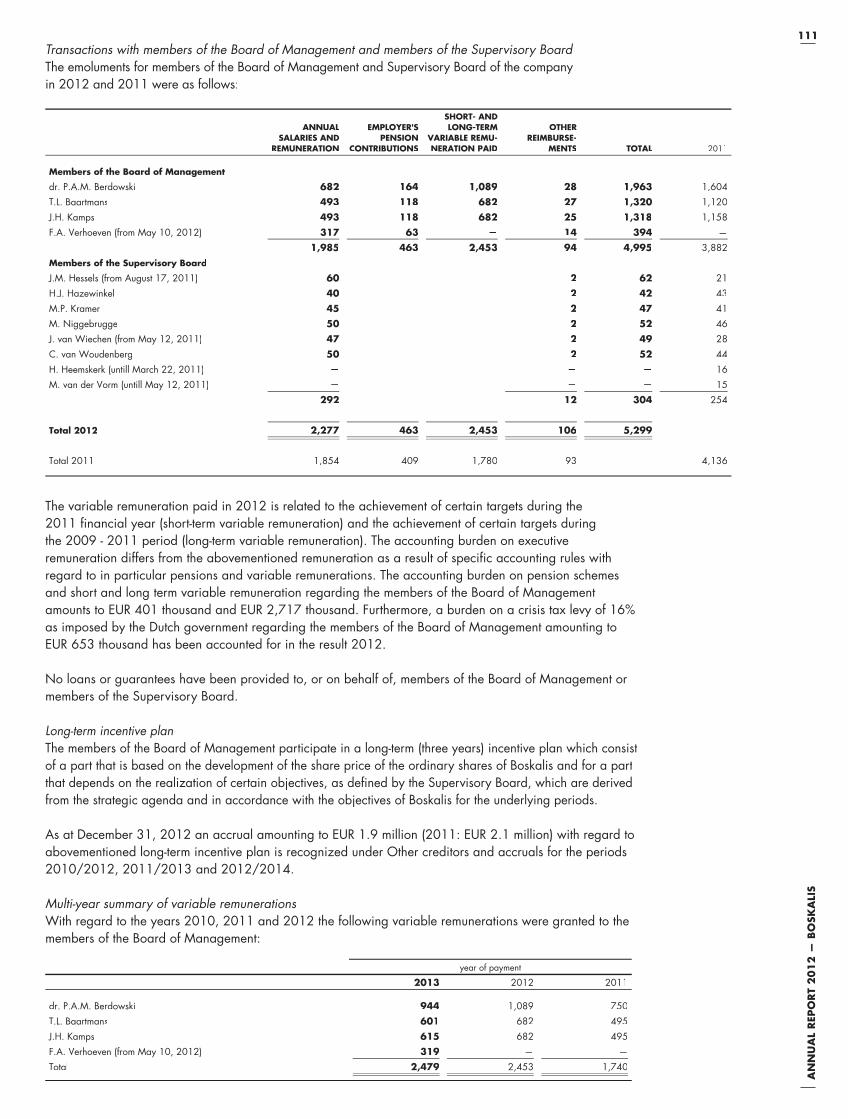
111
AN
NU
AL
REP
OR
T 2
01
2 —
BO
SKA
LIS
Transactions with members of the Board of Management and members of the Supervisory Board
The emoluments for members of the Board of Management and Supervisory Board of the company
in 2012 and 2011 were as follows:
ANNUALSALARIES AND
REMUNERATION
EMPLOYER'SPENSION
CONTRIBUTIONS
SHORT- ANDLONG-TERM
VARIABLE REMU-NERATION PAID
OTHER REIMBURSE-
MENTS TOTAL 2011
Members of the Board of Management
dr. P.A.M. Berdowski 682 164 1,089 28 1,963 1,604
T.L. Baartmans 493 118 682 27 1,320 1,120
J.H. Kamps 493 118 682 25 1,318 1,158
F.A. Verhoeven (from May 10, 2012) 317 63 — 14 394 —
1,985 463 2,453 94 4,995 3,882
Members of the Supervisory Board
J.M. Hessels (from August 17, 2011) 60 2 62 21
H.J. Hazewinkel 40 2 42 43
M.P. Kramer 45 2 47 41
M. Niggebrugge 50 2 52 46
J. van Wiechen (from May 12, 2011) 47 2 49 28
C. van Woudenberg 50 2 52 44
H. Heemskerk (untill March 22, 2011) — — — 16
M. van der Vorm (untill May 12, 2011) — — — 15
292 12 304 254
Total 2012 2,277 463 2,453 106 5,299
Total 2011 1,854 409 1,780 93 4,136
The variable remuneration paid in 2012 is related to the achievement of certain targets during the
2011 financial year (short-term variable remuneration) and the achievement of certain targets during
the 2009 - 2011 period (long-term variable remuneration). The accounting burden on executive
remuneration differs from the abovementioned remuneration as a result of specific accounting rules with
regard to in particular pensions and variable remunerations. The accounting burden on pension schemes
and short and long term variable remuneration regarding the members of the Board of Management
amounts to EUR 401 thousand and EUR 2,717 thousand. Furthermore, a burden on a crisis tax levy of 16%
as imposed by the Dutch government regarding the members of the Board of Management amounting to
EUR 653 thousand has been accounted for in the result 2012.
No loans or guarantees have been provided to, or on behalf of, members of the Board of Management or
members of the Supervisory Board.
Long-term incentive plan
The members of the Board of Management participate in a long-term (three years) incentive plan which consist
of a part that is based on the development of the share price of the ordinary shares of Boskalis and for a part
that depends on the realization of certain objectives, as defined by the Supervisory Board, which are derived
from the strategic agenda and in accordance with the objectives of Boskalis for the underlying periods.
As at December 31, 2012 an accrual amounting to EUR 1.9 million (2011: EUR 2.1 million) with regard to
abovementioned long-term incentive plan is recognized under Other creditors and accruals for the periods
2010/2012, 2011/2013 and 2012/2014.
Multi-year summary of variable remunerations
With regard to the years 2010, 2011 and 2012 the following variable remunerations were granted to the
members of the Board of Management:
year of payment
2013 2012 2011
dr. P.A.M. Berdowski 944 1,089 750
T.L. Baartmans 601 682 495
J.H. Kamps 615 682 495
F.A. Verhoeven (from May 10, 2012) 319 — —
Total 2,479 2,453 1,740

112A
NN
UA
L R
EPO
RT
20
12
— B
OSK
ALI
S
(in thousands of EUR) Note 2012 2011
Result of group companies [3] 250,193 254,254
Other results, after taxation — —
Net profit 250,193 254,254
(in thousands of EUR) Note 2012 2011
ASSETS
Non-current assets
Investments in group companies [3] 1,897,380 1,728,694
1,897,380 1,728,694
Current assets
Amounts due from group companies 798 3,225
Other receivables — 950
798 4,175
TOTAL ASSETS 1,898,178 1,732,869
EQUITY AND LIABILITIES
Shareholders' equity
Issued capital [4] 85,827 82,777
Share premium [4] 229,452 230,360
Legal reserve [5] 325,853 307,306
Hedging reserve [5] - 11,440 2,799
Revaluation reserve [5] 20,434 21,150
Currency translation reserve [5] - 3,234 1,740
Actuarial reserve [5] - 130,114 - 102,820
Retained earnings [5] 1,131,034 935,246
Profit for the year [6] 250,193 254,254
1,898,005 1,732,812
Current liabilities
Trade and other payables 173 57
173 57
TOTAL EQUITY AND LIABILITIES 1,898,178 1,732,869
COMPANY INCOME STATEMENT
COMPANY BALANCE SHEET BEFORE PROFIT APPROPRIATION

113
AN
NU
AL
REP
OR
T 2
01
2 —
BO
SKA
LIS
(in thousands of EUR) Note
Balance as at January 1,
2012Cash
dividendStock
dividend
Addition toretainedearnings
Othermovements
Totalrecognized
income andexpense
Balance as at December 31,
2012
Issued capital [4] 82,777 3,050 85,827
Share premium [4] 230,360 - 908 229,452
313,137 2,142 315,279
Other legal reserve [5] 307,306 — 18,547 — 325,853
Hedging reserve [5] 2,799 — — - 14,239 - 11,440
Revaluation reserve [5] 21,150 — - 716 — 20,434
Currency translation reserve [5] 1,740 — — - 4,974 - 3,234
Actuarial reserve [5] - 102,820 — — - 27,294 - 130,114
Retained earnings [5] 935,246 213,619 - 17,831 — 1,131,034
1,165,421 213,619 — - 46,507 1,332,533
Profit appropriation 2011 254,254 - 38,493 - 2,142 - 213,619 —
Net profit 2012 250,193 250,193
Profit for the year [6] 254,254 - 38,493 - 2,142 - 213,619 250,193 250,193
Shareholders' equity 1,732,812 - 38,493 — — — 203,686 1,898,005
(in thousands of EUR) Note
Balance as at January 1,
2011Cash
dividendStock
dividend
Addition toretainedearnings
Othermovements
Totalrecognized
income andexpense
Balance as at December 31,
2011
Issued capital [4] 80,779 1,998 82,777
Share premium [4] 231,335 - 975 230,360
312,114 1,023 313,137
Other legal reserve [5] 203,524 — 103,782 — 307,306
Hedging reserve [5] - 2,354 — — 5,153 2,799
Revaluation reserve [5] 3,834 — 17,316 — 21,150
Currency translation reserve [5] - 633 — — 2,373 1,740
Actuarial reserve [5] - 53,568 — — - 49,252 - 102,820
Retained earnings [5] 791,536 264,808 - 121,098 — 935,246
942,339 264,808 — - 41,726 1,165,421
Profit appropriation 2010 310,517 - 44,686 - 1,023 - 264,808 —
Net profit 2011 254,254 254,254
Profit for the year [6] 310,517 - 44,686 - 1,023 - 264,808 254,254 254,254
Shareholders' equity 1,564,970 - 44,686 — — — 212,528 1,732,812
STATEMENT OF CHANGES IN SHAREHOLDERS’ EQUITY
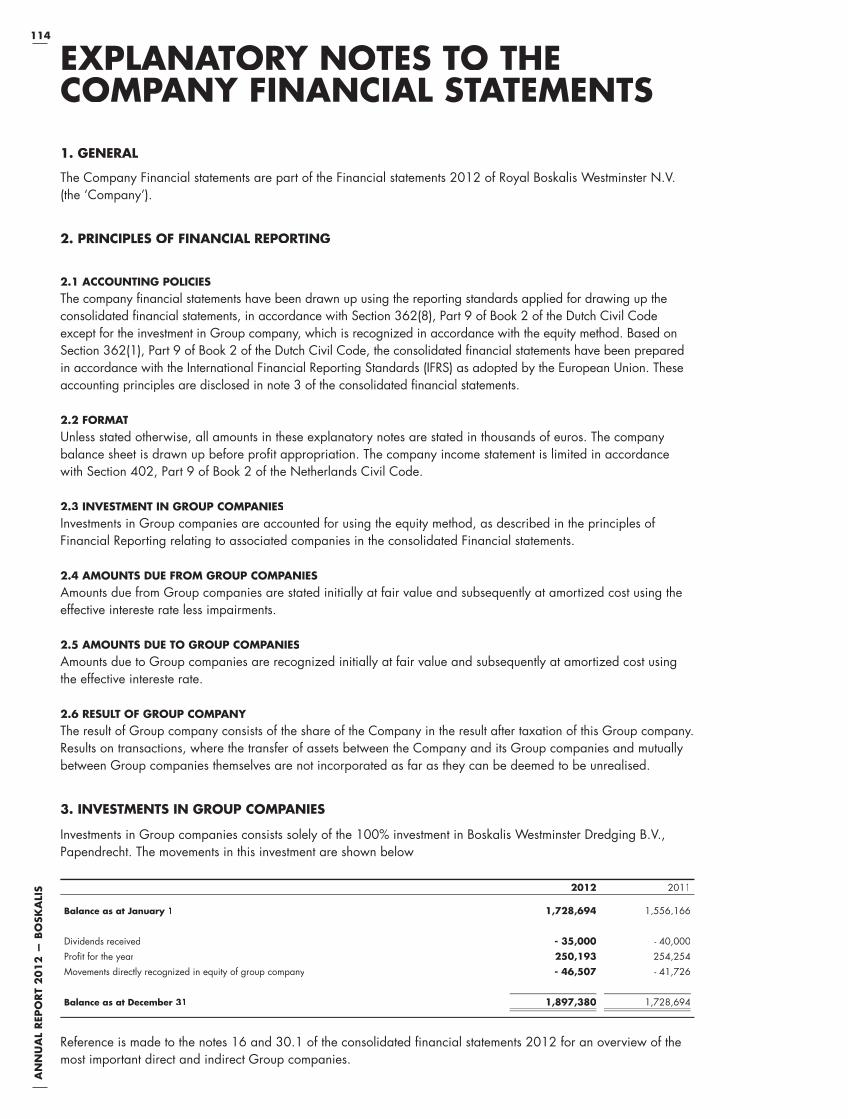
114A
NN
UA
L R
EPO
RT
20
12
— B
OSK
ALI
S
1. GENERAL
The Company Financial statements are part of the Financial statements 2012 of Royal Boskalis Westminster N.V.
(the ‘Company’).
2. PRINCIPLES OF FINANCIAL REPORTING
2.1 ACCOUNTING POLICIESThe company financial statements have been drawn up using the reporting standards applied for drawing up the
consolidated financial statements, in accordance with Section 362(8), Part 9 of Book 2 of the Dutch Civil Code
except for the investment in Group company, which is recognized in accordance with the equity method. Based on
Section 362(1), Part 9 of Book 2 of the Dutch Civil Code, the consolidated financial statements have been prepared
in accordance with the International Financial Reporting Standards (IFRS) as adopted by the European Union. These
accounting principles are disclosed in note 3 of the consolidated financial statements.
2.2 FORMATUnless stated otherwise, all amounts in these explanatory notes are stated in thousands of euros. The company
balance sheet is drawn up before profit appropriation. The company income statement is limited in accordance
with Section 402, Part 9 of Book 2 of the Netherlands Civil Code.
2.3 INVESTMENT IN GROUP COMPANIESInvestments in Group companies are accounted for using the equity method, as described in the principles of
Financial Reporting relating to associated companies in the consolidated Financial statements.
2.4 AMOUNTS DUE FROM GROUP COMPANIESAmounts due from Group companies are stated initially at fair value and subsequently at amortized cost using the
effective intereste rate less impairments.
2.5 AMOUNTS DUE TO GROUP COMPANIESAmounts due to Group companies are recognized initially at fair value and subsequently at amortized cost using
the effective intereste rate.
2.6 RESULT OF GROUP COMPANYThe result of Group company consists of the share of the Company in the result after taxation of this Group company.
Results on transactions, where the transfer of assets between the Company and its Group companies and mutually
between Group companies themselves are not incorporated as far as they can be deemed to be unrealised.
3. INVESTMENTS IN GROUP COMPANIES
Investments in Group companies consists solely of the 100% investment in Boskalis Westminster Dredging B.V.,
Papendrecht. The movements in this investment are shown below
2012 2011
Balance as at January 1 1,728,694 1,556,166
Dividends received - 35,000 - 40,000
Profit for the year 250,193 254,254
Movements directly recognized in equity of group company - 46,507 - 41,726
Balance as at December 31 1,897,380 1,728,694
Reference is made to the notes 16 and 30.1 of the consolidated financial statements 2012 for an overview of the
most important direct and indirect Group companies.
EXPLANATORY NOTES TO THE COMPANY FINANCIAL STATEMENTS

115
AN
NU
AL
REP
OR
T 2
01
2 —
BO
SKA
LIS
4. ISSUED CAPITAL AND SHARE PREMIUM
The authorized share capital of EUR 240 million is divided into 150,000,000 ordinary shares with a par value of
EUR 0.80 each and 50,000,000 cumulative protective preference shares with a par value of EUR 2.40 each.
Issued capital increased by 3,811,937 ordinary shares in the course of 2012 as a result of the distribution of
stock dividend.
(in number of shares) 2012 2011
On issue and fully paid at January 1 103,471,742 100,974,263
Stock dividend 3,811,937 2,497,479
On issue and fully paid at December 31 107,283,679 103,471,742
The issued capital as at December 31, 2012 consists of 107,283,679 ordinary shares with a par value of
EUR 0.80 each and consequently amounts to EUR 85.8 million (2011: EUR 82.8 million).
Of the issued capital as at December 31, 2012, six ordinary shares were owned by Royal Boskalis Westminster N.V.
The as yet unexercised option right to take cumulative protective preference shares in Royal Boskalis Westminster N.V.
has been assigned to the Stichting Continuïteit KBW.
Share premium comprises additional paid-in capital exceeding the par value of outstanding shares. Share premium
is distributable free of tax.
5. OTHER RESERVES
With regard to the difference between the cost price and equity value of entities, either consolidated proportionally
as well as associated companies recognized in accordance with the equity method, a legally required reserve is
recognized because of a lack of control over the distribution of profits only to the extent that these differences are
not included in the accumulated currency translation differences on foreign operations. The legal reserve for
non-distributed profits of group and/or associated companies amounted to EUR 325.9 million at the end of 2012
(2011: EUR 307.3 million). The legal reserve for associated companies is determined on an individual basis.
The other reserves recognized in the company balance sheet are disclosed in the notes to the consolidated financial
statements (note 22.5).
6. PROFIT FOR THE YEAR
An amount of EUR 105.1 million will be added to the retained earnings. The proposal to the Annual General Meeting
will be to appropriate the remainder, EUR 145.1 million, for a dividend payment of EUR 1.24 per ordinary share.
The dividend will be made payable in ordinary shares to be charged to the tax-exempt share premium or to be
charged to the retained earnings, unless a shareholder expressly requests payment in cash.
7. FINANCIAL INSTRUMENTS
General
Pursuant to its use of financial instruments, the Group is exposed to credit risk, liquidity risk and market risk.
The notes to the consolidated financial statements provide information on the Group’s exposure to each of the
aforementioned risks, its objectives, principles and procedures for managing and measuring these risks, as well as
group capital management. These risks, objectives, principles and procedures for managing and measuring these
risks as well as capital management apply mutatis mutandis to the company financial statements of Royal Boskalis
Westminster N.V.
Fair value
The fair value of most of the financial instruments presented in the balance sheet, including receivables, securities,
cash and cash equivalents and current liabilities are close to the book value.
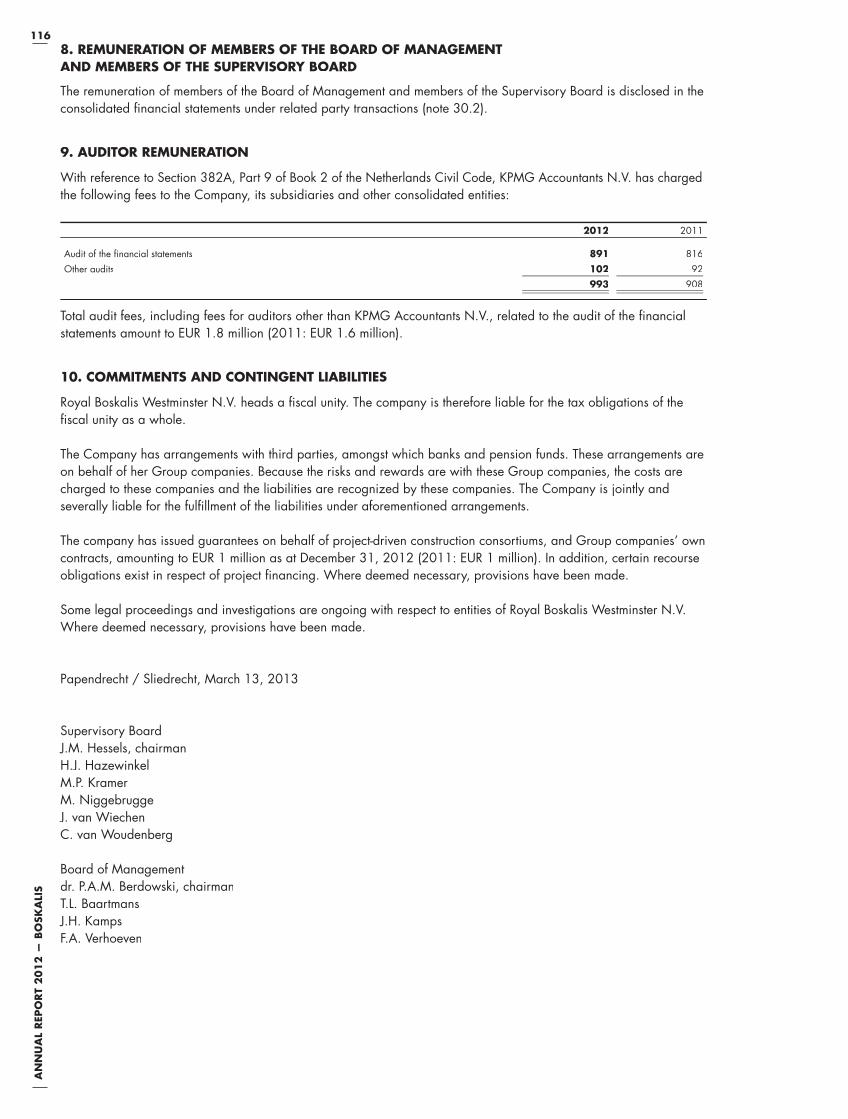
116A
NN
UA
L R
EPO
RT
20
12
— B
OSK
ALI
S8. REMUNERATION OF MEMBERS OF THE BOARD OF MANAGEMENT AND MEMBERS OF THE SUPERVISORY BOARD
The remuneration of members of the Board of Management and members of the Supervisory Board is disclosed in the
consolidated financial statements under related party transactions (note 30.2).
9. AUDITOR REMUNERATION
With reference to Section 382A, Part 9 of Book 2 of the Netherlands Civil Code, KPMG Accountants N.V. has charged
the following fees to the Company, its subsidiaries and other consolidated entities:
2012 2011
Audit of the financial statements 891 816
Other audits 102 92
993 908
Total audit fees, including fees for auditors other than KPMG Accountants N.V., related to the audit of the financial
statements amount to EUR 1.8 million (2011: EUR 1.6 million).
10. COMMITMENTS AND CONTINGENT LIABILITIES
Royal Boskalis Westminster N.V. heads a fiscal unity. The company is therefore liable for the tax obligations of the
fiscal unity as a whole.
The Company has arrangements with third parties, amongst which banks and pension funds. These arrangements are
on behalf of her Group companies. Because the risks and rewards are with these Group companies, the costs are
charged to these companies and the liabilities are recognized by these companies. The Company is jointly and
severally liable for the fulfillment of the liabilities under aforementioned arrangements.
The company has issued guarantees on behalf of project-driven construction consortiums, and Group companies’ own
contracts, amounting to EUR 1 million as at December 31, 2012 (2011: EUR 1 million). In addition, certain recourse
obligations exist in respect of project financing. Where deemed necessary, provisions have been made.
Some legal proceedings and investigations are ongoing with respect to entities of Royal Boskalis Westminster N.V.
Where deemed necessary, provisions have been made.
Papendrecht / Sliedrecht, March 13, 2013
Supervisory Board
J.M. Hessels, chairman
H.J. Hazewinkel
M.P. Kramer
M. Niggebrugge
J. van Wiechen
C. van Woudenberg
Board of Management
dr. P.A.M. Berdowski, chairman
T.L. Baartmans
J.H. Kamps
F.A. Verhoeven
117
AN
NU
AL
REP
OR
T 2
01
2 —
BO
SKA
LIS
PROVISIONS IN THE ARTICLES OF ASSOCIATION RELATING TO PROFIT APPROPRIATION
ARTICLE 28.1. From the profits realized in any financial year, first of all,
distributions will be made on cumulative protective
preference shares if possible, in the amount of the
percentage specified below of the amount that has to be
paid up on these shares as from the beginning of the
financial year to which the distribution is related. The
percentage referred to above equals the average Euribor
interest rate determined for loans with a term of one year
– weighted in respect of the number of days to which this
interest rate applied – during the financial year to which
the distribution is related, increased by four percentage
points at most; this increase will be determined every five
years by the Board of Management subject to the
approval of the Supervisory Board. If in the financial year
in respect of which the above-mentioned distribution takes
place, the amount that has to be paid up on cumulative
protective preference shares has been reduced or,
pursuant to a resolution for further payment, has been
increased, the distribution shall be reduced or, if possible,
be increased by an amount equal to the above-mentioned
percentage of the amount of the reduction or the increase,
as the case may be, calculated from the moment of the
reduction or from the moment further payment became
compulsory. If in the course of any financial year
cumulative protective preference shares have been issued,
the dividend on those cumulative protective preference
shares shall be reduced for that year in proportion to the
day of issue, taking into account a part of a month as a
full month.
2. If and in so far as the profit is not enough to realize the
distribution referred to in paragraph 1, the deficit shall be
distributed from the reserves, subject to statutory provisions.
3. If in any financial year the profit referred to in paragraph
1 is not enough to realize the distributions referred to
above in this article, and furthermore no distribution or
only a partial distribution from the reserves as referred to
in paragraph 2 is realized, so that the deficit is not or not
completely distributed, the provisions of this article and the
provisions of the following paragraphs shall only apply in
the following financial years after the deficit has been
made up for. After application of paragraphs 1, 2 and 3,
no further distribution shall take place on the cumulative
protective preference shares.
4. Out of the remaining profit, an amount shall be reserved
annually to the extent as shall be determined by the Board
of Management under approval of the Supervisory Board.
The remaining part of the profits after reservation, as
referred to in the immediately preceding sentence, is at
the free disposal of the General Meeting of Shareholders
and in case of distribution, the holders of ordinary shares
will be entitled thereto in proportion to their holding of
ordinary shares.
OTHER INFORMATION
ARTICLE 29.1. Dividends shall be made available for payment within
thirty days of their declaration, or any sooner as the
Board of Management may determine.
2. Unclaimed dividends will revert to the company after
five years.
3. If the Board of Management so decides, subject to the
approval of the Supervisory Board, an interim dividend
shall be distributed, subject to the preference of the
cumulative protective preference shares and the provisions
of Article 2:105 of the Dutch Civil Code.
4. The General Meeting of Shareholders may decide, on the
proposal of the Board of Management, that dividends will
be distributed fully or partially in the form of shares in the
company or depositary certificates thereof.
5. The company may only realize distributions to the
shareholder to the extent that its equity capital exceeds the
amount of the subscribed capital, increased by the
reserves that have to be maintained by law or by the
articles of association.
6. A deficit may only be offset against reserves that have to
be maintained by law to the extent that this is permitted by
the law.
PROPOSED PROFIT APPROPRIATION 2012An amount of EUR 105.1 million will be added to the
retained earnings. The proposal to the Annual General
Meeting will be to appropriate the remainder,
EUR 145.1 million, for a dividend payment of
EUR 1.24 per share.
The dividend will be made payable in ordinary shares to be
charged to the tax-exempt share premium or to be charged
to the retained earnings, unless a shareholder expressly
requests payment in cash.

118A
NN
UA
L R
EPO
RT
20
12
— B
OSK
ALI
S
To: Annual General Meeting of Shareholders of
Royal Boskalis Westminster N.V.
REPORT ON THE FINANCIAL STATEMENTSWe have audited the accompanying financial statements 2012
of Royal Boskalis Westminster N.V., Sliedrecht, as set out on
pages 61 to 116. The financial statements include the
consolidated financial statements and the company financial
statements. The consolidated financial statements comprise the
consolidated balance sheet as at 31 December, 2012, the
consolidated income statement, the consolidated statement of
recognized and unrecognized income and expenses, the
consolidated statement of cash flows and consolidated statement
of changes in equity for the year then ended, and notes,
comprising a summary of the significant accounting policies and
other explanatory information. The company financial
statements comprise the company balance sheet as at
31 December, 2012, the company income statement for the
year then ended and the notes, comprising a summary of the
accounting policies and other explanatory information.
MANAGEMENT’S RESPONSIBILITYManagement is responsible for the preparation and fair
presentation of the financial statements in accordance with
International Financial Reporting Standards as adopted by the
European Union and with Part 9 of Book 2 of the Netherlands
Civil Code, and for the preparation of the management board
report in accordance with Part 9 of Book 2 of the Netherlands
Civil Code. Furthermore, management is responsible for such
internal control as it determines is necessary to enable the
preparation of the financial statements that are free from
material misstatement, whether due to fraud or error.
AUDITOR’S RESPONSIBILITYOur responsibility is to express an opinion on these financial
statements based on our audit. We conducted our audit in
accordance with Dutch law, including the Dutch Standards on
Auditing. This requires that we comply with ethical requirements
and plan and perform the audit to obtain reasonable assurance
about whether the financial statements are free from material
misstatement. An audit involves performing procedures to obtain
audit evidence about the amounts and disclosures in the
financial statements. The procedures selected depend on the
auditor’s judgment, including the assessment of the risks of
material misstatement of the financial statements, whether due to
fraud or error. In making those risk assessments, the auditor
considers internal control relevant to the entity’s preparation and
fair presentation of the financial statements in order to design
audit procedures that are appropriate in the circumstances, but
not for the purpose of expressing an opinion on the effectiveness
of the entity’s internal control. An audit also includes evaluating
the appropriateness of accounting policies used and the
reasonableness of accounting estimates made by management,
as well as evaluating the overall presentation of the financial
statements. We believe that the audit evidence we have
obtained is sufficient and appropriate to provide a basis for our
audit opinion.
OPINION WITH RESPECT TO THE CONSOLIDATEDFINANCIAL STATEMENTSIn our opinion, the consolidated financial statements give a true
and fair view of the financial position of Royal Boskalis
Westminster N.V. as at 31 December, 2012 and of its result
and its cash flows for the year then ended in accordance with
International Financial Reporting Standards as adopted by the
European Union and with Part 9 of Book 2 of the Netherlands
Civil Code.
OPINION WITH RESPECT TO THE COMPANY FINANCIAL STATEMENTSIn our opinion, the company financial statements give a true and
fair view of the financial position of Royal Boskalis Westminster
N.V. as at 31 December, 2012 and of its result for the year then
ended in accordance with Part 9 of Book 2 of the Netherlands
Civil Code.
REPORT ON OTHER LEGAL AND REGULATORY REQUIREMENTS Pursuant to the legal requirements under Section 2:393 sub 5
at e and f of the Netherlands Civil Code, we have no
deficiencies to report as a result of our examination whether the
management board report, as set out on pages 31 to 57, to the
extent we can assess, has been prepared in accordance with
part 9 of Book 2 of this Code, and if the information as required
under Section 2:392 sub 1 at b - h has been annexed. Further,
we report that the management board report, to the extent we
can assess, is consistent with the financial statements as required
by Section 2:391 sub 4 of the Netherlands Civil Code.
Rotterdam, 13 March, 2013
KPMG Accountants N.V.
D.J. Randeraad RA
INDEPENDENT AUDITOR’S REPORT

119
AN
NU
AL
REP
OR
T 2
01
2 —
BO
SKA
LIS
119
AN
NU
AL
REV
IEW
20
12
— B
OSK
ALI
S

120A
NN
UA
L R
EPO
RT
20
12
— B
OSK
ALI
SO
THER
IN
FOR
MA
TIO
N120
AN
NU
AL
REV
IEW
20
12
— B
OSK
ALI
SO
THER
IN
FOR
MA
TIO
N
Building road infrastructure for Maasvlakte 2 in Rotterdam, the Netherlands

121
AN
NU
AL
REP
OR
T 2
01
2 —
BO
SKA
LIS
121121
AN
NU
AL
REV
IEW
20
12
— B
OSK
ALI
S
OTHER INFORMATION
122 TEN-YEAR OVERVIEW
123 STICHTING CONTINUÏTEIT KBW
124 SUPERVISION, BOARD & MANAGEMENT
128 DISCLOSURES REQUIRED BY THE DECREE ARTICLE 10 OF THE EU DIRECTIVE ON TAKEOVER BIDS
130 GLOSSARY
131 EQUIPMENT
121
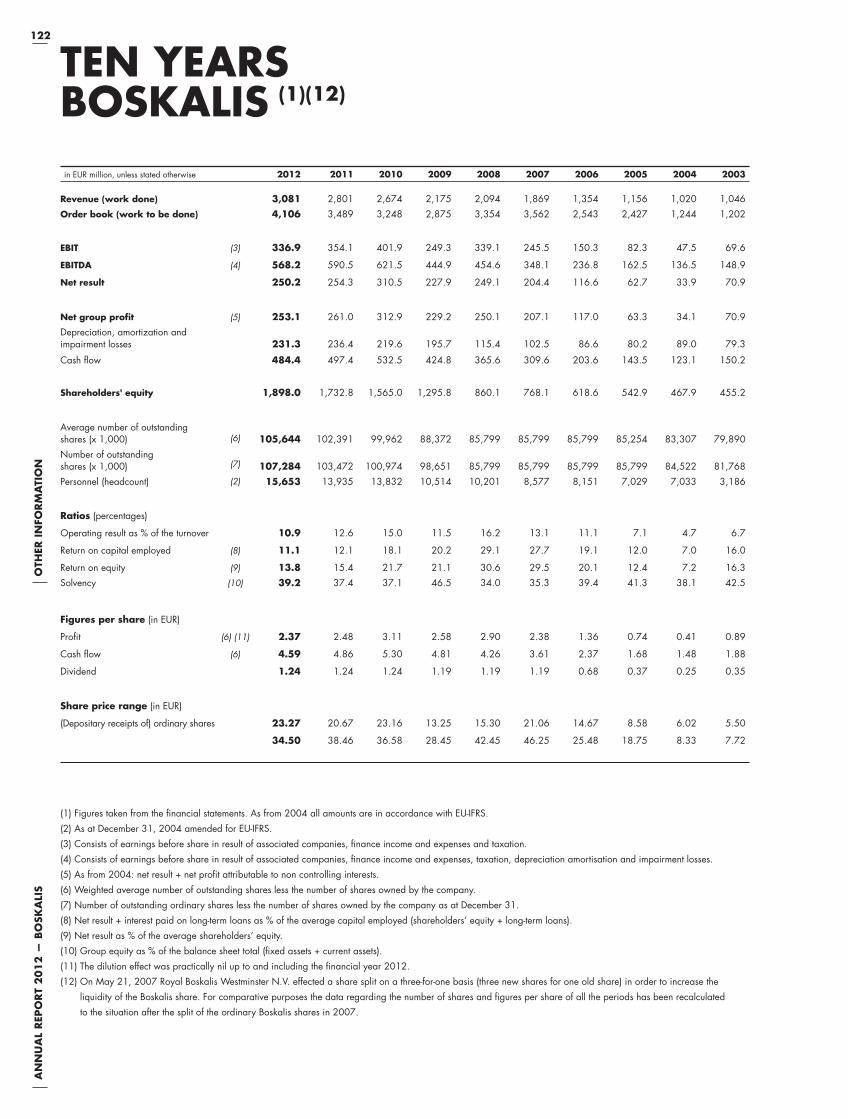
122A
NN
UA
L R
EPO
RT
20
12
— B
OSK
ALI
SO
THER
IN
FOR
MA
TIO
N
in EUR million, unless stated otherwise 2012 2011 2010 2009 2008 2007 2006 2005 2004 2003
Revenue (work done) 3,081 2,801 2,674 2,175 2,094 1,869 1,354 1,156 1,020 1,046
Order book (work to be done) 4,106 3,489 3,248 2,875 3,354 3,562 2,543 2,427 1,244 1,202
EBIT (3) 336.9 354.1 401.9 249.3 339.1 245.5 150.3 82.3 47.5 69.6
EBITDA (4) 568.2 590.5 621.5 444.9 454.6 348.1 236.8 162.5 136.5 148.9
Net result 250.2 254.3 310.5 227.9 249.1 204.4 116.6 62.7 33.9 70.9
Net group profit (5) 253.1 261.0 312.9 229.2 250.1 207.1 117.0 63.3 34.1 70.9
Depreciation, amortization and impairment losses 231.3 236.4 219.6 195.7 115.4 102.5 86.6 80.2 89.0 79.3
Cash flow 484.4 497.4 532.5 424.8 365.6 309.6 203.6 143.5 123.1 150.2
Shareholders' equity 1,898.0 1,732.8 1,565.0 1,295.8 860.1 768.1 618.6 542.9 467.9 455.2
Average number of outstanding shares (x 1,000) (6) 105,644 102,391 99,962 88,372 85,799 85,799 85,799 85,254 83,307 79,890
Number of outstanding shares (x 1,000) (7) 107,284 103,472 100,974 98,651 85,799 85,799 85,799 85,799 84,522 81,768
Personnel (headcount) (2) 15,653 13,935 13,832 10,514 10,201 8,577 8,151 7,029 7,033 3,186
Ratios (percentages)
Operating result as % of the turnover 10.9 12.6 15.0 11.5 16.2 13.1 11.1 7.1 4.7 6.7
Return on capital employed (8) 11.1 12.1 18.1 20.2 29.1 27.7 19.1 12.0 7.0 16.0
Return on equity (9) 13.8 15.4 21.7 21.1 30.6 29.5 20.1 12.4 7.2 16.3
Solvency (10) 39.2 37.4 37.1 46.5 34.0 35.3 39.4 41.3 38.1 42.5
Figures per share (in EUR)
Profit (6) (11) 2.37 2.48 3.11 2.58 2.90 2.38 1.36 0.74 0.41 0.89
Cash flow (6) 4.59 4.86 5.30 4.81 4.26 3.61 2.37 1.68 1.48 1.88
Dividend 1.24 1.24 1.24 1.19 1.19 1.19 0.68 0.37 0.25 0.35
Share price range (in EUR)
(Depositary receipts of) ordinary shares 23.27 20.67 23.16 13.25 15.30 21.06 14.67 8.58 6.02 5.50
34.50 38.46 36.58 28.45 42.45 46.25 25.48 18.75 8.33 7.72
TEN YEARS BOSKALIS (1)(12)
(1) Figures taken from the fi nancial statements. As from 2004 all amounts are in accordance with EU-IFRS.
(2) As at December 31, 2004 amended for EU-IFRS.
(3) Consists of earnings before share in result of associated companies, fi nance income and expenses and taxation.
(4) Consists of earnings before share in result of associated companies, fi nance income and expenses, taxation, depreciation amortisation and impairment losses.
(5) As from 2004: net result + net profi t attributable to non controlling interests.
(6) Weighted average number of outstanding shares less the number of shares owned by the company.
(7) Number of outstanding ordinary shares less the number of shares owned by the company as at December 31.
(8) Net result + interest paid on long-term loans as % of the average capital employed (shareholders’ equity + long-term loans).
(9) Net result as % of the average shareholders’ equity.
(10) Group equity as % of the balance sheet total (fi xed assets + current assets).
(11) The dilution effect was practically nil up to and including the fi nancial year 2012.
(12) On May 21, 2007 Royal Boskalis Westminster N.V. effected a share split on a three-for-one basis (three new shares for one old share) in order to increase the
liquidity of the Boskalis share. For comparative purposes the data regarding the number of shares and fi gures per share of all the periods has been recalculated
to the situation after the split of the ordinary Boskalis shares in 2007.

123
AN
NU
AL
REP
OR
T 2
01
2 —
BO
SKA
LIS
REPORT
By decision of the General Meeting of Shareholders held on 9 May 2001 the
foundation Stichting Continuïteit KBW was granted the right to acquire cumulative
protective preference shares in Royal Boskalis Westminster N.V. for a nominal amount
equal to the nominal amount of ordinary shares outstanding at the time of issue of the
shares concerned. The option of issuing such cumulative protective preference shares
was not exercised during the period under review.
The Board of Stichting Continuïteit KBW consists of three members:
J.A. Dekker, chairman
J.F. van Duyne
P.N. Wakkie
DECLARATION OF INDEPENDENCE
The Board of Stichting Continuïteit KBW and the Board of Management of Royal
Boskalis Westminster N.V. hereby declare that in their opinion Stichting Continuïteit
KBW is an independent legal entity, separate from Royal Boskalis Westminster N.V.,
as defi ned in Section 5:71, fi rst paragraph under c of the Dutch Financial Supervision
Act.
Papendrecht / Sliedrecht, 13 March 2013
Royal Boskalis Westminster N.V.
Board of Management
’s-Gravenland, 13 March 2013
Stichting Continuïteit KBW
The Board
STICHTING CONTINUÏTEIT KBW

124A
NN
UA
L R
EPO
RT
20
12
— B
OSK
ALI
SO
THER
IN
FOR
MA
TIO
N
SUPERVISION, BOARD AND MANAGEMENT
MEMBERS OF THE SUPERVISORY BOARD
MR. J.M. HESSELS (1942), CHAIRMAN
date of first appointment 17 August 2011, current term ends
AGM 2015
former chairman of the Management Board of Royal Vendex
KBB N.V.
chairman of the Board of NYSE Euronext, Inc.
member of the Supervisory Board of S.C. Johnson & Son, Inc.
chairman of the Central Planning Committee (at CPB
Netherlands Bureau for Economic Policy Analysis)
MR. H.J. HAZEWINKEL (1949), DEPUTY CHAIRMAN
date of first appointment 27 March 2010, current term ends
AGM 2014
former chairman of the Management Board of Royal Volker
Wessels Stevin N.V.
chairman of the Supervisory Board of TKH Group N.V.,
SOWECO N.V. and Reggefiber Group B.V.
member of the Supervisory Board of Heisterkamp Beheer II B.V.
and Schiphol Group N.V.
member of the Supervisory Board of the Netherlands Symphony
Orchestra
non-executive partner Base Strategy & Finance B.V.
member of the Board of Stichting ING Aandelen
member of the Board of Stichting Slagheek
MR. M.P. KRAMER (1950)
date of first appointment 19 August 2009, current term ends
AGM 2016
former Chief Executive Officer of N.V. Nederlandse Gasunie
Chief Executive Officer of South Stream Transport AG and South
Stream Transport B.V.
MR. M. NIGGEBRUGGE (1950)
date of first appointment 30 August 2006, current term ends
AGM 2013
former member of the Executive Board of N.V. Nederlandse
Spoorwegen
member of the Executive Board of URENCO Limited
member of the Supervisory Board of SPF Beheer B.V.
member of the Supervisory Board of Diakonessenhuis Utrecht
MR. J. VAN WIECHEN (1972)
date of first appointment 12 May 2011, current term ends AGM
2015
director of HAL Investments B.V.
non-executive member of the Board of Directors of Dockwise Ltd.
chairman of the Supervisory Board of N.V. Nationale
Borgmaatschappij
member of the Supervisory Board of Atlas Services Group
Holding B.V., Mercurius Groep B.V., FD Mediagroep B.V.,
InVesting B.V. and Orthopedie Investments Europe B.V.
MR. C. VAN WOUDENBERG (1948)
date of first appointment 9 May 2007, current term ends
AGM 2015
former member of the Executive Committee of Air France-KLM
member of the Supervisory Board of Royal Grolsch N.V.,
MN Services N.V. and the Netherlands Chamber of Commerce
member of the Supervisory Board of The Arnhem Philharmonic
Orchestra (Het Gelders Orkest)
All members of the Supervisory Board have the Dutch nationality.
They do not hold shares or associated option rights in Royal Boskalis
Westminster N.V.
Secretary: Ms. F.E. Buijs (1969)

125
AN
NU
AL
REP
OR
T 2
01
2 —
BO
SKA
LIS
MEMBERS OF THE BOARD OF MANAGEMENT
DR. P.A.M. BERDOWSKI (1957), CHAIRMAN
chairman of the Board of Management since 2006
member of the Board of Management since 1997
chairman of the Supervisory Board of Amega Holding B.V.
and N.V. Holding Westland Infra
MR. T.L. BAARTMANS (1960)
member of the Board of Management since 2007
chairman of the Netherlands Association of International
Contractors (NABU)
member of the Executive Board of the International Association
of Dredging Companies (IADC)
MR. J.H. KAMPS (1959), CHIEF FINANCIAL OFFICER
member of the Board of Management since 2006
member of the Executive Board of Stichting Fondsenbeheer
Waterbouw and Stichting Bedrijfstakpensioenfonds Waterbouw
chairman of the Board of Stichting Pensioenfonds Boskalis
MR. F.A. VERHOEVEN (1951)
member of the Board of Management since 2012
member of the Supervisory Board of Houdstermaatschappij
Dekker B.V.
member of the Supervisory Committee of Stichting Maritiem
Research Instituut Nederland (Marin)
member of the Board of Stichting Vrienden van het Nationaal
Baggermuseum
All members of the Board of Management have the Dutch
nationality. They do not hold shares or associated option rights
in Royal Boskalis Westminster N.V.
Secretary: Ms. F.E. Buijs (1969)
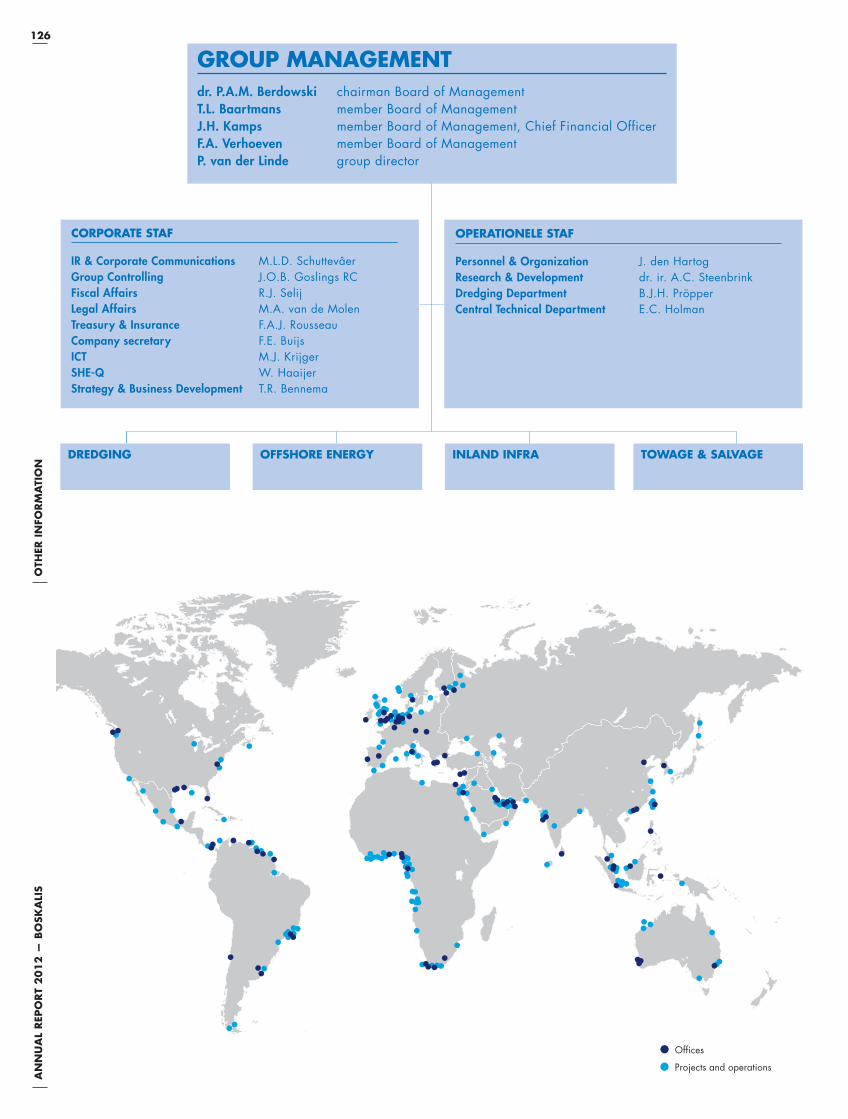
126A
NN
UA
L R
EPO
RT
20
12
— B
OSK
ALI
SO
THER
IN
FOR
MA
TIO
N
Offices
Projects and operations
GROUP MANAGEMENTdr. P.A.M. Berdowski chairman Board of Management
T.L. Baartmans member Board of Management
J.H. Kamps member Board of Management, Chief Financial Officer
F.A. Verhoeven member Board of Management
P. van der Linde group director
OPERATIONELE STAF
Personnel & Organization J. den Hartog
Research & Development dr. ir. A.C. Steenbrink
Dredging Department B.J.H. Pröpper
Central Technical Department E.C. Holman
CORPORATE STAF
IR & Corporate Communications M.L.D. Schuttevâer
Group Controlling J.O.B. Goslings RC
Fiscal Affairs R.J. Selij
Legal Affairs M.A. van de Molen
Treasury & Insurance F.A.J. Rousseau
Company secretary F.E. Buijs
ICT M.J. Krijger
SHE-Q W. Haaijer
Strategy & Business Development T.R. Bennema
TOWAGE & SALVAGE INLAND INFRAOFFSHORE ENERGYDREDGING

127
AN
NU
AL
REP
OR
T 2
01
2 —
BO
SKA
LIS
DREDGING
INTERNATIONAL PROJECTS MARKET
Area Europa M. Siebinga, J.M.L. Dieteren
Area MiddleP.G.R. Devinck
Area Middle EastJ.F.A. de Blaeij
Area EastL. Slinger
Area WestP. Klip
HOME MARKETS
The NetherlandsBoskalis:
P. van der Knaap
United KingdomBoskalis Westminster:
H.H.A.G. Wevers
GermanyBoskalis Hirdes:
H.G. Peistrup
Nordic (Finland and Sweden)Boskalis Terramare:
J.K. Yletyinen
MexicoBoskalis Dragamex:
A. Landewee
NigeriaNigerian Westminster Dredging & Marine Ltd:
F.J. Buitenhuis
OFFSHORE ENERGY
Subsea ContractingJ. Boender, S.G.M. van Bemmelen
Subsea ServicesS. Korte
Marine Contracting & Marine ServicesW.B. Vogelaar, M. Meeuwisse
INLAND INFRA
NetherlandsP. van der Knaap
Environmental contractingBoskalis Environmental:
J.A. Dolman
Soil-improvement techniquesCofra:
J.K. van Eijk
TOWAGE
Northwest EuropeP. Vierstraete
AmericasF.J. Tjallingii (Canada)
P.J.G. van Stein (Brazil)
W.M. van der Dussen (Panama)
AziaLee Sook Fung (Singapore)
SALVAGE
J. Halfweeg
WORKS COUNCIL
T.A. Scheurwater (chairman), C.C. Brijder,
W.G. Burger, C.A. van Dam, J.C. Elenbaas,
A.D. Groeneveld, A. Kastelein, A.M.W. Kruithof,
S. van der Land, B.A.J. Mes (vice-chairman),
F. Pronk, J.G. Roos, W.L. Stander, F.R. Timmer,
M. Treffers, D.A. van Uitert, M.F. van Wijk (secretary),
P.E. den Otter-Bakker (administrative secretary)

128A
NN
UA
L R
EPO
RT
20
12
— B
OSK
ALI
SO
THER
IN
FOR
MA
TIO
N
DISCLOSURES REQUIRED BY THE DECREE ARTICLE 10 OF THE EU DIRECTIVE ON TAKEOVER BIDSUnder the Decree article 10 of the EU Directive on takeover bids
companies whose securities are admitted to trading on a regulated
market must disclose information in their annual reports on matters
including their capital structure and the existence of any
shareholders with special rights. In accordance with these
requirements, Boskalis hereby makes the following disclosures:
a. For information on the capital structure of the company, the
composition of the issued capital and the existence of various
types of shares, please refer to page 91 of the notes to the
consolidated fi nancial statements in this annual report. For
information on the rights attached to these shares, please refer
to the company’s Articles of Association which can be found on
the company website. To summarize, the rights attached to
ordinary shares comprise pre-emptive subscription rights upon
the issue of ordinary shares, the entitlement to attend the
General Meeting of Shareholders, and to speak and vote at
that meeting, and the right to distribution of such amount of the
company’s profi t as remains after allocation to reserves. As at
December 31, 2012 the entire issued capital consisted of
ordinary shares (registered and bearer shares). These are only
issued against payment in full.
b. The company has imposed no limitations on the transfer of
ordinary shares. The Articles of Association have stipulated a
blocking procedure for protective preference shares. The
company is not aware of any shares having been exchanged
for depositary receipts.
c. For information on equity stakes in the company to which a
notifi cation requirement applies (pursuant to Sections 5:34,
5:35 and 5:43 of the Financial Supervision Act), please refer to
the section ‘Investor Relations’ on page 17 of this annual report.
Under the heading ‘Shareholders’ you can fi nd a list of
shareholders who are known to the company to have holdings
of 5% or more at the stated date.
d. There are no special control rights or other rights associated
with shares in the company.
e. The company does not operate a scheme granting employees
rights to acquire or obtain shares in the capital of the company
or any of its subsidiaries.
f. No restrictions apply to voting rights associated with the
company’s shares, nor are there any deadlines for exercising
voting rights.
g. No agreements with shareholders exist which may result in
restrictions on the transfer of shares or limitation of voting rights.
h. The rules governing the appointment and dismissal of members
of the Board of Management and the Supervisory Board and
amendment of the Articles of Association are stated in the
company’s Articles of Association. To summarize, the statutory
structure regime is applicable to the company. Members of the
Board of Management are appointed and dismissed by the
Supervisory Board, with the proviso that the General Meeting
of Shareholders must be consulted prior to the dismissal of any
member of the Board of Management. Supervisory Board
members are nominated by the Supervisory Board and
appointed by the General Meeting of Shareholders. The Works
Council has an enhanced right of recommendation for one-third
of the number of Supervisory Board members. The meeting of
shareholders can declare a vote of no confi dence in the
Supervisory Board by an absolute majority of votes cast,
representing at least one-third of issued capital. Such a vote of
no confi dence shall result in the immediate dismissal of the
Supervisory Board members. An amendment of the company’s
Articles of Association requires a decision by a meeting of
shareholders in response to a proposal made by the Board of
Management with the approval of the Supervisory Board.
i. The general powers of the Board of Management are set out in
the Articles of Association of the company. The powers of the
Board of Management in respect of the issuance of shares in the
company are set out in article 4 of the company’s Articles of
Association. To summarize, the General Meeting of
Shareholders – or the Board of Management authorized by the
General Meeting – takes the decision, subject to prior approval
by the Supervisory Board, to issue shares, whereby the issue
price and other conditions relating to the issue are determined
by the general meeting – or the Board of Management
authorized by the General Meeting. In the event the Board of
Management is authorized to take decisions with respect to the
issue of shares, the number of shares that may be issued as well
as the term of the authorization must also be determined. Rules
governing the acquisition and disposal by the company of
shares in its own capital are set out in article 7 of the Articles of
Association. To summarize (briefl y), the Board of Management
may decide, subject to authorization by the meeting of
shareholders and to prior approval by the Supervisory Board,
for the company to buy back fully paid-up shares up to a
statutory maximum of 50% of issued capital. Decisions
regarding the disposal of shares acquired by the company are
taken by the Board of Management, subject to prior approval
by the Supervisory Board.

129
AN
NU
AL
REP
OR
T 2
01
2 —
BO
SKA
LIS
j. With the exception of the option agreement with Stichting
Continuïteit KBW concerning the placement of cumulative
protective preference shares as set out in section 27.4 of
the fi nancial statements, the company is not a party to any
signifi cant agreements which take effect or are altered or
terminated upon a change of control of the company as a result
of a public offer within the meaning of Section 5:70 of the
Financial Supervision Act. The General Meeting of Shareholders
of May 9, 2001 decided to grant Stichting Continuïteit KBW
the right to acquire protective preference shares.
k. The company has not entered into any agreements with either
members of the Board of Management or employees, which
provide for a pay-out on termination of their employment as a
result of a public offer within the meaning of Section 5:70 of
the Financial Supervision Act.
TSHD Oranje engaged in dredging work near the port of Mumbai in India

130A
NN
UA
L R
EPO
RT
20
12
— B
OSK
ALI
SO
THER
IN
FOR
MA
TIO
N
Acquired orders Contract value of acquired assignments.
AGM Annual General Meeting of Shareholders.
Backhoe A large hydraulic excavating machine positioned on the end of a pontoon.
The pontoon is held firmly in place using spuds. Backhoes can dredge in a range of
soil types with extreme precision.
Bunker fuel Type of fuel used by oceangoing and other vessels. Bunkering refers to
the act or process of supplying a ship with this type of fuel.
Cash flow Group net profit adjusted for depreciation, amortization and impairments.
Cost leadership Achieving lowest cost price.
Cutter See cutter suction dredger.
Cutter suction dredger (CSD) A vessel that dredges while being held into place using
spuds and anchors. This technique combines powerful cutting with suction dredging.
Cutter suction dredgers are mainly used where the bed is hard and compact. The
dredged material is sometimes loaded into hoppers but is generally pumped to land
through a pressure pipeline.
Decommission To dismantle and/or remove an object.
EBITDA Group earnings before the result of associated companies, interest, tax,
depreciation, amortization and impairments.
CO2 Emissions Carbon dioxide released into the environment.
EU-IFRS IFRS stands for International Financial Reporting Standards. EU-IFRS are financial
reporting rules drawn up and issued by the IASB (International Accounting Standards
Board) and adopted within the European Union. Since 2005 all publicly listed companies
within the European Union have been obliged to comply with these standards in their
external financial accounting/reporting.
Fallpipe vessel Vessel that moves over the area to be covered, while dumping the stones
on board through a fallpipe. The vessel is kept in place by a dynamic positioning system
in which the propellers and rudders are controlled by an automatic system. The end of
the pipe is located just a few meters above the level of the surface to be covered.
The fallpipe is controlled using a precise positioning system. The fallpipe vessel Seahorse
can also be equipped with an A-frame on the aftship and a grab controlled by an ROV
(Remotely Operated Vehicle). This makes it possible to dredge down to depths of
1,000 meters.
Floating Sheerlegs Floating cranes for heavy lifting.
FPSO Floating Production Storage and Offloading system. Floating production, storage
and transshipment systems that often operate a long way offshore. The systems separate
the incoming liquids into oil, gas and water and temporarily store the crude oil. Tankers
are used to transport the oil.
Futures A future (derivative) is a so-called forward contract; an agreement between
traders to purchase or sell certain financial products on a specified future date at a
previously agreed fixed price.
Global Reporting Initiative International organization that develops global standards for
sustainability reporting.
Hazardous substances Liquid or solid substances which present a health hazard and/or
are damaging to the environment.
Home market Boskalis distinguishes itself from its competitors in the Dredging segment by
the use of a home market strategy. The home market organizations have local marketing
profiles, as well as their own fleets and infrastructures. They can rely on the support of the
financial and technical resources of the global Boskalis organization. Home markets
provide a stable flow of assignments and opportunities to generate additional margins
through associated activities.
Hopper/hopper dredger See trailing suction hopper dredger.
International projects market Market that focuses primarily on larger capital expenditure
projects for new buildings and/or extensions. In addition, there are projects that regularly
involve cooperation with third parties. This makes it possible to provide clients with
optimal services and to share risks.
LNG Liquefied Natural Gas.
LTI Lost Time Injury. Expresses the number of workplace accidents serious enough to
result in absence from work.
LTIF Lost Time Injury Frequency. Expresses the number of workplace accidents serious
enough to result in absence from work, per 200,000 hours worked.
Net Group profit Net result + net profit attributable to non-controlling interests.
NINA No Injuries No Accidents. In a bid to achieve an incident and accident-free
working environment Boskalis applies the NINA safety program. NINA sets out Boskalis'
vision on safety and describes the safety conduct the company expects from its staff and
subcontractors. The program makes people aware of their own responsibility and
encourages them to take action in situations which are unsafe.
Order book The revenue accounted for by parts of orders as yet uncompleted.
Return on capital employed Net result + interest paid on long-term loans as % of
the average capital employed (shareholders’ equity + long-term loans).
Return on equity Net result as % of the average shareholders’ equity.
Revenue work done Work executed for a client related to a project and/or a service
contract.
RoRo (Roll-on/Roll-off) ship Vessels designed to carry wheeled cargo such as automo-
biles, trucks, semi-trailer trucks, trailers or railroad cars that are driven on and off the
ship on their own wheels.
Rock fragmentation under water Drilling and blasting hard materials such as rock and
granite, often to deepen ports and clear navigational channels.
ROV Remotely Operated Vehicle. An unmanned robotic subsea vehicle that is remotely
controlled (often from a ship or platform).
SHE-Q Safety, Health, Environment & Quality.
Solvency Group equity as % of the balance sheet total (non-current assets + current assets).
TEU Twenty feet Equivalent Unit (container); often used to describe the cargo capacity of
container ships and container terminals.
Trailing suction hopper dredger (TSHD) A self-propelled unit that loads its well or hopper
using centrifugal pumps and pipes that trail over the bed as the ship sails. Trailing
suction hopper dredgers can operate independently of other equipment and can
transport material over long distances. The dredged material is dumped through flaps or
bottom doors, by rainbowing, or pumped onto land using a pipeline.
Work done Work executed for a client in relation to a project and/or service contract.
GLOSSARY

131
AN
NU
AL
REP
OR
T 2
01
2 —
BO
SKA
LIS
131
AN
NU
AL
REV
IEW
20
12
— B
OSK
ALI
S
Transport of offshore platforms by semi-submersible Dockwise vessels
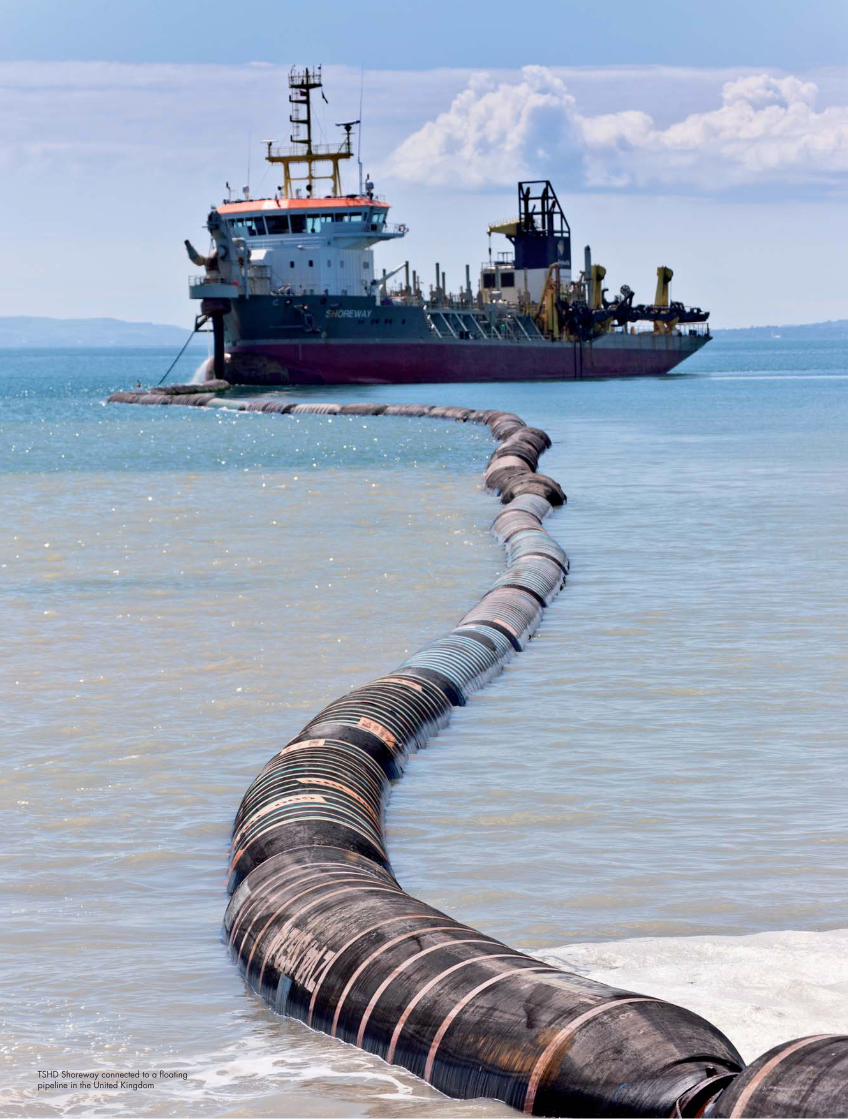
132A
NN
UA
L R
EPO
RT
20
12
— B
OSK
ALI
SO
THER
IN
FOR
MA
TIO
N132
AN
NU
AL
REV
IEW
20
12
— B
OSK
ALI
SO
THER
IN
FOR
MA
TIO
N
TSHD Shoreway connected to a fl oating pipeline in the United Kingdom

133
AN
NU
AL
REP
OR
T 2
01
2 —
BO
SKA
LIS
DREDGERS
Trailing suction hopper dredgers
Capacity > 6,000 m3
Capacity ≤ 6,000 m3
25
9
16
Cutter suction dredgers
Capacity > 12,000 kW
Capacity ≤ 12,000 kW
30
4
26
Backhoes
Bucket capacity from 1.4 to 24 m3
19
Floating grab cranes
Grab capacity from 1.2 to 9.2 m3
21
Other dredging equipment
bucket dredger, environmental disc cutter, barge unloading dredgers, suction dredgers,stone placing vessels
27
OFFSHORE VESSELS
Fallpipe vessels
Capacity from 17,000 to 18,500 tons
3
Diving support vessels
Air and saturation diving support, ROV services
4
Cable laying vessels 2
FLOATING SHEERLEGS
Floating sheerlegs
Capacity from 400 to 5,000 tons
12
BARGES
Hopper barges
Capacity from 50 to 3,800 m3
139
Oceangoing fl at top barges (semi-submersible)Capacity 24,000 tons
2
Oceangoing fl at top barges
Capacity from 1,000 to 14,000 tons
49
Inland barges
Capacity from 100 to 2,000 tons
85
TUGS
Anchor handling tugs
Capacity from 2,239 to 19,403 kW
62
Coastal/harbor tugs
Capacity from 358 to 5,224 kW
288
Harbor/river (pusher tugs)
Capacity from 75 to 2,089 kW
103
SUPPORT VESSELS 47
LAUNCHES, WORK/SUPPLY VESSELS 128
VARIOUS/OTHERS 1116
The numbers listed above include the vessels under construction and vessels and floating equipment of the (non-controlled) associated companies. In addition to the equipment shown
here, the group also owns a range of auxiliary equipment such as fl oating pipelines, winches, pumps, draglines, hydraulic excavators, wheel loaders, dumpers, bulldozers, mobile
cranes, crawler drill rigs, sand pillers, fi lling installations for shore protection, mattresses, fi xed land pipelines and a wide variety of salvage equipment, such as fi re-fi ghting, diving and
anti-pollution equipment.
EQUIPMENT

134A
NN
UA
L R
EPO
RT
20
12
— B
OSK
ALI
SO
THER
IN
FOR
MA
TIO
N134
AN
NU
AL
REV
IEW
20
12
— B
OSK
ALI
SO
THER
IN
FOR
MA
TIO
N

COLOPHON
Compiled and coordinated byRoyal Boskalis Westminster N.V.
Corporate Communications Department
Group Accounting & Reporting Department
www.boskalis.com
carbon neutralnatureOffice.com | NL-001-170773
print production
Royal Boskalis Westminster N.V.Rosmolenweg 20
PO Box 43
3350 AA Papendrecht
The Netherlands
T +31 78 6969000
F +31 78 6969555
www.boskalis.com


