50
Invesco Funds Series 5 Annual Report (Audited) For the year ended 30 November 2017

Invesco Funds Series 5 Annual Report (Audited)
For the year ended 30 November 2017
Invesco Funds Series 5
Invesco Emerging Markets Equity Fund
01-02 Investment Policy and Description of the Series
03 Investment Adviser’s Report on behalf of the Manager
04 Fund Performance (Unaudited)
04 Price and Income Record (Unaudited)
05-07 Portfolio Statement
08 Changes in the Composition of the Portfolio (Unaudited)
Invesco Korean Equity Fund
01-02 Investment Policy and Description of the Series
09 Investment Adviser’s Report on behalf of the Manager
10 Fund Performance (Unaudited)
10 Price and Income Record (Unaudited)
11 Portfolio Statement
12 Changes in the Composition of the Portfolio (Unaudited)
Invesco PRC Equity Fund
01-02 Investment Policy and Description of the Series
13 Investment Adviser’s Report on behalf of the Manager
14 Fund Performance (Unaudited)
14-15 Price and Income Record (Unaudited)
16-17 Portfolio Statement
18 Changes in the Composition of the Portfolio (Unaudited)
19 Statement of Financial Position 30 November 2017
20 Statement of Financial Position 30 November 2016
22 Income Statement 30 November 2017
23 Income Statement 30 November 2016
24 Statement of Changes in Net Assets attributable to holders of Redeemable Participating Shares 30 November 2017
25 Statement of Changes in Net Assets attributable to holders of Redeemable Participating Shares 30 November 2016
26-41 Notes to the Financial Statements
42 Statement of the Manager’s and Depositary’s Responsibilities
43 Report of the Independent Auditors to the Shareholders of Invesco Series 5
45 Report of the Depositary to the Unitholders
46 Additional Information (Unaudited)
47 General Information
Investment Policy and Description of the Series
01 Invesco Funds Series 5
Investment Objectives and Policies Invesco Emerging Markets Equity Fund (the “Fund”) aims to achieve long-term capital growth through investment in companies in emerging markets. For the purposes of the Fund, the Manager (“Invesco Global Asset Management DAC”) has defined the emerging markets as all the countries in the world other than all Western European countries (other than Greece and Turkey), the USA, Canada, Japan, Australia and New Zealand. Investments may be made by the Manager in Hong Kong reflecting its inextricable link with mainland China and its leverage to this country’s growth. The Manager will seek to achieve the investment objective by investing predominantly in listed equity or equity-related securities. Exposure may be partially obtained through indirect investments in securities traded in other markets. The Fund may invest in the securities of investment funds which provide access to certain markets where there are currently restrictions on foreign investment, or where the Manager perceives that such funds provide other investment opportunities. At least 70% of the Net Asset Value (“NAV”) of the Fund (without taking into account ancillary liquid assets) will be invested in listed equity or equity related securities of companies with their registered office in an emerging market country or with their registered office in a non-emerging market country but carrying out their business activities predominantly in emerging market countries or holding companies, the interests of which are predominantly invested in companies with their registered office in emerging market countries. Up to 30% in aggregate of the NAV of the Fund may be invested in cash and cash equivalents, equity and equity related securities of companies which do not meet the requirements set out above but stand to benefit from their operations in emerging market countries or debt securities (including convertible debt) of issuers in emerging market countries. Diversification of risk across a range of markets and companies will be of primary importance. Invesco Korean Equity Fund (the “Fund”) aims to achieve long-term capital growth by investing directly or indirectly in securities of Korean companies or other entities or subsidiaries of Korean companies and securities listed or traded on the Korean securities markets. The Manager will seek to achieve the investment objective by investing primarily in equity or equity-related securities (including warrants and convertible securities however, no more than 10% of the NAV of the Fund may be invested in warrants). The Fund may invest in the securities of investment funds which provide access to certain markets where there are currently restrictions on foreign investment, or where the Manager perceives that such funds provide other investment opportunities. In addition, the Manager recommends that an investment in this Fund should not constitute a substantial proportion of an investor’s portfolio and may not be appropriate for all investors. Invesco PRC Equity Fund (the “Fund”) aims to achieve long-term capital growth by investing in transferable securities of companies with substantial exposure to mainland China. The Manager will seek to achieve the investment objective by investing at least 70% of the Fund’s total assets (after deducting ancillary liquid assets) in equity or equity-related transferable securities of such companies. The following are considered companies with substantial exposure to mainland China; (i) companies having their registered office in the People’s Republic of China, (ii) companies with their registered office outside the People’s Republic of China carrying out their business activities predominantly in the People’s Republic of China, or (iii) holding companies, the interests of which are predominantly invested in companies with registered office in the People’s Republic of China. Up to 30% of the total assets of the Fund may be invested in aggregate in cash and cash equivalents, equity and equity related securities issued by companies or other entities not meeting the above requirements or in debt securities (including convertible bonds) of PRC issuers.
Description of the Series The Invesco Funds Series 5 (the “Series”) is a multi-portfolio Irish Unit Trust comprising Invesco Emerging Markets Equity Fund, Invesco Korean Equity Fund and Invesco PRC Equity Fund (the “Funds”). The Series is authorised by the Central Bank of Ireland (the “Central Bank”) as an undertaking for collective investment in transferable securities pursuant to the European Communities (Undertakings for Collective Investment in Transferable Securities (“UCITS”)) Regulations 2011, as amended (the “UCITS Regulations”) and the Central Bank (Supervision and Enforcement) Act 2013 (Section 48 (1)) (Undertakings for Collective Investment in Transferable Securities) Regulations 2015 (the “Central Bank UCITS Regulations”). The Series is also authorised by the Hong Kong Securities and Futures Commission (“SFC”) under the Hong Kong Securities and Futures Ordinance (Cap. 571) and has been recognised by the Financial Services Authority in the United Kingdom under Section 264 of the Financial Services and Markets Act 2000 (the “Act”). The Funds also endeavour to comply with regulatory standards of the other jurisdictions where the Funds are authorised for distribution. The Funds issue units to unitholders. As per the Consolidated Prospectus, these units are referred to as “Shares” and the unitholder is referred to as the “Shareholder” throughout these Financial Statements. Each Fund is a fund in the Invesco range of funds managed by Invesco Global Asset Management DAC, (the “Manager”). Invesco Global Asset Management DAC is an indirect wholly-owned subsidiary of Invesco Ltd. Each Fund is approved by the Central Bank of Ireland. Each Fund is also approved by the SFC. In giving authorisation for the Fund the SFC does not take responsibility for the financial soundness of a fund nor for the correctness of any statements made or opinions expressed in this regard. The Funds are not registered under the United States Investment Company Act of 1940 (as amended) and shares in the Funds (“Shares”) have not been registered under the United States Securities Act of 1933 (as amended). Accordingly, Shares may not be offered, sold or delivered in the United States or to US Persons as defined in the current Prospectus of the Series, (the “Prospectus”). The contents of this report, for which the Directors of the Manager are responsible, have been approved by Invesco Global Asset Management DAC, which is regulated by the Central Bank of Ireland in Ireland. Share prices are available through the Invesco internet site www.invesco.com (for Shareholders in Hong Kong please refer to www.invesco.com.hk) and, if required by local law or regulation, published in local leading financial newspapers including, in the case of Hong Kong, the Hong Kong Economic Times, the South China Morning Post and the Hong Kong Economic Journal. Share prices are currently also available from Reuters and Bloomberg. Any investment in the Funds should be considered long term. There can be no guarantee that the amounts subscribed for Shares will be ultimately realised. Changes in rates of exchange between currencies may cause the value of an investment in the Funds to diminish or increase. Investors should be aware that investment in emerging markets is by its nature both high risk and potentially volatile. This report to Shareholders does not constitute an offer or invitation to purchase Shares in any of the Funds.
Investment Policy and Description of the Series (continued)
02 Invesco Funds Series 5
Description of the Series (continued) An updated Consolidated Prospectus for Invesco Fund Series 1, 2, 3, 4, 5, 6 and the Invesco Fund Series was issued on 12 October 2017 and 12 December 2017. This contains all current and relevant information (as at the date of issue) regarding the Series and other Funds within the Invesco Fund Series 1, 2, 3, 4, 5, 6 and the Invesco Fund Series. This report to Shareholders has been prepared on the basis of the Prospectus. If you wish to receive a copy of this Prospectus please contact any Invesco office. Refer to note 13 for details of changes in the updated Consolidated Prospectus. Charges Share
Launch
Date
Annual Management
Fee
Annual Distribution
Fee
Annual Administration
Fee
Annual Depositary
Fee
%
% Actual
% Actual
%
Invesco Emerging Markets Equity Fund
‘A-AD’ Shares AA 02/09/1992 2.00 - 0.30 0.006375
‘B-AD’ Shares AA 20/08/2001 2.00 1.00 0.30 0.006375
‘C-AD’ Shares AA 02/09/1992 1.50 - 0.30 0.006375
‘C-AD GI EUR’ Shares AA 16/11/2016 1.50 - 0.30 0.006375
‘Z-AD’ Shares AA 21/08/2013 1.00 - 0.30 0.006375
Invesco Korean Equity Fund
‘A-AD’ Shares AA 05/11/1996 2.00 - 0.30 0.006375
‘A-Acc HKD’ Shares A 07/07/2011 2.00 - 0.30 0.006375
‘B-AD’ Shares* AA 20/08/2001 2.00 1.00 0.30 0.006375
‘C-AD’ Shares AA 05/11/1996 1.50 - 0.30 0.006375
‘Z-AD’ Shares** AA 16/08/2017 1.00 - 0.30 0.006375
Invesco PRC Equity Fund
‘A-AD’ Shares AA 26/10/1995 1.75 - 0.40 0.006375
‘A-Acc AUD Hgd’ Shares A
23/10/2013 1.75 - 0.40 0.006375
‘A-Acc CAD Hgd’ Shares A
23/10/2013 1.75 - 0.40 0.006375
‘A-Acc CHF Hgd’ Shares A
18/09/2013 1.75 - 0.40 0.006375
‘A-Acc EUR Hgd’ Shares A
18/02/2008 1.75 - 0.40 0.006375
‘A-Acc HKD’ Shares A 08/12/2010 1.75 - 0.40 0.006375
‘A-Acc NZD Hgd’ Shares A
23/10/2013 1.75 - 0.40 0.006375
‘B-AD’ Shares AA 20/08/2001 1.75 1.00 0.30 0.006375
‘C-AD’ Shares AA 26/10/1995 1.25 - 0.30 0.006375
‘C-Acc EUR Hgd’ Shares A
18/02/2008 1.25 - 0.30 0.006375
‘C-Acc HKD’ Shares A 08/12/2010 1.25 - 0.30 0.006375
‘S-Acc’ Shares** A 16/08/2017 0.88 - 0.05 0.006375
‘S-Acc EUR Hgd’ Shares A
16/11/2016 0.88 - 0.05 0.006375
‘Z-AD’ Shares**** AA 21/08/2013 0.88 - 0.30 0.006375
‘Z-Acc EUR Hgd’ Shares*** A
22/11/2017 0.88 - 0.30 0.006375
Distribution Frequency A = Accumulating AA = Annual * Liquidated on 16 August 2017 ** Launched on 16 August 2017 *** Launched on 22 November 2017 ****Effective 10 May 2017 actual administration fee was reduced by 10 basis points. Refer to note 13 for further details.
The Managers annual fee is based on the daily NAV of each Fund and is paid monthly. The Manager will also be paid a fee in respect of its duties as Administrator (“Invesco Global Asset Management DAC”) and Registrar (“Invesco Global Asset Management DAC”) for each Fund. The Administration fee will be calculated daily and will be paid on the last Business Day of each month at the rates set out above, based on the NAV of each share class of each Fund on each business day. The charges are deductible from the income of each Fund or from capital in the event of an income shortfall. The Manager may pay a portion of its administration fees to the Sub-Administrator (“BNY Mellon Fund Services (Ireland) Designated Activity Company”) in consideration for the Sub-Administrator providing certain administration functions to the Funds. BNY Mellon Trust Company (Ireland) Limited (the “Depositary”) will be paid a fee calculated on a sliding scale to a maximum rate of 0.0075% per annum of the NAV of each class of each Share of the Fund on the last business day of the month and paid monthly. The assets of a fund are exclusively available to satisfy the rights of Shareholders in relation to that Fund and the rights of creditors whose claims have arisen in connection with the creation, operation or liquidation of that Fund.
Invesco Emerging Markets Equity Fund
03 Invesco Funds Series 5
Investment Adviser’s Report on behalf of the Manager Improving fundamentals and better news on the corporate earnings front underpinned the strong advance in global emerging equity markets during the review period. All the regions registered gains with emerging Asia coming out on top, aided by the strong performance of technology stocks. Emerging Europe and Latin America also delivered positive returns. Oil prices climbed to a two-year high on supply concerns and the US Dollar lost ground against a basket of emerging market currencies. Interest rates were cut in Brazil and Russia but raised in Mexico. The Fund’s A Shares increased by 32.80% during the one-year period to the end of November 2017 versus a 32.82% gain in the benchmark MSCI Emerging Markets (US$) Index. This placed the Fund in the second quartile of its peer group, the GIFS Global Emerging Markets Equity sector, which increased by an average of 30.60%. Our holdings in Korea, China and Taiwan, particularly in technology companies, contributed the most towards performance. Outside of Asia, positions held in South African and Brazilian companies contributed significantly. Financials and consumer discretionary were other sectors that generated healthy returns. From a stock perspective, Samsung Electronics was our largest contributor, followed by Naspers, Alibaba Group and Yaego. Samsung Electronics drew support from growth in its semiconductor and display panel businesses – demand for flash storage chips remains strong. The Chinese economy - much like the rest of emerging Asia - remains resilient, drawing support from strong domestic consumption, an export recovery and solid growth in services. In Latin America we believe the economic recovery in the region is broadening. Recent macro data releases from Brazil have been encouraging, reaffirming the growing view that the economy is finally on the mend. The Brazilian economy is also likely to benefit from lower interest rates and waning inflationary pressures.
We are seeing further evidence that a nascent economic recovery remains in place in Russia. Lower interest rates are helping to reawaken consumer demand with the revival in real pay accelerating in recent months. The macroeconomic picture in central and eastern Europe is also improving. In terms of fund positioning, we continue to favour EMEA (Europe, Middle East and Africa) and Latin America. In both cases this is driven by equity valuations. In particular, we are finding more attractively priced companies in the EMEA region than elsewhere, for example Russia, Poland, Greece, Turkey and the United Arab Emirates. Asia has a fantastic long-term track record of economic delivery: strong growth, low inflation and generally positive external balances. The challenge for us in Asia is valuations. We don’t find it quite so easy to find stocks trading on attractive valuation multiples. This is particularly the case in Malaysia and to some extent in Taiwan and China & Hong Kong, where we’re underweight the financial sector versus the benchmark. From a sector perspective, however, we favour Asian tech-hardware companies and Chinese internet businesses. The former tend to generate significant free cash flow and the latter, in our view, continue to have strong growth prospects. We introduced a number of new stocks into the portfolio during the review period, including JD.com, Wizz Air and X5 Retail Group. JD.com is one of China’s biggest online retailers with plans to bring e-commerce to rural parts of the country. Wizz Air is a low-cost airline based in Eastern Europe. X5 Retail Group is the largest food retailer in Russia. Dated: 3 January 2018 - Invesco Global Asset Management DAC
Invesco Emerging Markets Equity Fund
04 Invesco Funds Series 5
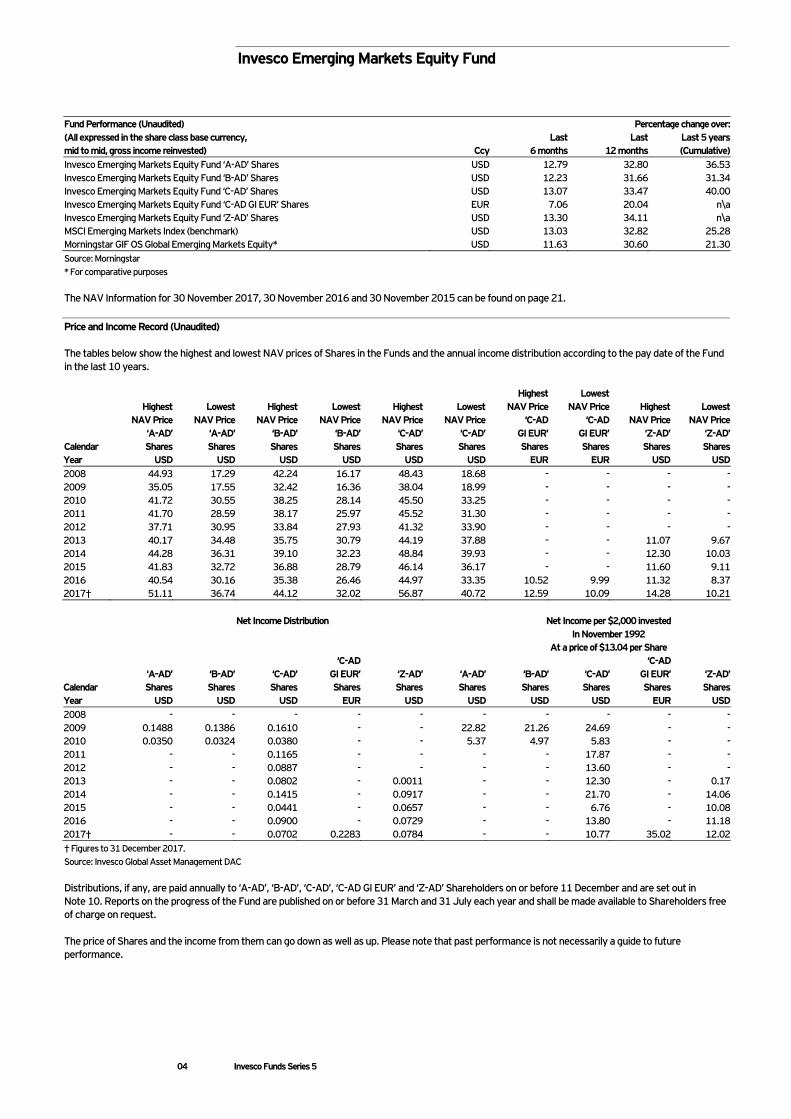
Fund Performance (Unaudited) Percentage change over: (All expressed in the share class base currency, mid to mid, gross income reinvested)
Ccy
Last 6 months
Last 12 months
Last 5 years (Cumulative)
Invesco Emerging Markets Equity Fund ‘A-AD’ Shares USD 12.79 32.80 36.53 Invesco Emerging Markets Equity Fund ‘B-AD’ Shares USD 12.23 31.66 31.34 Invesco Emerging Markets Equity Fund ‘C-AD’ Shares USD 13.07 33.47 40.00 Invesco Emerging Markets Equity Fund ‘C-AD GI EUR’ Shares EUR 7.06 20.04 n\a Invesco Emerging Markets Equity Fund ‘Z-AD’ Shares USD 13.30 34.11 n\a MSCI Emerging Markets Index (benchmark) USD 13.03 32.82 25.28 Morningstar GIF OS Global Emerging Markets Equity* USD 11.63 30.60 21.30 Source: Morningstar * For comparative purposes The NAV Information for 30 November 2017, 30 November 2016 and 30 November 2015 can be found on page 21. Price and Income Record (Unaudited) The tables below show the highest and lowest NAV prices of Shares in the Funds and the annual income distribution according to the pay date of the Fund in the last 10 years.
Calendar
Highest NAV Price
‘A-AD’ Shares
Lowest NAV Price
‘A-AD’ Shares
Highest NAV Price
‘B-AD’ Shares
Lowest NAV Price
‘B-AD’ Shares
Highest NAV Price
‘C-AD’ Shares
Lowest NAV Price
‘C-AD’ Shares
Highest NAV Price
‘C-AD GI EUR’ Shares
Lowest NAV Price
‘C-AD GI EUR’ Shares
Highest NAV Price
‘Z-AD’ Shares
Lowest NAV Price
‘Z-AD’ Shares
Year USD USD USD USD USD USD EUR EUR USD USD 2008 44.93 17.29 42.24 16.17 48.43 18.68 - - - - 2009 35.05 17.55 32.42 16.36 38.04 18.99 - - - - 2010 41.72 30.55 38.25 28.14 45.50 33.25 - - - - 2011 41.70 28.59 38.17 25.97 45.52 31.30 - - - - 2012 37.71 30.95 33.84 27.93 41.32 33.90 - - - - 2013 40.17 34.48 35.75 30.79 44.19 37.88 - - 11.07 9.67 2014 44.28 36.31 39.10 32.23 48.84 39.93 - - 12.30 10.03 2015 41.83 32.72 36.88 28.79 46.14 36.17 - - 11.60 9.11 2016 40.54 30.16 35.38 26.46 44.97 33.35 10.52 9.99 11.32 8.37 2017† 51.11 36.74 44.12 32.02 56.87 40.72 12.59 10.09 14.28 10.21 Net Income Distribution Net Income per $2,000 invested
In November 1992 At a price of $13.04 per Share
Calendar ‘A-AD’ Shares
‘B-AD’ Shares
‘C-AD’ Shares
‘C-AD GI EUR’ Shares
‘Z-AD’ Shares
‘A-AD’ Shares
‘B-AD’ Shares
‘C-AD’ Shares
‘C-AD GI EUR’ Shares
‘Z-AD’ Shares
Year USD USD USD EUR USD USD USD USD EUR USD 2008 - - - - - - - - - - 2009 0.1488 0.1386 0.1610 - - 22.82 21.26 24.69 - - 2010 0.0350 0.0324 0.0380 - - 5.37 4.97 5.83 - - 2011 - - 0.1165 - - - - 17.87 - - 2012 - - 0.0887 - - - - 13.60 - - 2013 - - 0.0802 - 0.0011 - - 12.30 - 0.17 2014 - - 0.1415 - 0.0917 - - 21.70 - 14.06 2015 - - 0.0441 - 0.0657 - - 6.76 - 10.08 2016 - - 0.0900 - 0.0729 - - 13.80 - 11.18 2017† - - 0.0702 0.2283 0.0784 - - 10.77 35.02 12.02 † Figures to 31 December 2017. Source: Invesco Global Asset Management DAC Distributions, if any, are paid annually to ‘A-AD’, ‘B-AD’, ‘C-AD’, ‘C-AD GI EUR’ and ‘Z-AD’ Shareholders on or before 11 December and are set out in Note 10. Reports on the progress of the Fund are published on or before 31 March and 31 July each year and shall be made available to Shareholders free of charge on request. The price of Shares and the income from them can go down as well as up. Please note that past performance is not necessarily a guide to future performance.
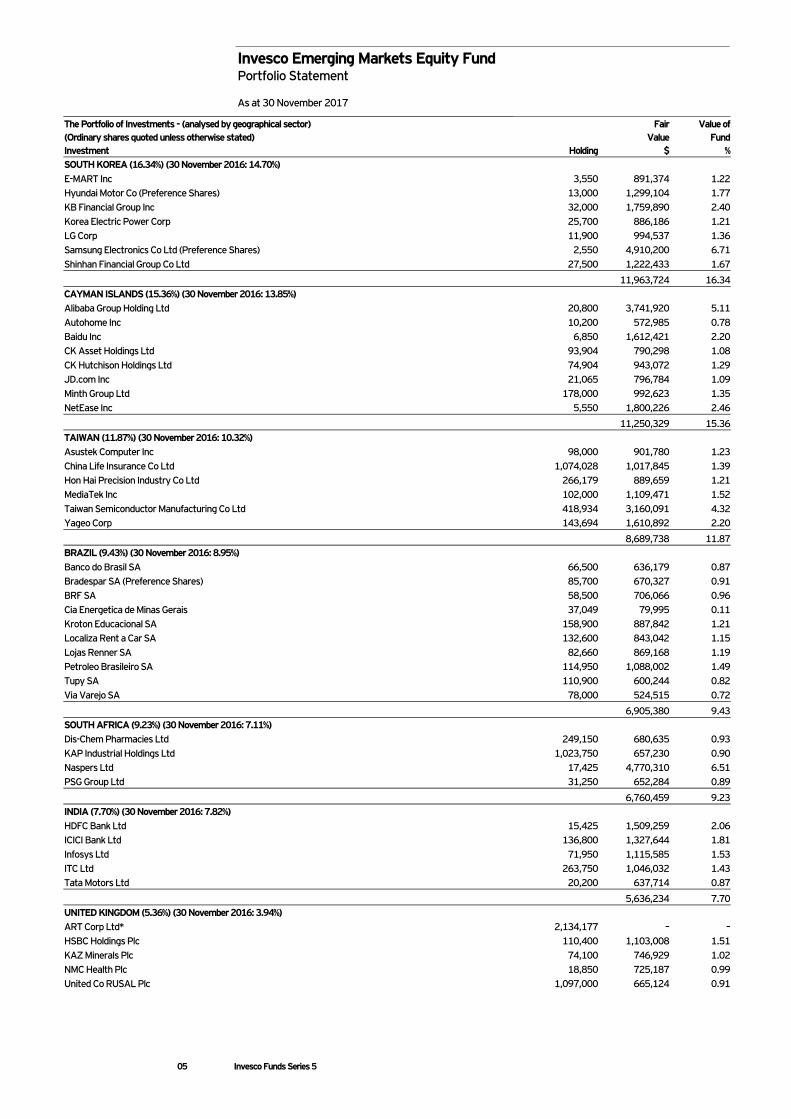
Invesco Emerging Markets Equity Fund Portfolio Statement As at 30 November 2017
05 Invesco Funds Series 5
The Portfolio of Investments - (analysed by geographical sector) Fair Value of (Ordinary shares quoted unless otherwise stated) Value Fund Investment Holding $ % SOUTH KOREA (16.34%) (30 November 2016: 14.70%) E-MART Inc 3,550 891,374 1.22 Hyundai Motor Co (Preference Shares) 13,000 1,299,104 1.77 KB Financial Group Inc 32,000 1,759,890 2.40 Korea Electric Power Corp 25,700 886,186 1.21 LG Corp 11,900 994,537 1.36 Samsung Electronics Co Ltd (Preference Shares) 2,550 4,910,200 6.71 Shinhan Financial Group Co Ltd 27,500 1,222,433 1.67 11,963,724 16.34 CAYMAN ISLANDS (15.36%) (30 November 2016: 13.85%) Alibaba Group Holding Ltd 20,800 3,741,920 5.11 Autohome Inc 10,200 572,985 0.78 Baidu Inc 6,850 1,612,421 2.20 CK Asset Holdings Ltd 93,904 790,298 1.08 CK Hutchison Holdings Ltd 74,904 943,072 1.29 JD.com Inc 21,065 796,784 1.09 Minth Group Ltd 178,000 992,623 1.35 NetEase Inc 5,550 1,800,226 2.46 11,250,329 15.36 TAIWAN (11.87%) (30 November 2016: 10.32%) Asustek Computer Inc 98,000 901,780 1.23 China Life Insurance Co Ltd 1,074,028 1,017,845 1.39 Hon Hai Precision Industry Co Ltd 266,179 889,659 1.21 MediaTek Inc 102,000 1,109,471 1.52 Taiwan Semiconductor Manufacturing Co Ltd 418,934 3,160,091 4.32 Yageo Corp 143,694 1,610,892 2.20 8,689,738 11.87 BRAZIL (9.43%) (30 November 2016: 8.95%) Banco do Brasil SA 66,500 636,179 0.87 Bradespar SA (Preference Shares) 85,700 670,327 0.91 BRF SA 58,500 706,066 0.96 Cia Energetica de Minas Gerais 37,049 79,995 0.11 Kroton Educacional SA 158,900 887,842 1.21 Localiza Rent a Car SA 132,600 843,042 1.15 Lojas Renner SA 82,660 869,168 1.19 Petroleo Brasileiro SA 114,950 1,088,002 1.49 Tupy SA 110,900 600,244 0.82 Via Varejo SA 78,000 524,515 0.72 6,905,380 9.43 SOUTH AFRICA (9.23%) (30 November 2016: 7.11%) Dis-Chem Pharmacies Ltd 249,150 680,635 0.93 KAP Industrial Holdings Ltd 1,023,750 657,230 0.90 Naspers Ltd 17,425 4,770,310 6.51 PSG Group Ltd 31,250 652,284 0.89 6,760,459 9.23 INDIA (7.70%) (30 November 2016: 7.82%) HDFC Bank Ltd 15,425 1,509,259 2.06 ICICI Bank Ltd 136,800 1,327,644 1.81 Infosys Ltd 71,950 1,115,585 1.53 ITC Ltd 263,750 1,046,032 1.43 Tata Motors Ltd 20,200 637,714 0.87 5,636,234 7.70 UNITED KINGDOM (5.36%) (30 November 2016: 3.94%) ART Corp Ltd* 2,134,177 – – HSBC Holdings Plc 110,400 1,103,008 1.51 KAZ Minerals Plc 74,100 746,929 1.02 NMC Health Plc 18,850 725,187 0.99 United Co RUSAL Plc 1,097,000 665,124 0.91
Invesco Emerging Markets Equity Fund Portfolio Statement (continued) As at 30 November 2017
06 Invesco Funds Series 5
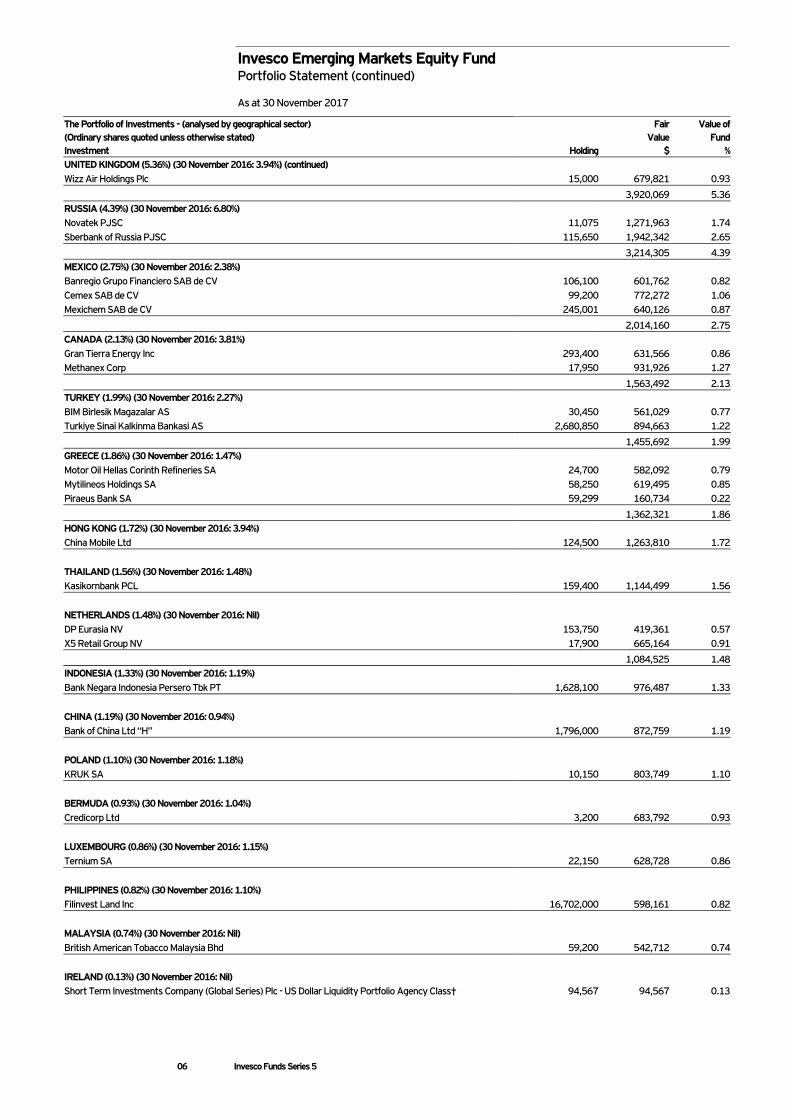
The Portfolio of Investments - (analysed by geographical sector) Fair Value of (Ordinary shares quoted unless otherwise stated) Value Fund Investment Holding $ % UNITED KINGDOM (5.36%) (30 November 2016: 3.94%) (continued) Wizz Air Holdings Plc 15,000 679,821 0.93 3,920,069 5.36 RUSSIA (4.39%) (30 November 2016: 6.80%) Novatek PJSC 11,075 1,271,963 1.74 Sberbank of Russia PJSC 115,650 1,942,342 2.65 3,214,305 4.39 MEXICO (2.75%) (30 November 2016: 2.38%) Banregio Grupo Financiero SAB de CV 106,100 601,762 0.82 Cemex SAB de CV 99,200 772,272 1.06 Mexichem SAB de CV 245,001 640,126 0.87 2,014,160 2.75 CANADA (2.13%) (30 November 2016: 3.81%) Gran Tierra Energy Inc 293,400 631,566 0.86 Methanex Corp 17,950 931,926 1.27 1,563,492 2.13 TURKEY (1.99%) (30 November 2016: 2.27%) BIM Birlesik Magazalar AS 30,450 561,029 0.77 Turkiye Sinai Kalkinma Bankasi AS 2,680,850 894,663 1.22 1,455,692 1.99 GREECE (1.86%) (30 November 2016: 1.47%) Motor Oil Hellas Corinth Refineries SA 24,700 582,092 0.79 Mytilineos Holdings SA 58,250 619,495 0.85 Piraeus Bank SA 59,299 160,734 0.22 1,362,321 1.86 HONG KONG (1.72%) (30 November 2016: 3.94%) China Mobile Ltd 124,500 1,263,810 1.72 THAILAND (1.56%) (30 November 2016: 1.48%) Kasikornbank PCL 159,400 1,144,499 1.56 NETHERLANDS (1.48%) (30 November 2016: Nil) DP Eurasia NV 153,750 419,361 0.57 X5 Retail Group NV 17,900 665,164 0.91 1,084,525 1.48 INDONESIA (1.33%) (30 November 2016: 1.19%) Bank Negara Indonesia Persero Tbk PT 1,628,100 976,487 1.33 CHINA (1.19%) (30 November 2016: 0.94%) Bank of China Ltd “H” 1,796,000 872,759 1.19 POLAND (1.10%) (30 November 2016: 1.18%) KRUK SA 10,150 803,749 1.10 BERMUDA (0.93%) (30 November 2016: 1.04%) Credicorp Ltd 3,200 683,792 0.93 LUXEMBOURG (0.86%) (30 November 2016: 1.15%) Ternium SA 22,150 628,728 0.86 PHILIPPINES (0.82%) (30 November 2016: 1.10%) Filinvest Land Inc 16,702,000 598,161 0.82 MALAYSIA (0.74%) (30 November 2016: Nil) British American Tobacco Malaysia Bhd 59,200 542,712 0.74 IRELAND (0.13%) (30 November 2016: Nil) Short Term Investments Company (Global Series) Plc - US Dollar Liquidity Portfolio Agency Class† 94,567 94,567 0.13
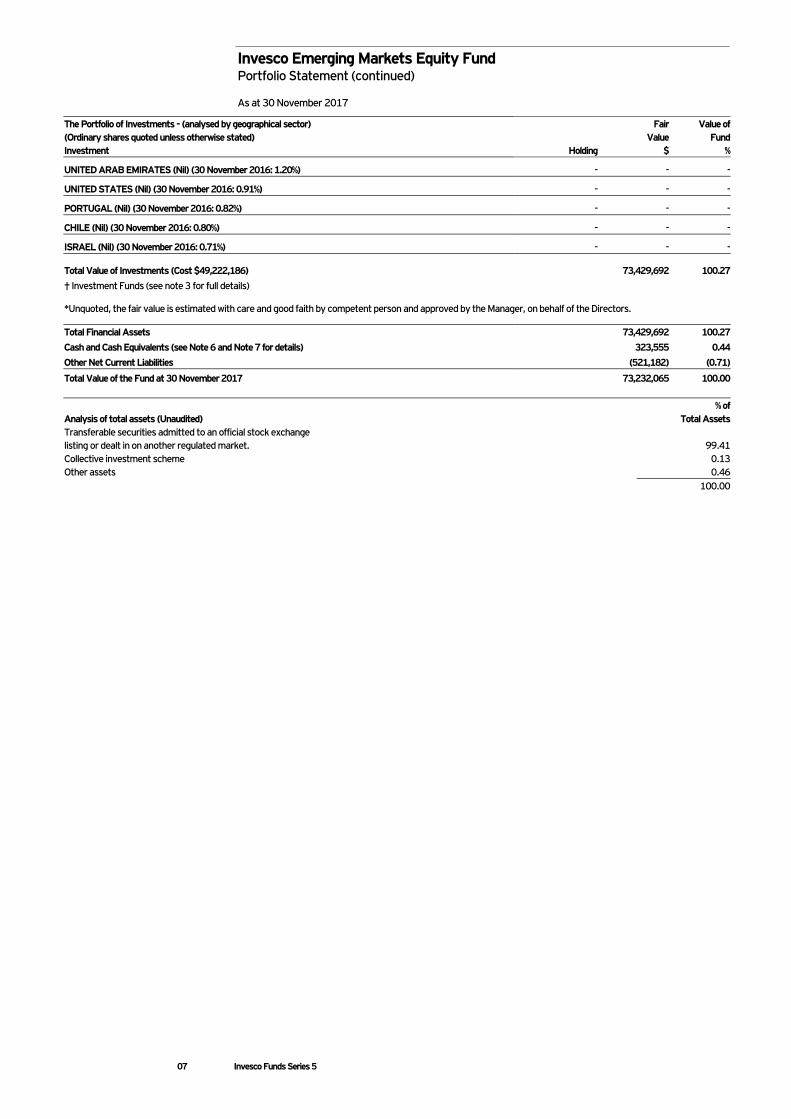
Invesco Emerging Markets Equity Fund Portfolio Statement (continued) As at 30 November 2017
07 Invesco Funds Series 5
The Portfolio of Investments - (analysed by geographical sector) Fair Value of (Ordinary shares quoted unless otherwise stated) Value Fund Investment Holding $ %
UNITED ARAB EMIRATES (Nil) (30 November 2016: 1.20%) - - -
UNITED STATES (Nil) (30 November 2016: 0.91%) - - -
PORTUGAL (Nil) (30 November 2016: 0.82%) - - -
CHILE (Nil) (30 November 2016: 0.80%) - - -
ISRAEL (Nil) (30 November 2016: 0.71%) - - -
Total Value of Investments (Cost $49,222,186) 73,429,692 100.27
† Investment Funds (see note 3 for full details)
*Unquoted, the fair value is estimated with care and good faith by competent person and approved by the Manager, on behalf of the Directors.
Total Financial Assets 73,429,692 100.27
Cash and Cash Equivalents (see Note 6 and Note 7 for details) 323,555 0.44
Other Net Current Liabilities (521,182) (0.71)
Total Value of the Fund at 30 November 2017 73,232,065 100.00
Analysis of total assets (Unaudited) % of
Total Assets Transferable securities admitted to an official stock exchange listing or dealt in on another regulated market. 99.41 Collective investment scheme 0.13 Other assets 0.46 100.00
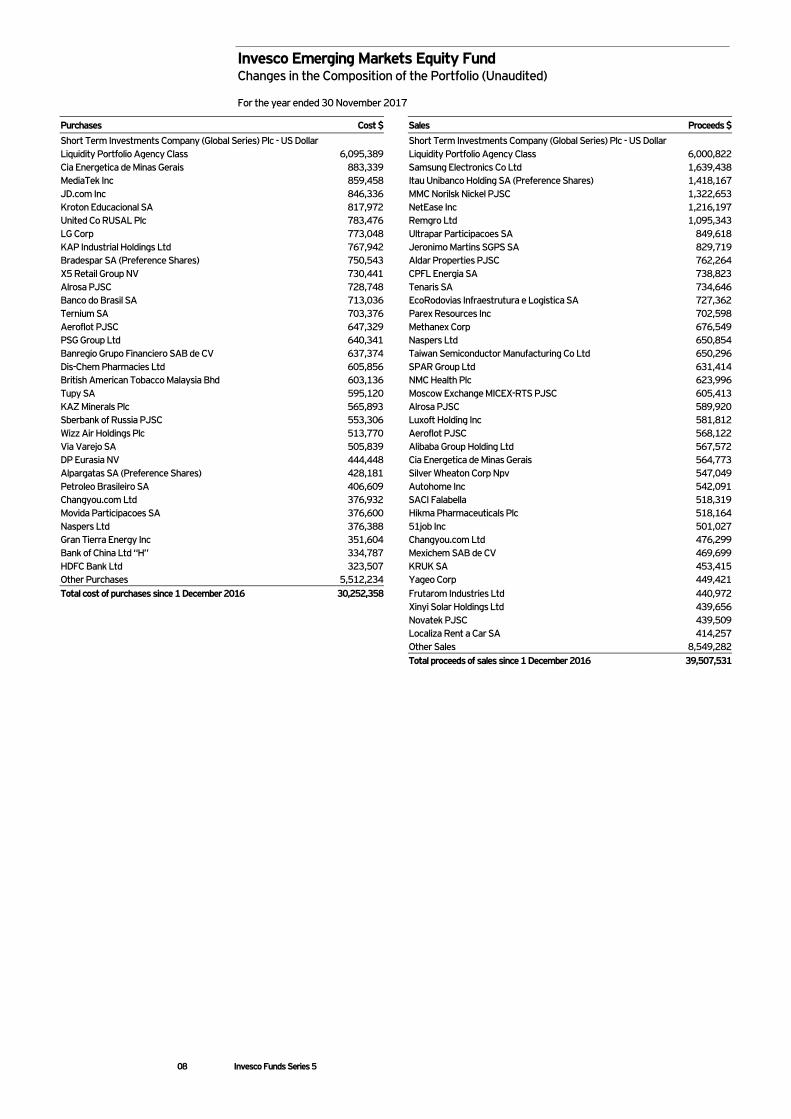
Invesco Emerging Markets Equity Fund Changes in the Composition of the Portfolio (Unaudited) For the year ended 30 November 2017
08 Invesco Funds Series 5
Purchases Cost $ Sales Proceeds $
Short Term Investments Company (Global Series) Plc - US Dollar Liquidity Portfolio Agency Class 6,095,389
Short Term Investments Company (Global Series) Plc - US Dollar Liquidity Portfolio Agency Class 6,000,822
Cia Energetica de Minas Gerais 883,339 Samsung Electronics Co Ltd 1,639,438 MediaTek Inc 859,458 Itau Unibanco Holding SA (Preference Shares) 1,418,167 JD.com Inc 846,336 MMC Norilsk Nickel PJSC 1,322,653 Kroton Educacional SA 817,972 NetEase Inc 1,216,197 United Co RUSAL Plc 783,476 Remgro Ltd 1,095,343 LG Corp 773,048 Ultrapar Participacoes SA 849,618 KAP Industrial Holdings Ltd 767,942 Jeronimo Martins SGPS SA 829,719 Bradespar SA (Preference Shares) 750,543 Aldar Properties PJSC 762,264 X5 Retail Group NV 730,441 CPFL Energia SA 738,823 Alrosa PJSC 728,748 Tenaris SA 734,646 Banco do Brasil SA 713,036 EcoRodovias Infraestrutura e Logistica SA 727,362 Ternium SA 703,376 Parex Resources Inc 702,598 Aeroflot PJSC 647,329 Methanex Corp 676,549 PSG Group Ltd 640,341 Naspers Ltd 650,854 Banregio Grupo Financiero SAB de CV 637,374 Taiwan Semiconductor Manufacturing Co Ltd 650,296 Dis-Chem Pharmacies Ltd 605,856 SPAR Group Ltd 631,414 British American Tobacco Malaysia Bhd 603,136 NMC Health Plc 623,996 Tupy SA 595,120 Moscow Exchange MICEX-RTS PJSC 605,413 KAZ Minerals Plc 565,893 Alrosa PJSC 589,920 Sberbank of Russia PJSC 553,306 Luxoft Holding Inc 581,812 Wizz Air Holdings Plc 513,770 Aeroflot PJSC 568,122 Via Varejo SA 505,839 Alibaba Group Holding Ltd 567,572 DP Eurasia NV 444,448 Cia Energetica de Minas Gerais 564,773 Alpargatas SA (Preference Shares) 428,181 Silver Wheaton Corp Npv 547,049 Petroleo Brasileiro SA 406,609 Autohome Inc 542,091 Changyou.com Ltd 376,932 SACI Falabella 518,319 Movida Participacoes SA 376,600 Hikma Pharmaceuticals Plc 518,164 Naspers Ltd 376,388 51job Inc 501,027 Gran Tierra Energy Inc 351,604 Changyou.com Ltd 476,299 Bank of China Ltd “H” 334,787 Mexichem SAB de CV 469,699 HDFC Bank Ltd 323,507 KRUK SA 453,415 Other Purchases 5,512,234 Yageo Corp 449,421 Total cost of purchases since 1 December 2016 30,252,358 Frutarom Industries Ltd 440,972 Xinyi Solar Holdings Ltd 439,656 Novatek PJSC 439,509 Localiza Rent a Car SA 414,257 Other Sales 8,549,282 Total proceeds of sales since 1 December 2016 39,507,531
Invesco Korean Equity Fund
09 Invesco Funds Series 5
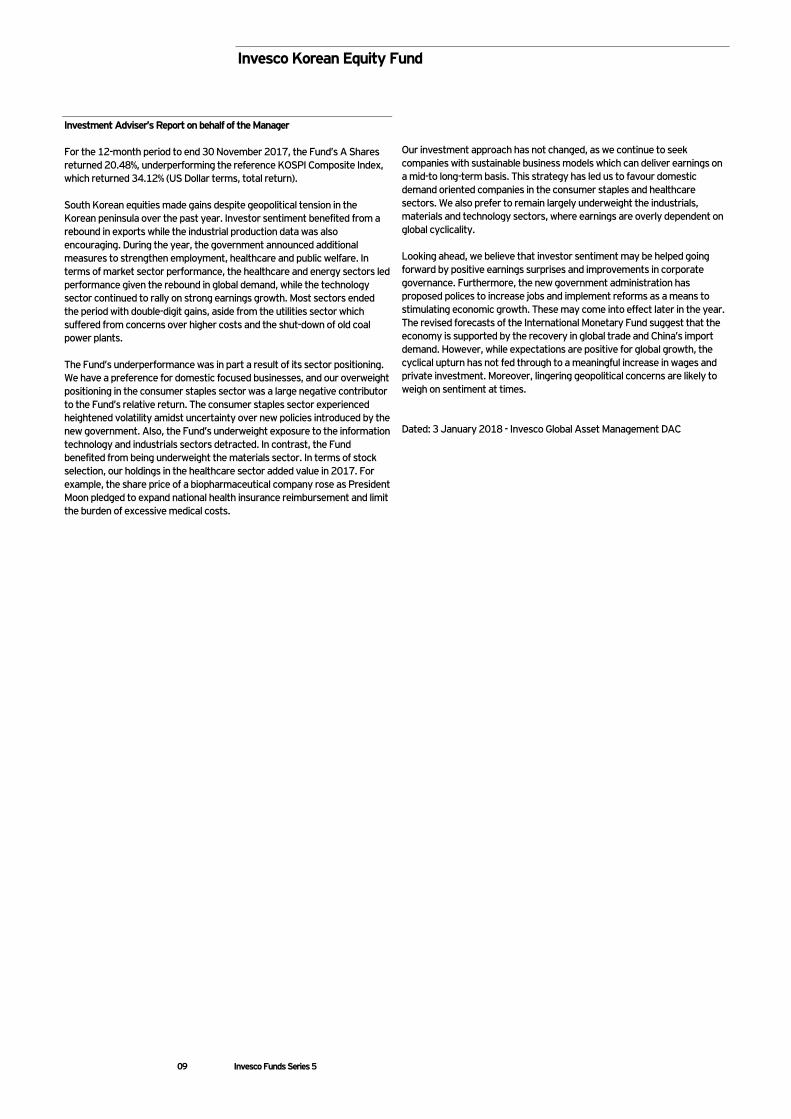
Investment Adviser’s Report on behalf of the Manager For the 12-month period to end 30 November 2017, the Fund’s A Shares returned 20.48%, underperforming the reference KOSPI Composite Index, which returned 34.12% (US Dollar terms, total return). South Korean equities made gains despite geopolitical tension in the Korean peninsula over the past year. Investor sentiment benefited from a rebound in exports while the industrial production data was also encouraging. During the year, the government announced additional measures to strengthen employment, healthcare and public welfare. In terms of market sector performance, the healthcare and energy sectors led performance given the rebound in global demand, while the technology sector continued to rally on strong earnings growth. Most sectors ended the period with double-digit gains, aside from the utilities sector which suffered from concerns over higher costs and the shut-down of old coal power plants. The Fund’s underperformance was in part a result of its sector positioning. We have a preference for domestic focused businesses, and our overweight positioning in the consumer staples sector was a large negative contributor to the Fund’s relative return. The consumer staples sector experienced heightened volatility amidst uncertainty over new policies introduced by the new government. Also, the Fund’s underweight exposure to the information technology and industrials sectors detracted. In contrast, the Fund benefited from being underweight the materials sector. In terms of stock selection, our holdings in the healthcare sector added value in 2017. For example, the share price of a biopharmaceutical company rose as President Moon pledged to expand national health insurance reimbursement and limit the burden of excessive medical costs.
Our investment approach has not changed, as we continue to seek companies with sustainable business models which can deliver earnings on a mid-to long-term basis. This strategy has led us to favour domestic demand oriented companies in the consumer staples and healthcare sectors. We also prefer to remain largely underweight the industrials, materials and technology sectors, where earnings are overly dependent on global cyclicality. Looking ahead, we believe that investor sentiment may be helped going forward by positive earnings surprises and improvements in corporate governance. Furthermore, the new government administration has proposed polices to increase jobs and implement reforms as a means to stimulating economic growth. These may come into effect later in the year. The revised forecasts of the International Monetary Fund suggest that the economy is supported by the recovery in global trade and China’s import demand. However, while expectations are positive for global growth, the cyclical upturn has not fed through to a meaningful increase in wages and private investment. Moreover, lingering geopolitical concerns are likely to weigh on sentiment at times. Dated: 3 January 2018 - Invesco Global Asset Management DAC
Invesco Korean Equity Fund
10 Invesco Funds Series 5
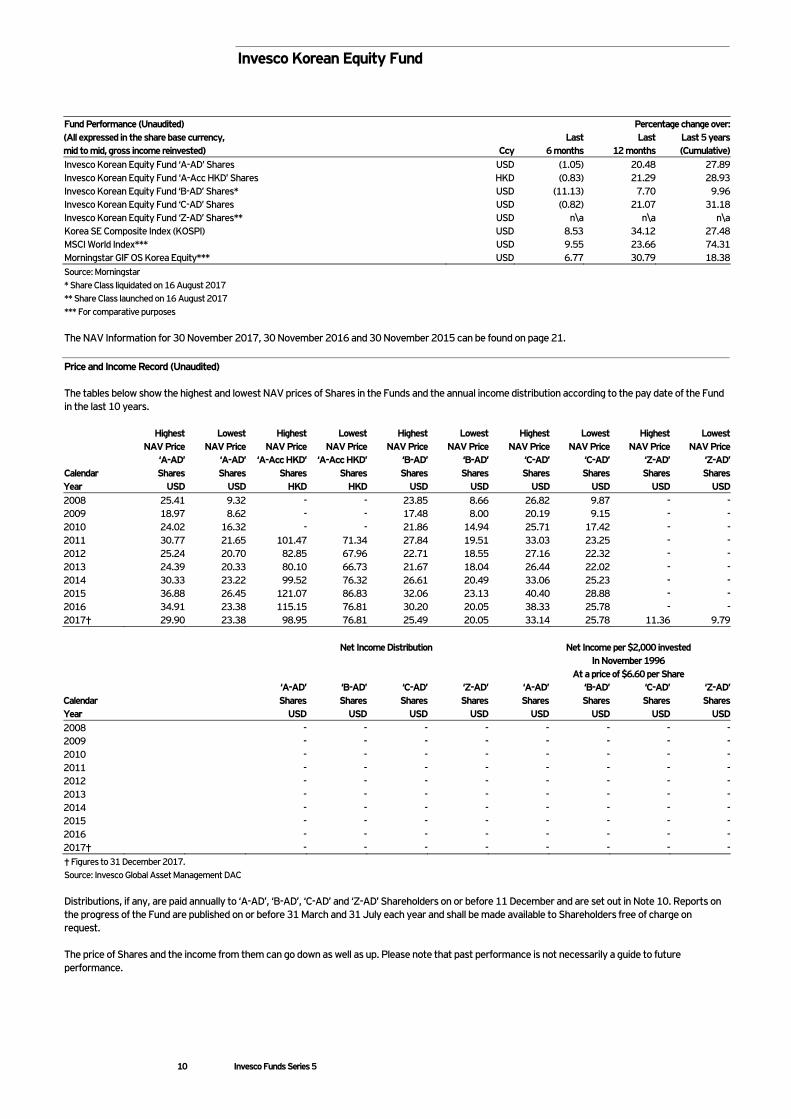
Fund Performance (Unaudited) Percentage change over: (All expressed in the share base currency, mid to mid, gross income reinvested)
Ccy
Last 6 months
Last 12 months
Last 5 years (Cumulative)
Invesco Korean Equity Fund ‘A-AD’ Shares USD (1.05) 20.48 27.89 Invesco Korean Equity Fund ‘A-Acc HKD’ Shares HKD (0.83) 21.29 28.93 Invesco Korean Equity Fund ‘B-AD’ Shares* USD (11.13) 7.70 9.96 Invesco Korean Equity Fund ‘C-AD’ Shares USD (0.82) 21.07 31.18 Invesco Korean Equity Fund ‘Z-AD’ Shares** USD n\a n\a n\a Korea SE Composite Index (KOSPI) USD 8.53 34.12 27.48 MSCI World Index*** USD 9.55 23.66 74.31 Morningstar GIF OS Korea Equity*** USD 6.77 30.79 18.38 Source: Morningstar * Share Class liquidated on 16 August 2017 ** Share Class launched on 16 August 2017 *** For comparative purposes The NAV Information for 30 November 2017, 30 November 2016 and 30 November 2015 can be found on page 21. Price and Income Record (Unaudited) The tables below show the highest and lowest NAV prices of Shares in the Funds and the annual income distribution according to the pay date of the Fund in the last 10 years.
Calendar
Highest NAV Price
‘A-AD’ Shares
Lowest NAV Price
‘A-AD’ Shares
Highest NAV Price
‘A-Acc HKD’ Shares
Lowest NAV Price
‘A-Acc HKD’ Shares
Highest NAV Price
‘B-AD’ Shares
Lowest NAV Price
‘B-AD’ Shares
Highest NAV Price
‘C-AD’ Shares
Lowest NAV Price
‘C-AD’ Shares
Highest NAV Price
‘Z-AD’ Shares
Lowest NAV Price
‘Z-AD’ Shares
Year USD USD HKD HKD USD USD USD USD USD USD 2008 25.41 9.32 - - 23.85 8.66 26.82 9.87 - - 2009 18.97 8.62 - - 17.48 8.00 20.19 9.15 - - 2010 24.02 16.32 - - 21.86 14.94 25.71 17.42 - - 2011 30.77 21.65 101.47 71.34 27.84 19.51 33.03 23.25 - - 2012 25.24 20.70 82.85 67.96 22.71 18.55 27.16 22.32 - - 2013 24.39 20.33 80.10 66.73 21.67 18.04 26.44 22.02 - - 2014 30.33 23.22 99.52 76.32 26.61 20.49 33.06 25.23 - - 2015 36.88 26.45 121.07 86.83 32.06 23.13 40.40 28.88 - - 2016 34.91 23.38 115.15 76.81 30.20 20.05 38.33 25.78 - - 2017† 29.90 23.38 98.95 76.81 25.49 20.05 33.14 25.78 11.36 9.79
Net Income Distribution Net Income per $2,000 invested In November 1996
At a price of $6.60 per Share
Calendar ‘A-AD’
Shares ‘B-AD’ Shares
‘C-AD’ Shares
‘Z-AD’ Shares
‘A-AD’ Shares
‘B-AD’ Shares
‘C-AD’ Shares
‘Z-AD’ Shares
Year USD USD USD USD USD USD USD USD 2008 - - - - - - - - 2009 - - - - - - - - 2010 - - - - - - - - 2011 - - - - - - - - 2012 - - - - - - - - 2013 - - - - - - - - 2014 - - - - - - - - 2015 - - - - - - - - 2016 - - - - - - - - 2017† - - - - - - - - † Figures to 31 December 2017. Source: Invesco Global Asset Management DAC Distributions, if any, are paid annually to ‘A-AD’, ‘B-AD’, ‘C-AD’ and ‘Z-AD’ Shareholders on or before 11 December and are set out in Note 10. Reports on the progress of the Fund are published on or before 31 March and 31 July each year and shall be made available to Shareholders free of charge on request. The price of Shares and the income from them can go down as well as up. Please note that past performance is not necessarily a guide to future performance.
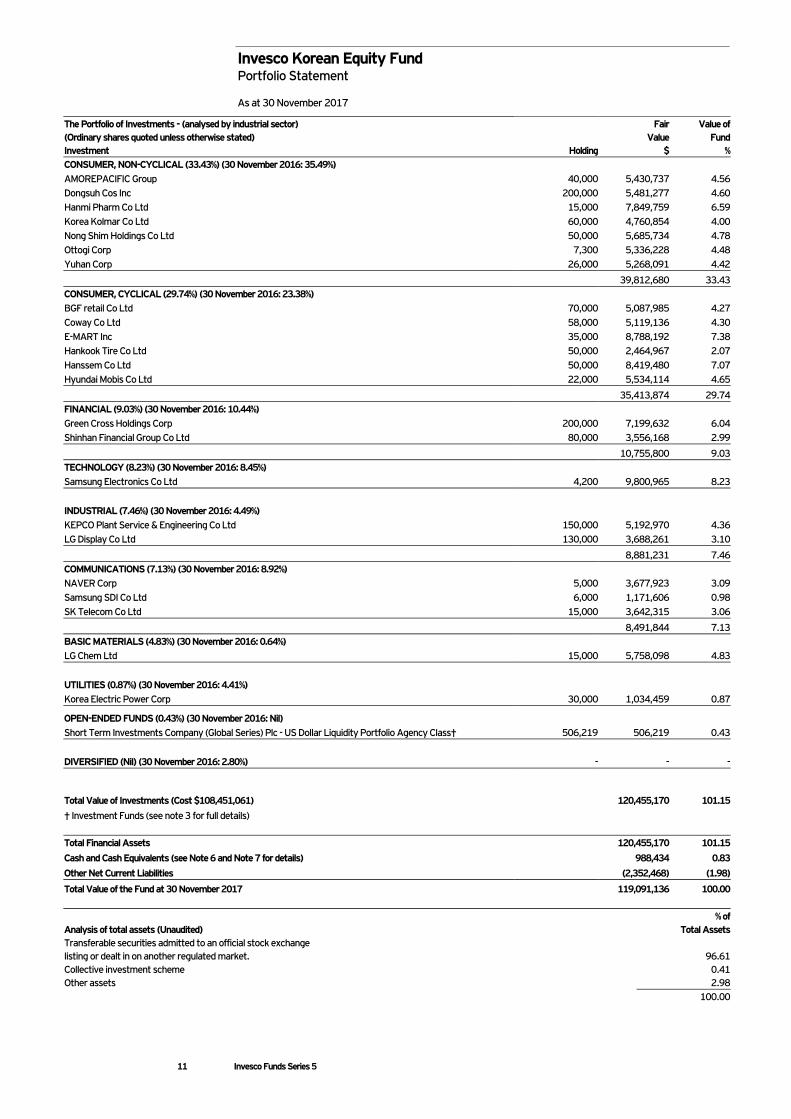
Invesco Korean Equity Fund Portfolio Statement As at 30 November 2017
11 Invesco Funds Series 5
The Portfolio of Investments - (analysed by industrial sector) Fair Value of (Ordinary shares quoted unless otherwise stated) Value Fund Investment Holding $ % CONSUMER, NON-CYCLICAL (33.43%) (30 November 2016: 35.49%) AMOREPACIFIC Group 40,000 5,430,737 4.56 Dongsuh Cos Inc 200,000 5,481,277 4.60 Hanmi Pharm Co Ltd 15,000 7,849,759 6.59 Korea Kolmar Co Ltd 60,000 4,760,854 4.00 Nong Shim Holdings Co Ltd 50,000 5,685,734 4.78 Ottogi Corp 7,300 5,336,228 4.48 Yuhan Corp 26,000 5,268,091 4.42 39,812,680 33.43 CONSUMER, CYCLICAL (29.74%) (30 November 2016: 23.38%) BGF retail Co Ltd 70,000 5,087,985 4.27 Coway Co Ltd 58,000 5,119,136 4.30 E-MART Inc 35,000 8,788,192 7.38 Hankook Tire Co Ltd 50,000 2,464,967 2.07 Hanssem Co Ltd 50,000 8,419,480 7.07 Hyundai Mobis Co Ltd 22,000 5,534,114 4.65 35,413,874 29.74 FINANCIAL (9.03%) (30 November 2016: 10.44%) Green Cross Holdings Corp 200,000 7,199,632 6.04 Shinhan Financial Group Co Ltd 80,000 3,556,168 2.99 10,755,800 9.03 TECHNOLOGY (8.23%) (30 November 2016: 8.45%) Samsung Electronics Co Ltd 4,200 9,800,965 8.23 INDUSTRIAL (7.46%) (30 November 2016: 4.49%) KEPCO Plant Service & Engineering Co Ltd 150,000 5,192,970 4.36 LG Display Co Ltd 130,000 3,688,261 3.10 8,881,231 7.46 COMMUNICATIONS (7.13%) (30 November 2016: 8.92%) NAVER Corp 5,000 3,677,923 3.09 Samsung SDI Co Ltd 6,000 1,171,606 0.98 SK Telecom Co Ltd 15,000 3,642,315 3.06 8,491,844 7.13 BASIC MATERIALS (4.83%) (30 November 2016: 0.64%) LG Chem Ltd 15,000 5,758,098 4.83 UTILITIES (0.87%) (30 November 2016: 4.41%) Korea Electric Power Corp 30,000 1,034,459 0.87
OPEN-ENDED FUNDS (0.43%) (30 November 2016: Nil) Short Term Investments Company (Global Series) Plc - US Dollar Liquidity Portfolio Agency Class† 506,219 506,219 0.43 DIVERSIFIED (Nil) (30 November 2016: 2.80%) - - -
Total Value of Investments (Cost $108,451,061) 120,455,170 101.15
† Investment Funds (see note 3 for full details) Total Financial Assets 120,455,170 101.15
Cash and Cash Equivalents (see Note 6 and Note 7 for details) 988,434 0.83
Other Net Current Liabilities (2,352,468) (1.98)
Total Value of the Fund at 30 November 2017 119,091,136 100.00
Analysis of total assets (Unaudited) % of
Total Assets Transferable securities admitted to an official stock exchange listing or dealt in on another regulated market. 96.61 Collective investment scheme 0.41 Other assets 2.98 100.00
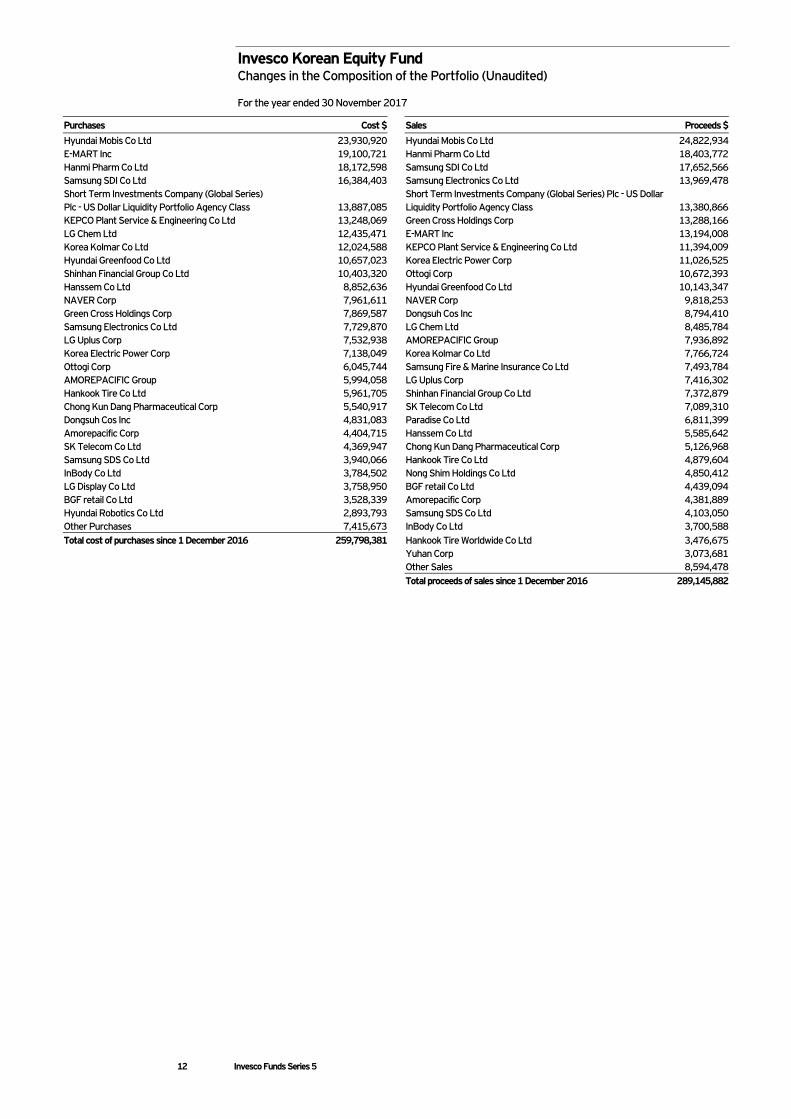
Invesco Korean Equity Fund Changes in the Composition of the Portfolio (Unaudited) For the year ended 30 November 2017
12 Invesco Funds Series 5
Purchases Cost $ Sales Proceeds $
Hyundai Mobis Co Ltd 23,930,920 Hyundai Mobis Co Ltd 24,822,934 E-MART Inc 19,100,721 Hanmi Pharm Co Ltd 18,403,772 Hanmi Pharm Co Ltd 18,172,598 Samsung SDI Co Ltd 17,652,566 Samsung SDI Co Ltd 16,384,403 Samsung Electronics Co Ltd 13,969,478 Short Term Investments Company (Global Series) Plc - US Dollar Liquidity Portfolio Agency Class 13,887,085
Short Term Investments Company (Global Series) Plc - US Dollar Liquidity Portfolio Agency Class 13,380,866
KEPCO Plant Service & Engineering Co Ltd 13,248,069 Green Cross Holdings Corp 13,288,166 LG Chem Ltd 12,435,471 E-MART Inc 13,194,008 Korea Kolmar Co Ltd 12,024,588 KEPCO Plant Service & Engineering Co Ltd 11,394,009 Hyundai Greenfood Co Ltd 10,657,023 Korea Electric Power Corp 11,026,525 Shinhan Financial Group Co Ltd 10,403,320 Ottogi Corp 10,672,393 Hanssem Co Ltd 8,852,636 Hyundai Greenfood Co Ltd 10,143,347 NAVER Corp 7,961,611 NAVER Corp 9,818,253 Green Cross Holdings Corp 7,869,587 Dongsuh Cos Inc 8,794,410 Samsung Electronics Co Ltd 7,729,870 LG Chem Ltd 8,485,784 LG Uplus Corp 7,532,938 AMOREPACIFIC Group 7,936,892 Korea Electric Power Corp 7,138,049 Korea Kolmar Co Ltd 7,766,724 Ottogi Corp 6,045,744 Samsung Fire & Marine Insurance Co Ltd 7,493,784 AMOREPACIFIC Group 5,994,058 LG Uplus Corp 7,416,302 Hankook Tire Co Ltd 5,961,705 Shinhan Financial Group Co Ltd 7,372,879 Chong Kun Dang Pharmaceutical Corp 5,540,917 SK Telecom Co Ltd 7,089,310 Dongsuh Cos Inc 4,831,083 Paradise Co Ltd 6,811,399 Amorepacific Corp 4,404,715 Hanssem Co Ltd 5,585,642 SK Telecom Co Ltd 4,369,947 Chong Kun Dang Pharmaceutical Corp 5,126,968 Samsung SDS Co Ltd 3,940,066 Hankook Tire Co Ltd 4,879,604 InBody Co Ltd 3,784,502 Nong Shim Holdings Co Ltd 4,850,412 LG Display Co Ltd 3,758,950 BGF retail Co Ltd 4,439,094 BGF retail Co Ltd 3,528,339 Amorepacific Corp 4,381,889 Hyundai Robotics Co Ltd 2,893,793 Samsung SDS Co Ltd 4,103,050 Other Purchases 7,415,673 InBody Co Ltd 3,700,588 Total cost of purchases since 1 December 2016 259,798,381 Hankook Tire Worldwide Co Ltd 3,476,675 Yuhan Corp 3,073,681 Other Sales 8,594,478 Total proceeds of sales since 1 December 2016 289,145,882
Invesco PRC Equity Fund
13 Invesco Funds Series 5
Investment Adviser’s Report on behalf of the Manager For the 12-month period to end 30 November 2017, the Fund’s A Shares returned 44.65%, outperforming the reference MSCI China 10/40 Index, which rose +40.01% (USD terms, total return). Chinese equity markets had a strong start to the year. Macroeconomic data was supportive, with broad-based strength seen across consumption and industrial data. Corporate earnings were also strong as sales picked up and lower costs expanded margins. Activity in China’s property market remained robust, especially in Tier-3 cities, even though the government continued to unveil tightening measures in an attempt to curb demand. On the policy front, China’s National People’s Congress painted a balanced picture for growth and reform. With the economy on more solid footing, the government is in a better position to pursue reforms to address some of the structural risks impairing growth. The sectors that led market performance were the real estate, information technology and materials sectors. In contrast, the telecommunication services and industrials sectors lagged behind, as ongoing price competition weighed on earnings. Another sector that underperformed was energy, given the weakness in commodity prices, due in part to concerns about oversupply. For fund performance, stock selection contributed positively during the period with a large portion of the outperformance coming from our holdings in the financials sector. Stock selection in the healthcare sector also added value, with our positions in two leading Chinese pharmaceutical companies rising on upcoming approvals for potential blockbuster drugs. Our sector positioning, which is largely a result of our bottom-up stock selection, also added to performance. The Fund’s overweight exposure in the consumer discretionary sector was a large contributor. Our lack of positioning in the energy sector and underweight exposure in the financials sector were also positive for performance.
As active bottom-up investors, we focus on understanding the management and business strategy to build a long-term investment case for the company. Our preference for quality sustainable growth companies continues to lead us to having meaningful exposure in consumer-related sectors, such as consumer discretionary, consumer staples and industrials, while holding minimal exposure in sectors such as energy, financials and information technology. The outcome of China’s National People’s Congress was in line with our expectations, with President Xi maintaining his government’s balanced approach to growth and reform. This year, for example, we have witnessed steady progress in the authorities’ attempts to rein in the previously fast-growing and less-transparent shadow banking activities. It has also managed to curb excess capacities among the coal and steel industries. We believe that conditions will remain broadly stable going forward; indeed, the latest macroeconomic data continues to reflect economic resilience as these changes take place. While headline growth is expected to moderate, the Chinese economy is on track to deliver the government target of 6.5% growth, which is still an impressive expansion, compared with other major economies. Regarding future reforms, we think that deleveraging will remain a high priority for the government. From a bottom-up perspective, Chinese companies continue to see earnings upgrades across all sectors. Valuations levels are still accommodative relative to long-term historical levels and lower than the valuation levels of developed markets. Dated: 3 January 2018 - Invesco Global Asset Management DAC
Invesco PRC Equity Fund
14 Invesco Funds Series 5
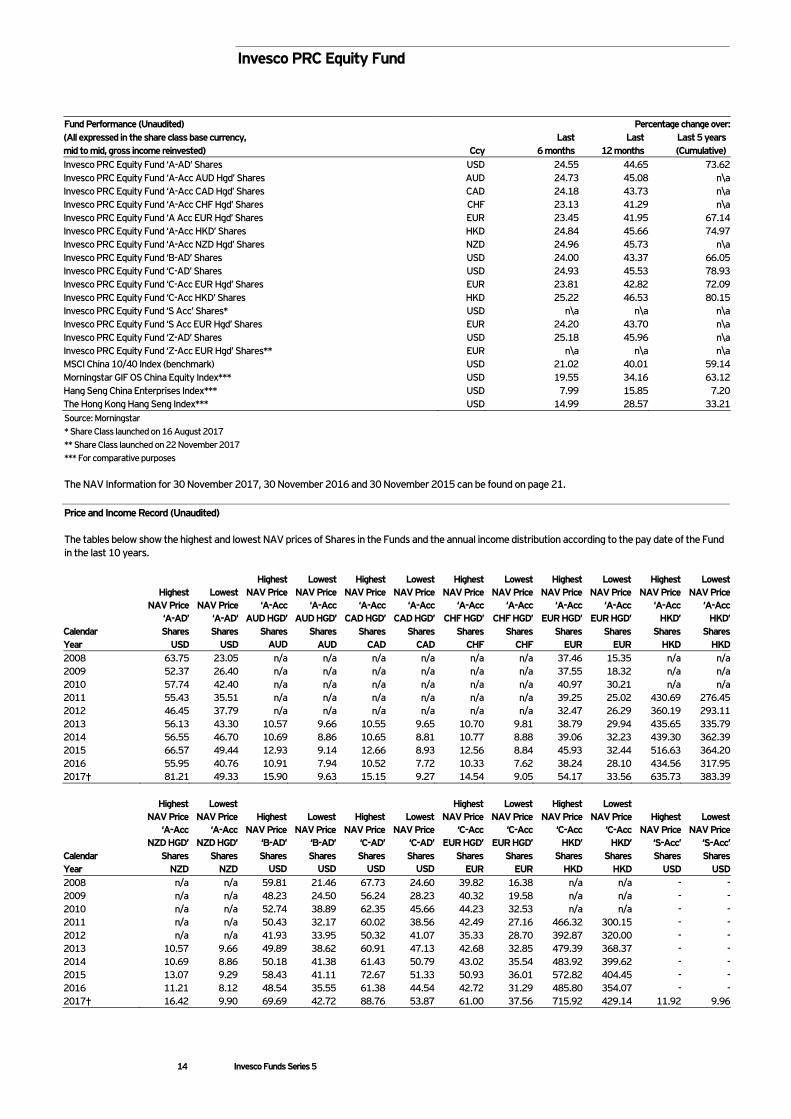
Fund Performance (Unaudited) Percentage change over: (All expressed in the share class base currency, mid to mid, gross income reinvested)
Ccy
Last 6 months
Last 12 months
Last 5 years (Cumulative)
Invesco PRC Equity Fund ‘A-AD’ Shares USD 24.55 44.65 73.62 Invesco PRC Equity Fund ‘A-Acc AUD Hgd’ Shares AUD 24.73 45.08 n\a Invesco PRC Equity Fund ‘A-Acc CAD Hgd’ Shares CAD 24.18 43.73 n\a Invesco PRC Equity Fund ‘A-Acc CHF Hgd’ Shares CHF 23.13 41.29 n\a Invesco PRC Equity Fund ‘A Acc EUR Hgd’ Shares EUR 23.45 41.95 67.14 Invesco PRC Equity Fund ‘A-Acc HKD’ Shares HKD 24.84 45.66 74.97 Invesco PRC Equity Fund ‘A-Acc NZD Hgd’ Shares NZD 24.96 45.73 n\a Invesco PRC Equity Fund ‘B-AD’ Shares USD 24.00 43.37 66.05 Invesco PRC Equity Fund ‘C-AD’ Shares USD 24.93 45.53 78.93 Invesco PRC Equity Fund ‘C-Acc EUR Hgd’ Shares EUR 23.81 42.82 72.09 Invesco PRC Equity Fund ‘C-Acc HKD’ Shares HKD 25.22 46.53 80.15 Invesco PRC Equity Fund ‘S Acc’ Shares* USD n\a n\a n\a Invesco PRC Equity Fund ‘S Acc EUR Hgd’ Shares EUR 24.20 43.70 n\a Invesco PRC Equity Fund ‘Z-AD’ Shares USD 25.18 45.96 n\a Invesco PRC Equity Fund ‘Z-Acc EUR Hgd’ Shares** EUR n\a n\a n\a MSCI China 10/40 Index (benchmark) USD 21.02 40.01 59.14 Morningstar GIF OS China Equity Index*** USD 19.55 34.16 63.12 Hang Seng China Enterprises Index*** USD 7.99 15.85 7.20 The Hong Kong Hang Seng Index*** USD 14.99 28.57 33.21 Source: Morningstar * Share Class launched on 16 August 2017 ** Share Class launched on 22 November 2017 *** For comparative purposes The NAV Information for 30 November 2017, 30 November 2016 and 30 November 2015 can be found on page 21. Price and Income Record (Unaudited) The tables below show the highest and lowest NAV prices of Shares in the Funds and the annual income distribution according to the pay date of the Fund in the last 10 years.
Highest NAV Price
‘A-AD’
Lowest NAV Price
‘A-AD’
Highest NAV Price
‘A-Acc AUD HGD’
Lowest NAV Price
‘A-Acc AUD HGD’
Highest NAV Price
‘A-Acc CAD HGD’
Lowest NAV Price
‘A-Acc CAD HGD’
Highest NAV Price
‘A-Acc CHF HGD’
Lowest NAV Price
‘A-Acc CHF HGD’
Highest NAV Price
‘A-Acc EUR HGD’
Lowest NAV Price
‘A-Acc EUR HGD’
Highest NAV Price
‘A-Acc HKD’
Lowest NAV Price
‘A-Acc HKD’
Calendar Shares Shares Shares Shares Shares Shares Shares Shares Shares Shares Shares Shares Year USD USD AUD AUD CAD CAD CHF CHF EUR EUR HKD HKD 2008 63.75 23.05 n/a n/a n/a n/a n/a n/a 37.46 15.35 n/a n/a 2009 52.37 26.40 n/a n/a n/a n/a n/a n/a 37.55 18.32 n/a n/a 2010 57.74 42.40 n/a n/a n/a n/a n/a n/a 40.97 30.21 n/a n/a 2011 55.43 35.51 n/a n/a n/a n/a n/a n/a 39.25 25.02 430.69 276.45 2012 46.45 37.79 n/a n/a n/a n/a n/a n/a 32.47 26.29 360.19 293.11 2013 56.13 43.30 10.57 9.66 10.55 9.65 10.70 9.81 38.79 29.94 435.65 335.79 2014 56.55 46.70 10.69 8.86 10.65 8.81 10.77 8.88 39.06 32.23 439.30 362.39 2015 66.57 49.44 12.93 9.14 12.66 8.93 12.56 8.84 45.93 32.44 516.63 364.20 2016 55.95 40.76 10.91 7.94 10.52 7.72 10.33 7.62 38.24 28.10 434.56 317.95 2017† 81.21 49.33 15.90 9.63 15.15 9.27 14.54 9.05 54.17 33.56 635.73 383.39
Highest NAV Price
‘A-Acc NZD HGD’
Lowest NAV Price
‘A-Acc NZD HGD’
Highest NAV Price
‘B-AD’
Lowest NAV Price
‘B-AD’
Highest NAV Price
‘C-AD’
Lowest NAV Price
‘C-AD’
Highest NAV Price
‘C-Acc EUR HGD’
Lowest NAV Price
‘C-Acc EUR HGD’
Highest NAV Price
‘C-Acc HKD’
Lowest NAV Price
‘C-Acc HKD’
Highest NAV Price
‘S-Acc’
Lowest NAV Price
‘S-Acc’ Calendar Shares Shares Shares Shares Shares Shares Shares Shares Shares Shares Shares Shares Year NZD NZD USD USD USD USD EUR EUR HKD HKD USD USD 2008 n/a n/a 59.81 21.46 67.73 24.60 39.82 16.38 n/a n/a - - 2009 n/a n/a 48.23 24.50 56.24 28.23 40.32 19.58 n/a n/a - - 2010 n/a n/a 52.74 38.89 62.35 45.66 44.23 32.53 n/a n/a - - 2011 n/a n/a 50.43 32.17 60.02 38.56 42.49 27.16 466.32 300.15 - - 2012 n/a n/a 41.93 33.95 50.32 41.07 35.33 28.70 392.87 320.00 - - 2013 10.57 9.66 49.89 38.62 60.91 47.13 42.68 32.85 479.39 368.37 - - 2014 10.69 8.86 50.18 41.38 61.43 50.79 43.02 35.54 483.92 399.62 - - 2015 13.07 9.29 58.43 41.11 72.67 51.33 50.93 36.01 572.82 404.45 - - 2016 11.21 8.12 48.54 35.55 61.38 44.54 42.72 31.29 485.80 354.07 - - 2017† 16.42 9.90 69.69 42.72 88.76 53.87 61.00 37.56 715.92 429.14 11.92 9.96
Invesco PRC Equity Fund
15 Invesco Funds Series 5
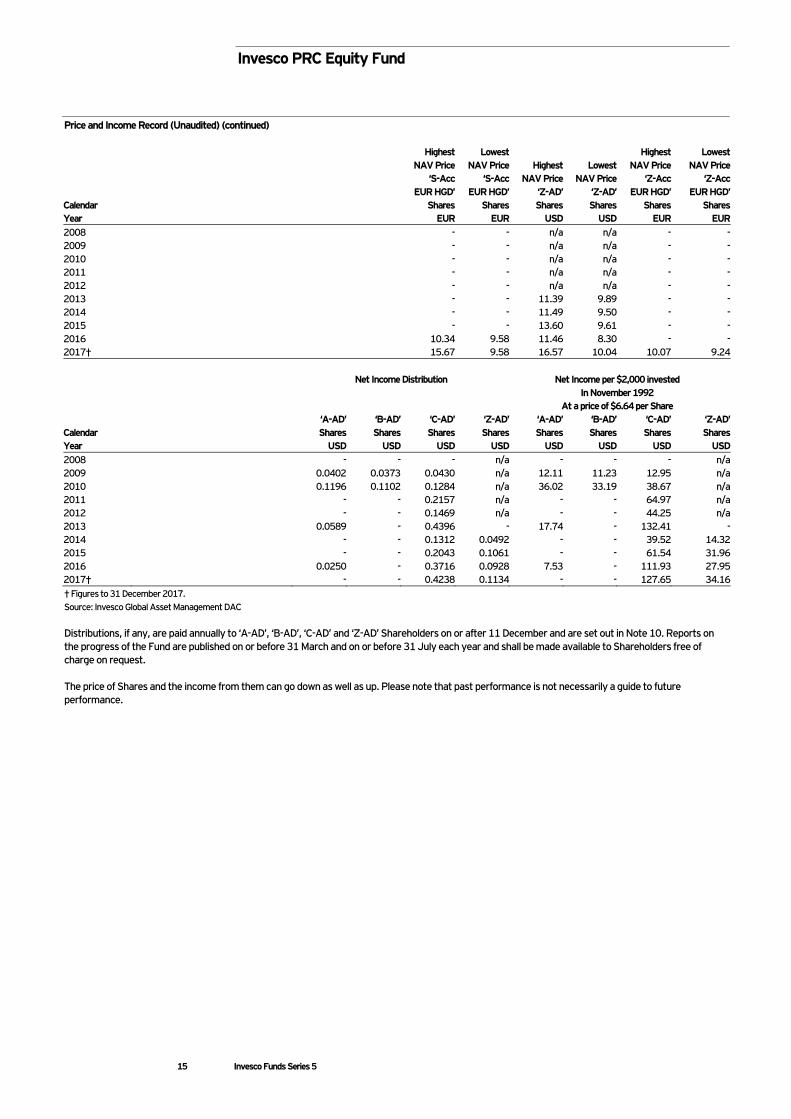
Price and Income Record (Unaudited) (continued)
Highest NAV Price
‘S-Acc EUR HGD’
Lowest NAV Price
‘S-Acc EUR HGD’
Highest NAV Price
‘Z-AD’
Lowest NAV Price
‘Z-AD’
Highest NAV Price
‘Z-Acc EUR HGD’
Lowest NAV Price
‘Z-Acc EUR HGD’
Calendar Shares Shares Shares Shares Shares Shares Year EUR EUR USD USD EUR EUR 2008 - - n/a n/a - - 2009 - - n/a n/a - - 2010 - - n/a n/a - - 2011 - - n/a n/a - - 2012 - - n/a n/a - - 2013 - - 11.39 9.89 - - 2014 - - 11.49 9.50 - - 2015 - - 13.60 9.61 - - 2016 10.34 9.58 11.46 8.30 - - 2017† 15.67 9.58 16.57 10.04 10.07 9.24
Net Income Distribution Net Income per $2,000 invested In November 1992
At a price of $6.64 per Share
Calendar ‘A-AD’
Shares ‘B-AD’ Shares
‘C-AD’ Shares
‘Z-AD’ Shares
‘A-AD’ Shares
‘B-AD’ Shares
‘C-AD’ Shares
‘Z-AD’ Shares
Year USD USD USD USD USD USD USD USD 2008 - - - n/a - - - n/a 2009 0.0402 0.0373 0.0430 n/a 12.11 11.23 12.95 n/a 2010 0.1196 0.1102 0.1284 n/a 36.02 33.19 38.67 n/a 2011 - - 0.2157 n/a - - 64.97 n/a 2012 - - 0.1469 n/a - - 44.25 n/a 2013 0.0589 - 0.4396 - 17.74 - 132.41 - 2014 - - 0.1312 0.0492 - - 39.52 14.32 2015 - - 0.2043 0.1061 - - 61.54 31.96 2016 0.0250 - 0.3716 0.0928 7.53 - 111.93 27.95 2017† - - 0.4238 0.1134 - - 127.65 34.16 † Figures to 31 December 2017. Source: Invesco Global Asset Management DAC Distributions, if any, are paid annually to ‘A-AD’, ‘B-AD’, ‘C-AD’ and ‘Z-AD’ Shareholders on or after 11 December and are set out in Note 10. Reports on the progress of the Fund are published on or before 31 March and on or before 31 July each year and shall be made available to Shareholders free of charge on request. The price of Shares and the income from them can go down as well as up. Please note that past performance is not necessarily a guide to future performance.
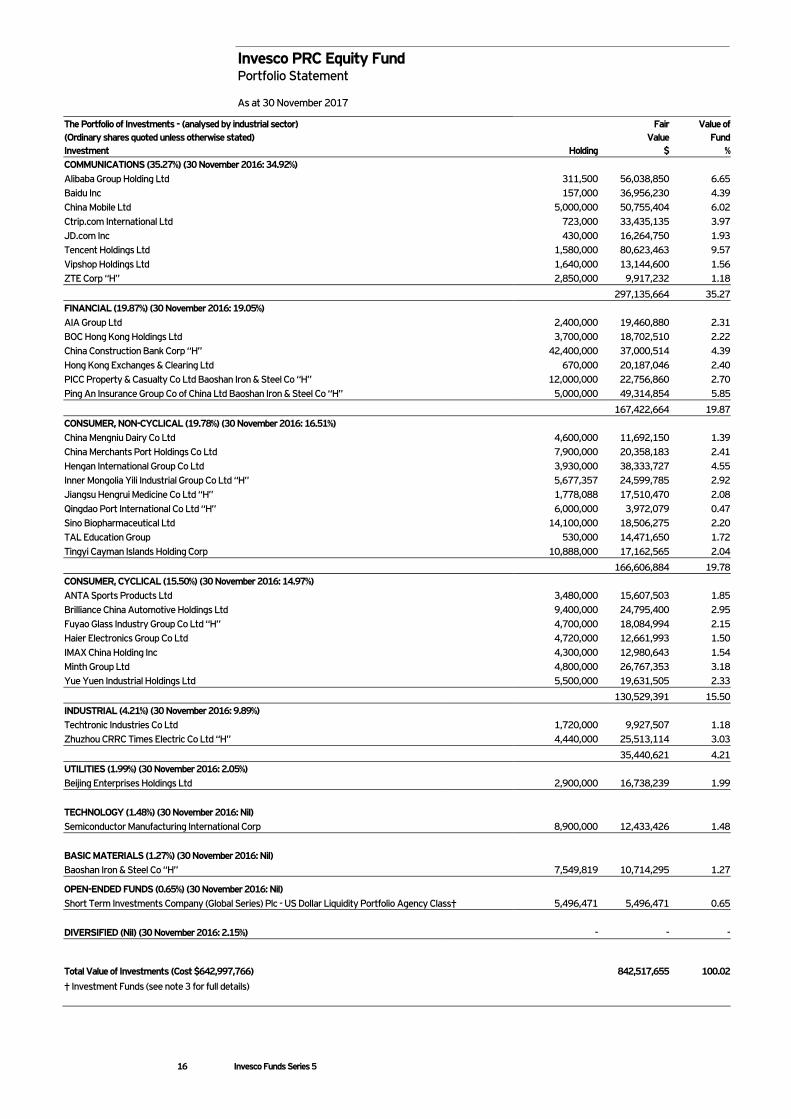
Invesco PRC Equity Fund Portfolio Statement As at 30 November 2017
16 Invesco Funds Series 5
The Portfolio of Investments - (analysed by industrial sector) Fair Value of (Ordinary shares quoted unless otherwise stated) Value Fund Investment Holding $ % COMMUNICATIONS (35.27%) (30 November 2016: 34.92%) Alibaba Group Holding Ltd 311,500 56,038,850 6.65 Baidu Inc 157,000 36,956,230 4.39 China Mobile Ltd 5,000,000 50,755,404 6.02 Ctrip.com International Ltd 723,000 33,435,135 3.97 JD.com Inc 430,000 16,264,750 1.93 Tencent Holdings Ltd 1,580,000 80,623,463 9.57 Vipshop Holdings Ltd 1,640,000 13,144,600 1.56 ZTE Corp “H” 2,850,000 9,917,232 1.18 297,135,664 35.27 FINANCIAL (19.87%) (30 November 2016: 19.05%) AIA Group Ltd 2,400,000 19,460,880 2.31 BOC Hong Kong Holdings Ltd 3,700,000 18,702,510 2.22 China Construction Bank Corp “H” 42,400,000 37,000,514 4.39 Hong Kong Exchanges & Clearing Ltd 670,000 20,187,046 2.40 PICC Property & Casualty Co Ltd Baoshan Iron & Steel Co “H” 12,000,000 22,756,860 2.70 Ping An Insurance Group Co of China Ltd Baoshan Iron & Steel Co “H” 5,000,000 49,314,854 5.85 167,422,664 19.87 CONSUMER, NON-CYCLICAL (19.78%) (30 November 2016: 16.51%) China Mengniu Dairy Co Ltd 4,600,000 11,692,150 1.39 China Merchants Port Holdings Co Ltd 7,900,000 20,358,183 2.41 Hengan International Group Co Ltd 3,930,000 38,333,727 4.55 Inner Mongolia Yili Industrial Group Co Ltd “H” 5,677,357 24,599,785 2.92 Jiangsu Hengrui Medicine Co Ltd “H” 1,778,088 17,510,470 2.08 Qingdao Port International Co Ltd “H” 6,000,000 3,972,079 0.47 Sino Biopharmaceutical Ltd 14,100,000 18,506,275 2.20 TAL Education Group 530,000 14,471,650 1.72 Tingyi Cayman Islands Holding Corp 10,888,000 17,162,565 2.04 166,606,884 19.78 CONSUMER, CYCLICAL (15.50%) (30 November 2016: 14.97%) ANTA Sports Products Ltd 3,480,000 15,607,503 1.85 Brilliance China Automotive Holdings Ltd 9,400,000 24,795,400 2.95 Fuyao Glass Industry Group Co Ltd “H” 4,700,000 18,084,994 2.15 Haier Electronics Group Co Ltd 4,720,000 12,661,993 1.50 IMAX China Holding Inc 4,300,000 12,980,643 1.54 Minth Group Ltd 4,800,000 26,767,353 3.18 Yue Yuen Industrial Holdings Ltd 5,500,000 19,631,505 2.33 130,529,391 15.50 INDUSTRIAL (4.21%) (30 November 2016: 9.89%) Techtronic Industries Co Ltd 1,720,000 9,927,507 1.18 Zhuzhou CRRC Times Electric Co Ltd “H” 4,440,000 25,513,114 3.03 35,440,621 4.21 UTILITIES (1.99%) (30 November 2016: 2.05%) Beijing Enterprises Holdings Ltd 2,900,000 16,738,239 1.99 TECHNOLOGY (1.48%) (30 November 2016: Nil) Semiconductor Manufacturing International Corp 8,900,000 12,433,426 1.48 BASIC MATERIALS (1.27%) (30 November 2016: Nil) Baoshan Iron & Steel Co “H” 7,549,819 10,714,295 1.27
OPEN-ENDED FUNDS (0.65%) (30 November 2016: Nil) Short Term Investments Company (Global Series) Plc - US Dollar Liquidity Portfolio Agency Class† 5,496,471 5,496,471 0.65 DIVERSIFIED (Nil) (30 November 2016: 2.15%) - - -
Total Value of Investments (Cost $642,997,766) 842,517,655 100.02
† Investment Funds (see note 3 for full details)
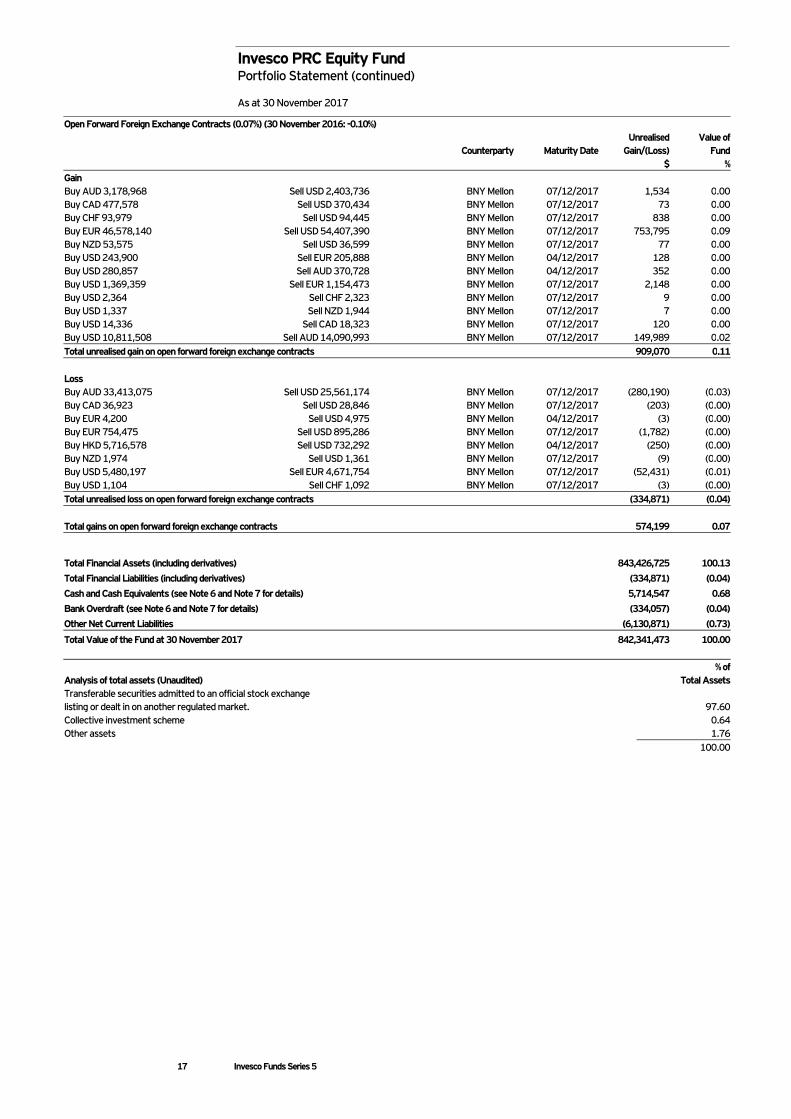
Invesco PRC Equity Fund Portfolio Statement (continued) As at 30 November 2017
17 Invesco Funds Series 5
Open Forward Foreign Exchange Contracts (0.07%) (30 November 2016: -0.10%)
Counterparty Maturity Date Unrealised
Gain/(Loss) Value of
Fund $ % Gain Buy AUD 3,178,968 Sell USD 2,403,736 BNY Mellon 07/12/2017 1,534 0.00
Buy CAD 477,578 Sell USD 370,434 BNY Mellon 07/12/2017 73 0.00
Buy CHF 93,979 Sell USD 94,445 BNY Mellon 07/12/2017 838 0.00
Buy EUR 46,578,140 Sell USD 54,407,390 BNY Mellon 07/12/2017 753,795 0.09
Buy NZD 53,575 Sell USD 36,599 BNY Mellon 07/12/2017 77 0.00
Buy USD 243,900 Sell EUR 205,888 BNY Mellon 04/12/2017 128 0.00
Buy USD 280,857 Sell AUD 370,728 BNY Mellon 04/12/2017 352 0.00
Buy USD 1,369,359 Sell EUR 1,154,473 BNY Mellon 07/12/2017 2,148 0.00
Buy USD 2,364 Sell CHF 2,323 BNY Mellon 07/12/2017 9 0.00
Buy USD 1,337 Sell NZD 1,944 BNY Mellon 07/12/2017 7 0.00
Buy USD 14,336 Sell CAD 18,323 BNY Mellon 07/12/2017 120 0.00
Buy USD 10,811,508 Sell AUD 14,090,993 BNY Mellon 07/12/2017 149,989 0.02
Total unrealised gain on open forward foreign exchange contracts 909,070 0.11
Loss Buy AUD 33,413,075 Sell USD 25,561,174 BNY Mellon 07/12/2017 (280,190) (0.03)
Buy CAD 36,923 Sell USD 28,846 BNY Mellon 07/12/2017 (203) (0.00)
Buy EUR 4,200 Sell USD 4,975 BNY Mellon 04/12/2017 (3) (0.00)
Buy EUR 754,475 Sell USD 895,286 BNY Mellon 07/12/2017 (1,782) (0.00)
Buy HKD 5,716,578 Sell USD 732,292 BNY Mellon 04/12/2017 (250) (0.00)
Buy NZD 1,974 Sell USD 1,361 BNY Mellon 07/12/2017 (9) (0.00)
Buy USD 5,480,197 Sell EUR 4,671,754 BNY Mellon 07/12/2017 (52,431) (0.01)
Buy USD 1,104 Sell CHF 1,092 BNY Mellon 07/12/2017 (3) (0.00)
Total unrealised loss on open forward foreign exchange contracts (334,871) (0.04)
Total gains on open forward foreign exchange contracts 574,199 0.07
Total Financial Assets (including derivatives) 843,426,725 100.13
Total Financial Liabilities (including derivatives) (334,871) (0.04)
Cash and Cash Equivalents (see Note 6 and Note 7 for details) 5,714,547 0.68
Bank Overdraft (see Note 6 and Note 7 for details) (334,057) (0.04)
Other Net Current Liabilities (6,130,871) (0.73)
Total Value of the Fund at 30 November 2017 842,341,473 100.00
Analysis of total assets (Unaudited) % of
Total Assets Transferable securities admitted to an official stock exchange listing or dealt in on another regulated market. 97.60 Collective investment scheme 0.64 Other assets 1.76 100.00
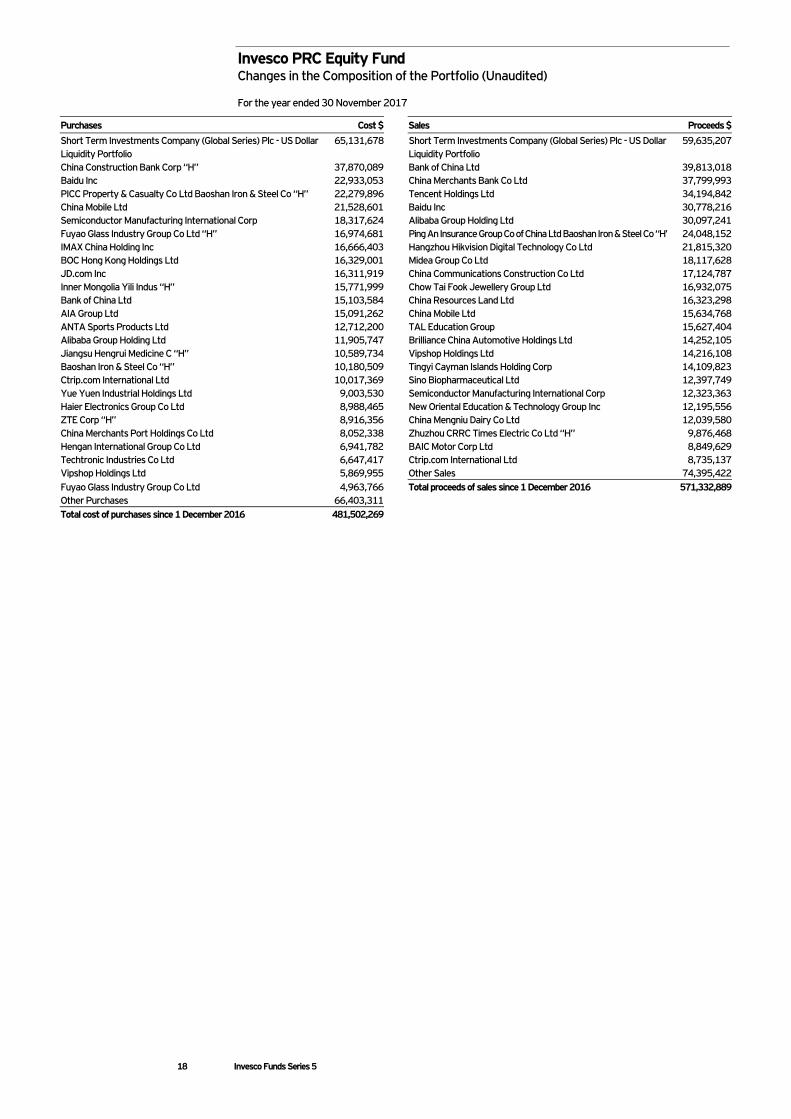
Invesco PRC Equity Fund Changes in the Composition of the Portfolio (Unaudited) For the year ended 30 November 2017
18 Invesco Funds Series 5
Purchases Cost $ Sales Proceeds $
Short Term Investments Company (Global Series) Plc - US Dollar Liquidity Portfolio
65,131,678 Short Term Investments Company (Global Series) Plc - US Dollar Liquidity Portfolio
59,635,207
China Construction Bank Corp “H” 37,870,089 Bank of China Ltd 39,813,018 Baidu Inc 22,933,053 China Merchants Bank Co Ltd 37,799,993 PICC Property & Casualty Co Ltd Baoshan Iron & Steel Co “H” 22,279,896 Tencent Holdings Ltd 34,194,842 China Mobile Ltd 21,528,601 Baidu Inc 30,778,216 Semiconductor Manufacturing International Corp 18,317,624 Alibaba Group Holding Ltd 30,097,241 Fuyao Glass Industry Group Co Ltd “H” 16,974,681 Ping An Insurance Group Co of China Ltd Baoshan Iron & Steel Co “H” 24,048,152 IMAX China Holding Inc 16,666,403 Hangzhou Hikvision Digital Technology Co Ltd 21,815,320 BOC Hong Kong Holdings Ltd 16,329,001 Midea Group Co Ltd 18,117,628 JD.com Inc 16,311,919 China Communications Construction Co Ltd 17,124,787 Inner Mongolia Yili Indus “H” 15,771,999 Chow Tai Fook Jewellery Group Ltd 16,932,075 Bank of China Ltd 15,103,584 China Resources Land Ltd 16,323,298 AIA Group Ltd 15,091,262 China Mobile Ltd 15,634,768 ANTA Sports Products Ltd 12,712,200 TAL Education Group 15,627,404 Alibaba Group Holding Ltd 11,905,747 Brilliance China Automotive Holdings Ltd 14,252,105 Jiangsu Hengrui Medicine C “H” 10,589,734 Vipshop Holdings Ltd 14,216,108 Baoshan Iron & Steel Co “H” 10,180,509 Tingyi Cayman Islands Holding Corp 14,109,823 Ctrip.com International Ltd 10,017,369 Sino Biopharmaceutical Ltd 12,397,749 Yue Yuen Industrial Holdings Ltd 9,003,530 Semiconductor Manufacturing International Corp 12,323,363 Haier Electronics Group Co Ltd 8,988,465 New Oriental Education & Technology Group Inc 12,195,556 ZTE Corp “H” 8,916,356 China Mengniu Dairy Co Ltd 12,039,580 China Merchants Port Holdings Co Ltd 8,052,338 Zhuzhou CRRC Times Electric Co Ltd “H” 9,876,468 Hengan International Group Co Ltd 6,941,782 BAIC Motor Corp Ltd 8,849,629 Techtronic Industries Co Ltd 6,647,417 Ctrip.com International Ltd 8,735,137 Vipshop Holdings Ltd 5,869,955 Other Sales 74,395,422 Fuyao Glass Industry Group Co Ltd 4,963,766 Total proceeds of sales since 1 December 2016 571,332,889 Other Purchases 66,403,311 Total cost of purchases since 1 December 2016 481,502,269
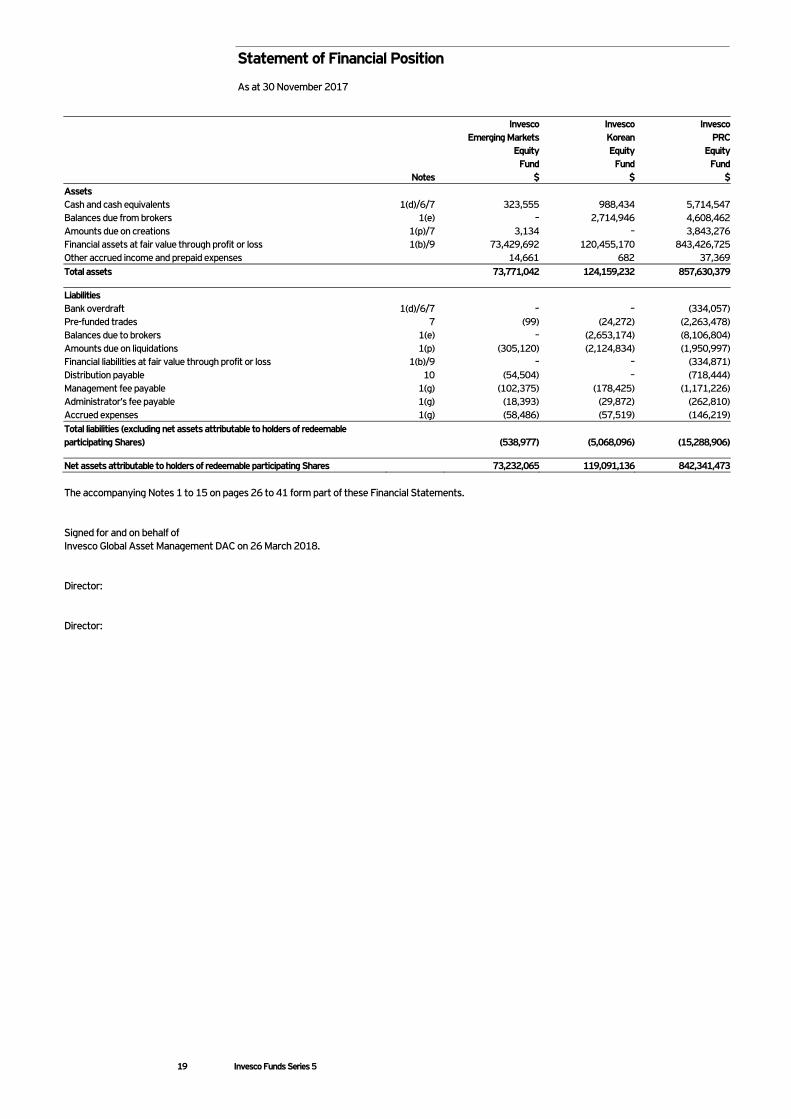
Statement of Financial Position As at 30 November 2017
19 Invesco Funds Series 5
Invesco Emerging Markets
Equity Fund
Invesco Korean Equity
Fund
Invesco PRC
Equity Fund
Notes $ $ $ Assets Cash and cash equivalents 1(d)/6/7 323,555 988,434 5,714,547 Balances due from brokers 1(e) – 2,714,946 4,608,462 Amounts due on creations 1(p)/7 3,134 – 3,843,276 Financial assets at fair value through profit or loss 1(b)/9 73,429,692 120,455,170 843,426,725 Other accrued income and prepaid expenses 14,661 682 37,369 Total assets 73,771,042 124,159,232 857,630,379
Liabilities Bank overdraft 1(d)/6/7 – – (334,057) Pre-funded trades 7 (99) (24,272) (2,263,478) Balances due to brokers 1(e) – (2,653,174) (8,106,804) Amounts due on liquidations 1(p) (305,120) (2,124,834) (1,950,997) Financial liabilities at fair value through profit or loss 1(b)/9 – – (334,871) Distribution payable 10 (54,504) – (718,444) Management fee payable 1(g) (102,375) (178,425) (1,171,226) Administrator’s fee payable 1(g) (18,393) (29,872) (262,810) Accrued expenses 1(g) (58,486) (57,519) (146,219) Total liabilities (excluding net assets attributable to holders of redeemable participating Shares) (538,977) (5,068,096) (15,288,906)
Net assets attributable to holders of redeemable participating Shares 73,232,065 119,091,136 842,341,473 The accompanying Notes 1 to 15 on pages 26 to 41 form part of these Financial Statements. Signed for and on behalf of Invesco Global Asset Management DAC on 26 March 2018. Director: Director:
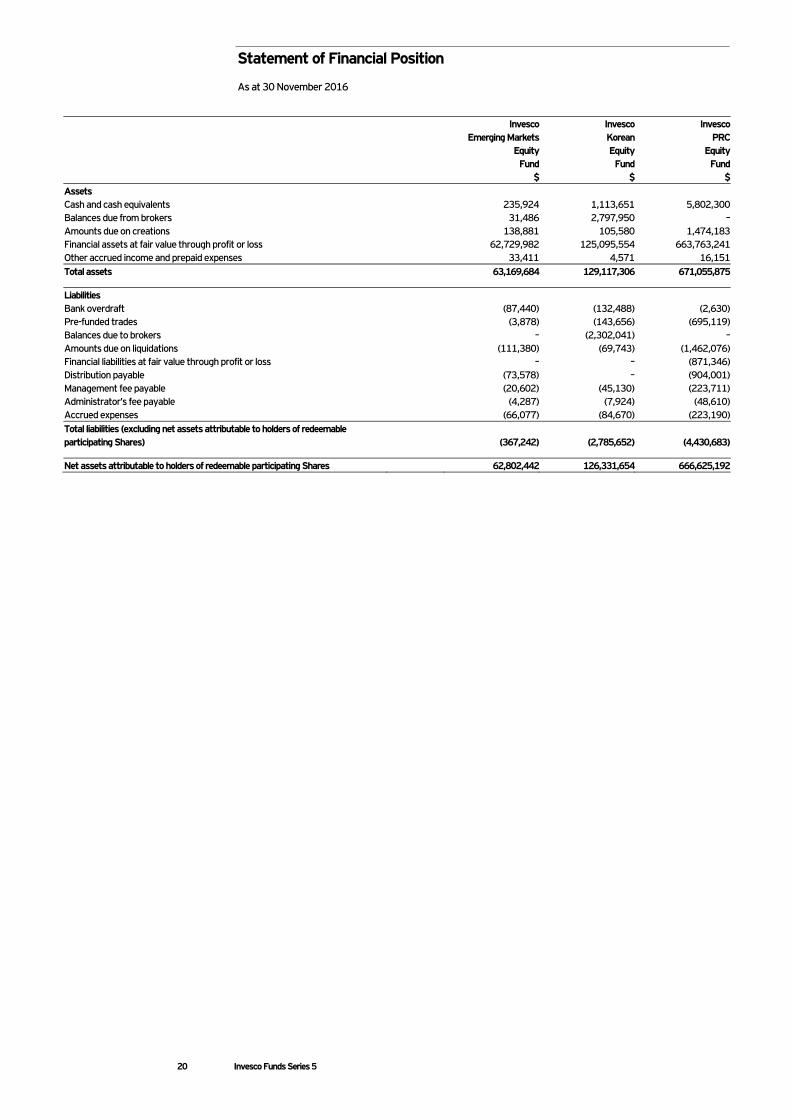
Statement of Financial Position As at 30 November 2016
20 Invesco Funds Series 5
Invesco Emerging Markets
Equity Fund
Invesco Korean Equity
Fund
Invesco PRC
Equity Fund
$ $ $ Assets Cash and cash equivalents 235,924 1,113,651 5,802,300 Balances due from brokers 31,486 2,797,950 – Amounts due on creations 138,881 105,580 1,474,183 Financial assets at fair value through profit or loss 62,729,982 125,095,554 663,763,241 Other accrued income and prepaid expenses 33,411 4,571 16,151 Total assets 63,169,684 129,117,306 671,055,875
Liabilities Bank overdraft (87,440) (132,488) (2,630) Pre-funded trades (3,878) (143,656) (695,119) Balances due to brokers – (2,302,041) – Amounts due on liquidations (111,380) (69,743) (1,462,076) Financial liabilities at fair value through profit or loss – – (871,346) Distribution payable (73,578) – (904,001) Management fee payable (20,602) (45,130) (223,711) Administrator’s fee payable (4,287) (7,924) (48,610) Accrued expenses (66,077) (84,670) (223,190) Total liabilities (excluding net assets attributable to holders of redeemable participating Shares) (367,242) (2,785,652) (4,430,683)
Net assets attributable to holders of redeemable participating Shares 62,802,442 126,331,654 666,625,192
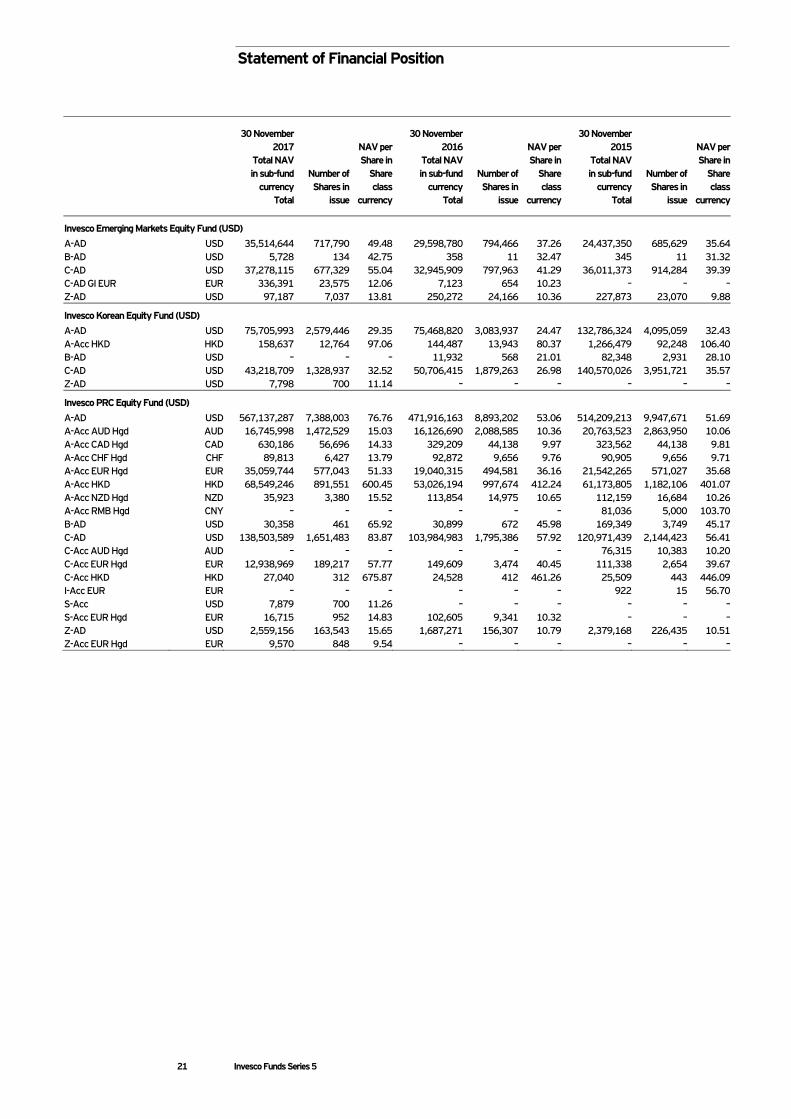
Statement of Financial Position
21 Invesco Funds Series 5
30 November 2017
Total NAV in sub-fund
currency Total
Number of Shares in
issue
NAV per Share in
Share class
currency
30 November 2016
Total NAV in sub-fund
currency Total
Number of Shares in
issue
NAV per Share in
Share class
currency
30 November 2015
Total NAV in sub-fund
currency Total
Number of Shares in
issue
NAV per Share in
Share class
currency
Invesco Emerging Markets Equity Fund (USD)
A-AD USD 35,514,644 717,790 49.48 29,598,780 794,466 37.26 24,437,350 685,629 35.64 B-AD USD 5,728 134 42.75 358 11 32.47 345 11 31.32 C-AD USD 37,278,115 677,329 55.04 32,945,909 797,963 41.29 36,011,373 914,284 39.39 C-AD GI EUR EUR 336,391 23,575 12.06 7,123 654 10.23 – – – Z-AD USD 97,187 7,037 13.81 250,272 24,166 10.36 227,873 23,070 9.88
Invesco Korean Equity Fund (USD)
A-AD USD 75,705,993 2,579,446 29.35 75,468,820 3,083,937 24.47 132,786,324 4,095,059 32.43 A-Acc HKD HKD 158,637 12,764 97.06 144,487 13,943 80.37 1,266,479 92,248 106.40 B-AD USD – – – 11,932 568 21.01 82,348 2,931 28.10 C-AD USD 43,218,709 1,328,937 32.52 50,706,415 1,879,263 26.98 140,570,026 3,951,721 35.57 Z-AD USD 7,798 700 11.14 – – – – – –
Invesco PRC Equity Fund (USD)
A-AD USD 567,137,287 7,388,003 76.76 471,916,163 8,893,202 53.06 514,209,213 9,947,671 51.69 A-Acc AUD Hgd AUD 16,745,998 1,472,529 15.03 16,126,690 2,088,585 10.36 20,763,523 2,863,950 10.06 A-Acc CAD Hgd CAD 630,186 56,696 14.33 329,209 44,138 9.97 323,562 44,138 9.81 A-Acc CHF Hgd CHF 89,813 6,427 13.79 92,872 9,656 9.76 90,905 9,656 9.71 A-Acc EUR Hgd EUR 35,059,744 577,043 51.33 19,040,315 494,581 36.16 21,542,265 571,027 35.68 A-Acc HKD HKD 68,549,246 891,551 600.45 53,026,194 997,674 412.24 61,173,805 1,182,106 401.07 A-Acc NZD Hgd NZD 35,923 3,380 15.52 113,854 14,975 10.65 112,159 16,684 10.26 A-Acc RMB Hgd CNY – – – – – – 81,036 5,000 103.70 B-AD USD 30,358 461 65.92 30,899 672 45.98 169,349 3,749 45.17 C-AD USD 138,503,589 1,651,483 83.87 103,984,983 1,795,386 57.92 120,971,439 2,144,423 56.41 C-Acc AUD Hgd AUD – – – – – – 76,315 10,383 10.20 C-Acc EUR Hgd EUR 12,938,969 189,217 57.77 149,609 3,474 40.45 111,338 2,654 39.67 C-Acc HKD HKD 27,040 312 675.87 24,528 412 461.26 25,509 443 446.09 I-Acc EUR EUR – – – – – – 922 15 56.70 S-Acc USD 7,879 700 11.26 – – – – – – S-Acc EUR Hgd EUR 16,715 952 14.83 102,605 9,341 10.32 – – – Z-AD USD 2,559,156 163,543 15.65 1,687,271 156,307 10.79 2,379,168 226,435 10.51 Z-Acc EUR Hgd EUR 9,570 848 9.54 – – – – – –
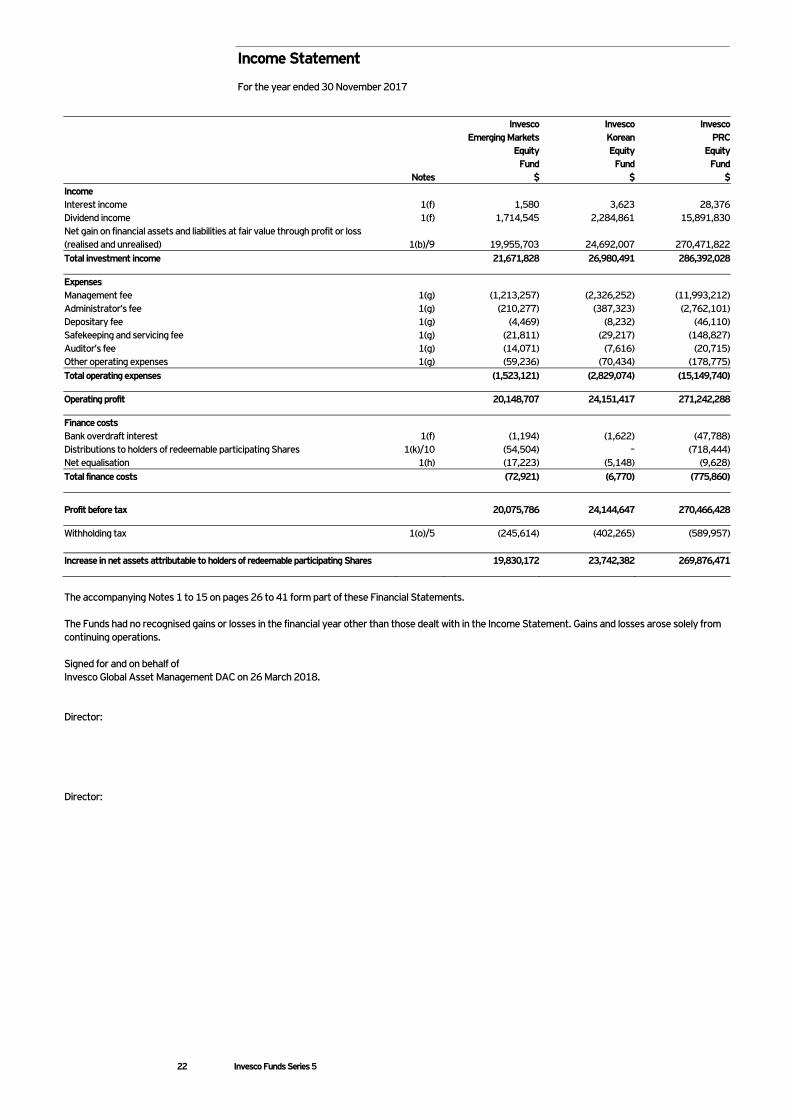
Income Statement For the year ended 30 November 2017
22 Invesco Funds Series 5
Invesco Emerging Markets
Equity Fund
Invesco Korean Equity
Fund
Invesco PRC
Equity Fund
Notes $ $ $ Income Interest income 1(f) 1,580 3,623 28,376 Dividend income 1(f) 1,714,545 2,284,861 15,891,830 Net gain on financial assets and liabilities at fair value through profit or loss (realised and unrealised) 1(b)/9 19,955,703 24,692,007 270,471,822 Total investment income 21,671,828 26,980,491 286,392,028
Expenses Management fee 1(g) (1,213,257) (2,326,252) (11,993,212) Administrator’s fee 1(g) (210,277) (387,323) (2,762,101) Depositary fee 1(g) (4,469) (8,232) (46,110) Safekeeping and servicing fee 1(g) (21,811) (29,217) (148,827) Auditor’s fee 1(g) (14,071) (7,616) (20,715) Other operating expenses 1(g) (59,236) (70,434) (178,775) Total operating expenses (1,523,121) (2,829,074) (15,149,740)
Operating profit 20,148,707 24,151,417 271,242,288
Finance costs Bank overdraft interest 1(f) (1,194) (1,622) (47,788) Distributions to holders of redeemable participating Shares 1(k)/10 (54,504) – (718,444) Net equalisation 1(h) (17,223) (5,148) (9,628) Total finance costs (72,921) (6,770) (775,860)
Profit before tax 20,075,786 24,144,647 270,466,428
Withholding tax 1(o)/5 (245,614) (402,265) (589,957) Increase in net assets attributable to holders of redeemable participating Shares 19,830,172 23,742,382 269,876,471
The accompanying Notes 1 to 15 on pages 26 to 41 form part of these Financial Statements. The Funds had no recognised gains or losses in the financial year other than those dealt with in the Income Statement. Gains and losses arose solely from continuing operations. Signed for and on behalf of Invesco Global Asset Management DAC on 26 March 2018. Director: Director:
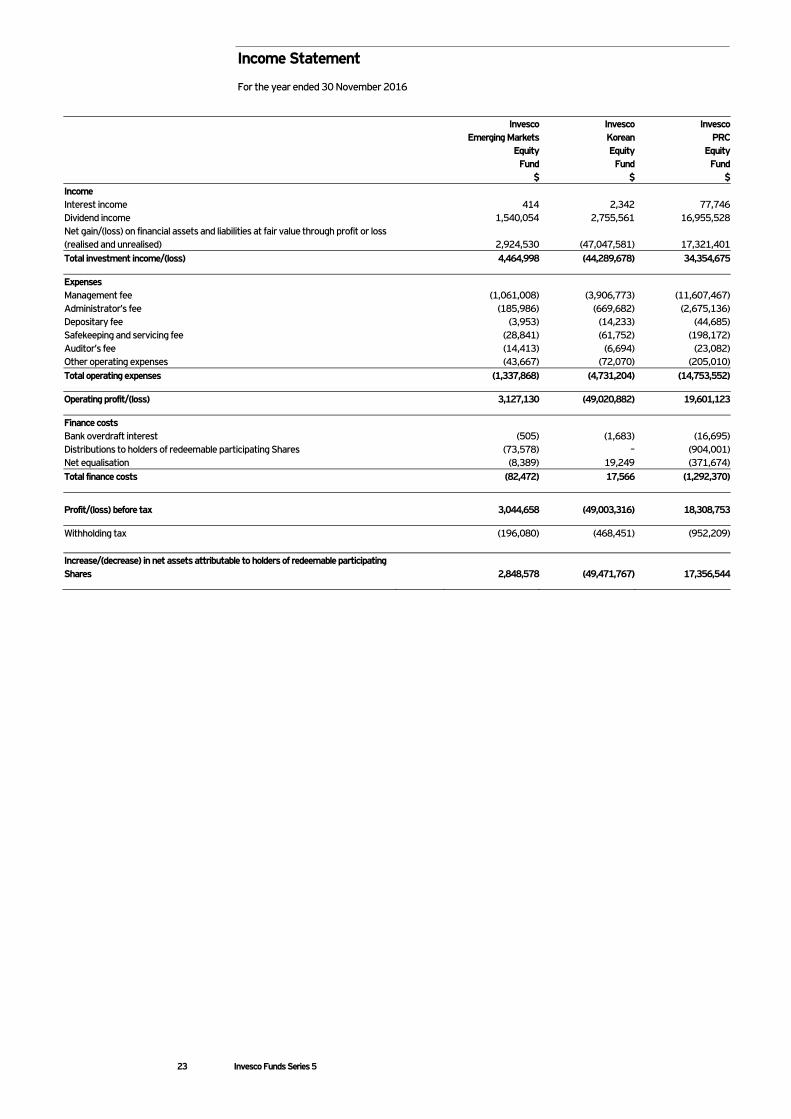
Income Statement For the year ended 30 November 2016
23 Invesco Funds Series 5
Invesco Emerging Markets
Equity Fund
Invesco Korean Equity
Fund
Invesco PRC
Equity Fund
$ $ $ Income Interest income 414 2,342 77,746 Dividend income 1,540,054 2,755,561 16,955,528 Net gain/(loss) on financial assets and liabilities at fair value through profit or loss (realised and unrealised) 2,924,530 (47,047,581) 17,321,401 Total investment income/(loss) 4,464,998 (44,289,678) 34,354,675
Expenses Management fee (1,061,008) (3,906,773) (11,607,467) Administrator’s fee (185,986) (669,682) (2,675,136) Depositary fee (3,953) (14,233) (44,685) Safekeeping and servicing fee (28,841) (61,752) (198,172) Auditor’s fee (14,413) (6,694) (23,082) Other operating expenses (43,667) (72,070) (205,010) Total operating expenses (1,337,868) (4,731,204) (14,753,552)
Operating profit/(loss) 3,127,130 (49,020,882) 19,601,123
Finance costs Bank overdraft interest (505) (1,683) (16,695) Distributions to holders of redeemable participating Shares (73,578) – (904,001) Net equalisation (8,389) 19,249 (371,674) Total finance costs (82,472) 17,566 (1,292,370)
Profit/(loss) before tax 3,044,658 (49,003,316) 18,308,753
Withholding tax (196,080) (468,451) (952,209) Increase/(decrease) in net assets attributable to holders of redeemable participating Shares 2,848,578 (49,471,767) 17,356,544
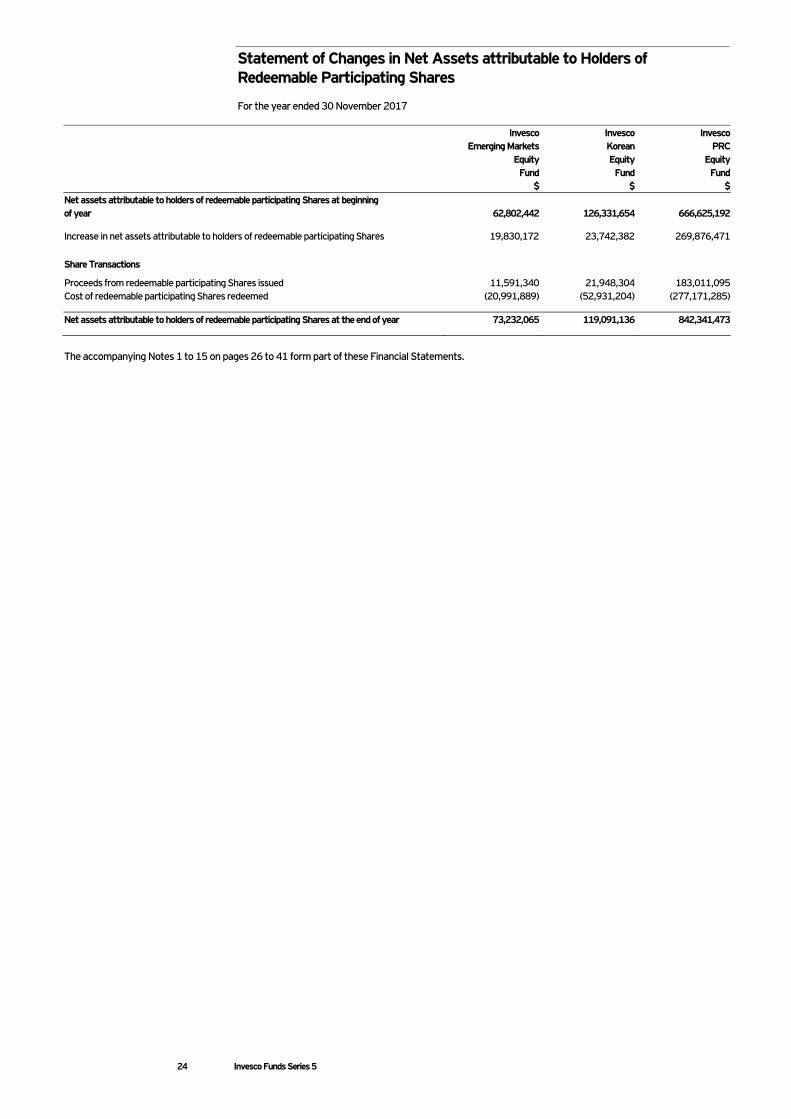
Statement of Changes in Net Assets attributable to Holders of Redeemable Participating Shares For the year ended 30 November 2017
24 Invesco Funds Series 5
Invesco Emerging Markets
Equity Fund
Invesco Korean Equity
Fund
Invesco PRC
Equity Fund
$ $ $ Net assets attributable to holders of redeemable participating Shares at beginning of year 62,802,442 126,331,654 666,625,192
Increase in net assets attributable to holders of redeemable participating Shares 19,830,172 23,742,382 269,876,471
Share Transactions
Proceeds from redeemable participating Shares issued 11,591,340 21,948,304 183,011,095 Cost of redeemable participating Shares redeemed (20,991,889) (52,931,204) (277,171,285)
Net assets attributable to holders of redeemable participating Shares at the end of year 73,232,065 119,091,136 842,341,473
The accompanying Notes 1 to 15 on pages 26 to 41 form part of these Financial Statements.
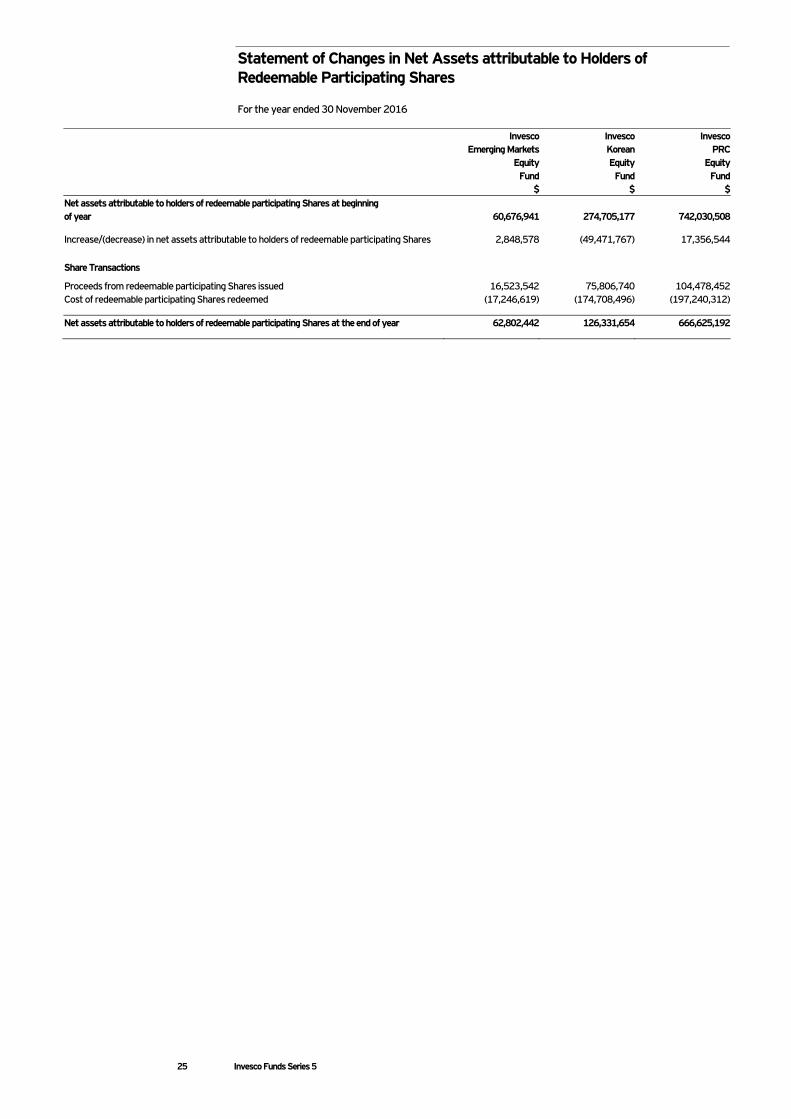
Statement of Changes in Net Assets attributable to Holders of Redeemable Participating Shares For the year ended 30 November 2016
25 Invesco Funds Series 5
Invesco Emerging Markets
Equity Fund
Invesco Korean Equity
Fund
Invesco PRC
Equity Fund
$ $ $ Net assets attributable to holders of redeemable participating Shares at beginning of year 60,676,941 274,705,177 742,030,508
Increase/(decrease) in net assets attributable to holders of redeemable participating Shares 2,848,578 (49,471,767) 17,356,544
Share Transactions
Proceeds from redeemable participating Shares issued 16,523,542 75,806,740 104,478,452 Cost of redeemable participating Shares redeemed (17,246,619) (174,708,496) (197,240,312)
Net assets attributable to holders of redeemable participating Shares at the end of year 62,802,442 126,331,654 666,625,192
Notes to the Financial Statements For the year ended 30 November 2017
26 Invesco Funds Series 5
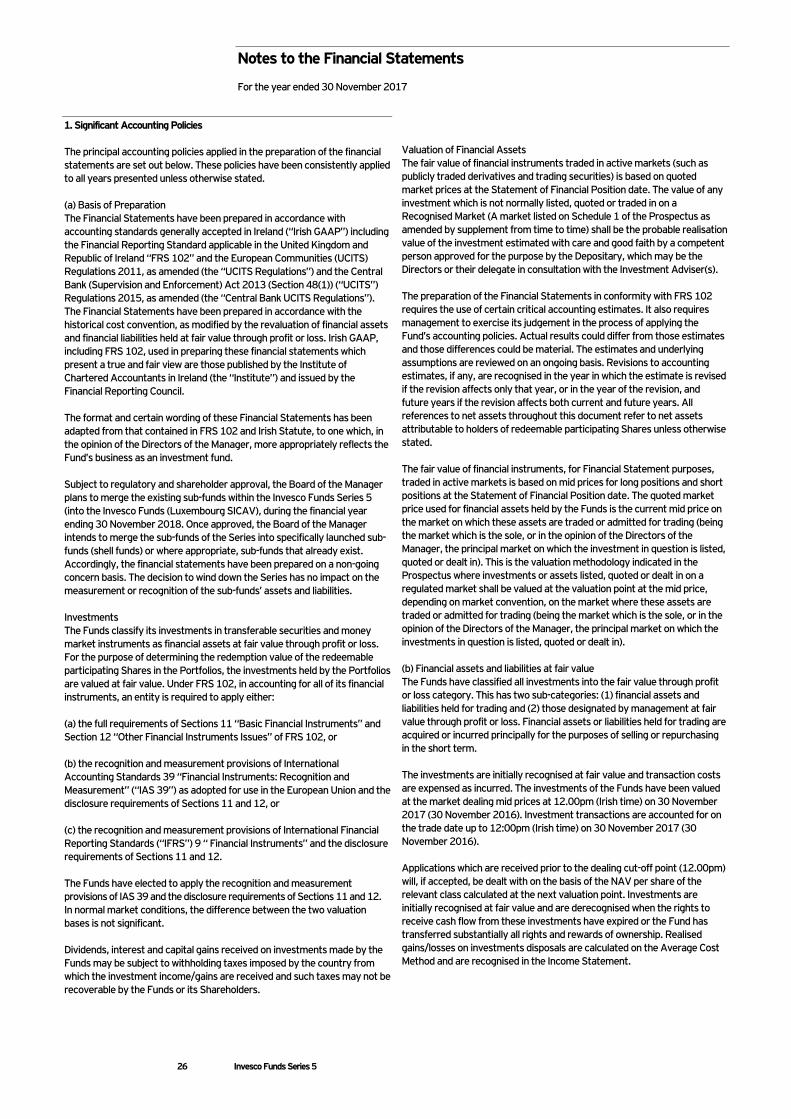
1. Significant Accounting Policies The principal accounting policies applied in the preparation of the financial statements are set out below. These policies have been consistently applied to all years presented unless otherwise stated. (a) Basis of Preparation The Financial Statements have been prepared in accordance with accounting standards generally accepted in Ireland (“Irish GAAP”) including the Financial Reporting Standard applicable in the United Kingdom and Republic of Ireland “FRS 102” and the European Communities (UCITS) Regulations 2011, as amended (the “UCITS Regulations”) and the Central Bank (Supervision and Enforcement) Act 2013 (Section 48(1)) (“UCITS”) Regulations 2015, as amended (the “Central Bank UCITS Regulations”). The Financial Statements have been prepared in accordance with the historical cost convention, as modified by the revaluation of financial assets and financial liabilities held at fair value through profit or loss. Irish GAAP, including FRS 102, used in preparing these financial statements which present a true and fair view are those published by the Institute of Chartered Accountants in Ireland (the “Institute”) and issued by the Financial Reporting Council. The format and certain wording of these Financial Statements has been adapted from that contained in FRS 102 and Irish Statute, to one which, in the opinion of the Directors of the Manager, more appropriately reflects the Fund’s business as an investment fund. Subject to regulatory and shareholder approval, the Board of the Manager plans to merge the existing sub-funds within the Invesco Funds Series 5 (into the Invesco Funds (Luxembourg SICAV), during the financial year ending 30 November 2018. Once approved, the Board of the Manager intends to merge the sub-funds of the Series into specifically launched sub-funds (shell funds) or where appropriate, sub-funds that already exist. Accordingly, the financial statements have been prepared on a non-going concern basis. The decision to wind down the Series has no impact on the measurement or recognition of the sub-funds’ assets and liabilities. Investments The Funds classify its investments in transferable securities and money market instruments as financial assets at fair value through profit or loss. For the purpose of determining the redemption value of the redeemable participating Shares in the Portfolios, the investments held by the Portfolios are valued at fair value. Under FRS 102, in accounting for all of its financial instruments, an entity is required to apply either: (a) the full requirements of Sections 11 “Basic Financial Instruments” and Section 12 “Other Financial Instruments Issues” of FRS 102, or (b) the recognition and measurement provisions of International Accounting Standards 39 “Financial Instruments: Recognition and Measurement” (“IAS 39”) as adopted for use in the European Union and the disclosure requirements of Sections 11 and 12, or (c) the recognition and measurement provisions of International Financial Reporting Standards (“IFRS”) 9 “ Financial Instruments” and the disclosure requirements of Sections 11 and 12. The Funds have elected to apply the recognition and measurement provisions of IAS 39 and the disclosure requirements of Sections 11 and 12. In normal market conditions, the difference between the two valuation bases is not significant. Dividends, interest and capital gains received on investments made by the Funds may be subject to withholding taxes imposed by the country from which the investment income/gains are received and such taxes may not be recoverable by the Funds or its Shareholders.
Valuation of Financial Assets The fair value of financial instruments traded in active markets (such as publicly traded derivatives and trading securities) is based on quoted market prices at the Statement of Financial Position date. The value of any investment which is not normally listed, quoted or traded in on a Recognised Market (A market listed on Schedule 1 of the Prospectus as amended by supplement from time to time) shall be the probable realisation value of the investment estimated with care and good faith by a competent person approved for the purpose by the Depositary, which may be the Directors or their delegate in consultation with the Investment Adviser(s). The preparation of the Financial Statements in conformity with FRS 102 requires the use of certain critical accounting estimates. It also requires management to exercise its judgement in the process of applying the Fund’s accounting policies. Actual results could differ from those estimates and those differences could be material. The estimates and underlying assumptions are reviewed on an ongoing basis. Revisions to accounting estimates, if any, are recognised in the year in which the estimate is revised if the revision affects only that year, or in the year of the revision, and future years if the revision affects both current and future years. All references to net assets throughout this document refer to net assets attributable to holders of redeemable participating Shares unless otherwise stated. The fair value of financial instruments, for Financial Statement purposes, traded in active markets is based on mid prices for long positions and short positions at the Statement of Financial Position date. The quoted market price used for financial assets held by the Funds is the current mid price on the market on which these assets are traded or admitted for trading (being the market which is the sole, or in the opinion of the Directors of the Manager, the principal market on which the investment in question is listed, quoted or dealt in). This is the valuation methodology indicated in the Prospectus where investments or assets listed, quoted or dealt in on a regulated market shall be valued at the valuation point at the mid price, depending on market convention, on the market where these assets are traded or admitted for trading (being the market which is the sole, or in the opinion of the Directors of the Manager, the principal market on which the investments in question is listed, quoted or dealt in). (b) Financial assets and liabilities at fair value The Funds have classified all investments into the fair value through profit or loss category. This has two sub-categories: (1) financial assets and liabilities held for trading and (2) those designated by management at fair value through profit or loss. Financial assets or liabilities held for trading are acquired or incurred principally for the purposes of selling or repurchasing in the short term. The investments are initially recognised at fair value and transaction costs are expensed as incurred. The investments of the Funds have been valued at the market dealing mid prices at 12.00pm (Irish time) on 30 November 2017 (30 November 2016). Investment transactions are accounted for on the trade date up to 12:00pm (Irish time) on 30 November 2017 (30 November 2016). Applications which are received prior to the dealing cut-off point (12.00pm) will, if accepted, be dealt with on the basis of the NAV per share of the relevant class calculated at the next valuation point. Investments are initially recognised at fair value and are derecognised when the rights to receive cash flow from these investments have expired or the Fund has transferred substantially all rights and rewards of ownership. Realised gains/losses on investments disposals are calculated on the Average Cost Method and are recognised in the Income Statement.
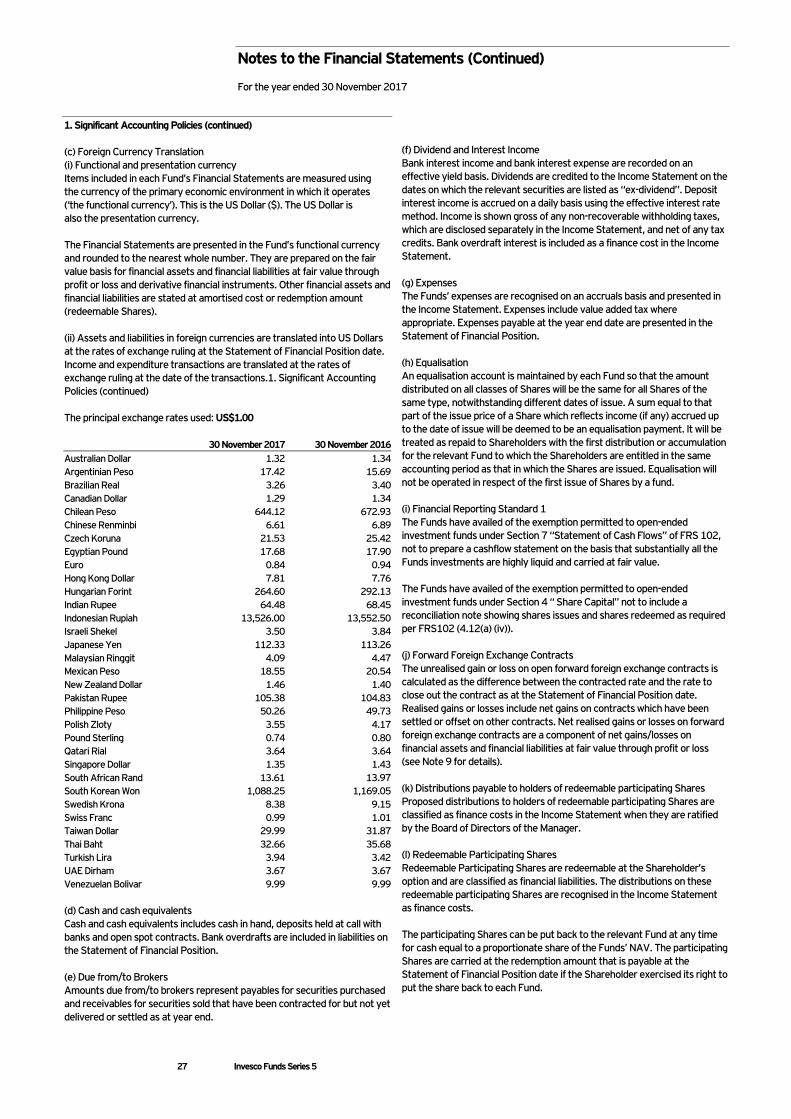
Notes to the Financial Statements (Continued) For the year ended 30 November 2017
27 Invesco Funds Series 5
1. Significant Accounting Policies (continued) (c) Foreign Currency Translation (i) Functional and presentation currency Items included in each Fund’s Financial Statements are measured using the currency of the primary economic environment in which it operates (‘the functional currency’). This is the US Dollar ($). The US Dollar is also the presentation currency. The Financial Statements are presented in the Fund’s functional currency and rounded to the nearest whole number. They are prepared on the fair value basis for financial assets and financial liabilities at fair value through profit or loss and derivative financial instruments. Other financial assets and financial liabilities are stated at amortised cost or redemption amount (redeemable Shares). (ii) Assets and liabilities in foreign currencies are translated into US Dollars at the rates of exchange ruling at the Statement of Financial Position date. Income and expenditure transactions are translated at the rates of exchange ruling at the date of the transactions.1. Significant Accounting Policies (continued) The principal exchange rates used: US$1.00 30 November 2017 30 November 2016 Australian Dollar 1.32 1.34 Argentinian Peso 17.42 15.69 Brazilian Real 3.26 3.40 Canadian Dollar 1.29 1.34 Chilean Peso 644.12 672.93 Chinese Renminbi 6.61 6.89 Czech Koruna 21.53 25.42 Egyptian Pound 17.68 17.90 Euro 0.84 0.94 Hong Kong Dollar 7.81 7.76 Hungarian Forint 264.60 292.13 Indian Rupee 64.48 68.45 Indonesian Rupiah 13,526.00 13,552.50 Israeli Shekel 3.50 3.84 Japanese Yen 112.33 113.26 Malaysian Ringgit 4.09 4.47 Mexican Peso 18.55 20.54 New Zealand Dollar 1.46 1.40 Pakistan Rupee 105.38 104.83 Philippine Peso 50.26 49.73 Polish Zloty 3.55 4.17 Pound Sterling 0.74 0.80 Qatari Rial 3.64 3.64 Singapore Dollar 1.35 1.43 South African Rand 13.61 13.97 South Korean Won 1,088.25 1,169.05 Swedish Krona 8.38 9.15 Swiss Franc 0.99 1.01 Taiwan Dollar 29.99 31.87 Thai Baht 32.66 35.68 Turkish Lira 3.94 3.42 UAE Dirham 3.67 3.67 Venezuelan Bolivar 9.99 9.99 (d) Cash and cash equivalents Cash and cash equivalents includes cash in hand, deposits held at call with banks and open spot contracts. Bank overdrafts are included in liabilities on the Statement of Financial Position. (e) Due from/to Brokers Amounts due from/to brokers represent payables for securities purchased and receivables for securities sold that have been contracted for but not yet delivered or settled as at year end.
(f) Dividend and Interest Income Bank interest income and bank interest expense are recorded on an effective yield basis. Dividends are credited to the Income Statement on the dates on which the relevant securities are listed as “ex-dividend”. Deposit interest income is accrued on a daily basis using the effective interest rate method. Income is shown gross of any non-recoverable withholding taxes, which are disclosed separately in the Income Statement, and net of any tax credits. Bank overdraft interest is included as a finance cost in the Income Statement. (g) Expenses The Funds’ expenses are recognised on an accruals basis and presented in the Income Statement. Expenses include value added tax where appropriate. Expenses payable at the year end date are presented in the Statement of Financial Position. (h) Equalisation An equalisation account is maintained by each Fund so that the amount distributed on all classes of Shares will be the same for all Shares of the same type, notwithstanding different dates of issue. A sum equal to that part of the issue price of a Share which reflects income (if any) accrued up to the date of issue will be deemed to be an equalisation payment. It will be treated as repaid to Shareholders with the first distribution or accumulation for the relevant Fund to which the Shareholders are entitled in the same accounting period as that in which the Shares are issued. Equalisation will not be operated in respect of the first issue of Shares by a fund. (i) Financial Reporting Standard 1 The Funds have availed of the exemption permitted to open-ended investment funds under Section 7 “Statement of Cash Flows” of FRS 102, not to prepare a cashflow statement on the basis that substantially all the Funds investments are highly liquid and carried at fair value. The Funds have availed of the exemption permitted to open-ended investment funds under Section 4 “ Share Capital” not to include a reconciliation note showing shares issues and shares redeemed as required per FRS102 (4.12(a) (iv)). (j) Forward Foreign Exchange Contracts The unrealised gain or loss on open forward foreign exchange contracts is calculated as the difference between the contracted rate and the rate to close out the contract as at the Statement of Financial Position date. Realised gains or losses include net gains on contracts which have been settled or offset on other contracts. Net realised gains or losses on forward foreign exchange contracts are a component of net gains/losses on financial assets and financial liabilities at fair value through profit or loss (see Note 9 for details). (k) Distributions payable to holders of redeemable participating Shares Proposed distributions to holders of redeemable participating Shares are classified as finance costs in the Income Statement when they are ratified by the Board of Directors of the Manager. (l) Redeemable Participating Shares Redeemable Participating Shares are redeemable at the Shareholder’s option and are classified as financial liabilities. The distributions on these redeemable participating Shares are recognised in the Income Statement as finance costs. The participating Shares can be put back to the relevant Fund at any time for cash equal to a proportionate share of the Funds’ NAV. The participating Shares are carried at the redemption amount that is payable at the Statement of Financial Position date if the Shareholder exercised its right to put the share back to each Fund.
Notes to the Financial Statements (Continued) For the year ended 30 November 2017
28 Invesco Funds Series 5
1. Significant Accounting Policies (continued) (m) Value of Investments To determine the NAV of each Fund for subscriptions and redemptions, investments have been valued based on the mid market prices at 12:00pm (Irish time) on the relevant trading day. For Financial Statements purposes, investments are valued based on mid prices. The NAV per Share is disclosed in the Statement of Financial Position. (n) Swing Pricing Securities are valued as outlined in Note 1(b). However, in order to mitigate the effects of dilution, the Funds have implemented a policy of “Swing Pricing”. In the best interest of Shareholders, the Directors of the Manager may allow for the NAV to be adjusted, using bid or ask market quotation rather than mid, depending on the net Share activity arising from subscriptions, redemptions or switching in a fund for a given business day. The Funds operate partial swing only. That is the Funds will not swing to either a bid or ask price basis daily, but only when a predetermined level of Shareholder activity is exceeded. High redemption level triggers a swing to a bid price basis, whereas high subscription level triggers a swing to ask price basis. The Directors of the Manager have the ability to place a fund on constant swing depending on the recent Shareholder activity trends of a fund. (o) Withholding Tax The Funds currently incur withholding taxes imposed by certain countries on investment income. Such income is recorded gross of withholding taxes in the income statement. Withholding taxes are shown as a separate item in the Income Statement. (p) Amounts Due on Creations/Liquidations Amounts due on creations and liquidations represent receivables for creation of shares and payables for liquidation of shares that have been contracted for but not yet delivered by the year end. Creations and liquidations paid after the year end, but based upon year end NAV’s, are reflected as amounts due on creations and liquidations in the Statement of Financial Position as at 30 November 2017 (30 November 2016). (q) Offsetting Financial assets and liabilities are offset and the net amount reported in the Statement of Financial Position when there is a legally enforceable right to offset the recognised amounts and there is an intention to settle on a net basis or realise the asset and settle the liability simultaneously. During the years ended 30 November 2017 and 30 November 2016, there were no master netting agreements. (r) Capital gains tax on Investment By investing in China A-shares and other permitted securities in China including corporate and government bonds, securities investment funds and warrants listed on the China stock exchanges (together “China Securities”), a fund was subject to withholding and other taxes imposed under China tax law or regulations. Specifically, a fund’s income from interests, dividends and profit distributions sourced from China Securities, received by QFII on behalf of the relevant Fund, was generally subject to Chinese withholding tax at a rate of 10%, in the absence of an applicable tax treaty. In addition, given the uncertainty surrounding a fund’s potential China tax liabilities, in determining the NAV of the Invesco PRC Equity Fund, a provision is made in the amount of 10% of capital gains for potential China capital gains tax. On 17 November 2014, the China Securities Regulatory Commission (CSRC), Ministry of Finance (MOF), and the State Administration of Taxation (SAT), acting with State Council’s approval, jointly announced that foreign investors will be temporarily exempt from tax on capital gains derived from the trading of A-shares under the Shanghai-Hong Kong Stock Connect (Stock Connect) program in relation to disposals made on or after that date. Circular 79 issued on 17 November 2014 also clarified that 10%
capital gains tax would be applicable in relation to realised capital gains earned on disposals of China A-shares that had taken place during the five years prior to that date. As a result, there is no provision for potential China capital gains tax for the year ended 30 November 2017 or 30 November 2016. 2. UK Reporting The offshore Funds (Tax) Regulations 2009 and Subsequent Regulations Amendments (‘the Regulations’) introduced new provisions to update offshore funds regime and came into effect for periods of accounting commencing after 1 December 2009. The Reporting Funds Regime requires: 1. The reporting fund status is applied for once and in advance. 2. The relevant Share classes to report details of Income annually, within
six months of their accounting year end to both Investors and UK authorities.
3. Investors to provide details of reportable income on their annual tax return.
The following Share Classes currently have UK Reporting Status; Fund Classes Invesco Emerging Market Equity Fund A-Dist & C-Dist & C-AD GI EUR
& Z-Dist Invesco Korean Equity Fund A-Dist & C-Dist Invesco PRC Equity Fund A-Dist & C-Dist & Z-Dist The Statement of Reportable Income for the financial year ended 30 November 2017 will be available through the following Invesco website by 31 May 2018. www.invesco.com 3. Soft Commissions and Related Party Transactions The Funds, (consistent with obtaining the best net result, including best execution), may enter into agreements with counterparties whereby those counterparties may make payments for investment services provided to the Funds. Investment services are used by the Funds to improve or add to the services provided to its clients. Although each and every service may not be used to service each and every account managed by the Funds, the Directors of the Manager consider that those investment services received are, in the aggregate, of significant assistance in fulfilling its investment responsibilities and are of demonstrable benefit to all clients. Only services that in the opinion of the Directors of the Manager assist in the provision of investment services to the Funds’ clients will be paid for by counterparties. Allowable investment services include services that provide assistance to the Funds in its investment performance. Those services include, but are not necessarily limited to, furnishing analysis, research and advisory services including economic factors and trends, portfolio valuation and analysis, performance measurement, market prices services and the use of specialised computer software and hardware or other information facilities. The Funds will ensure adherence to the investment decision making responsibilities to its clients in accordance with the laws of the countries that have jurisdiction over its clients or business. This may vary in application with respect to the appropriateness of those investment services provided.
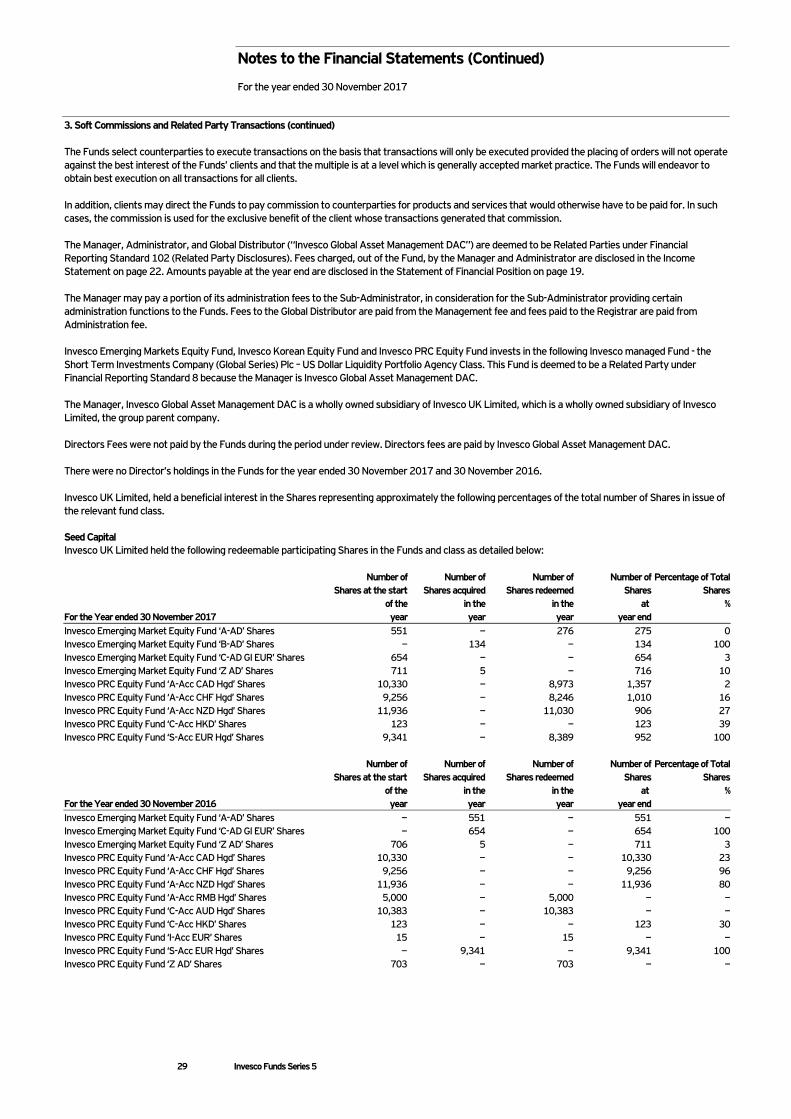
Notes to the Financial Statements (Continued) For the year ended 30 November 2017
29 Invesco Funds Series 5
3. Soft Commissions and Related Party Transactions (continued) The Funds select counterparties to execute transactions on the basis that transactions will only be executed provided the placing of orders will not operate against the best interest of the Funds’ clients and that the multiple is at a level which is generally accepted market practice. The Funds will endeavor to obtain best execution on all transactions for all clients. In addition, clients may direct the Funds to pay commission to counterparties for products and services that would otherwise have to be paid for. In such cases, the commission is used for the exclusive benefit of the client whose transactions generated that commission. The Manager, Administrator, and Global Distributor (“Invesco Global Asset Management DAC”) are deemed to be Related Parties under Financial Reporting Standard 102 (Related Party Disclosures). Fees charged, out of the Fund, by the Manager and Administrator are disclosed in the Income Statement on page 22. Amounts payable at the year end are disclosed in the Statement of Financial Position on page 19. The Manager may pay a portion of its administration fees to the Sub-Administrator, in consideration for the Sub-Administrator providing certain administration functions to the Funds. Fees to the Global Distributor are paid from the Management fee and fees paid to the Registrar are paid from Administration fee. Invesco Emerging Markets Equity Fund, Invesco Korean Equity Fund and Invesco PRC Equity Fund invests in the following Invesco managed Fund - the Short Term Investments Company (Global Series) Plc – US Dollar Liquidity Portfolio Agency Class. This Fund is deemed to be a Related Party under Financial Reporting Standard 8 because the Manager is Invesco Global Asset Management DAC. The Manager, Invesco Global Asset Management DAC is a wholly owned subsidiary of Invesco UK Limited, which is a wholly owned subsidiary of Invesco Limited, the group parent company. Directors Fees were not paid by the Funds during the period under review. Directors fees are paid by Invesco Global Asset Management DAC. There were no Director’s holdings in the Funds for the year ended 30 November 2017 and 30 November 2016. Invesco UK Limited, held a beneficial interest in the Shares representing approximately the following percentages of the total number of Shares in issue of the relevant fund class. Seed Capital Invesco UK Limited held the following redeemable participating Shares in the Funds and class as detailed below: For the Year ended 30 November 2017
Number of Shares at the start
of the year
Number of Shares acquired
in the year
Number of Shares redeemed
in the year
Number of Shares
at year end
Percentage of Total Shares
%
Invesco Emerging Market Equity Fund ‘A-AD’ Shares 551 − 276 275 0 Invesco Emerging Market Equity Fund ‘B-AD’ Shares − 134 − 134 100 Invesco Emerging Market Equity Fund ‘C-AD GI EUR’ Shares 654 − − 654 3 Invesco Emerging Market Equity Fund ‘Z AD’ Shares 711 5 − 716 10 Invesco PRC Equity Fund ‘A-Acc CAD Hgd’ Shares 10,330 − 8,973 1,357 2 Invesco PRC Equity Fund ‘A-Acc CHF Hgd’ Shares 9,256 − 8,246 1,010 16 Invesco PRC Equity Fund ‘A-Acc NZD Hgd’ Shares 11,936 − 11,030 906 27 Invesco PRC Equity Fund ‘C-Acc HKD’ Shares 123 − − 123 39 Invesco PRC Equity Fund ‘S-Acc EUR Hgd’ Shares 9,341 − 8,389 952 100 For the Year ended 30 November 2016
Number of Shares at the start
of the year
Number of Shares acquired
in the year
Number of Shares redeemed
in the year
Number of Shares
at year end
Percentage of Total Shares
%
Invesco Emerging Market Equity Fund ‘A-AD’ Shares − 551 − 551 − Invesco Emerging Market Equity Fund ‘C-AD GI EUR’ Shares − 654 − 654 100 Invesco Emerging Market Equity Fund ‘Z AD’ Shares 706 5 − 711 3 Invesco PRC Equity Fund ‘A-Acc CAD Hgd’ Shares 10,330 − − 10,330 23 Invesco PRC Equity Fund ‘A-Acc CHF Hgd’ Shares 9,256 − − 9,256 96 Invesco PRC Equity Fund ‘A-Acc NZD Hgd’ Shares 11,936 − − 11,936 80 Invesco PRC Equity Fund ‘A-Acc RMB Hgd’ Shares 5,000 − 5,000 − − Invesco PRC Equity Fund ‘C-Acc AUD Hgd’ Shares 10,383 − 10,383 − − Invesco PRC Equity Fund ‘C-Acc HKD’ Shares 123 − − 123 30 Invesco PRC Equity Fund ‘I-Acc EUR’ Shares 15 − 15 − − Invesco PRC Equity Fund ‘S-Acc EUR Hgd’ Shares − 9,341 − 9,341 100 Invesco PRC Equity Fund ‘Z AD’ Shares 703 − 703 − −
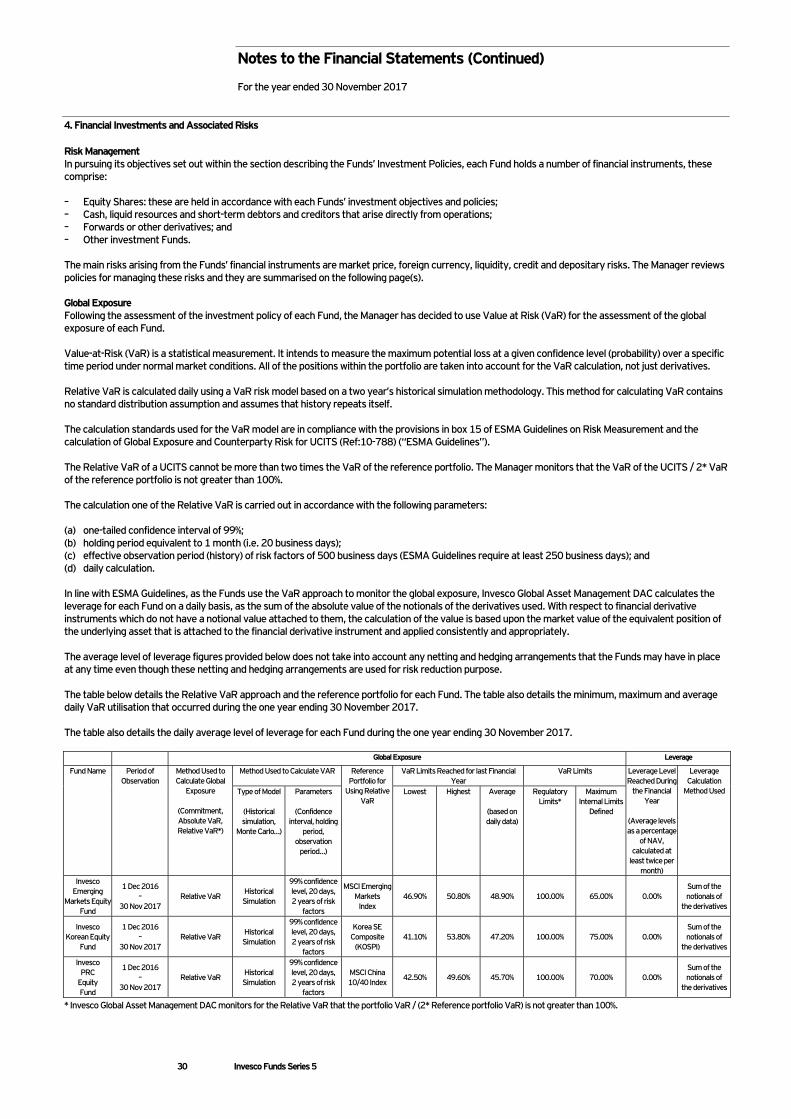
Notes to the Financial Statements (Continued) For the year ended 30 November 2017
30 Invesco Funds Series 5
4. Financial Investments and Associated Risks Risk Management In pursuing its objectives set out within the section describing the Funds’ Investment Policies, each Fund holds a number of financial instruments, these comprise: – Equity Shares: these are held in accordance with each Funds’ investment objectives and policies; – Cash, liquid resources and short-term debtors and creditors that arise directly from operations; – Forwards or other derivatives; and – Other investment Funds. The main risks arising from the Funds’ financial instruments are market price, foreign currency, liquidity, credit and depositary risks. The Manager reviews policies for managing these risks and they are summarised on the following page(s). Global Exposure Following the assessment of the investment policy of each Fund, the Manager has decided to use Value at Risk (VaR) for the assessment of the global exposure of each Fund. Value-at-Risk (VaR) is a statistical measurement. It intends to measure the maximum potential loss at a given confidence level (probability) over a specific time period under normal market conditions. All of the positions within the portfolio are taken into account for the VaR calculation, not just derivatives. Relative VaR is calculated daily using a VaR risk model based on a two year’s historical simulation methodology. This method for calculating VaR contains no standard distribution assumption and assumes that history repeats itself. The calculation standards used for the VaR model are in compliance with the provisions in box 15 of ESMA Guidelines on Risk Measurement and the calculation of Global Exposure and Counterparty Risk for UCITS (Ref:10-788) (“ESMA Guidelines”). The Relative VaR of a UCITS cannot be more than two times the VaR of the reference portfolio. The Manager monitors that the VaR of the UCITS / 2* VaR of the reference portfolio is not greater than 100%. The calculation one of the Relative VaR is carried out in accordance with the following parameters: (a) one-tailed confidence interval of 99%; (b) holding period equivalent to 1 month (i.e. 20 business days); (c) effective observation period (history) of risk factors of 500 business days (ESMA Guidelines require at least 250 business days); and (d) daily calculation. In line with ESMA Guidelines, as the Funds use the VaR approach to monitor the global exposure, Invesco Global Asset Management DAC calculates the leverage for each Fund on a daily basis, as the sum of the absolute value of the notionals of the derivatives used. With respect to financial derivative instruments which do not have a notional value attached to them, the calculation of the value is based upon the market value of the equivalent position of the underlying asset that is attached to the financial derivative instrument and applied consistently and appropriately. The average level of leverage figures provided below does not take into account any netting and hedging arrangements that the Funds may have in place at any time even though these netting and hedging arrangements are used for risk reduction purpose. The table below details the Relative VaR approach and the reference portfolio for each Fund. The table also details the minimum, maximum and average daily VaR utilisation that occurred during the one year ending 30 November 2017. The table also details the daily average level of leverage for each Fund during the one year ending 30 November 2017.
Global Exposure Leverage
Fund Name Period of Observation
Method Used to Calculate Global
Exposure
(Commitment, Absolute VaR, Relative VaR*)
Method Used to Calculate VAR Reference Portfolio for
Using Relative VaR
VaR Limits Reached for last Financial Year
VaR Limits Leverage Level Reached During
the Financial Year
(Average levels as a percentage
of NAV, calculated at
least twice per month)
Leverage Calculation
Method Used Type of Model
(Historical simulation,
Monte Carlo…)
Parameters
(Confidence interval, holding
period, observation
period…)
Lowest Highest Average
(based on daily data)
Regulatory Limits*
Maximum Internal Limits
Defined
Invesco Emerging
Markets Equity Fund
1 Dec 2016 –
30 Nov 2017 Relative VaR Historical
Simulation
99% confidence level, 20 days, 2 years of risk
factors
MSCI Emerging Markets Index
46.90% 50.80% 48.90% 100.00% 65.00% 0.00% Sum of the notionals of
the derivatives
Invesco Korean Equity
Fund
1 Dec 2016 –
30 Nov 2017 Relative VaR Historical
Simulation
99% confidence level, 20 days, 2 years of risk
factors
Korea SE Composite
(KOSPI) 41.10% 53.80% 47.20% 100.00% 75.00% 0.00%
Sum of the notionals of
the derivatives
Invesco PRC
Equity Fund
1 Dec 2016 –
30 Nov 2017 Relative VaR Historical
Simulation
99% confidence level, 20 days, 2 years of risk
factors
MSCI China 10/40 Index 42.50% 49.60% 45.70% 100.00% 70.00% 0.00%
Sum of the notionals of
the derivatives
* Invesco Global Asset Management DAC monitors for the Relative VaR that the portfolio VaR / (2* Reference portfolio VaR) is not greater than 100%.
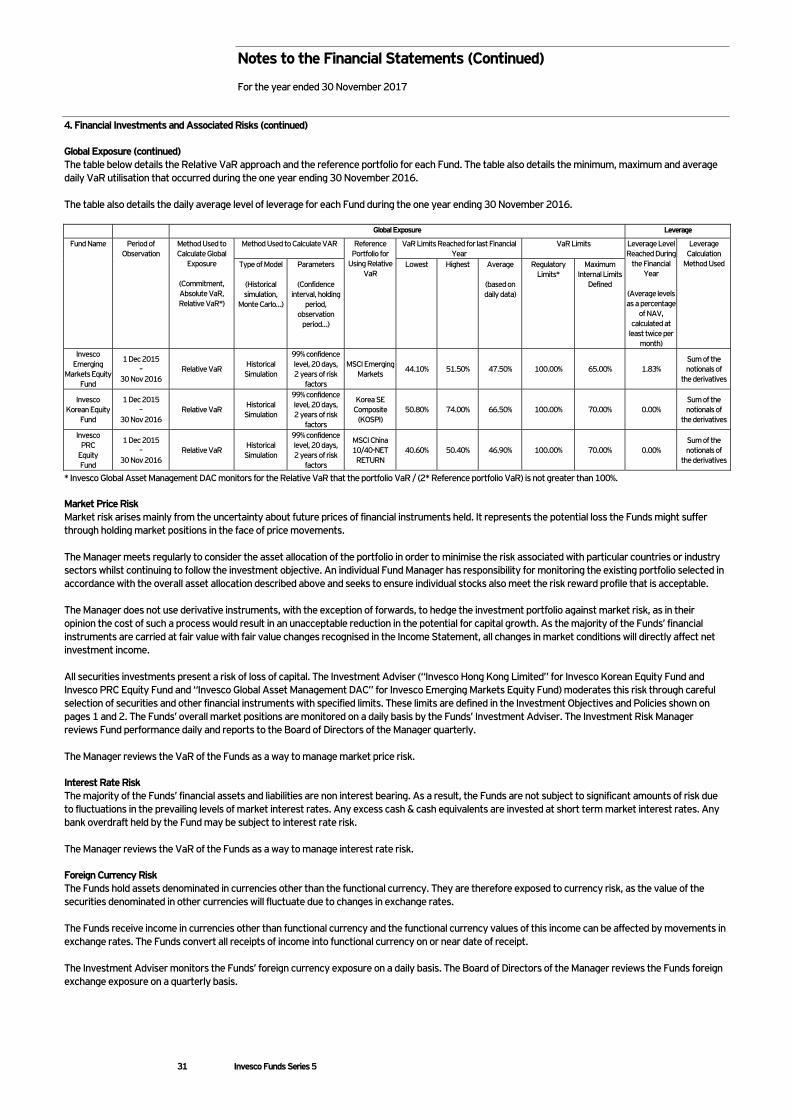
Notes to the Financial Statements (Continued) For the year ended 30 November 2017
31 Invesco Funds Series 5
4. Financial Investments and Associated Risks (continued) Global Exposure (continued) The table below details the Relative VaR approach and the reference portfolio for each Fund. The table also details the minimum, maximum and average daily VaR utilisation that occurred during the one year ending 30 November 2016. The table also details the daily average level of leverage for each Fund during the one year ending 30 November 2016.
Global Exposure Leverage
Fund Name Period of Observation
Method Used to Calculate Global
Exposure
(Commitment, Absolute VaR, Relative VaR*)
Method Used to Calculate VAR Reference Portfolio for
Using Relative VaR
VaR Limits Reached for last Financial Year
VaR Limits Leverage Level Reached During
the Financial Year
(Average levels as a percentage
of NAV, calculated at
least twice per month)
Leverage Calculation
Method Used Type of Model
(Historical simulation,
Monte Carlo…)
Parameters
(Confidence interval, holding
period, observation
period…)
Lowest Highest Average
(based on daily data)
Regulatory Limits*
Maximum Internal Limits
Defined
Invesco Emerging
Markets Equity Fund
1 Dec 2015 –
30 Nov 2016 Relative VaR Historical
Simulation
99% confidence level, 20 days, 2 years of risk
factors
MSCI Emerging Markets 44.10% 51.50% 47.50% 100.00% 65.00% 1.83%
Sum of the notionals of
the derivatives
Invesco Korean Equity
Fund
1 Dec 2015 –
30 Nov 2016 Relative VaR Historical
Simulation
99% confidence level, 20 days, 2 years of risk
factors
Korea SE Composite
(KOSPI) 50.80% 74.00% 66.50% 100.00% 70.00% 0.00%
Sum of the notionals of
the derivatives
Invesco PRC
Equity Fund
1 Dec 2015 –
30 Nov 2016 Relative VaR Historical
Simulation
99% confidence level, 20 days, 2 years of risk
factors
MSCI China 10/40-NET RETURN
40.60% 50.40% 46.90% 100.00% 70.00% 0.00% Sum of the notionals of
the derivatives
* Invesco Global Asset Management DAC monitors for the Relative VaR that the portfolio VaR / (2* Reference portfolio VaR) is not greater than 100%. Market Price Risk Market risk arises mainly from the uncertainty about future prices of financial instruments held. It represents the potential loss the Funds might suffer through holding market positions in the face of price movements. The Manager meets regularly to consider the asset allocation of the portfolio in order to minimise the risk associated with particular countries or industry sectors whilst continuing to follow the investment objective. An individual Fund Manager has responsibility for monitoring the existing portfolio selected in accordance with the overall asset allocation described above and seeks to ensure individual stocks also meet the risk reward profile that is acceptable. The Manager does not use derivative instruments, with the exception of forwards, to hedge the investment portfolio against market risk, as in their opinion the cost of such a process would result in an unacceptable reduction in the potential for capital growth. As the majority of the Funds’ financial instruments are carried at fair value with fair value changes recognised in the Income Statement, all changes in market conditions will directly affect net investment income. All securities investments present a risk of loss of capital. The Investment Adviser (“Invesco Hong Kong Limited” for Invesco Korean Equity Fund and Invesco PRC Equity Fund and “Invesco Global Asset Management DAC” for Invesco Emerging Markets Equity Fund) moderates this risk through careful selection of securities and other financial instruments with specified limits. These limits are defined in the Investment Objectives and Policies shown on pages 1 and 2. The Funds’ overall market positions are monitored on a daily basis by the Funds’ Investment Adviser. The Investment Risk Manager reviews Fund performance daily and reports to the Board of Directors of the Manager quarterly. The Manager reviews the VaR of the Funds as a way to manage market price risk. Interest Rate Risk The majority of the Funds’ financial assets and liabilities are non interest bearing. As a result, the Funds are not subject to significant amounts of risk due to fluctuations in the prevailing levels of market interest rates. Any excess cash & cash equivalents are invested at short term market interest rates. Any bank overdraft held by the Fund may be subject to interest rate risk. The Manager reviews the VaR of the Funds as a way to manage interest rate risk. Foreign Currency Risk The Funds hold assets denominated in currencies other than the functional currency. They are therefore exposed to currency risk, as the value of the securities denominated in other currencies will fluctuate due to changes in exchange rates. The Funds receive income in currencies other than functional currency and the functional currency values of this income can be affected by movements in exchange rates. The Funds convert all receipts of income into functional currency on or near date of receipt. The Investment Adviser monitors the Funds’ foreign currency exposure on a daily basis. The Board of Directors of the Manager reviews the Funds foreign exchange exposure on a quarterly basis.
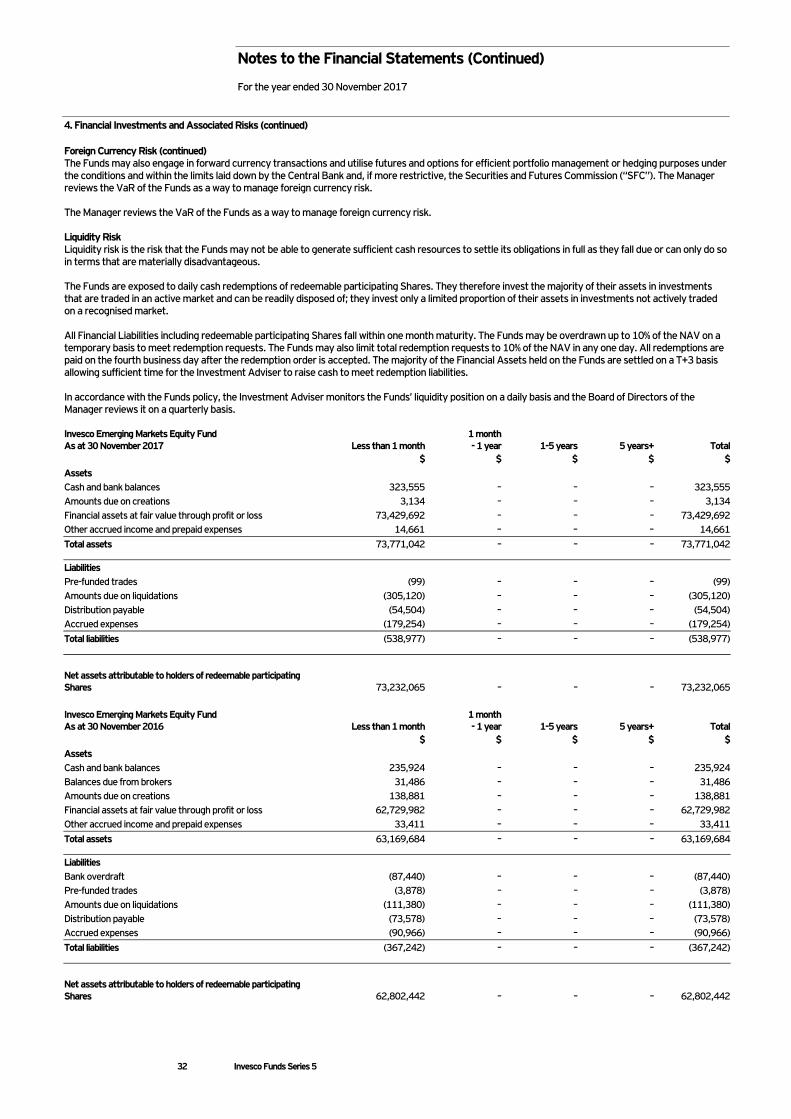
Notes to the Financial Statements (Continued) For the year ended 30 November 2017
32 Invesco Funds Series 5
4. Financial Investments and Associated Risks (continued) Foreign Currency Risk (continued) The Funds may also engage in forward currency transactions and utilise futures and options for efficient portfolio management or hedging purposes under the conditions and within the limits laid down by the Central Bank and, if more restrictive, the Securities and Futures Commission (“SFC”). The Manager reviews the VaR of the Funds as a way to manage foreign currency risk. The Manager reviews the VaR of the Funds as a way to manage foreign currency risk. Liquidity Risk Liquidity risk is the risk that the Funds may not be able to generate sufficient cash resources to settle its obligations in full as they fall due or can only do so in terms that are materially disadvantageous. The Funds are exposed to daily cash redemptions of redeemable participating Shares. They therefore invest the majority of their assets in investments that are traded in an active market and can be readily disposed of; they invest only a limited proportion of their assets in investments not actively traded on a recognised market. All Financial Liabilities including redeemable participating Shares fall within one month maturity. The Funds may be overdrawn up to 10% of the NAV on a temporary basis to meet redemption requests. The Funds may also limit total redemption requests to 10% of the NAV in any one day. All redemptions are paid on the fourth business day after the redemption order is accepted. The majority of the Financial Assets held on the Funds are settled on a T+3 basis allowing sufficient time for the Investment Adviser to raise cash to meet redemption liabilities. In accordance with the Funds policy, the Investment Adviser monitors the Funds’ liquidity position on a daily basis and the Board of Directors of the Manager reviews it on a quarterly basis. Invesco Emerging Markets Equity Fund As at 30 November 2017 Less than 1 month
1 month - 1 year 1-5 years 5 years+ Total
$ $ $ $ $ Assets Cash and bank balances 323,555 – – – 323,555 Amounts due on creations 3,134 – – – 3,134 Financial assets at fair value through profit or loss 73,429,692 – – – 73,429,692 Other accrued income and prepaid expenses 14,661 – – – 14,661 Total assets 73,771,042 – – – 73,771,042
Liabilities Pre-funded trades (99) – – – (99) Amounts due on liquidations (305,120) – – – (305,120) Distribution payable (54,504) – – – (54,504) Accrued expenses (179,254) – – – (179,254) Total liabilities (538,977) – – – (538,977)
Net assets attributable to holders of redeemable participating Shares 73,232,065 – – – 73,232,065 Invesco Emerging Markets Equity Fund As at 30 November 2016 Less than 1 month
1 month - 1 year 1-5 years 5 years+ Total
$ $ $ $ $ Assets Cash and bank balances 235,924 – – – 235,924 Balances due from brokers 31,486 – – – 31,486 Amounts due on creations 138,881 – – – 138,881 Financial assets at fair value through profit or loss 62,729,982 – – – 62,729,982 Other accrued income and prepaid expenses 33,411 – – – 33,411 Total assets 63,169,684 – – – 63,169,684
Liabilities Bank overdraft (87,440) – – – (87,440) Pre-funded trades (3,878) – – – (3,878) Amounts due on liquidations (111,380) – – – (111,380) Distribution payable (73,578) – – – (73,578) Accrued expenses (90,966) – – – (90,966) Total liabilities (367,242) – – – (367,242)
Net assets attributable to holders of redeemable participating Shares 62,802,442 – – – 62,802,442
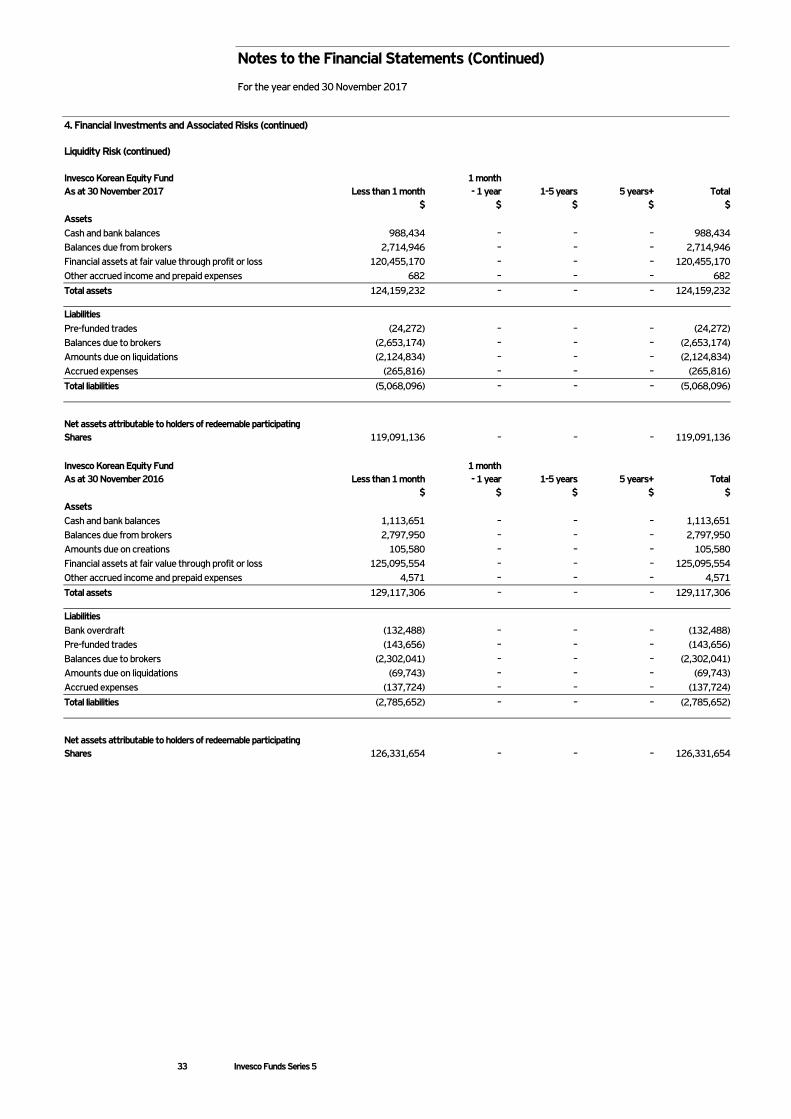
Notes to the Financial Statements (Continued) For the year ended 30 November 2017
33 Invesco Funds Series 5
4. Financial Investments and Associated Risks (continued) Liquidity Risk (continued) Invesco Korean Equity Fund As at 30 November 2017 Less than 1 month
1 month - 1 year 1-5 years 5 years+ Total
$ $ $ $ $ Assets Cash and bank balances 988,434 – – – 988,434 Balances due from brokers 2,714,946 – – – 2,714,946 Financial assets at fair value through profit or loss 120,455,170 – – – 120,455,170 Other accrued income and prepaid expenses 682 – – – 682 Total assets 124,159,232 – – – 124,159,232
Liabilities Pre-funded trades (24,272) – – – (24,272) Balances due to brokers (2,653,174) – – – (2,653,174) Amounts due on liquidations (2,124,834) – – – (2,124,834) Accrued expenses (265,816) – – – (265,816) Total liabilities (5,068,096) – – – (5,068,096)
Net assets attributable to holders of redeemable participating Shares 119,091,136 – – – 119,091,136 Invesco Korean Equity Fund As at 30 November 2016 Less than 1 month
1 month - 1 year 1-5 years 5 years+ Total
$ $ $ $ $ Assets Cash and bank balances 1,113,651 – – – 1,113,651 Balances due from brokers 2,797,950 – – – 2,797,950 Amounts due on creations 105,580 – – – 105,580 Financial assets at fair value through profit or loss 125,095,554 – – – 125,095,554 Other accrued income and prepaid expenses 4,571 – – – 4,571 Total assets 129,117,306 – – – 129,117,306
Liabilities Bank overdraft (132,488) – – – (132,488) Pre-funded trades (143,656) – – – (143,656) Balances due to brokers (2,302,041) – – – (2,302,041) Amounts due on liquidations (69,743) – – – (69,743) Accrued expenses (137,724) – – – (137,724) Total liabilities (2,785,652) – – – (2,785,652)
Net assets attributable to holders of redeemable participating Shares 126,331,654 – – – 126,331,654
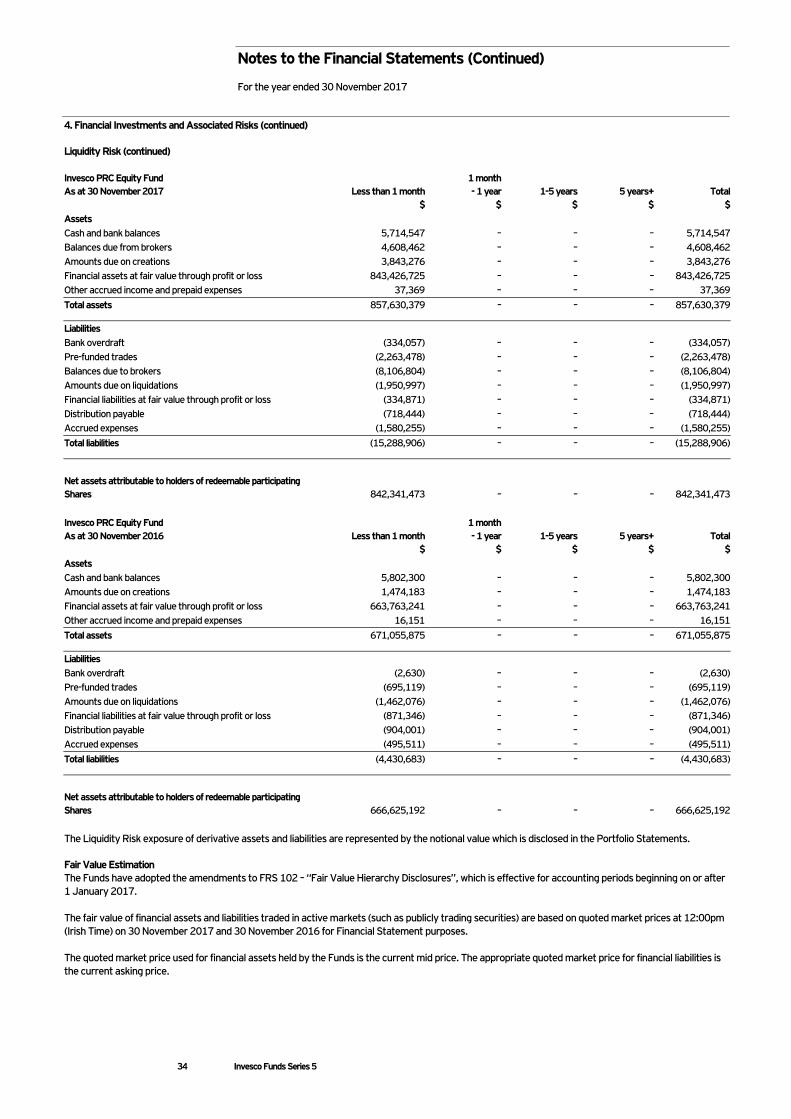
Notes to the Financial Statements (Continued) For the year ended 30 November 2017
34 Invesco Funds Series 5
4. Financial Investments and Associated Risks (continued) Liquidity Risk (continued) Invesco PRC Equity Fund As at 30 November 2017 Less than 1 month
1 month - 1 year 1-5 years 5 years+ Total
$ $ $ $ $ Assets Cash and bank balances 5,714,547 – – – 5,714,547 Balances due from brokers 4,608,462 – – – 4,608,462 Amounts due on creations 3,843,276 – – – 3,843,276 Financial assets at fair value through profit or loss 843,426,725 – – – 843,426,725 Other accrued income and prepaid expenses 37,369 – – – 37,369 Total assets 857,630,379 – – – 857,630,379
Liabilities Bank overdraft (334,057) – – – (334,057) Pre-funded trades (2,263,478) – – – (2,263,478) Balances due to brokers (8,106,804) – – – (8,106,804) Amounts due on liquidations (1,950,997) – – – (1,950,997) Financial liabilities at fair value through profit or loss (334,871) – – – (334,871) Distribution payable (718,444) – – – (718,444) Accrued expenses (1,580,255) – – – (1,580,255) Total liabilities (15,288,906) – – – (15,288,906)
Net assets attributable to holders of redeemable participating Shares 842,341,473 – – – 842,341,473 Invesco PRC Equity Fund As at 30 November 2016 Less than 1 month
1 month - 1 year 1-5 years 5 years+ Total
$ $ $ $ $ Assets Cash and bank balances 5,802,300 – – – 5,802,300 Amounts due on creations 1,474,183 – – – 1,474,183 Financial assets at fair value through profit or loss 663,763,241 – – – 663,763,241 Other accrued income and prepaid expenses 16,151 – – – 16,151 Total assets 671,055,875 – – – 671,055,875
Liabilities Bank overdraft (2,630) – – – (2,630) Pre-funded trades (695,119) – – – (695,119) Amounts due on liquidations (1,462,076) – – – (1,462,076) Financial liabilities at fair value through profit or loss (871,346) – – – (871,346) Distribution payable (904,001) – – – (904,001) Accrued expenses (495,511) – – – (495,511) Total liabilities (4,430,683) – – – (4,430,683)
Net assets attributable to holders of redeemable participating Shares 666,625,192 – – – 666,625,192 The Liquidity Risk exposure of derivative assets and liabilities are represented by the notional value which is disclosed in the Portfolio Statements. Fair Value Estimation The Funds have adopted the amendments to FRS 102 – “Fair Value Hierarchy Disclosures”, which is effective for accounting periods beginning on or after 1 January 2017. The fair value of financial assets and liabilities traded in active markets (such as publicly trading securities) are based on quoted market prices at 12:00pm (Irish Time) on 30 November 2017 and 30 November 2016 for Financial Statement purposes. The quoted market price used for financial assets held by the Funds is the current mid price. The appropriate quoted market price for financial liabilities is the current asking price.
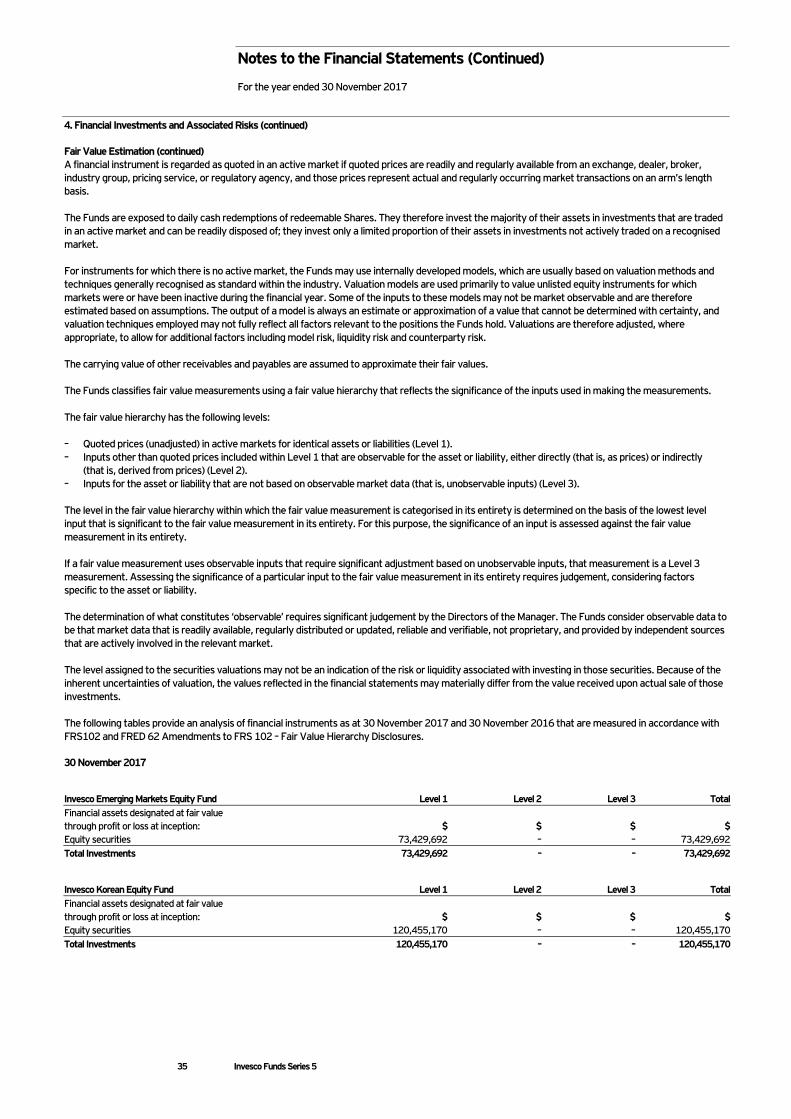
Notes to the Financial Statements (Continued) For the year ended 30 November 2017
35 Invesco Funds Series 5
4. Financial Investments and Associated Risks (continued) Fair Value Estimation (continued) A financial instrument is regarded as quoted in an active market if quoted prices are readily and regularly available from an exchange, dealer, broker, industry group, pricing service, or regulatory agency, and those prices represent actual and regularly occurring market transactions on an arm’s length basis. The Funds are exposed to daily cash redemptions of redeemable Shares. They therefore invest the majority of their assets in investments that are traded in an active market and can be readily disposed of; they invest only a limited proportion of their assets in investments not actively traded on a recognised market. For instruments for which there is no active market, the Funds may use internally developed models, which are usually based on valuation methods and techniques generally recognised as standard within the industry. Valuation models are used primarily to value unlisted equity instruments for which markets were or have been inactive during the financial year. Some of the inputs to these models may not be market observable and are therefore estimated based on assumptions. The output of a model is always an estimate or approximation of a value that cannot be determined with certainty, and valuation techniques employed may not fully reflect all factors relevant to the positions the Funds hold. Valuations are therefore adjusted, where appropriate, to allow for additional factors including model risk, liquidity risk and counterparty risk. The carrying value of other receivables and payables are assumed to approximate their fair values. The Funds classifies fair value measurements using a fair value hierarchy that reflects the significance of the inputs used in making the measurements. The fair value hierarchy has the following levels: – Quoted prices (unadjusted) in active markets for identical assets or liabilities (Level 1). – Inputs other than quoted prices included within Level 1 that are observable for the asset or liability, either directly (that is, as prices) or indirectly
(that is, derived from prices) (Level 2). – Inputs for the asset or liability that are not based on observable market data (that is, unobservable inputs) (Level 3). The level in the fair value hierarchy within which the fair value measurement is categorised in its entirety is determined on the basis of the lowest level input that is significant to the fair value measurement in its entirety. For this purpose, the significance of an input is assessed against the fair value measurement in its entirety. If a fair value measurement uses observable inputs that require significant adjustment based on unobservable inputs, that measurement is a Level 3 measurement. Assessing the significance of a particular input to the fair value measurement in its entirety requires judgement, considering factors specific to the asset or liability. The determination of what constitutes ‘observable’ requires significant judgement by the Directors of the Manager. The Funds consider observable data to be that market data that is readily available, regularly distributed or updated, reliable and verifiable, not proprietary, and provided by independent sources that are actively involved in the relevant market. The level assigned to the securities valuations may not be an indication of the risk or liquidity associated with investing in those securities. Because of the inherent uncertainties of valuation, the values reflected in the financial statements may materially differ from the value received upon actual sale of those investments. The following tables provide an analysis of financial instruments as at 30 November 2017 and 30 November 2016 that are measured in accordance with FRS102 and FRED 62 Amendments to FRS 102 – Fair Value Hierarchy Disclosures. 30 November 2017
Invesco Emerging Markets Equity Fund Level 1 Level 2 Level 3 Total Financial assets designated at fair value through profit or loss at inception: $ $ $ $ Equity securities 73,429,692 – – 73,429,692 Total Investments 73,429,692 – – 73,429,692
Invesco Korean Equity Fund Level 1 Level 2 Level 3 Total Financial assets designated at fair value through profit or loss at inception: $ $ $ $ Equity securities 120,455,170 – – 120,455,170 Total Investments 120,455,170 – – 120,455,170
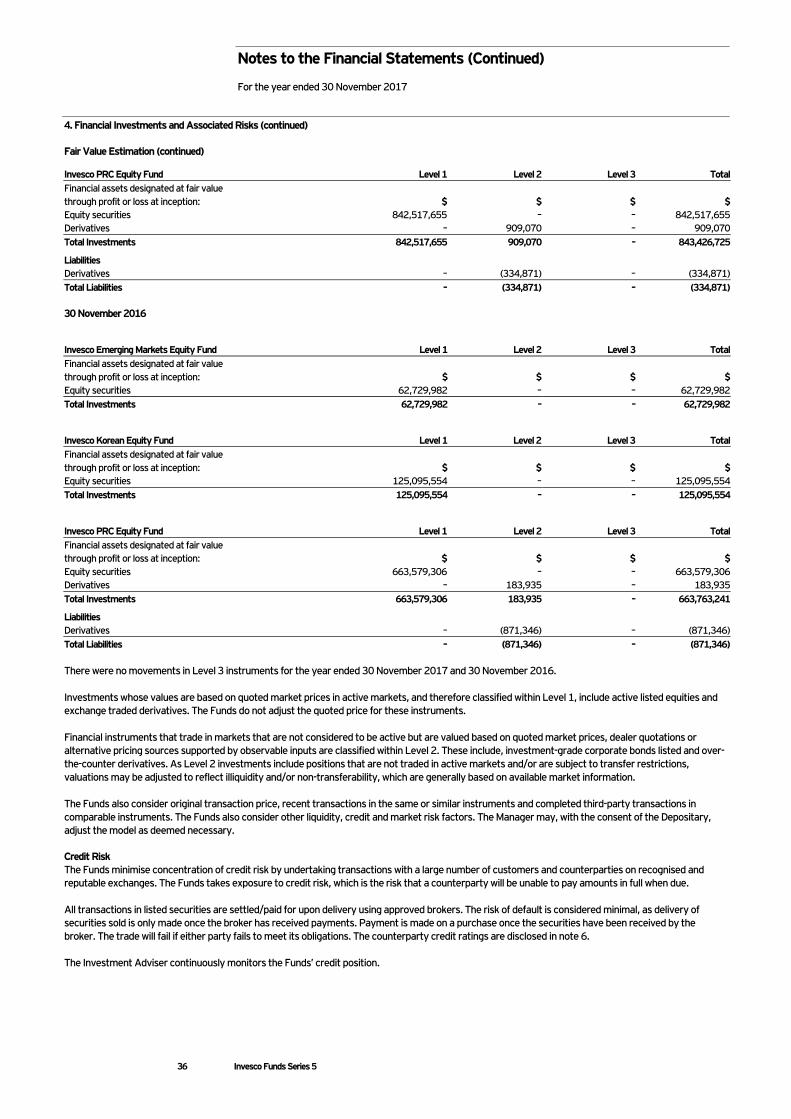
Notes to the Financial Statements (Continued) For the year ended 30 November 2017
36 Invesco Funds Series 5
4. Financial Investments and Associated Risks (continued) Fair Value Estimation (continued)
Invesco PRC Equity Fund Level 1 Level 2 Level 3 Total Financial assets designated at fair value through profit or loss at inception: $ $ $ $ Equity securities 842,517,655 – – 842,517,655 Derivatives – 909,070 – 909,070 Total Investments 842,517,655 909,070 – 843,426,725
Liabilities Derivatives – (334,871) – (334,871) Total Liabilities – (334,871) – (334,871) 30 November 2016
Invesco Emerging Markets Equity Fund Level 1 Level 2 Level 3 Total Financial assets designated at fair value through profit or loss at inception: $ $ $ $ Equity securities 62,729,982 – – 62,729,982 Total Investments 62,729,982 – – 62,729,982
Invesco Korean Equity Fund Level 1 Level 2 Level 3 Total Financial assets designated at fair value through profit or loss at inception: $ $ $ $ Equity securities 125,095,554 – – 125,095,554 Total Investments 125,095,554 – – 125,095,554
Invesco PRC Equity Fund Level 1 Level 2 Level 3 Total Financial assets designated at fair value through profit or loss at inception: $ $ $ $ Equity securities 663,579,306 – – 663,579,306 Derivatives – 183,935 – 183,935 Total Investments 663,579,306 183,935 – 663,763,241
Liabilities Derivatives – (871,346) – (871,346) Total Liabilities – (871,346) – (871,346) There were no movements in Level 3 instruments for the year ended 30 November 2017 and 30 November 2016. Investments whose values are based on quoted market prices in active markets, and therefore classified within Level 1, include active listed equities and exchange traded derivatives. The Funds do not adjust the quoted price for these instruments. Financial instruments that trade in markets that are not considered to be active but are valued based on quoted market prices, dealer quotations or alternative pricing sources supported by observable inputs are classified within Level 2. These include, investment-grade corporate bonds listed and over-the-counter derivatives. As Level 2 investments include positions that are not traded in active markets and/or are subject to transfer restrictions, valuations may be adjusted to reflect illiquidity and/or non-transferability, which are generally based on available market information. The Funds also consider original transaction price, recent transactions in the same or similar instruments and completed third-party transactions in comparable instruments. The Funds also consider other liquidity, credit and market risk factors. The Manager may, with the consent of the Depositary, adjust the model as deemed necessary. Credit Risk The Funds minimise concentration of credit risk by undertaking transactions with a large number of customers and counterparties on recognised and reputable exchanges. The Funds takes exposure to credit risk, which is the risk that a counterparty will be unable to pay amounts in full when due. All transactions in listed securities are settled/paid for upon delivery using approved brokers. The risk of default is considered minimal, as delivery of securities sold is only made once the broker has received payments. Payment is made on a purchase once the securities have been received by the broker. The trade will fail if either party fails to meet its obligations. The counterparty credit ratings are disclosed in note 6. The Investment Adviser continuously monitors the Funds’ credit position.
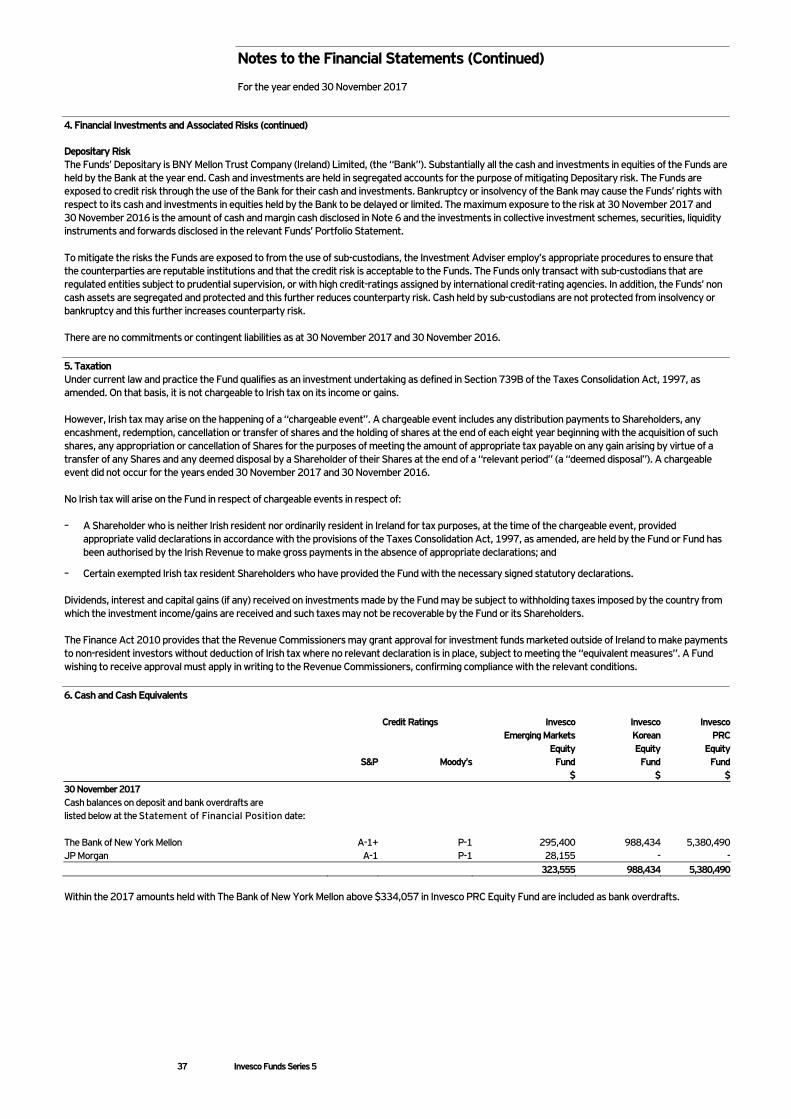
Notes to the Financial Statements (Continued) For the year ended 30 November 2017
37 Invesco Funds Series 5
4. Financial Investments and Associated Risks (continued) Depositary Risk The Funds’ Depositary is BNY Mellon Trust Company (Ireland) Limited, (the “Bank”). Substantially all the cash and investments in equities of the Funds are held by the Bank at the year end. Cash and investments are held in segregated accounts for the purpose of mitigating Depositary risk. The Funds are exposed to credit risk through the use of the Bank for their cash and investments. Bankruptcy or insolvency of the Bank may cause the Funds’ rights with respect to its cash and investments in equities held by the Bank to be delayed or limited. The maximum exposure to the risk at 30 November 2017 and 30 November 2016 is the amount of cash and margin cash disclosed in Note 6 and the investments in collective investment schemes, securities, liquidity instruments and forwards disclosed in the relevant Funds’ Portfolio Statement. To mitigate the risks the Funds are exposed to from the use of sub-custodians, the Investment Adviser employ’s appropriate procedures to ensure that the counterparties are reputable institutions and that the credit risk is acceptable to the Funds. The Funds only transact with sub-custodians that are regulated entities subject to prudential supervision, or with high credit-ratings assigned by international credit-rating agencies. In addition, the Funds’ non cash assets are segregated and protected and this further reduces counterparty risk. Cash held by sub-custodians are not protected from insolvency or bankruptcy and this further increases counterparty risk. There are no commitments or contingent liabilities as at 30 November 2017 and 30 November 2016. 5. Taxation Under current law and practice the Fund qualifies as an investment undertaking as defined in Section 739B of the Taxes Consolidation Act, 1997, as amended. On that basis, it is not chargeable to Irish tax on its income or gains. However, Irish tax may arise on the happening of a “chargeable event”. A chargeable event includes any distribution payments to Shareholders, any encashment, redemption, cancellation or transfer of shares and the holding of shares at the end of each eight year beginning with the acquisition of such shares, any appropriation or cancellation of Shares for the purposes of meeting the amount of appropriate tax payable on any gain arising by virtue of a transfer of any Shares and any deemed disposal by a Shareholder of their Shares at the end of a “relevant period” (a “deemed disposal”). A chargeable event did not occur for the years ended 30 November 2017 and 30 November 2016. No Irish tax will arise on the Fund in respect of chargeable events in respect of: – A Shareholder who is neither Irish resident nor ordinarily resident in Ireland for tax purposes, at the time of the chargeable event, provided
appropriate valid declarations in accordance with the provisions of the Taxes Consolidation Act, 1997, as amended, are held by the Fund or Fund has been authorised by the Irish Revenue to make gross payments in the absence of appropriate declarations; and
– Certain exempted Irish tax resident Shareholders who have provided the Fund with the necessary signed statutory declarations. Dividends, interest and capital gains (if any) received on investments made by the Fund may be subject to withholding taxes imposed by the country from which the investment income/gains are received and such taxes may not be recoverable by the Fund or its Shareholders. The Finance Act 2010 provides that the Revenue Commissioners may grant approval for investment funds marketed outside of Ireland to make payments to non-resident investors without deduction of Irish tax where no relevant declaration is in place, subject to meeting the “equivalent measures”. A Fund wishing to receive approval must apply in writing to the Revenue Commissioners, confirming compliance with the relevant conditions. 6. Cash and Cash Equivalents Credit Ratings Invesco
Emerging Markets Invesco Korean
Invesco PRC
Equity Equity Equity S&P Moody’s Fund Fund Fund $ $ $ 30 November 2017 Cash balances on deposit and bank overdrafts are listed below at the Statement of Financial Position date: The Bank of New York Mellon A-1+ P-1 295,400 988,434 5,380,490 JP Morgan A-1 P-1 28,155 - - 323,555 988,434 5,380,490 Within the 2017 amounts held with The Bank of New York Mellon above $334,057 in Invesco PRC Equity Fund are included as bank overdrafts.
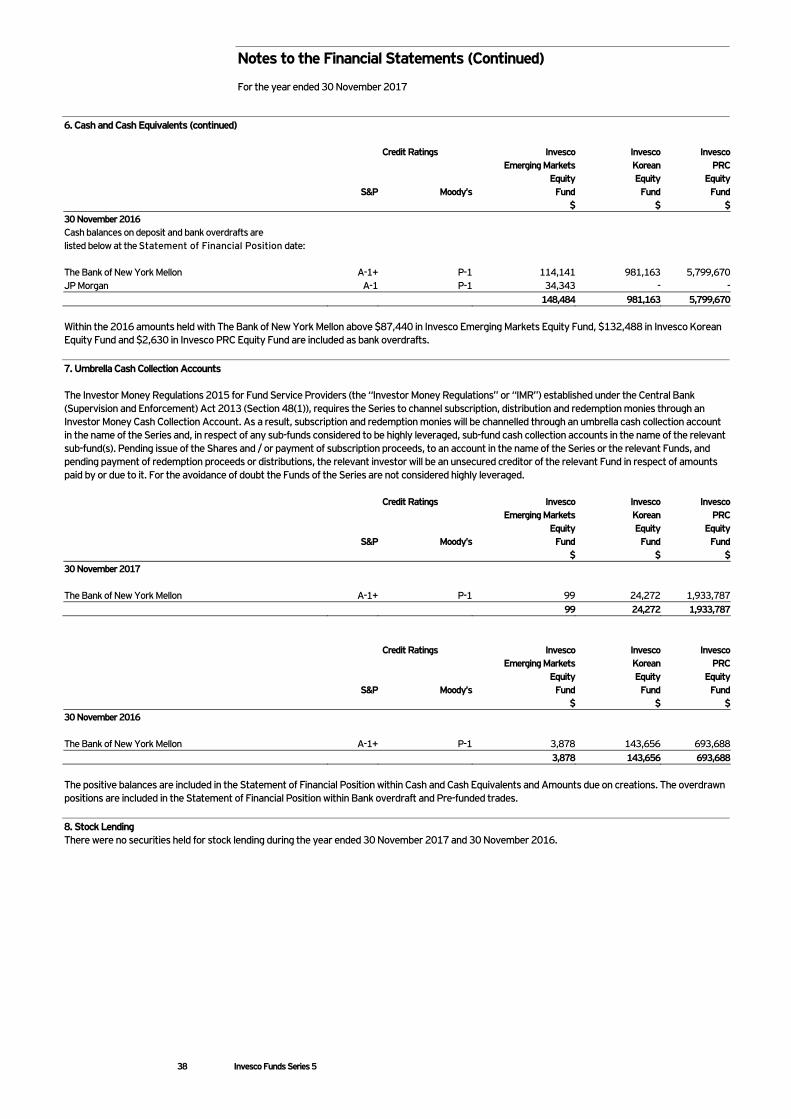
Notes to the Financial Statements (Continued) For the year ended 30 November 2017
38 Invesco Funds Series 5
6. Cash and Cash Equivalents (continued) Credit Ratings Invesco
Emerging Markets Invesco Korean
Invesco PRC
Equity Equity Equity S&P Moody’s Fund Fund Fund $ $ $ 30 November 2016 Cash balances on deposit and bank overdrafts are listed below at the Statement of Financial Position date: The Bank of New York Mellon A-1+ P-1 114,141 981,163 5,799,670 JP Morgan A-1 P-1 34,343 - - 148,484 981,163 5,799,670 Within the 2016 amounts held with The Bank of New York Mellon above $87,440 in Invesco Emerging Markets Equity Fund, $132,488 in Invesco Korean Equity Fund and $2,630 in Invesco PRC Equity Fund are included as bank overdrafts. 7. Umbrella Cash Collection Accounts The Investor Money Regulations 2015 for Fund Service Providers (the “Investor Money Regulations” or “IMR”) established under the Central Bank (Supervision and Enforcement) Act 2013 (Section 48(1)), requires the Series to channel subscription, distribution and redemption monies through an Investor Money Cash Collection Account. As a result, subscription and redemption monies will be channelled through an umbrella cash collection account in the name of the Series and, in respect of any sub-funds considered to be highly leveraged, sub-fund cash collection accounts in the name of the relevant sub-fund(s). Pending issue of the Shares and / or payment of subscription proceeds, to an account in the name of the Series or the relevant Funds, and pending payment of redemption proceeds or distributions, the relevant investor will be an unsecured creditor of the relevant Fund in respect of amounts paid by or due to it. For the avoidance of doubt the Funds of the Series are not considered highly leveraged. Credit Ratings Invesco
Emerging Markets Invesco Korean
Invesco PRC
Equity Equity Equity S&P Moody’s Fund Fund Fund $ $ $ 30 November 2017 The Bank of New York Mellon A-1+ P-1 99 24,272 1,933,787 99 24,272 1,933,787 Credit Ratings Invesco
Emerging Markets Invesco Korean
Invesco PRC
Equity Equity Equity S&P Moody’s Fund Fund Fund $ $ $ 30 November 2016 The Bank of New York Mellon A-1+ P-1 3,878 143,656 693,688 3,878 143,656 693,688 The positive balances are included in the Statement of Financial Position within Cash and Cash Equivalents and Amounts due on creations. The overdrawn positions are included in the Statement of Financial Position within Bank overdraft and Pre-funded trades. 8. Stock Lending There were no securities held for stock lending during the year ended 30 November 2017 and 30 November 2016.
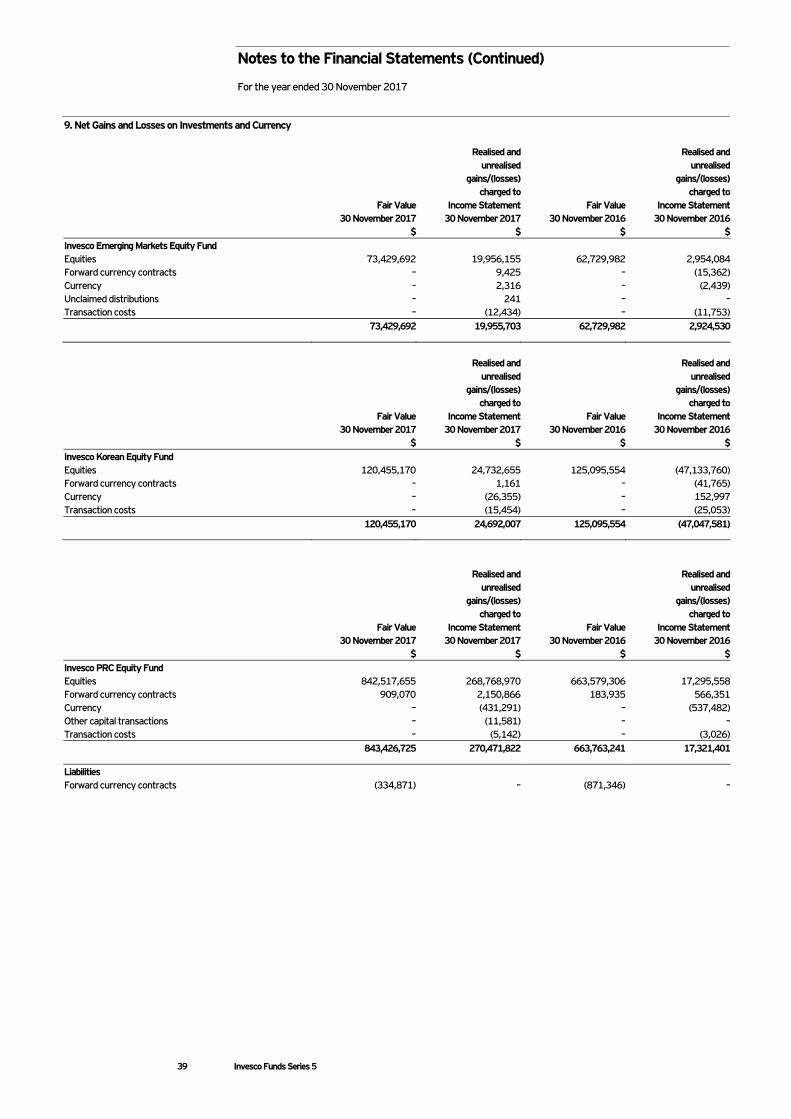
Notes to the Financial Statements (Continued) For the year ended 30 November 2017
39 Invesco Funds Series 5
9. Net Gains and Losses on Investments and Currency
Fair Value 30 November 2017
$
Realised and unrealised
gains/(losses) charged to
Income Statement 30 November 2017
$
Fair Value 30 November 2016
$
Realised and unrealised
gains/(losses) charged to
Income Statement 30 November 2016
$ Invesco Emerging Markets Equity Fund Equities 73,429,692 19,956,155 62,729,982 2,954,084 Forward currency contracts – 9,425 – (15,362) Currency – 2,316 – (2,439) Unclaimed distributions – 241 – – Transaction costs – (12,434) – (11,753) 73,429,692 19,955,703 62,729,982 2,924,530
Fair Value 30 November 2017
$
Realised and unrealised
gains/(losses) charged to
Income Statement 30 November 2017
$
Fair Value 30 November 2016
$
Realised and unrealised
gains/(losses) charged to
Income Statement 30 November 2016
$ Invesco Korean Equity Fund Equities 120,455,170 24,732,655 125,095,554 (47,133,760) Forward currency contracts – 1,161 – (41,765) Currency – (26,355) – 152,997 Transaction costs – (15,454) – (25,053) 120,455,170 24,692,007 125,095,554 (47,047,581)
Fair Value 30 November 2017
$
Realised and unrealised
gains/(losses) charged to
Income Statement 30 November 2017
$
Fair Value 30 November 2016
$
Realised and unrealised
gains/(losses) charged to
Income Statement 30 November 2016
$ Invesco PRC Equity Fund Equities 842,517,655 268,768,970 663,579,306 17,295,558 Forward currency contracts 909,070 2,150,866 183,935 566,351 Currency – (431,291) – (537,482) Other capital transactions – (11,581) – – Transaction costs – (5,142) – (3,026) 843,426,725 270,471,822 663,763,241 17,321,401
Liabilities Forward currency contracts (334,871) – (871,346) –
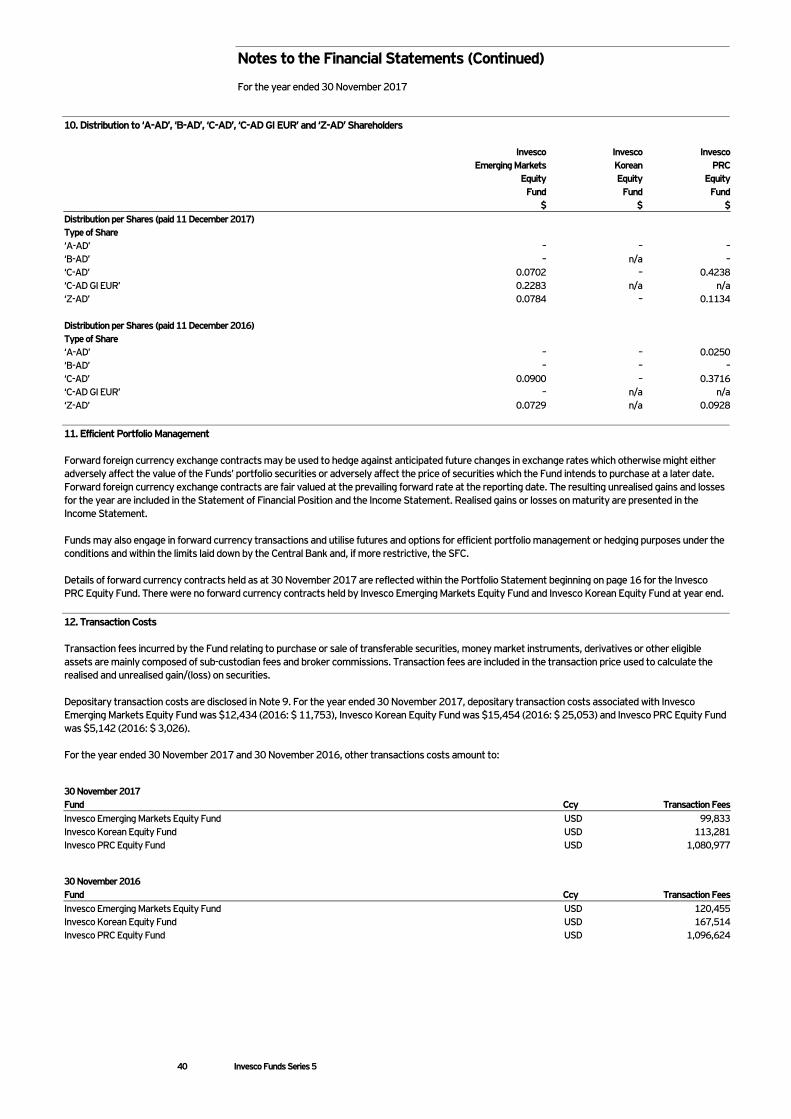
Notes to the Financial Statements (Continued) For the year ended 30 November 2017
40 Invesco Funds Series 5
10. Distribution to ‘A-AD’, ‘B-AD’, ‘C-AD’, ‘C-AD GI EUR’ and ‘Z-AD’ Shareholders Invesco
Emerging Markets Equity
Fund $
Invesco Korean Equity
Fund $
Invesco PRC
Equity Fund
$ Distribution per Shares (paid 11 December 2017) Type of Share ‘A-AD’ – – – ‘B-AD’ – n/a – ‘C-AD’ 0.0702 – 0.4238 ‘C-AD GI EUR’ 0.2283 n/a n/a ‘Z-AD’ 0.0784 – 0.1134 Distribution per Shares (paid 11 December 2016) Type of Share ‘A-AD’ – – 0.0250 ‘B-AD’ – – – ‘C-AD’ 0.0900 – 0.3716 ‘C-AD GI EUR’ – n/a n/a ‘Z-AD’ 0.0729 n/a 0.0928 11. Efficient Portfolio Management Forward foreign currency exchange contracts may be used to hedge against anticipated future changes in exchange rates which otherwise might either adversely affect the value of the Funds’ portfolio securities or adversely affect the price of securities which the Fund intends to purchase at a later date. Forward foreign currency exchange contracts are fair valued at the prevailing forward rate at the reporting date. The resulting unrealised gains and losses for the year are included in the Statement of Financial Position and the Income Statement. Realised gains or losses on maturity are presented in the Income Statement. Funds may also engage in forward currency transactions and utilise futures and options for efficient portfolio management or hedging purposes under the conditions and within the limits laid down by the Central Bank and, if more restrictive, the SFC. Details of forward currency contracts held as at 30 November 2017 are reflected within the Portfolio Statement beginning on page 16 for the Invesco PRC Equity Fund. There were no forward currency contracts held by Invesco Emerging Markets Equity Fund and Invesco Korean Equity Fund at year end. 12. Transaction Costs Transaction fees incurred by the Fund relating to purchase or sale of transferable securities, money market instruments, derivatives or other eligible assets are mainly composed of sub-custodian fees and broker commissions. Transaction fees are included in the transaction price used to calculate the realised and unrealised gain/(loss) on securities. Depositary transaction costs are disclosed in Note 9. For the year ended 30 November 2017, depositary transaction costs associated with Invesco Emerging Markets Equity Fund was $12,434 (2016: $ 11,753), Invesco Korean Equity Fund was $15,454 (2016: $ 25,053) and Invesco PRC Equity Fund was $5,142 (2016: $ 3,026). For the year ended 30 November 2017 and 30 November 2016, other transactions costs amount to:
30 November 2017 Fund
Ccy Transaction Fees
Invesco Emerging Markets Equity Fund USD 99,833 Invesco Korean Equity Fund USD 113,281 Invesco PRC Equity Fund USD 1,080,977
30 November 2016 Fund
Ccy Transaction Fees
Invesco Emerging Markets Equity Fund USD 120,455 Invesco Korean Equity Fund USD 167,514 Invesco PRC Equity Fund USD 1,096,624
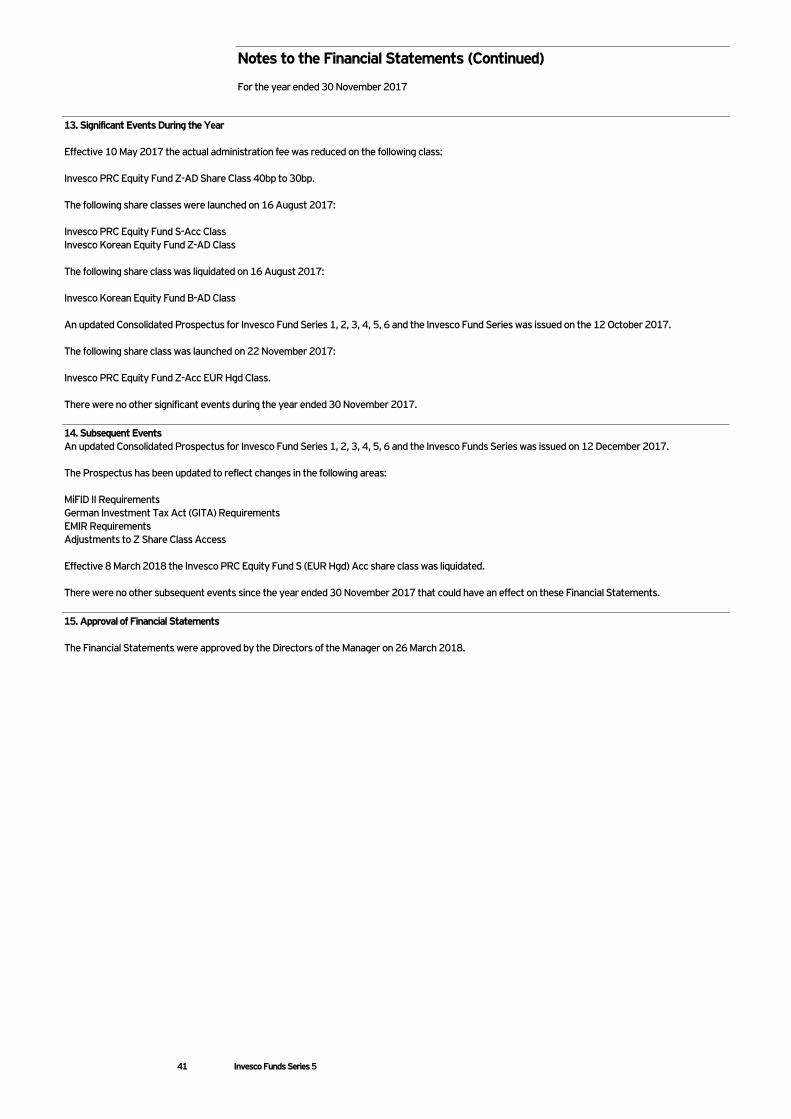
Notes to the Financial Statements (Continued) For the year ended 30 November 2017
41 Invesco Funds Series 5
13. Significant Events During the Year Effective 10 May 2017 the actual administration fee was reduced on the following class: Invesco PRC Equity Fund Z-AD Share Class 40bp to 30bp. The following share classes were launched on 16 August 2017: Invesco PRC Equity Fund S-Acc Class Invesco Korean Equity Fund Z-AD Class The following share class was liquidated on 16 August 2017: Invesco Korean Equity Fund B-AD Class An updated Consolidated Prospectus for Invesco Fund Series 1, 2, 3, 4, 5, 6 and the Invesco Fund Series was issued on the 12 October 2017. The following share class was launched on 22 November 2017: Invesco PRC Equity Fund Z-Acc EUR Hgd Class. There were no other significant events during the year ended 30 November 2017. 14. Subsequent Events An updated Consolidated Prospectus for Invesco Fund Series 1, 2, 3, 4, 5, 6 and the Invesco Funds Series was issued on 12 December 2017. The Prospectus has been updated to reflect changes in the following areas: MiFID II Requirements German Investment Tax Act (GITA) Requirements EMIR Requirements Adjustments to Z Share Class Access Effective 8 March 2018 the Invesco PRC Equity Fund S (EUR Hgd) Acc share class was liquidated. There were no other subsequent events since the year ended 30 November 2017 that could have an effect on these Financial Statements. 15. Approval of Financial Statements The Financial Statements were approved by the Directors of the Manager on 26 March 2018.
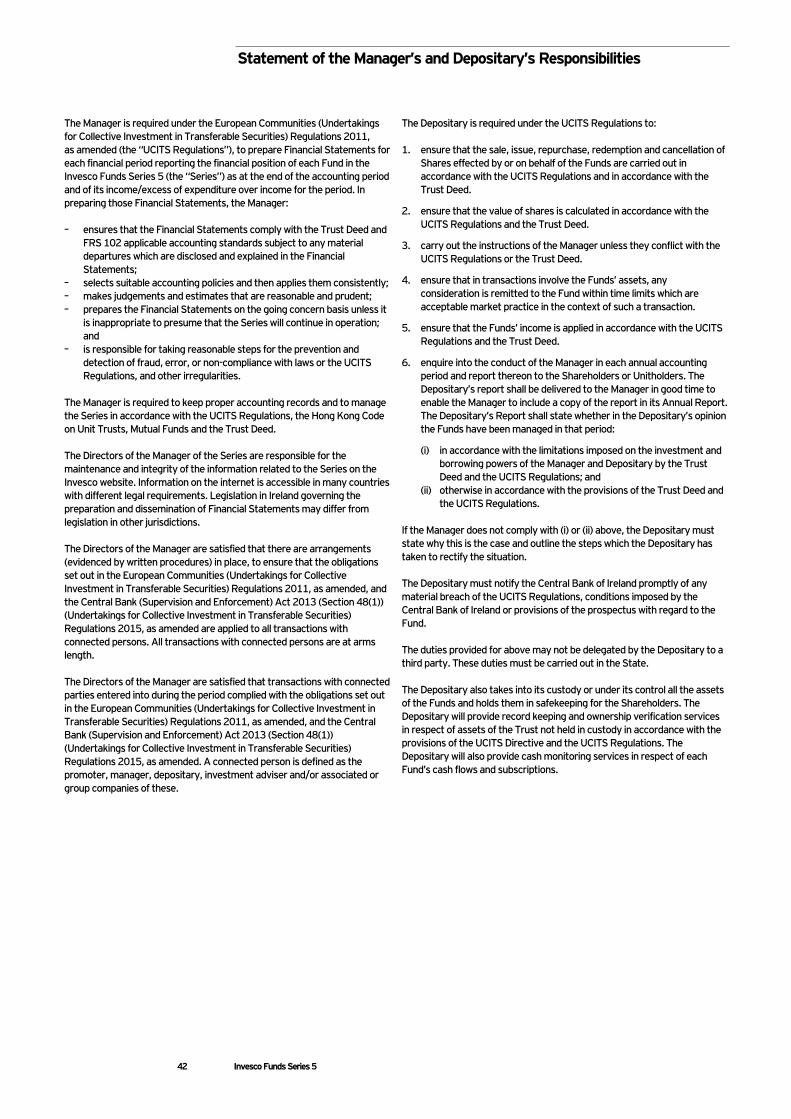
Statement of the Manager’s and Depositary’s Responsibilities
42 Invesco Funds Series 5
The Manager is required under the European Communities (Undertakings for Collective Investment in Transferable Securities) Regulations 2011, as amended (the “UCITS Regulations”), to prepare Financial Statements for each financial period reporting the financial position of each Fund in the Invesco Funds Series 5 (the “Series”) as at the end of the accounting period and of its income/excess of expenditure over income for the period. In preparing those Financial Statements, the Manager: – ensures that the Financial Statements comply with the Trust Deed and
FRS 102 applicable accounting standards subject to any material departures which are disclosed and explained in the Financial Statements;
– selects suitable accounting policies and then applies them consistently; – makes judgements and estimates that are reasonable and prudent; – prepares the Financial Statements on the going concern basis unless it
is inappropriate to presume that the Series will continue in operation; and
– is responsible for taking reasonable steps for the prevention and detection of fraud, error, or non-compliance with laws or the UCITS Regulations, and other irregularities.
The Manager is required to keep proper accounting records and to manage the Series in accordance with the UCITS Regulations, the Hong Kong Code on Unit Trusts, Mutual Funds and the Trust Deed. The Directors of the Manager of the Series are responsible for the maintenance and integrity of the information related to the Series on the Invesco website. Information on the internet is accessible in many countries with different legal requirements. Legislation in Ireland governing the preparation and dissemination of Financial Statements may differ from legislation in other jurisdictions. The Directors of the Manager are satisfied that there are arrangements (evidenced by written procedures) in place, to ensure that the obligations set out in the European Communities (Undertakings for Collective Investment in Transferable Securities) Regulations 2011, as amended, and the Central Bank (Supervision and Enforcement) Act 2013 (Section 48(1)) (Undertakings for Collective Investment in Transferable Securities) Regulations 2015, as amended are applied to all transactions with connected persons. All transactions with connected persons are at arms length. The Directors of the Manager are satisfied that transactions with connected parties entered into during the period complied with the obligations set out in the European Communities (Undertakings for Collective Investment in Transferable Securities) Regulations 2011, as amended, and the Central Bank (Supervision and Enforcement) Act 2013 (Section 48(1)) (Undertakings for Collective Investment in Transferable Securities) Regulations 2015, as amended. A connected person is defined as the promoter, manager, depositary, investment adviser and/or associated or group companies of these.
The Depositary is required under the UCITS Regulations to: 1. ensure that the sale, issue, repurchase, redemption and cancellation of
Shares effected by or on behalf of the Funds are carried out in accordance with the UCITS Regulations and in accordance with the Trust Deed.
2. ensure that the value of shares is calculated in accordance with the UCITS Regulations and the Trust Deed.
3. carry out the instructions of the Manager unless they conflict with the UCITS Regulations or the Trust Deed.
4. ensure that in transactions involve the Funds’ assets, any consideration is remitted to the Fund within time limits which are acceptable market practice in the context of such a transaction.
5. ensure that the Funds’ income is applied in accordance with the UCITS Regulations and the Trust Deed.
6. enquire into the conduct of the Manager in each annual accounting period and report thereon to the Shareholders or Unitholders. The Depositary’s report shall be delivered to the Manager in good time to enable the Manager to include a copy of the report in its Annual Report. The Depositary’s Report shall state whether in the Depositary’s opinion the Funds have been managed in that period:
(i) in accordance with the limitations imposed on the investment and borrowing powers of the Manager and Depositary by the Trust Deed and the UCITS Regulations; and
(ii) otherwise in accordance with the provisions of the Trust Deed and the UCITS Regulations.
If the Manager does not comply with (i) or (ii) above, the Depositary must state why this is the case and outline the steps which the Depositary has taken to rectify the situation. The Depositary must notify the Central Bank of Ireland promptly of any material breach of the UCITS Regulations, conditions imposed by the Central Bank of Ireland or provisions of the prospectus with regard to the Fund. The duties provided for above may not be delegated by the Depositary to a third party. These duties must be carried out in the State. The Depositary also takes into its custody or under its control all the assets of the Funds and holds them in safekeeping for the Shareholders. The Depositary will provide record keeping and ownership verification services in respect of assets of the Trust not held in custody in accordance with the provisions of the UCITS Directive and the UCITS Regulations. The Depositary will also provide cash monitoring services in respect of each Fund’s cash flows and subscriptions.
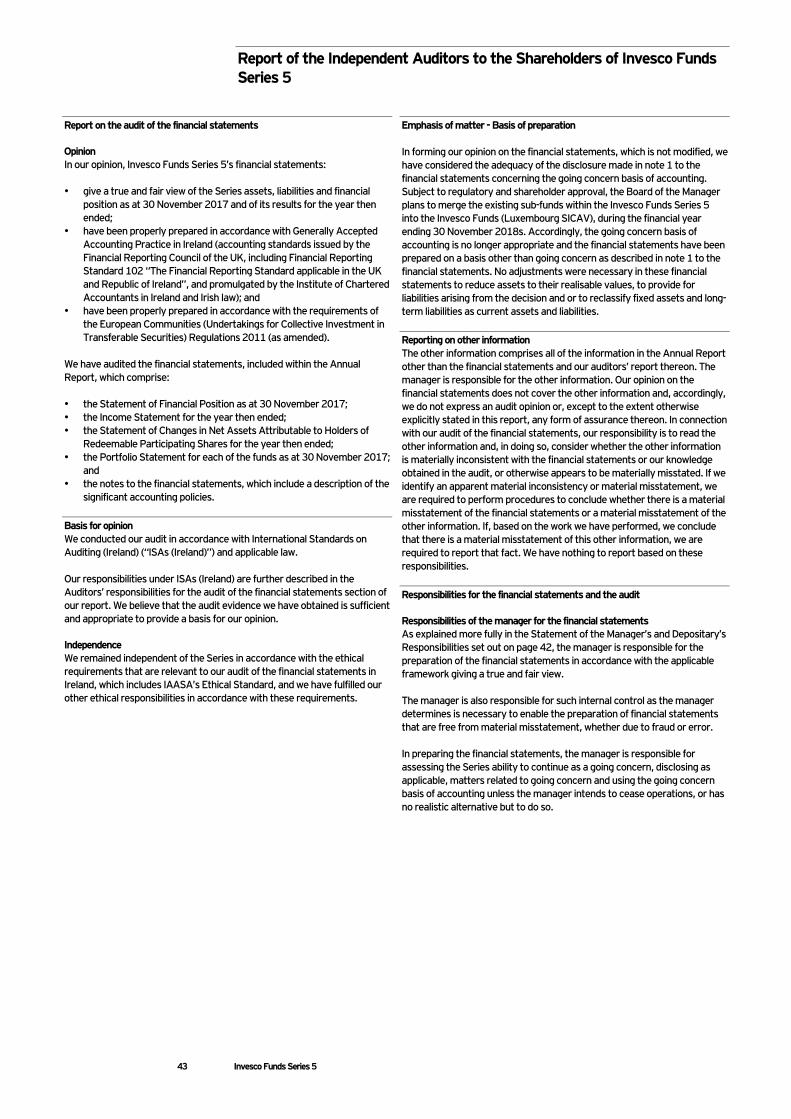
Report of the Independent Auditors to the Shareholders of Invesco Funds Series 5
43 Invesco Funds Series 5
Report on the audit of the financial statements Opinion In our opinion, Invesco Funds Series 5’s financial statements: • give a true and fair view of the Series assets, liabilities and financial
position as at 30 November 2017 and of its results for the year then ended;
• have been properly prepared in accordance with Generally Accepted Accounting Practice in Ireland (accounting standards issued by the Financial Reporting Council of the UK, including Financial Reporting Standard 102 “The Financial Reporting Standard applicable in the UK and Republic of Ireland”, and promulgated by the Institute of Chartered Accountants in Ireland and Irish law); and
• have been properly prepared in accordance with the requirements of the European Communities (Undertakings for Collective Investment in Transferable Securities) Regulations 2011 (as amended).
We have audited the financial statements, included within the Annual Report, which comprise: • the Statement of Financial Position as at 30 November 2017; • the Income Statement for the year then ended; • the Statement of Changes in Net Assets Attributable to Holders of
Redeemable Participating Shares for the year then ended; • the Portfolio Statement for each of the funds as at 30 November 2017;
and • the notes to the financial statements, which include a description of the
significant accounting policies. Basis for opinion We conducted our audit in accordance with International Standards on Auditing (Ireland) (“ISAs (Ireland)”) and applicable law. Our responsibilities under ISAs (Ireland) are further described in the Auditors’ responsibilities for the audit of the financial statements section of our report. We believe that the audit evidence we have obtained is sufficient and appropriate to provide a basis for our opinion. Independence We remained independent of the Series in accordance with the ethical requirements that are relevant to our audit of the financial statements in Ireland, which includes IAASA’s Ethical Standard, and we have fulfilled our other ethical responsibilities in accordance with these requirements.
Emphasis of matter - Basis of preparation In forming our opinion on the financial statements, which is not modified, we have considered the adequacy of the disclosure made in note 1 to the financial statements concerning the going concern basis of accounting. Subject to regulatory and shareholder approval, the Board of the Manager plans to merge the existing sub-funds within the Invesco Funds Series 5 into the Invesco Funds (Luxembourg SICAV), during the financial year ending 30 November 2018s. Accordingly, the going concern basis of accounting is no longer appropriate and the financial statements have been prepared on a basis other than going concern as described in note 1 to the financial statements. No adjustments were necessary in these financial statements to reduce assets to their realisable values, to provide for liabilities arising from the decision and or to reclassify fixed assets and long-term liabilities as current assets and liabilities. Reporting on other information The other information comprises all of the information in the Annual Report other than the financial statements and our auditors’ report thereon. The manager is responsible for the other information. Our opinion on the financial statements does not cover the other information and, accordingly, we do not express an audit opinion or, except to the extent otherwise explicitly stated in this report, any form of assurance thereon. In connection with our audit of the financial statements, our responsibility is to read the other information and, in doing so, consider whether the other information is materially inconsistent with the financial statements or our knowledge obtained in the audit, or otherwise appears to be materially misstated. If we identify an apparent material inconsistency or material misstatement, we are required to perform procedures to conclude whether there is a material misstatement of the financial statements or a material misstatement of the other information. If, based on the work we have performed, we conclude that there is a material misstatement of this other information, we are required to report that fact. We have nothing to report based on these responsibilities. Responsibilities for the financial statements and the audit Responsibilities of the manager for the financial statements As explained more fully in the Statement of the Manager’s and Depositary’s Responsibilities set out on page 42, the manager is responsible for the preparation of the financial statements in accordance with the applicable framework giving a true and fair view. The manager is also responsible for such internal control as the manager determines is necessary to enable the preparation of financial statements that are free from material misstatement, whether due to fraud or error. In preparing the financial statements, the manager is responsible for assessing the Series ability to continue as a going concern, disclosing as applicable, matters related to going concern and using the going concern basis of accounting unless the manager intends to cease operations, or has no realistic alternative but to do so.
Report of the Independent Auditors to the Shareholders of Invesco Funds Series 5 (Continued)
44 Invesco Funds Series 5
Responsibilities for the financial statements and the audit (continued) Auditors’ responsibilities for the audit of the financial statements Our objectives are to obtain reasonable assurance about whether the financial statements as a whole are free from material misstatement, whether due to fraud or error, and to issue an auditors’ report that includes our opinion. Reasonable assurance is a high level of assurance, but is not a guarantee that an audit conducted in accordance with ISAs (Ireland) will always detect a material misstatement when it exists. Misstatements can arise from fraud or error and are considered material if, individually or in the aggregate, they could reasonably be expected to influence the economic decisions of users taken on the basis of these financial statements. A further description of our responsibilities for the audit of the financial statements is located on the IAASA website at: https://www.iaasa.ie/getmedia/b2389013-1cf6-458b-9b8f-a98202dc9c3a/Description_of_auditors_responsibilities_for_audit.pdf. This description forms part of our auditors’ report. Use of this report This report, including the opinion, has been prepared for and only for the unitholders as a body in accordance with the European Communities (Undertakings for Collective Investment in Transferable Securities) Regulations 2011 (as amended) and for no other purpose. We do not, in giving this opinion, accept or assume responsibility for any other purpose or to any other person to whom this report is shown or into whose hands it may come save where expressly agreed by our prior consent in writing. PricewaterhouseCoopers Chartered Accountants and Registered Auditors Dublin Date: 26 March 2018
Report of the Depositary to the Unitholders
45 Invesco Funds Series 5
For the period from 1st December 2016 to 30th November 2017 (the “Year”) BNY Mellon Trust Company (Ireland) Limited (the “Depositary”, “us”, “we”, or “our”), has enquired into the conduct of the Manager in respect of the Invesco Funds Series 5 (the “Trust”) for the year, in our capacity as Depositary to the Trust. This report including the opinion has been prepared for and solely for the unitholders in the Trust, in accordance with our role as Depositary to the Trust and for no other purpose. We do not, in giving this opinion, accept or assume responsibility for any other purpose or to any other person to whom this report is shown. Responsibilities of the Depositary Our duties and responsibilities are outlined in Regulation 34 of the European Communities (Undertakings for Collective Investment in Transferable Securities) Regulations 2011, (S.I. No 352 of 2011), as amended (the “Regulations”). Our report shall state whether, in our opinion, the Manager has managed the Trust in that period, in accordance with the provisions of the Trusts’ constitutional documentation and the Regulations. It is the overall responsibility of the manager to comply with these provisions. If the Manager of the Trust has not done so, we as Depositary must state in what respects it has not done so and the steps which we have taken in respect thereof. Basis of Depositary Opinion The Depositary conducts such reviews as it, in its reasonable opinion, considers necessary in order to comply with its duties and to ensure that, in all material respects, the Manager has managed the Trust (i) in accordance with the limitations imposed on its investment and borrowing powers by the provisions of its constitutional documentation and appropriate regulations and (ii) otherwise in accordance with the Trusts’ constitutional documentation and appropriate regulations.
Opinion In our opinion, the management has managed the Trust during the year, in all material respects: (i) in accordance with the limitations imposed on the investment and borrowing powers of the Manager by the constitutional documentation and by the Regulations; and (ii) otherwise in accordance with the provisions of the constitutional documentation and the Regulations. For and on behalf of BNY Mellon Trust Company (Ireland) Limited One Dockland Central, Guild Street IFSC, Dublin 1, Ireland. Date: 26 March 2018
Additional Information (Unaudited)
46 Invesco Funds Series 5
Remuneration Policy The Manager (“Invesco Global Asset Management DAC”) has adopted a remuneration policy which is consistent with the remuneration principles applicable to UCITS managed funds. Its purpose is to ensure that the remuneration of the staff of the Manager is consistent with and promote sound and effective risk management, does not encourage risk-taking which is inconsistent with the risk profiles, rules or instruments of incorporation of itself and the UCITS it manages (including the Funds) and does not impair the Manager’s compliance with its duty to act in the best interests of the UCITS it manages. Further information is available in the Manager’s UCITS Remuneration Policy document which can be obtained from the website of the Manager (www.invescomanagementcompany.ie). A copy may be obtained, free of charge, at the registered office of the Manager. The rules require the Manager to disclose in the Fund’s annual report, certain quantitative disclosures concerning the Manager’s remuneration policy, including: • the total and aggregate amount of remuneration paid by the Manager to its staff (including any amounts paid directly by the Funds); • the number of beneficiaries; • a description of how the remuneration and benefits have been calculated; and • certain information regarding the Manager’s oversight of its remuneration policy and details of any changes to the Manager’s remuneration policies
since the previous annual report. However, as noted above, the revised policy has been in place for less than a full performance period. Consequently, in accordance with the relevant rules, the aforementioned disclosures are not included in this report as the available partial-year information would not provide materially relevant, reliable, comparable and clear information to investors. The Manager will disclose the quantitative UCITS remuneration data in the next annual report for the Funds where information for a full performance year will be available. As at 30 November 2017 and 30 November 2016, the aggregate value of securities on loan from the Funds and the value of collateral held by the Funds in respect of these securities was Nil. Securities Financing Transactions Regulation As at 30 November 2017 and 30 November 2016 there are no securities on loan from the Funds.
General Information
47 Invesco Funds Series 5
Directors L. Schmidt (American)****** C. O’Sullivan (Irish) D. Sharp (Canadian)**** S. Hofmann (German)**** W. Manahan (Irish, Independent Director) N. Tolchard (British)* A.M. King (Irish)** M. Grosclaude (French)*** Global Distributor, Manager and Administrator Invesco Global Asset Management DAC Registered Office Central Quay Riverside IV Sir John Rogerson’s Quay Dublin 2 Ireland Correspondence address for Global Distributor c/o International Financial Data Services (Ireland) Limited Bishop’s Square Redmond’s Hill Dublin 2 Ireland Registrar and Transfer Agent International Financial Data Services (Ireland) Limited Bishop’s Square Redmond’s Hill Dublin 2 Ireland Sub-Administrator***** BNY Mellon Fund Services (Ireland) Designated Activity Company One Dockland Central Guild Street International Financial Services Centre Dublin 1 Ireland Secretary Invesco Asset Management Limited Perpetual Park Perpetual Park Drive Henley-on-Thames Oxfordshire RG9 1HH United Kingdom Depositary***** BNY Mellon Trust Company (Ireland) Limited One Dockland Central Guild Street International Financial Services Centre Dublin 1 Ireland
Hong Kong Sub-Distributor and Representative Invesco Asset Management Asia Limited 41/F Champion Tower Three Garden Road, Central Hong Kong Legal Advisor Matheson 70 Sir John Rogerson’s Quay Dublin 2 Ireland Swiss Representative Invesco Asset Management (Switzerland) Limited Talacker 34 8001 Zurich Switzerland United Kingdom Representative Invesco Global Investment Funds Limited Perpetual Park Perpetual Park Drive Henley-on-Thames Oxfordshire RG9 1HH United Kingdom Independent Auditors of the Fund and Management Company Auditors PricewaterhouseCoopers Chartered Accountants One Spencer Dock North Wall Quay Dublin 1 Ireland Investment Advisers to Invesco Korean Equity Fund and Invesco PRC Equity Fund Invesco Hong Kong Limited Registered Office 41/F Champion Tower Three Garden Road, Central Hong Kong Investment Advisers to Invesco Emerging Markets Equity Fund Invesco Asset Management Limited Perpetual Park Perpetual Park Drive Henley-on-Thames Oxfordshire RG9 1HH United Kingdom Austrian Distributor Invesco Asset Management Österreich – Zweigniederlassung der Invesco Asset Management Deutschland GmbH Rotenturmstrasse 16-18 A-1010 Vienna Austria
Austrian Paying Agent Erste Bank der oesterreichischen Sparkassen AG Am Belvedere 1 A-1100 Wien Austria German Information Agent Invesco Asset Management Deutschland GmbH Registered Office An der Welle 5 D-60322 Frankfurt am Main Germany German Paying Agent BNP Paribas Security Services S.C.A. Zweigniederlassung Frankfurt am Main Europa-Allee 12 D-60327 Frankfurt am Main Germany Invesco Limited Representative Offices Austria Invesco Asset Management Österreich – Zweigniederlassung der Invesco Asset Management Deutschland GmbH Rotenturmstrasse 16 -18 A-1010 Vienna Austria Tel: +43 1 316 20 00 Fax: +43 1 316 20 20 Belgium, Norway, Denmark, and Finland Invesco Asset Management S.A. Belgian Branch 235 Avenue Louise 1050 Brussels Belgium Tel: +322 641 0170 Fax: +322 641 0175 France Invesco Asset Management S.A. 18 rue de Londres 75009 Paris France Tel: +33 1 56 62 43 00 Fax: +33 1 56 62 43 83/43 20 Germany Invesco Asset Management Deutschland GmbH An der Welle 5 D-60322 Frankfurt am Main Germany Tel: +49 69 29807 0 Fax: +49 69 29807 159 Hong Kong and Macau Invesco Asset Management Asia Limited 41/F Champion Tower Three Garden Road, Central Hong Kong Tel: +852 3128 6000 Fax: +852 3128 6001
Ireland Invesco Global Asset Management DAC Registered Office Central Quay Riverside IV Sir John Rogerson’s Quay Dublin 2 Ireland Tel: +353 1 439 8000 Fax: +353 1 439 8400 Italy and Greece Invesco Asset Management S.A. Sede Secondaria Via Bocchetto, 6 20123 Milano Italy The Netherlands Invesco Asset Management S.A. Dutch Branch Vinoly Building Claude Debussylaan 26 1082 MD Amsterdam Netherlands Tel: +31 205 61 62 61 Fax: +31 205 61 68 88 Spain and Latin America Invesco Asset Management S.A. Sucursal en España Calle Goya 6/3rd Floor 28001 Madrid Spain Tel: + 34 91 781 3020 Fax: + 34 91 576 0520 Sweden Invesco Asset Management S.A. (France) Swedish Filial Stureplan 4c 4th Floor, Stockholm 11435 Sweden Tel: +46 8 463 11 06 Fax: +46 2 641 01 75 The latest Financial Statements are also available through Invesco’s Internet Site www.invesco.com For Shareholders in Hong Kong please refer to www.invesco.com.hk *Appointed 3 May 2017 **Appointed 17 May 2017 ***Appointed 3 July 2017 ****Resigned 13 July 2017 *****Effective 1 September 2017, the registered address of BNY Mellon Fund Services (Ireland) Designated Activity Company and BNY Mellon Trust Company (Ireland) Limited was changed to One Dockland Central, Guild Street, International Financial Services Centre, Dublin 1, Ireland. ******Resigned 13 July 2017

Contact Us Invesco Global Asset Management DAC Manager/Global Distributor Registered Office Central Quay Riverside IV Sir John Rogerson’s Quay, Dublin 2 Ireland Telephone: +353 1 439 8000 Website: www.invesco.com Invesco Asset Management Asia Limited Hong Kong Sub-Distributor and Representative 41/F Champion Tower Three Garden Road, Central Hong Kong Telephone: +852 3128 6000 Facsimile: +852 3128 6001 Website: www.invesco.com.hk


