26
25 September 2014 North American Binding Authorities Programme
| Date post: | 25-Dec-2015 |
| Category: |
Documents |
| Upload: | randall-ramsey |
| View: | 217 times |
| Download: | 3 times |

25 September 2014
North American Binding Authorities Programme

Matthew C. Mosher, FCAS, MAAA, CERA
Senior Vice President – Global Ratings25 September 2014
US Surplus Lines Market Review

Surplus Lines Market• Surplus Lines insurers remain vital to the US economy
• A market largely dominated by larger participants
• “Opportunistic” business model
• “Freedom” from state regulatory rate and form requirements
• Reliance on broker / managing agency to source the business
• Predominantly “hard to place” general liability, property and professional liability lines in highly regulated, industrialized states.
• Flow of business is subject to “ebbs & flows” of insurer risk appetites
• Dominated by highly-rated insurers

U.S. Domestic Professional Surplus Lines - Best's Rating Distribution by Rating Unit vs. P/C Industry
Best's Financial Strength Rating (FSR) Domestic Professional Surplus Lines Total P/C Industry
Level Category # of Rating Units Percentage # of Rating Units Percentage
SECURE RATINGS
A++ Superior 7 7.29% 26 2.87%
A+ Superior 22 22.92% 80 8.83%
Subtotal 29 30.21% 106 11.70%
A Excellent 46 47.92% 300 33.11%
A- Excellent 18 18.75% 291 32.12%
Subtotal 64 66.67% 591 65.23%
B++ Good 3 3.13% 104 11.48%
B+ Good 0 0.00% 58 6.40%
Subtotal 3 3.13% 162 17.88%
Total Secure Ratings 96 100.00% 859 94.81%
VULNERABLE RATINGS
B - D 0 0.00% 47 5.19%
Total Rating Opinions 96 100.00% 906 100.00%
Source: A.M. Best data and research

1977
1978
1979
1980
1981
1982
1983
1984
1985
1986
1987
1988
1989
1990
1991
1992
1993
1994
1995
1996
1997
1998
1999
2000
2001
2002
2003
2004
2005
2006
2007
2008
2009
2010
2011
2012
2013
0
10
20
30
40
50
60
70
U.S. Property/Casualty – Annual Impairment Count, Admitted Companies vs. Surplus Lines
Admitted Surplus Lines
Source: A.M. Best data & research.
FIC
s (#
)

1977197819791980198119821983198419851986198719881989199019911992199319941995199619971998199920002001200220032004200520062007200820092010201120122013
0.0
0.5
1.0
1.5
2.0
2.5
3.0
3.5
P/C Industry
Surplus Lines
Admitted Companies
FIF
(%
)
Source: A.M. Best data & research, BestLink Best's Statement File – P/C, U.S.
U.S. Property/Casualty – Financial Impairment Frequency, Admitted vs. Surplus Lines

Surplus Lines - Current Market Conditions
• E&S underwriting profits restored in 2013 (post-Sandy)
• Solid earnings prospects
• Good submission flow since 2011; however rates and terms under pressure in 2014
• Continued emphasis on underwriting & customization
• Generally good risk climate - no new emerging losses
• Reserve redundancies unabated
• A market that outperforms the US P&C Industry and Commercial Casualty markets

’00 ’01 ’02 ’03 ’04 ’05 ’06 ’07 ’08 09 10 11 12 13-10
0
10
20
30
40
50
Pretax Returns on Net Premiums Earned (NPE) U.S. DPSL* vs. U.S. P/C Industry
DPSL* P/C Industry
RO
R (
%)
* Domestic Professional Surplus LinesSource: A.M. Best data & research

Surplus Lines Composite vs. Comml Casualty Operating Performance
5-Year Avg (2009 – 2013)
Source: A.M. Best data and research
E&S Composite Commercial Casualty Fav/(Unfav)Loss & LAE Ratio 70.8% 72.6% 1.8%Underwriting Expense Ratio 29.3% 30.3% 1.0%Combined Ratio Before PHD 100.1% 102.9% 2.8%Policyholder Dividends 0.0% 0.3% 0.3%Combined Ratio After PHD 100.1% 103.2% 3.1%Investment Ratio 22.7% 14.9% 7.8%Operating Ratio 77.4% 88.3% 10.9%

Underwriting Leverage
U.S. P/C Industry
U.S. E&S
Comp
Lloyd's U.S. P/C Industry
U.S. E&S
Comp
Lloyd's U.S. P/C Industry
U.S. E&S
Comp
Lloyd's U.S. P/C Industry
U.S. E&S
Comp
Lloyd's U.S. P/C Industry
U.S. E&S
Comp
Lloyd's
2009 2010 2011 2012 2013
-
50
100
150
200
250
300
80
41
9574
43
9778
42
10176
39
10171
37
99
112
106
141
103
111
151
107
107
169
101
101
153
90
89
139
U.S. Surplus Lines Composite, U.S. P/C Industry & Lloyd's
Net Premiums Written to Statutory Surplus Loss & LAE Reserves to Statutory Surplus
(%)
Source: A.M. Best data and researchLloyd’s capital based on UK GAAP

Surplus Lines Combined Ratio vs. U.S. PC Industry
1999 2000 2001 2002 2003 2004 2005 2006 2007 2008 2009 2010 2011 2012 201370
80
90
100
110
120
105 105
93 9294 93
7976
94 93
101104
110
92
108110
116
107
100 99102
9396
105
101103
108
103
96
E&S Composite Total U.S. PC Industry
%
Source: A.M. Best data and research

Combined Ratios
U.S. P/C Industry
U.S. E&S
Comp
Lloyd's U.S. P/C Industry
U.S. E&S
Comp
Lloyd's U.S. P/C Industry
U.S. E&S
Comp
Lloyd's U.S. P/C Industry
U.S. E&S
Comp
Lloyd's U.S. P/C Industry
U.S. E&S
Comp
Lloyd's
2009 2010 2011 2012 2013
40
60
80
100
120
7264.8
51.6
73.7 70.3
58.6
79.474.9 71.3 74.3
80.2
54
67.262.5
48.6
28
28.1
33.2
28.230.1
34.9
28.228.6 34.7 28.1
30
35.2
2829.9
36.2
U.S. Surplus Lines Composite, Lloyd's & U.S. P/C In-dustry
Loss & LAE Ratio Expense Ratio
% o
f N
et
Pre
miu
ms E
arn
ed
Note: Lloyd’s includes all Global premiums of which % is comprised U.S. insurance and reinsurance business. US E&S Composite includes US Domestic excess and surplus lines excluding Lloyd’s. This composite’s makeup is fluid and changes over time.Source: A.M. Best data and research

Surplus Lines - Evolving Landscape
• E&S commercial lines market share is steadily increasing
• Recent entrants making headway
• Berkshire Hathaway creates new specialty unit in 2013
• Continued M&A interest among foreign insurers
• Constant management recycling among US insurers
• Early market softening underway - Property rates hardest hit
• Pockets of growth in construction, energy and cyber liability
• Broker / agency consolidations are never ending

U.S. Surplus Lines – Top 25 Groups, 2013Ranked by direct premiums written(USD Thousands)
Rank AMB No. Group NameSurplus
Lines DPWTotal Market
Share (%)1 85202 Lloyd's 7,099,000 18.8 2 18540 American International Group 4,832,158 12.8 3 05987 Nationwide Group 1,662,999 4.4 4 18252 W.R. Berkley Group 1,327,996 3.5 5 18549 Zurich Financial Svcs NA Group 1,232,050 3.3 6 18468 Markel Corporation Group 1,147,678 3.0 7 18498 ACE INA Group 976,441 2.6 8 03116 Fairfax Financial (USA) Group 837,129 2.2 9 18313 CNA Insurance Cos 808,262 2.1 10 18713 QBE Americas Group 776,999 2.1 11 18640 Alleghany Insurance Holdings 764,574 2.0 12 18728 Ironshore Insurance Group 745,382 2.0 13 18130 XL America Group 620,013 1.6 14 00811 Berkshire Hathaway 564,508 1.5 15 18603 AXIS Insurance Group 547,169 1.5 16 18484 Arch Insurance Group 513,786 1.4 17 04019 Argo Group 499,853 1.3 18 18591 Allied World Group 466,754 1.2 19 00060 Liberty Mutual Insurance Cos 434,647 1.2 20 00012 Chubb Group of Insurance Cos 421,934 1.1 21 04835 Great American P&C Group 393,864 1.0 22 18720 Catlin U.S. Pool 384,987 1.6 23 18723 HCC Insurance Group 353,052 1.5 24 18674 Travelers Group 330,889 0.9 25 03262 Swiss Reinsurance Group 329,798 0.9
Subtotal of Top 25 $28,071,922 74.4 Total U.S. Surplus Lines Market $37,719,000 100.0 Source: A.M. Best data & research

…Evolving Landscape• Relationships with wholesaler brokers key to growth
• Binding authority program business – trouble for some
• Continued emphasis on capital management via dividends and share buybacks.
• Some interest in capital market capacity (e.g. sidecars) to lower cost of reinsurance and capital.

…Current Market Conditions
• US macroeconomic issues have generally improved but incrementally
• Credit conditions continue to loosen but limited new business growth in US

Surplus Lines Ratings Outlook - Stable
• Strong balance sheets / robust capital • Dimmed yet favorable future earnings prospects• Reserve development • No new emerging losses • Disciplined cycle and capital management • Better broker alignment / relationships
Offsetting Factors:• Softening market • Broker leverage• Low investment yield• Reserve redundancies running out (for some)• Sluggish US economyThe rating outlook reflects a balanced view of rating upgrades versus downgrades.

US Judicial / Legislative
• Supreme Court (Halliburton vs. Fund) – Ruling may have some influence on future D&O policy language, LAE and claims frequency
• Cyber breach lawsuits - Pending litigation cases could set precedent for future cases in terms of indemnity (Target Corp)
• Terrorism (TRIPRA) – Pending bill would reset the risk tolerances for WC carriers
• Affordable Care Act (PPACA) – Effects are not yet known but are likely to effect MPL / HPL insurers and health insurers. Medical stop-loss insurers have already seen some benefit
• California Tort Law (MICRA) – Model law enacted in 1975 is currently on the November ballot
*These sorts of issues typically work in favor of E&S and alternative risk (ART) insurers.

Interest Rates• Prolonged low interest rates:
– Investment portfolios prudently managed
– Investment guidelines modified
– Capital gains harvested
– Pricing modified
– Upward pressure on casualty pricing
– Alternative investments
Negative earnings factor, but steering greater emphasis on underwriting
discipline. More critical for life and annuity products with greater investment
risk inherent in products.

Net Investment Income to NPE (ROR)
U.S. P/C Industry U.S. E&S Composite Top 25 U.S. E&S Lloyd's0%
5%
10%
15%
20%
25%
30%
2009 2010 2011 2012 2013
Source: A.M. Best data and research

Future Keys to Success
• Agency / Broker relationships• Defined specialty niche underwriting capability• Strong balance sheets• Responsiveness / Technology• Utilizing data and predictive analytics• ERM
1989
1990
1991
1992
1993
1994
1995
1996
1997
1998
1999
2000
2001
2002
2003
2004
2005
2006
2007
2008
2009
2010
2011
2012
2013
Sou
rce:
A.M
. B
e...0
5
10
15
20
25
30
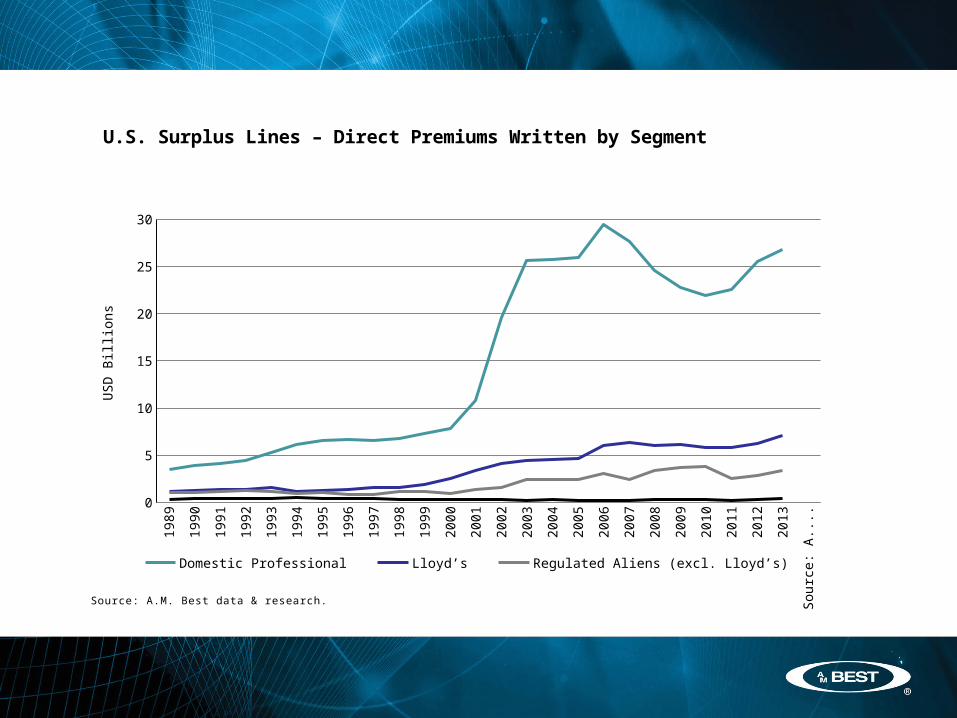
U.S. Surplus Lines – Direct Premiums Written by Segment
Domestic Professional Lloyd’s Regulated Aliens (excl. Lloyd’s) Domestic Specialty
Source: A.M. Best data & research.
US
D B
illio
ns

1992
1993
1994
1995
1996
1997
1998
1999
2000
2001
2002
2003
2004
2005
2006
2007
2008
2009
2010
2011
2012
2013
0%
10%
20%
30%
40%
50%
60%
70%
80%
90%
100%
U.S. Surplus Lines – Market Share by Segment
Domestic Specialty Regulated Aliens (excl. Lloyd’s) Lloyd’s Domestic Professional
Mar
ket
Sha
re (
%)
Source: A.M. Best data & research.
2013

'78 '82 '86 '90 '94 '98 '02 '06 '08 10 12-30
-20
-10
0
10
20
30
40
50
60
70
80
90
U.S. DPSL* Composite – NPW Growth vs. U.S. P/C Industry
DPSL* P/C Industry
Cha
nge
in N
et P
rem
ium
s W
ritte
n (%
)
* Domestic Professional Surplus LinesSource: A.M. Best data & research
13

Surplus Lines – Market Overview Summary
Positives• NUI Profits Restored in ’13• Favorable Earnings Prospects• Specialized Underwriting &
Customization vs. Commodity• Lower Reinsurance Costs• Favorable Reserve
Development• Greater Slice of the P&C Pie• No Mass Torts • NPW/PHS = 0.4x – Solid Cap.• Improved Broker Alignment
Negatives• Ebbs & Flow • New Entrants & M&A • Applications Down / Rate
Increases Moderating• Low Prevailing Interest
Rate Environment• Loss Reserve Deterioration• Limited New Business
Prospects• Broker Consolidations• MGA Programs

© AM Best Company (AMB) and/or its licensors and affiliates. All rights reserved. ALL INFORMATION CONTAINED HEREIN IS PROTECTED BY COPYRIGHT LAW AND NONE OF SUCH INFORMATION MAY BE COPIED OR OTHERWISE REPRODUCED, REPACKAGED, FURTHER TRANSMITTED, TRANSFERRED, DISSEMINATED, REDISTRIBUTED OR RESOLD, OR STORED FOR SUBSEQUENT USE FOR ANY SUCH PURPOSE, IN WHOLE OR IN PART, IN ANY FORM OR MANNER OR BY ANY MEANS WHATSOEVER, BY ANY PERSON WITHOUT AMB’s PRIOR WRITTEN CONSENT. All information contained herein is obtained by AMB from sources believed by it to be accurate and reliable. Because of the possibility of human or mechanical error as well as other factors, however, all information contained herein is provided “AS IS” without warranty of any kind. Under no circumstances shall AMB have any liability to any person or entity for (a) any loss or damage in whole or in part caused by, resulting from, or relating to, any error (negligent or otherwise) or other circumstance or contingency within or outside the control of AMB or any of its directors, officers, employees or agents in connection with the procurement, collection, compilation, analysis, interpretation, communication, publication or delivery of any such information, or (b) any direct, indirect, special, consequential, compensatory or incidental damages whatsoever (including without limitation, lost profits), even if AMB is advised in advance of the possibility of such damages, resulting from the use of or inability to use, any such information. The credit ratings, financial reporting analysis, projections, and other observations, if any, constituting part of the information contained herein are, and must be construed solely as, statements of opinion and not statements of fact or recommendations to purchase, sell or hold any securities, insurance policies, contracts or any other financial obligations, nor does it address the suitability of any particular financial obligation for a specific purpose or purchaser. Credit risk is the risk that an entity may not meet its contractual, financial obligations as they come due. Credit ratings do not address any other risk, including but not limited to, liquidity risk, market value risk or price volatility of rated securities. NO WARRANTY, EXPRESS OR IMPLIED, AS TO THE ACCURACY, TIMELINESS, COMPLETENESS, MERCHANTABILITY OR FITNESS FOR ANY PARTICULAR PURPOSE OF ANY SUCH RATING OR OTHER OPINION OR INFORMATION IS GIVEN OR MADE BY AMB IN ANY FORM OR MANNER WHATSOEVER. Each credit rating or other opinion must be weighed solely as one factor in any investment or purchasing decision made by or on behalf of any user of the information contained herein, and each such user must accordingly make its own study and evaluation of each security or other financial obligation and of each issuer and guarantor of, and each provider of credit support for, each security or other financial obligation that it may consider purchasing, holding or selling.


