40
1 Making Housing Affordable 25 th National Real Estate Convention 2015 12 November 2015

1
Making Housing Affordable 25th National Real Estate Convention 2015 12 November 2015

This report examines the issue of housing affordability in Malaysia, viewing it within the context of housing as an economic sector rather than simply as a social welfare concern. Housing interventions have focused primarily on demand, and in doing so subsidises a non-responsive supply sector. We examine housing affordability with the view of ensuring that supply is able to meet effective demand, thus improving the affordability of housing in general. This report considers the problem of supplying affordable homes from the perspectives of both institutions (the national business system) and firms (industry value chain analysis and the economics of governance). This is based on the premise that improvements are needed at the level of construction projects and firms in order to increase the affordability of houses at the national level. Until now, policies have focused on controlling house prices once the consumer receives the house at the end of the production process. This report adopts a different approach as evidence shows that it is far more efficient to enhance capacity on the supply side in order to develop a sustainable and responsive housing sector that caters for all sections of the population. This is the first in a series of reports undertaken to examine the various dimensions of the housing industry. Future studies will focus on matters relating to land and its attendant regulations, the financing of housing and how housing must be understood as a critical component of city-making.
2
Structure of the presentation
1 Key Recommendations
2 How affordable is the Malaysian Housing market?
3 Housing demand, supply and interventions
4 The state of house building in Malaysia
5 Policy recommendations
6 Concluding remarks
3

Key Recommendations
Key Recommendations:
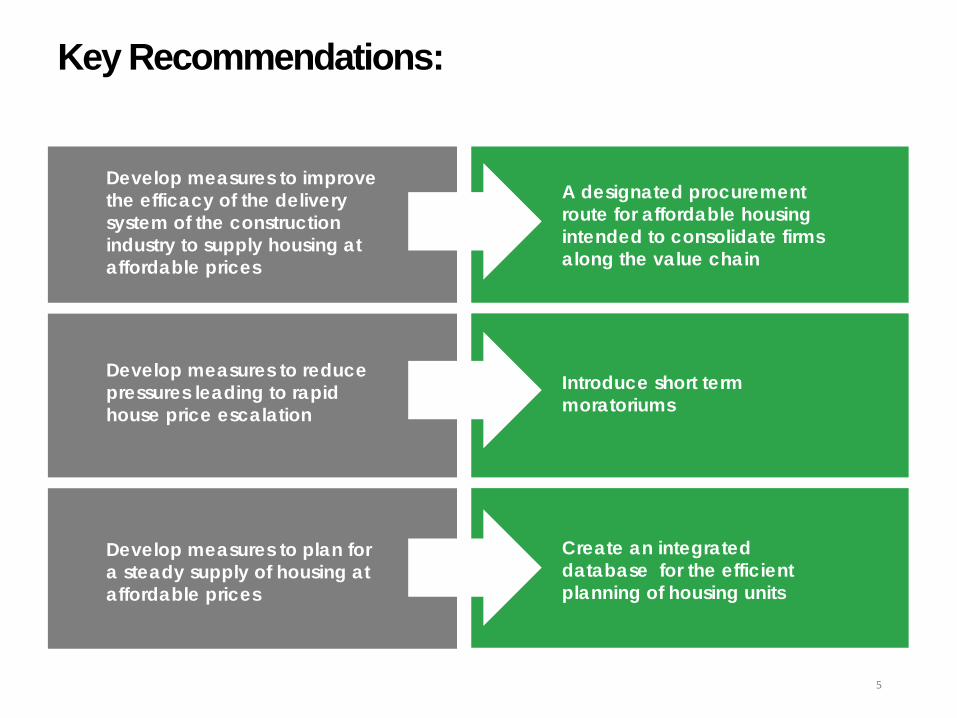
Develop measures to improve the efficacy of the delivery system of the construction industry to supply housing at affordable prices
A designated procurement route for affordable housing intended to consolidate firms along the value chain
Develop measures to reduce pressures leading to rapid house price escalation
Introduce short term moratoriums
Develop measures to plan for a steady supply of housing at affordable prices
Create an integrated database for the efficient planning of housing units
5
How affordable is the Malaysian housing market?

Home ownership and informality
Comparison between DoS’s housing units and NAPIC’s existing housing stock, 2010 Home ownership rates for selected countries, 2010
Malaysia’s home ownership rate of 72.5% is relatively high as home ownership rates in developed countries – apart from Singapore – were below 70% in the same year. However, the rates published by the Department of Statistics includes ownership of informal houses. A significant amount of housing stock accounted in the Census 2010 is not included in the estimates published by the National Property and Information Centre (NAPIC) which takes into account formal housing.
Percentage of home ownership in Malaysia, 2010
Percentage of home ownership
Malaysia 72.5 Australia 68.1 Singapore 87.2 UK 67.4 US 66.5
Percentage of home ownership Total Urban Rural Malaysia 72.5% 69.1% 81.2% Johor 72.2% 69.6% 78.5% Kedah 81.8% 77.2% 89.9% Kelantan 80.5% 72.3% 86.4% Melaka 72.9% 72.0% 78.5% N. Sembilan 71.7% 68.2% 77.8% Pahang 72.0% 65.8% 78.6% Perak 75.7% 73.4% 80.8% Perlis 78.1% 72.8% 83.5% P. Pinang 77.5% 76.8% 83.5% Sabah 68.1% 65.3% 71.7% Sarawak 79.4% 75.9% 83.2% Selangor 67.9% 66.9% 78.2% Terengganu 78.5% 75.5% 82.8% K. Lumpur 53.5% 53.5% Labuan 57.0% 54.4% 73.5% Putrajaya 9.9% 9.9%
Type of living quarters Units
Built or converted for living
Housing units
Detached 2,416,210 Semi-detached 528,408 Terrace / link 2,570,317 Townhouse 32,682 Cluster 63,345 Flat 744,187 Apartment and condominium 716,729 Room 16,142 Shophouse/office 132,262 Longhouse (Sabah & Sarawak) 84,133 Others 18,398 Improvised / temporary hut 12,358 Total 7,335,171
Collective living
quarters
Higher learning institution 3,650 Temporary quarters for workers 3,029 Others 2,179 Charitable/social welfare institution 778
Hotel, lodging house, rest house 627 Medical institution 585 Prison, detention centre 168 Religious home 81 Total 11,097
Not intended for living but used as
such on Census Day
In a permanent building 96 Others 546
Total 642
GRAND TOTAL 7,346,910
Existing housing stock Units
Detached 399,817 Semi-detached 282,402 Terrace 1,767,519 Townhouse 24,554 Cluster 26,299 Flat & low cost flat 817,422 Apartment and condominium (including Service Apartment and SOHO)
495,007
Low cost house 574,963 Total 4,387,983
Department of Statistics National Property Information Centre
7 All sources for the charts and tables can be found in the “Making Housing Affordable" book

Residential market dominates property transactions
8
The residential sector has always dominated the Malaysian property market. In 2013 and 2014, the number of residential transactions represented about 64% of the total transactions.
These transactions represented approximately RM67.8 billion, RM72.1 billion, and RM82.1 billion worth of transactions in 2012, 2013, and 2014 respectively.
-
50,000
100,000
150,000
200,000
250,000
300,000
350,000
400,000
450,000
2002
2003
2004
2005
2006
2007
2008
2009
2010
2011
2012
2013
2014
Uni
ts
Development
Agricultural
Industrial
Commercial
Residential
-
20
40
60
80
100
2002
2003
2004
2005
2006
2007
2008
2009
2010
2011
2012
2013
2014
RM b
illio
n
Residential
Commercial Development
Agricultural Industrial
0
10
20
30
40
50
60
70
80
90
-
50,000
100,000
150,000
200,000
250,000
300,000
350,000
400,000
450,000
2002
2003
2004
2005
2006
2007
2008
2009
2010
2011
2012
2013
2014
Number of transactions (units, LHS)Value (RM billion, RHS)
No. of property transaction by type of properties, 2002 - 2014
Value of property transaction by type of properties, 2002 - 2014
Number and value of residential transaction, 2002 - 2014
All sources for the charts and tables can be found in the “Making Housing Affordable" book
Affordability and a Well-Functioning Housing Sector
9
0
50
100
150
200
250
200
0
200
1
200
2
200
3
200
4
200
5
200
6
200
7
200
8
200
9
201
0
201
1
201
2
201
3
201
4
Inde
xed
(200
0=10
0)
Malaysia House price index
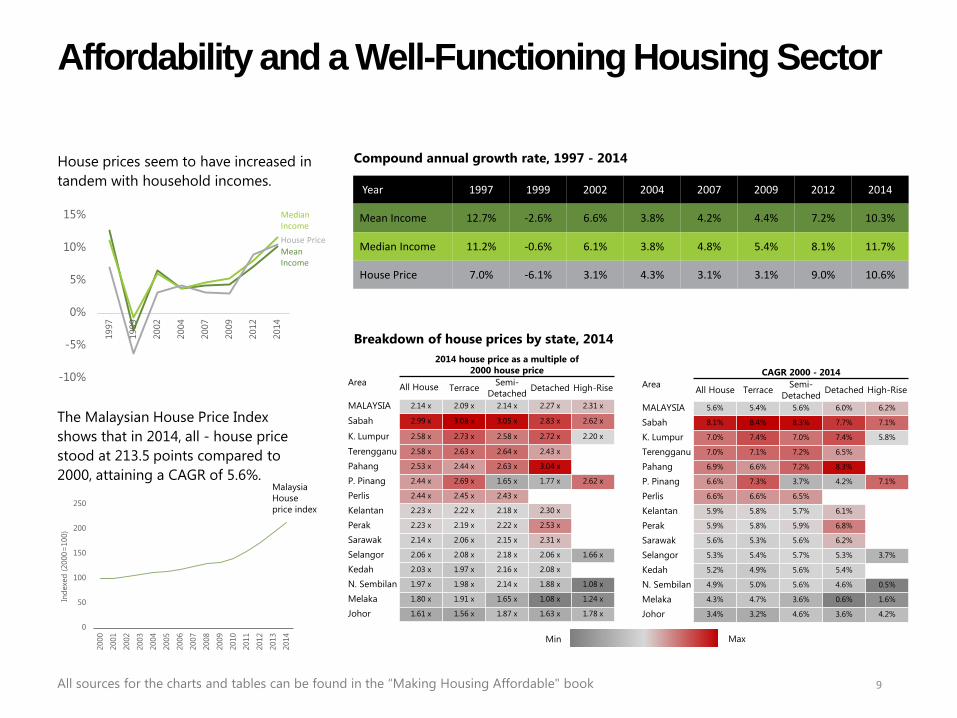
The Malaysian House Price Index shows that in 2014, all - house price stood at 213.5 points compared to 2000, attaining a CAGR of 5.6%.
Year 1997 1999 2002 2004 2007 2009 2012 2014
Mean Income 12.7% -2.6% 6.6% 3.8% 4.2% 4.4% 7.2% 10.3%
Median Income 11.2% -0.6% 6.1% 3.8% 4.8% 5.4% 8.1% 11.7%
House Price 7.0% -6.1% 3.1% 4.3% 3.1% 3.1% 9.0% 10.6%
Compound annual growth rate, 1997 - 2014
-10%
-5%
0%
5%
10%
15%
1997
1999
2002
2004
2007
2009
2012
2014
Median Income House Price Mean Income
House prices seem to have increased in tandem with household incomes.
2014 house price as a multiple of 2000 house price
Area All House Terrace Semi-Detached Detached High-Rise
MALAYSIA 2.14 x 2.09 x 2.14 x 2.27 x 2.31 x
Sabah 2.99 x 3.08 x 3.05 x 2.83 x 2.62 x
K. Lumpur 2.58 x 2.73 x 2.58 x 2.72 x 2.20 x
Terengganu 2.58 x 2.63 x 2.64 x 2.43 x
Pahang 2.53 x 2.44 x 2.63 x 3.04 x
P. Pinang 2.44 x 2.69 x 1.65 x 1.77 x 2.62 x
Perlis 2.44 x 2.45 x 2.43 x
Kelantan 2.23 x 2.22 x 2.18 x 2.30 x
Perak 2.23 x 2.19 x 2.22 x 2.53 x
Sarawak 2.14 x 2.06 x 2.15 x 2.31 x
Selangor 2.06 x 2.08 x 2.18 x 2.06 x 1.66 x
Kedah 2.03 x 1.97 x 2.16 x 2.08 x
N. Sembilan 1.97 x 1.98 x 2.14 x 1.88 x 1.08 x
Melaka 1.80 x 1.91 x 1.65 x 1.08 x 1.24 x
Johor 1.61 x 1.56 x 1.87 x 1.63 x 1.78 x
CAGR 2000 - 2014 Area All House Terrace Semi-
Detached Detached High-Rise
MALAYSIA 5.6% 5.4% 5.6% 6.0% 6.2%
Sabah 8.1% 8.4% 8.3% 7.7% 7.1%
K. Lumpur 7.0% 7.4% 7.0% 7.4% 5.8%
Terengganu 7.0% 7.1% 7.2% 6.5%
Pahang 6.9% 6.6% 7.2% 8.3%
P. Pinang 6.6% 7.3% 3.7% 4.2% 7.1%
Perlis 6.6% 6.6% 6.5%
Kelantan 5.9% 5.8% 5.7% 6.1%
Perak 5.9% 5.8% 5.9% 6.8%
Sarawak 5.6% 5.3% 5.6% 6.2%
Selangor 5.3% 5.4% 5.7% 5.3% 3.7%
Kedah 5.2% 4.9% 5.6% 5.4%
N. Sembilan 4.9% 5.0% 5.6% 4.6% 0.5%
Melaka 4.3% 4.7% 3.6% 0.6% 1.6%
Johor 3.4% 3.2% 4.6% 3.6% 4.2%
Min Max
All sources for the charts and tables can be found in the “Making Housing Affordable" book
Breakdown of house prices by state, 2014
What would the median multiple indicator look like for Malaysia?
10 All sources for the charts and tables can be found in the “Making Housing Affordable" book
0%
5%
10%
15%
20%
Belo
w 2
k
2k -
< 3k
3k -
< 4k
4k -
< 5k
5k -
< 6k
6k -<
7k
7k -
< 8k
8k -
< 9k
9k -
< 10
k
10k
- < 1
1k
11k
- < 1
2k
12k
- < 1
3k
13k
- < 1
4k
14k
- < 1
5k
15k
and
abov
e
50%
0
100
200
300
400
500
600
700
50k
or le
ss
> 50
k - 1
00k
> 10
0k -
150k
> 15
0k -
200k
> 20
0k -
250k
> 25
0k -
300k
>300
k - 4
00k
> 40
0k -
500k
> 50
0k -
1m
> 1m
Median Market 2 Median Market 4 Median Market 3 Median Market 5
Median Market 8
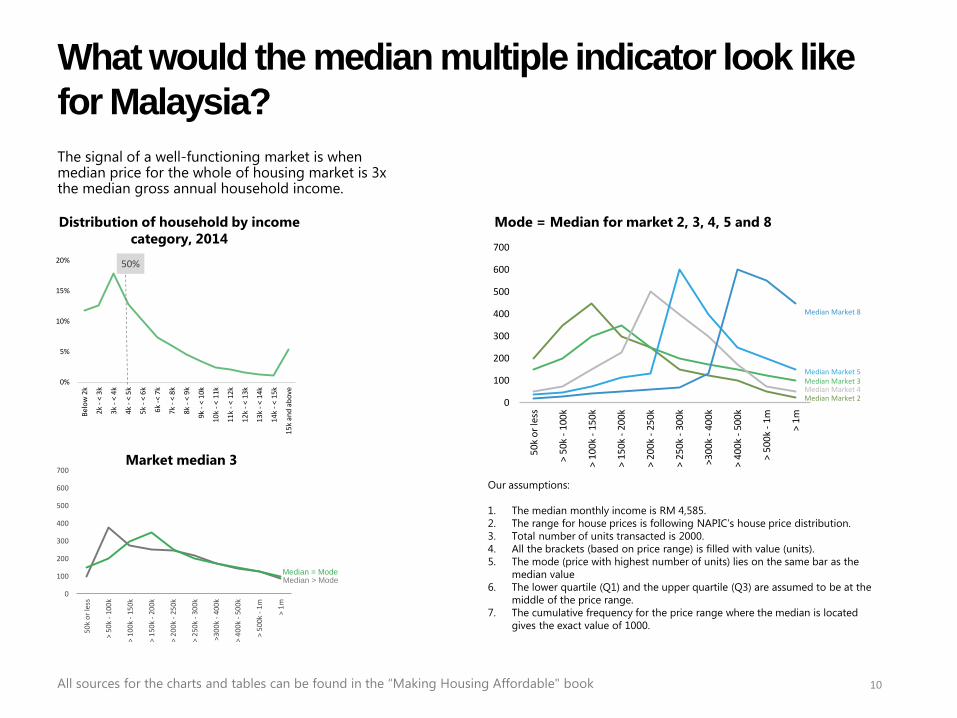
Our assumptions: 1. The median monthly income is RM 4,585. 2. The range for house prices is following NAPIC’s house price distribution. 3. Total number of units transacted is 2000. 4. All the brackets (based on price range) is filled with value (units). 5. The mode (price with highest number of units) lies on the same bar as the
median value 6. The lower quartile (Q1) and the upper quartile (Q3) are assumed to be at the
middle of the price range. 7. The cumulative frequency for the price range where the median is located
gives the exact value of 1000.
The signal of a well-functioning market is when median price for the whole of housing market is 3x the median gross annual household income.
Mode = Median for market 2, 3, 4, 5 and 8 Distribution of household by income category, 2014
Market median 3
0
100
200
300
400
500
600
700
50k
or le
ss
> 50
k - 1
00k
> 10
0k -
150k
> 15
0k -
200k
> 20
0k -
250k
> 25
0k -
300k
>300
k - 4
00k
> 40
0k -
500k
> 50
0k -
1m
> 1m
Median > Mode Median = Mode

The Malaysian median multiple: signal of an unaffordable market?
11 All sources for the charts and tables can be found in the “Making Housing Affordable" book
Income and house price (RM)
Median multiple affordability
Comparison of housing affordability based on annual household median income and median all-house price across states in Malaysia, 2014
In general the median price for the Malaysian housing market exceeds the three times median annual household income threshold for affordability. To adjust for the potential shortfall of NAPIC taking only the formal sector in account, it is assumed that house prices in states where 60% or more of housing stock is accounted for by NAPIC are representative of the overall housing market.
24,
588
26,
532
30,
624
34,
092
43,
512
55,
020
100,
000
115,
001
135,
000
149,
000
175,
000 24
2,00
0
2002 2004 2007 2009 2012 2014
Annualmedianincome
Medianhouse price
4.07 4.33 4.41 4.37
4.02
4.40
2002 2004 2007 2009 2012 2014
Median multiple affordability

Housing markets in six states are analysed
12 All sources for the charts and tables can be found in the “Making Housing Affordable" book
Of the states with high levels of formal housing, some have affordable housing and some do not. The real problems lie in Penang and the Klang Valley. As the charts show the key factor driving housing affordability is the responsiveness of supply (in terms of house types and pricing) to effective demand.
-
50
100
150
200
250
300
50k
or le
ss>
50k
- 100
k>
100k
- 15
0k>
150k
- 20
0k>
200k
- 25
0k>
250k
- 30
0k>3
00k
- 400
k>
400k
- 50
0k>
500k
- 1m
> 1m
(c) MELAKA
Market Median-3 Price: RM181,044
- 500
1,000 1,500 2,000 2,500 3,000 3,500 4,000 4,500 5,000
50k
or le
ss>
50k
- 100
k>
100k
- 15
0k>
150k
- 20
0k>
200k
- 25
0k>
250k
- 30
0k>3
00k
- 400
k>
400k
- 50
0k>
500k
- 1m
> 1m
(a) KUALA LUMPUR
Market Median-3 Price: RM274,320
- 100 200 300 400 500 600 700 800 900
1,000
50k
or le
ss>
50k
- 100
k>
100k
- 15
0k>
150k
- 20
0k>
200k
- 25
0k>
250k
- 30
0k>3
00k
- 400
k>
400k
- 50
0k>
500k
- 1m
> 1m
(b) PULAU PINANG
Market Median-3 Price: RM169,272
-
400
800
1,200
1,600
2,000
50k
or le
ss>
50k
- 100
k>
100k
- 15
0k>
150k
- 20
0k>
200k
- 25
0k>
250k
- 30
0k>3
00k
- 400
k>
400k
- 50
0k>
500k
- 1m
> 1m
JOHOR
Market Median-3 Price: RM187,092
- 500
1,000 1,500 2,000 2,500 3,000 3,500
50k
or le
ss>
50k
- 100
k>
100k
- 15
0k>
150k
- 20
0k>
200k
- 25
0k>
250k
- 30
0k>3
00k
- 400
k>
400k
- 50
0k>
500k
- 1m
> 1m
(a) SELANGOR
Market Median-3 Price: RM223,704
-
400
800
1,200
1,600
50k
or le
ss>
50k
- 100
k>
100k
- 15
0k>
150k
- 20
0k>
200k
- 25
0k>
250k
- 30
0k>3
00k
- 400
k>
400k
- 50
0k>
500k
- 1m
> 1m
(b) NEGERI SEMBILAN
Market Median-3 Price: RM148,608
‘Severely unaffordable’ market, 2014 ‘Seriously unaffordable’ market , 2014
‘Moderately unaffordable’ and ‘affordable’ markets , 2014

Down-market penetration in Malaysia
13 All sources for the charts and tables can be found in the “Making Housing Affordable" book
An overview of Malaysia’s residential market reveals that in aggregate, new launches within the lowest-price range has dropped from 36.4% out of total launches in 2004 to only 19.7% in 2014.
In 2014, the down-market penetration for the lowest-priced dwelling unit ranged from 0.9 to 1.8 times, quite significantly below the 3.4 global value previously estimated.
k = thousand m = million 1. The type of properties included are: Single storey terrace, 2-3 storey terrace, Single storey semi-detached, Detached, Town-house, Cluster, Low-cost flat, Low-cost house, Flat, and Condominium. 2. NAPIC uses different house price ranges from 2004 to 2007, 2008 to 2012 and 2013 to 2014, therefore the charts are divided according to the respective range.
Range of down-market penetration ratios for selected states, 2014
Area Down-market penetration range
Kuala Lumpur 2.7 - 3.2 Pulau Pinang 0.9 - 1.8 Johor < 0.8 Selangor 0.7 - 1.3 Negeri Sembilan < 1.0 Melaka < 0.8
Launched residential units by price range, 2004 - 2014

Housing demand, supply and interventions
More households, more houses needed
15 All sources for the charts and tables can be found in the “Making Housing Affordable" book
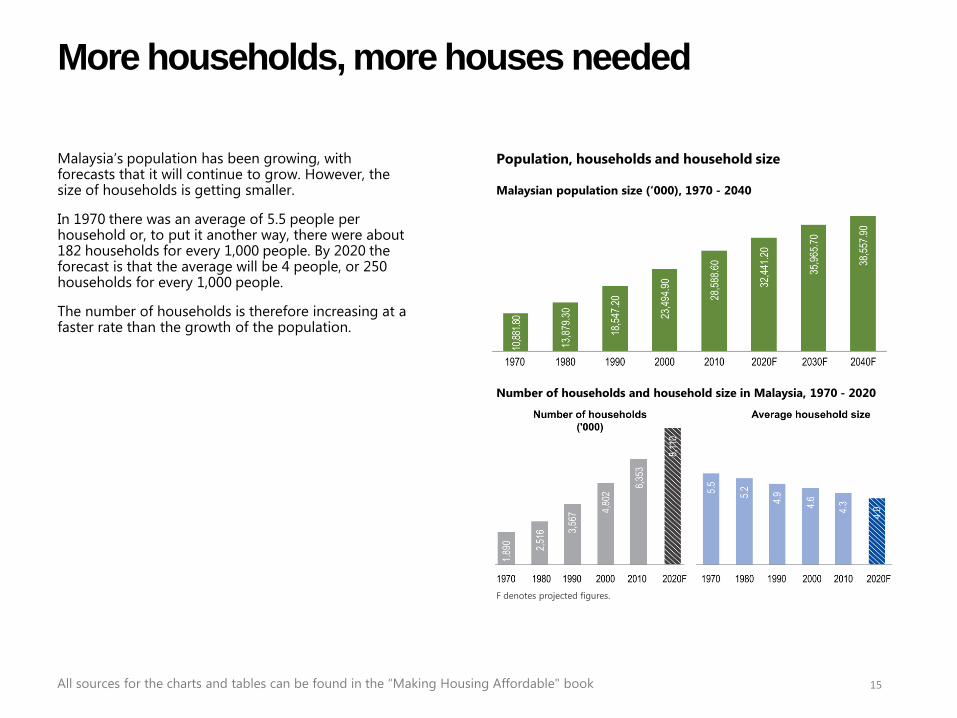
Population, households and household size Malaysia’s population has been growing, with forecasts that it will continue to grow. However, the size of households is getting smaller.
In 1970 there was an average of 5.5 people per household or, to put it another way, there were about 182 households for every 1,000 people. By 2020 the forecast is that the average will be 4 people, or 250 households for every 1,000 people.
The number of households is therefore increasing at a faster rate than the growth of the population.
Malaysian population size (‘000), 1970 - 2040
Number of households and household size in Malaysia, 1970 - 2020
F denotes projected figures.
Urban workers, suburban families
16 All sources for the charts and tables can be found in the “Making Housing Affordable" book
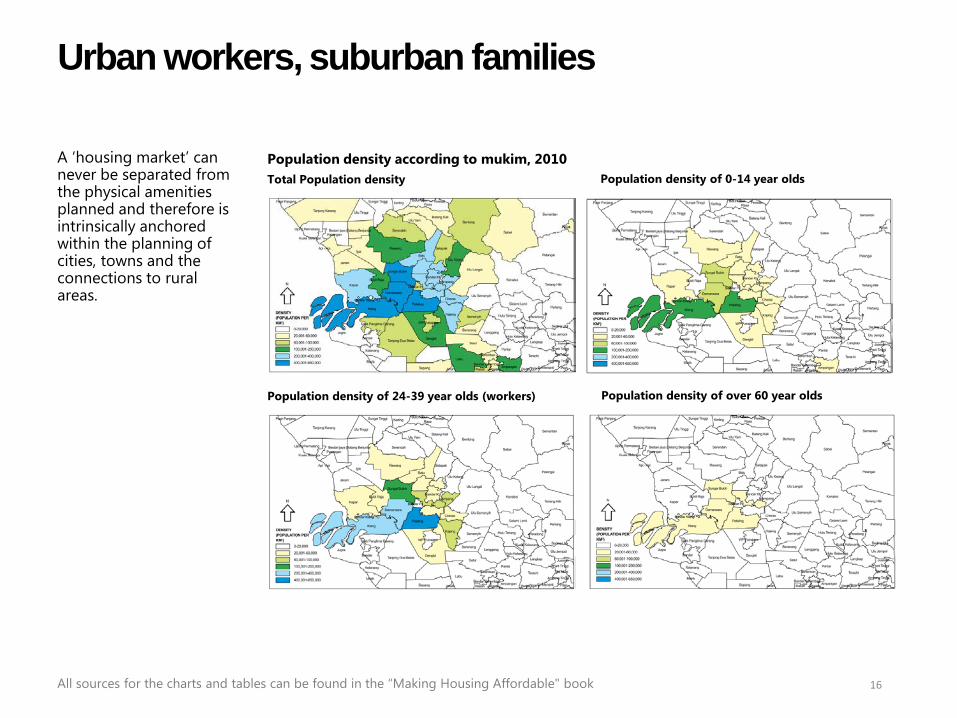
A ‘housing market’ can never be separated from the physical amenities planned and therefore is intrinsically anchored within the planning of cities, towns and the connections to rural areas.
Population density according to mukim, 2010 Total Population density Population density of 0-14 year olds
Population density of 24-39 year olds (workers) Population density of over 60 year olds

Affordability and a Well-Functioning Housing Sector
17 All sources for the charts and tables can be found in the “Making Housing Affordable" book
Another regularity of demand is that low-income households generally allocate greater fractions of their income toward housing than do better off households. This general pattern is observable through the Household Expenditure Survey 2010.
0%
20%
40%
60%
80%
100%
< 0.
5k
0.5k
- <
0.6k
0.6k
- <
0.7k
0.7k
- <
0.8k
0.8k
- <
0.9k
0.9k
- <
1k
1k -
< 2k
2k -
<3k
3k -
< 4k
4k -
< 5k
5k a
nd a
bove
Housing & utilities
Health Education Alcoholic beverages & tobacco Recreation & culture Clothing & footwear
Miscellaneaous goods & services Furniture & household maintenance
Food & non-alcoholic beverages
Transport
Restaurant & hotels
Communication
Percentage of monthly expenditure on goods & services by expenditure category, 2010 (RM)

Theory of housing prices – the dominance of the stock of real property on its price
18 All sources for the charts and tables can be found in the “Making Housing Affordable" book

Construction costs fall, house prices rise
19 All sources for the charts and tables can be found in the “Making Housing Affordable" book
All regions experienced a reduction in building costs in the period 2011 to 2012. If we assume that there is a gestation period for the construction process, then we should expect a reduction in house prices to have occurred in 2013 or 2014. However, this was not the case.
House prices and construction costs according to states, 2008 - 2014
80
100
120
140
160
180
2008 2009 2010 2011 2012 2013 2014
House price
House price
House price
House price
Material cost Labour cost
Machinery &
N. Sembilan
Melaka
Equipment cost
K. Lumpur
Selangor
80
100
120
140
160
180
2008 2009 2010 2011 2012 2013 2014
House price
House price
House price
Material cost
Labour cost Machinery & cost Equipment
P. Pinang
Perlis
Kedah
80
100
120
140
160
180
2008 2009 2010 2011 2012 2013 2014
Labour cost
House price Sabah
Material cost Machinery & cost
Equipment
80
100
120
140
160
180
2008 2009 2010 2011 2012 2013 2014
Labour cost
House price Sarawak
Material cost Machinery & cost
Equipment
Effect of urbanisation
20 All sources for the charts and tables can be found in the “Making Housing Affordable" book
42.4 50.5 51.4 53.8 54.0 59.1 64.6 66.5 69.7 71.9
82.3 86.5 90.8 91.4 100 100
Kela
ntan
Paha
ng
Perli
s
Sara
wak
Saba
h
Tere
ngga
nu
Keda
h
N. S
embi
lan
Pera
k
Joho
r
Labu
an
Mel
aka
P. P
inan
g
Sela
ngor
K. L
umpu
r
Putr
ajay
a
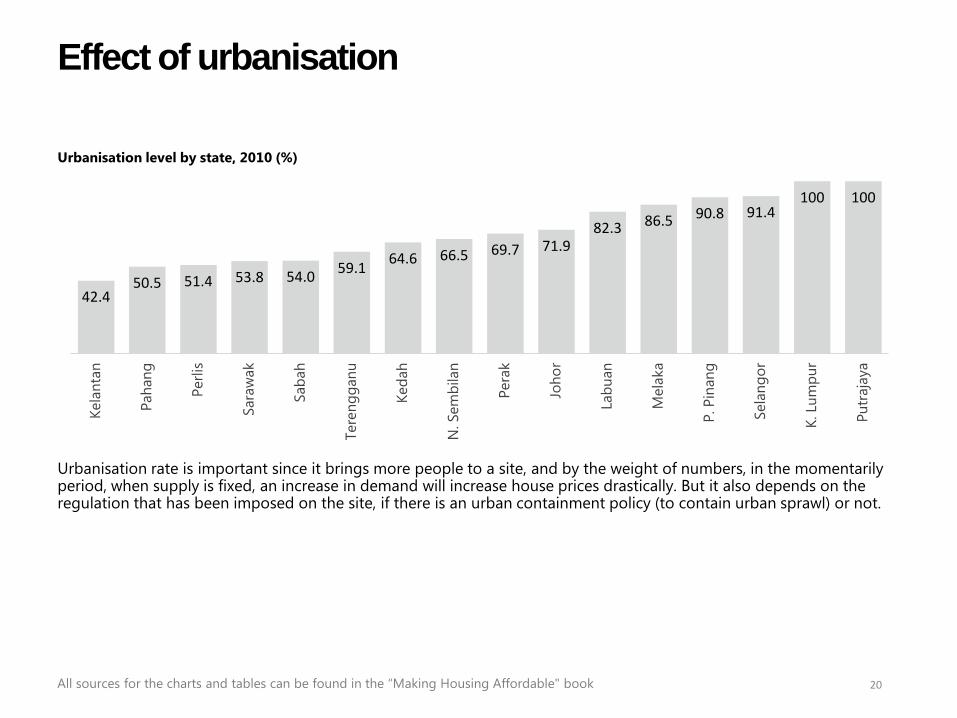
Urbanisation level by state, 2010 (%)
Urbanisation rate is important since it brings more people to a site, and by the weight of numbers, in the momentarily period, when supply is fixed, an increase in demand will increase house prices drastically. But it also depends on the regulation that has been imposed on the site, if there is an urban containment policy (to contain urban sprawl) or not.

Housing Demand and Supply Interventions in Malaysia
21 All sources for the charts and tables can be found in the “Making Housing Affordable" book
On the supply-side, the Federal and state governments have mainly focused on the direct provision of affordable homes, either through public agencies or through partnerships with private developers. Examples of these interventions are (see table):
Public affordable housing schemes in Malaysia
Affordable housing schemes range from low-cost homes priced below RM100,000 to the RM400,000 houses sold under the PR1MA scheme (see figure). Four of these public affordable housing programs not only provide assistance to the bottom-40% of households, but the middle-40% as well; housing affordability is not only a lower-income challenge.

The Intervention: Make the Supply Side More Elastic
22 All sources for the charts and tables can be found in the “Making Housing Affordable" book
Until now, policies have focused on managing house prices once the consumer receives the house at the end of the production process. This includes increasing access to finance (inefficient demand intervention) or subsidizing supply that are high-priced (unresponsive down-market penetration). This report takes a different approach because the evidence shows that it is far more efficient to enhance capacity and make the supply curve more elastic in an efficacious manner, investing in innovation and productivity as well as and improving the national business system.
The effect of time on the conditions of supply
Because, the more elastic the supply curve is, (from Ss to Sl), a shift in demand will bring about more units supplied but with a lower increase in price.

23 All sources for the charts and tables can be found in the “Making Housing Affordable" book
Therefore, it is important to reconsider housing as a social welfare issue and move towards a broader agenda of guiding and managing the housing sector as a whole. The housing sector must be viewed as an important and productive sector, where policies have serious repercussions for overall economic performance and not, as is commonly viewed (especially for low-cost housing) as a sector which is a drain on productive resources. Our case study in the Philippines (8990 Holdings) demonstrates this salient point, that building houses for low-income households can be profitable. The imperative issue here is that people do not demand just ‘houses’, they demand places of living, or habitat. If we are building houses as a ‘product of the building industry’, then regulations on land or the provision of public amenities are secondary to the building regulations that ensure fitness for occupation.
The DECA Home Resort Residences developed by 8990 Holdings in Mintal, Davao City, Philippines. Two bedroom houses start at PHP715,000 (approx. RM57,200 at market exchange rate).
A habitat on the other hand, ensures a multiplicity of networks within its node; ranging from physical (power, water and sanitation, roads), economic (urban transport, labour markets, distribution and retail) and social (education, health, security, family and friends). The ability to connect all of these networks makes a habitat valuable.

The state of house building in Malaysia

What is the national business system for housing?
25 All sources for the charts and tables can be found in the “Making Housing Affordable" book
The industry value chain
The Malaysian construction industry is characterised by the one-off nature of construction projects, because most construction projects have definite project durations and the project organisation is of a temporary multi-organisation structure.
Construction demand is a series of one-off projects, each with its own unique design, tendered competitively on price, and with its own temporary project coalition. Set against the naturally volatile nature of the construction industry (see right figure), contractors tend to focus on the acquisition of new contracts rather than focusing on efficiently delivering projects currently in hand.
The Project Environment and the National Business System
-30%
-20%
-10%
0%
10%
20%
30%
1988
1990
1992
1994
1996
1998
2000
2002
2004
2006
2008
2010
2012
2014
GDP growth Construction contribution to GDP (%)
-30%
-20%
-10%
0%
10%
20%
30%
1988
1990
1992
1994
1996
1998
2000
2002
2004
2006
2008
2010
2012
2014
Construction sector growth
Construction sector growth and Malaysian economic trend
Construction and GDP
Construction sector growth
A
B
INST
ALLA
TIO
N
& F
INIS
HES
STRU
CTU
RE
DESC
RIPT
ION
DEVE
LOPE
R
PURC
HASE
R
DEFI
NIT
ION
CONSTRUCT DESIGN
Malaysia Case Studies
26 All sources for the charts and tables can be found in the “Making Housing Affordable" book
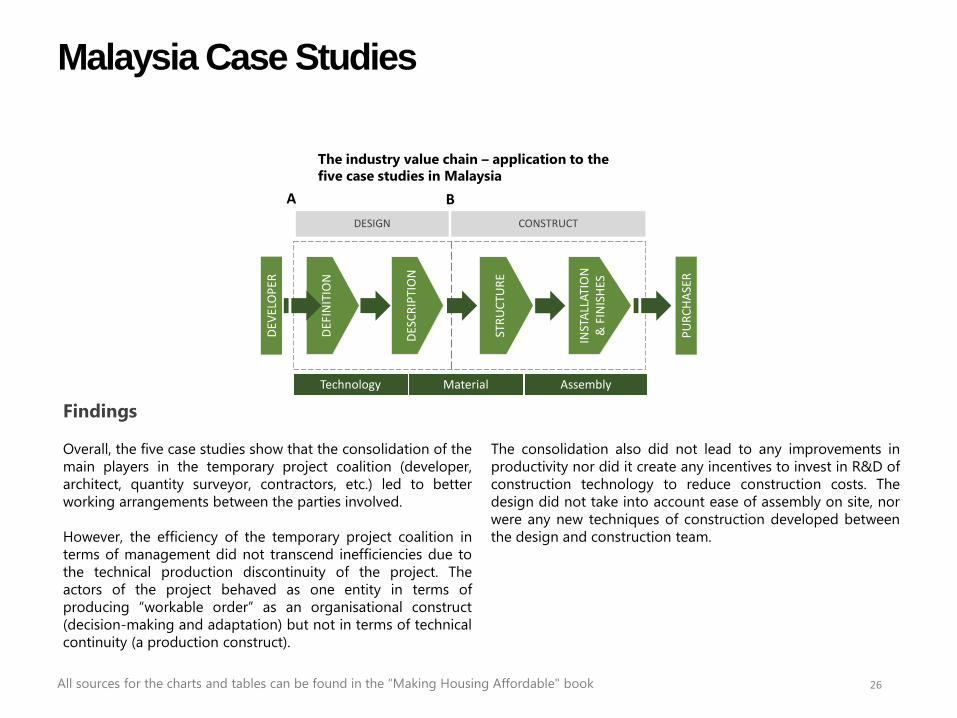
Findings Overall, the five case studies show that the consolidation of the main players in the temporary project coalition (developer, architect, quantity surveyor, contractors, etc.) led to better working arrangements between the parties involved. However, the efficiency of the temporary project coalition in terms of management did not transcend inefficiencies due to the technical production discontinuity of the project. The actors of the project behaved as one entity in terms of producing “workable order” as an organisational construct (decision-making and adaptation) but not in terms of technical continuity (a production construct).
The consolidation also did not lead to any improvements in productivity nor did it create any incentives to invest in R&D of construction technology to reduce construction costs. The design did not take into account ease of assembly on site, nor were any new techniques of construction developed between the design and construction team.
The industry value chain – application to the five case studies in Malaysia
A B
INST
ALLA
TIO
N
& F
INIS
HES
STRU
CTU
RE
DESC
RIPT
ION
DEVE
LOPE
R
PURC
HASE
R
Material Assembly Technology
DEFI
NIT
ION
CONSTRUCT DESIGN
Malaysia Case Studies (cont’d)
27 All sources for the charts and tables can be found in the “Making Housing Affordable" book
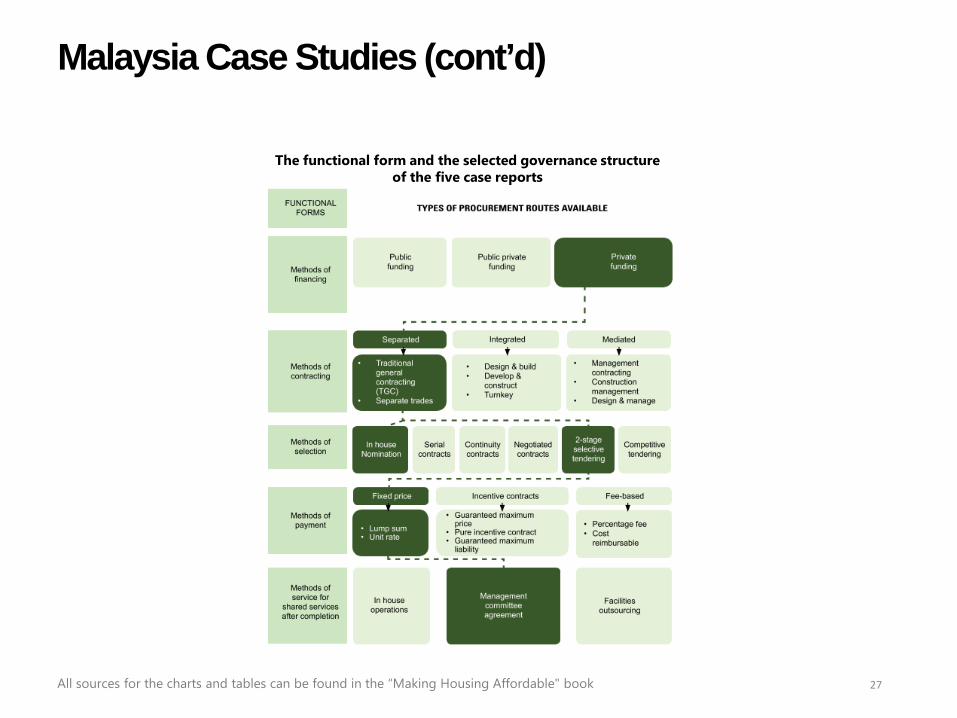
The functional form and the selected governance structure of the five case reports

Case Study: 8990 Holdings, Inc.
28 All sources for the charts and tables can be found in the “Making Housing Affordable" book
Summary findings In terms of the housing production value chain, the case study highlighted the following characteristics demonstrated by 8990 Holdings: • The project design is done by the internal development
team and product innovation is encouraged. • The developer invests in the training of the site
operatives in the external construction firm to ensure that the technology created by its internal design team can be executed on site. Any problems of execution on site will be filtered back into the design process for further refinements on behalf of the design team.
• Product development is continuously encouraged and is designed into the building specifications which can be readily applied on-site as a result of the extensive training given to the site operatives.
• The responsibility for managing the project resides entirely in the developer’s entity.
• Transaction A is internalised while transaction B is executed by in-house nomination (see figure).
• The developer created a financing scheme that accommodates consumers who have insufficient funds for the initial down payment on the house.
The industry value chain: a case study in the Philippines
MO
RTGA
GES
INST
ALLA
TIO
N
& F
INIS
HES
STRU
CTU
RE
DESC
RIPT
ION
DEVE
LOPE
R
PURC
HASE
R
Material Assembly Technology
A
B
DEFI
NIT
ION
Handover
FINANCE CONSTRUCT DESIGN
What are Our Limitations in Producing Affordable Homes based on Current Institutional Context?
29 All sources for the charts and tables can be found in the “Making Housing Affordable" book
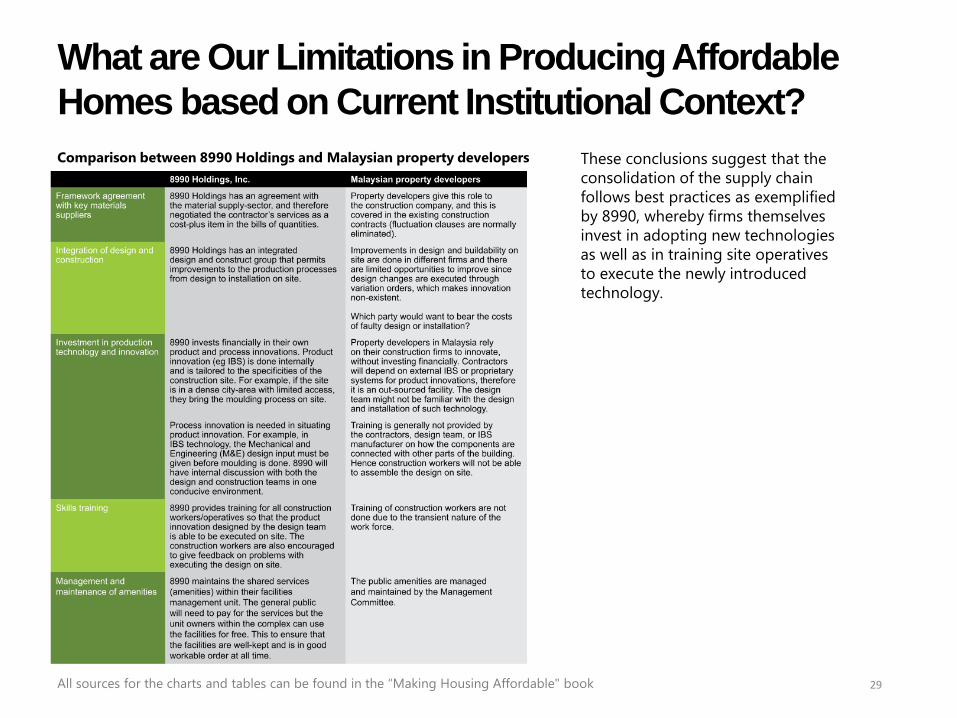
Comparison between 8990 Holdings and Malaysian property developers These conclusions suggest that the consolidation of the supply chain follows best practices as exemplified by 8990, whereby firms themselves invest in adopting new technologies as well as in training site operatives to execute the newly introduced technology.

Policy recommendations
New governance structure
31 All sources for the charts and tables can be found in the “Making Housing Affordable" book
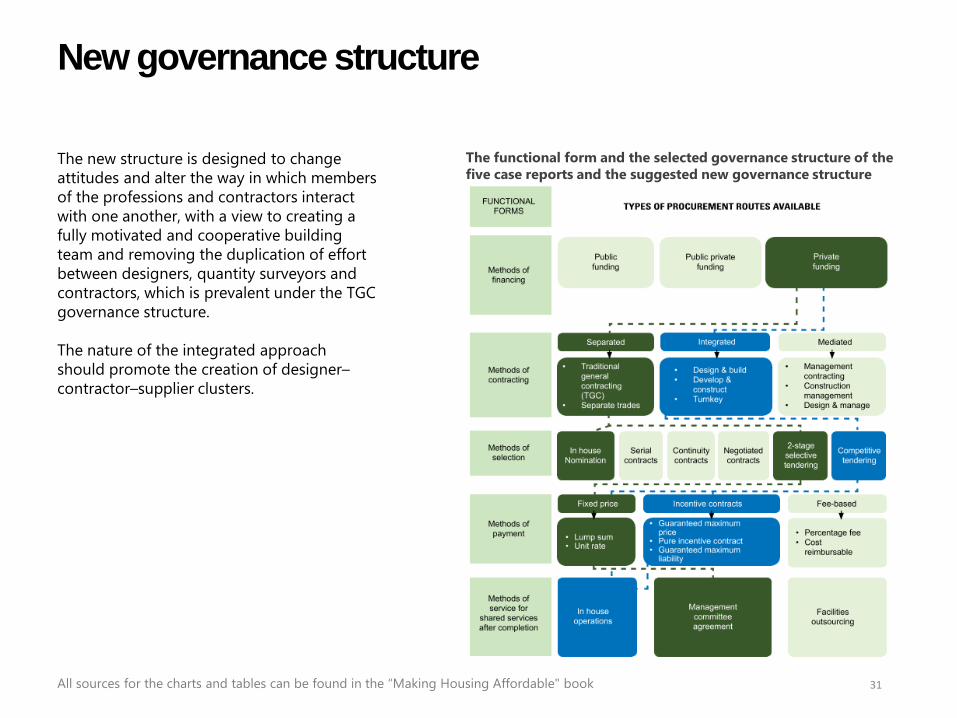
The new structure is designed to change attitudes and alter the way in which members of the professions and contractors interact with one another, with a view to creating a fully motivated and cooperative building team and removing the duplication of effort between designers, quantity surveyors and contractors, which is prevalent under the TGC governance structure.
The nature of the integrated approach should promote the creation of designer–contractor–supplier clusters.
The functional form and the selected governance structure of the five case reports and the suggested new governance structure
Develop Measures to Improve the Efficacy of the Construction Industry’s Delivery System to Supply Housing at Affordable Prices
32 All sources for the charts and tables can be found in the “Making Housing Affordable" book
The existing national business system for construction is one which is highly fragmented, underpinned by a rigid procurement system that provides little incentive for innovation, which in turn reduces efficiencies and keeps costs high.
Property developers rely on construction firms to innovate without themselves investing financially in research and development and innovative production methods. Contractors on the other hand depend solely on external IBS or proprietary systems. Lack of training for construction workers will mean that the design will not be able to be assembled on site.
The 11th Malaysian plan has in its Strategy D2, a focus on driving productivity by increasing technology adoption, modernisation of construction methods and on reducing dependency on low-skilled labour. It also encourages the adoption of the IBS by the industry through revision of the public procurement policy and Uniform Building By-Laws; as well as wanting to improve on existing regulations to ease construction-related business processes. The following policy recommendation and steps will attain the desired objectives of Strategy D2.
1. A new designated procurement delivery system that allows for the consolidation of the resources of firms within the supply chain. This entails a move from using the TGC procurement route towards a design-and-build or turnkey governance structure and forming framework agreements with the material supply section.
2. Extending the consolidation of the supply chain in the design-and-build approach into a clustering approach with key material supply firms under a framework agreement would enable a strong resilient housing supply cluster to be built.
The policy recommendation is to develop a designated procurement route to consolidate the resources of the firms involved in delivering affordable houses
Develop Measures to Improve the Efficacy of the Construction Industry’s Delivery System to Supply Housing at Affordable Prices (cont’d)
33 All sources for the charts and tables can be found in the “Making Housing Affordable" book
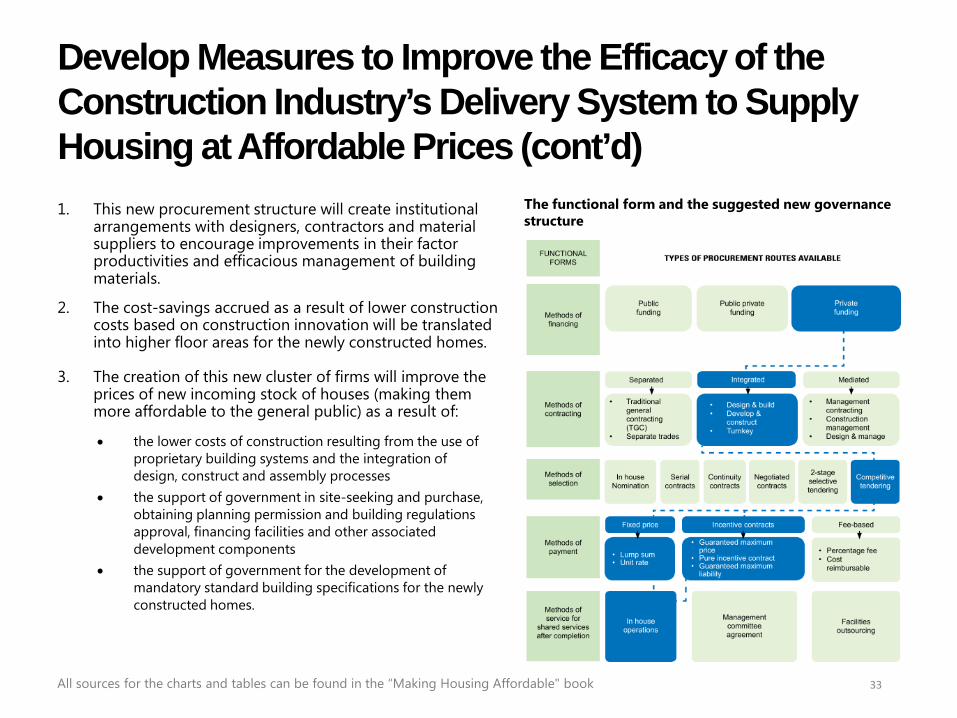
1. This new procurement structure will create institutional arrangements with designers, contractors and material suppliers to encourage improvements in their factor productivities and efficacious management of building materials.
2. The cost-savings accrued as a result of lower construction costs based on construction innovation will be translated into higher floor areas for the newly constructed homes.
3. The creation of this new cluster of firms will improve the prices of new incoming stock of houses (making them more affordable to the general public) as a result of:
The functional form and the suggested new governance structure
• the lower costs of construction resulting from the use of proprietary building systems and the integration of design, construct and assembly processes
• the support of government in site-seeking and purchase, obtaining planning permission and building regulations approval, financing facilities and other associated development components
• the support of government for the development of mandatory standard building specifications for the newly constructed homes.

Develop Measures to Reduce Pressures Leading to Rapid House Price Escalation
34 All sources for the charts and tables can be found in the “Making Housing Affordable" book
1. The supply of new stock of houses produced through the newly-designed procurement route needs to be insulated from short-term speculative behaviour in order for the initiative to be successful.
2. For houses built through the new designated procurement route, a moratorium is needed to create a buffer period for new stock to come in at affordable prices as well. If the new stock is affordable and costs are lower than the speculative prices, this will evidently diminish the gains from speculative activities. A moratorium has the objective of curbing the rapid price escalation of houses. Therefore, if there is an urgent sale before the period of five years, then the unit can still be sold but based on nominal values.
Land is a derived demand and the rapid escalation of house prices will induce bidding for land prices to its maximum potential returns away from other types of competing uses. From 2000 to 2014, the Malaysian house price index showed a compound annual growth rate of 5.6% as well as an overall increase of 131.5% in house prices. Short-term speculative behaviour will only serve to increase house prices and therefore the derived demand for land in an artificial way, but the impact is permanent. As can be seen from the house price theory and the dominance of existing stocks from incoming flows, the existing stock of houses will determine the prices of new stock. Ceteris paribus, when no other cost items are increasing, the high economic rent of proposed new stock will be used to bid higher prices for land. This creates a vicious cycle of escalating land and house prices.
The policy recommendation is to impose a moratorium of five years on selling houses that are built through the new designated procurement route:
Develop Measures to Plan for a Steady Supply of Housing at Affordable Prices
35 All sources for the charts and tables can be found in the “Making Housing Affordable" book
The policy recommendation is to undertake a National Housing Survey. The 11th Malaysia Plan has highlighted the mismatch in demand and supply for affordable housing. The document highlighted the escalating House Prices in Major Cities (following the World Bank Affordability Index which is three times the annual household income) and cited the lack of integrated planning and implementation as one of the reasons for this problem. In Strategy B2: Strengthening planning and implementation for better management of public housing, the document recommends the establishment of an integrated database for all relevant stakeholders (to ensure housing supply matches demand according to locality, price and target groups). The policy option of creating a National Housing Survey as detailed (see next slide) will have the desired outcome of Strategy B2.
It is difficult to plan for a steady supply of stock that will effectively reduce the inflationary pressures of an inelastic supply when effective demand can neither be estimated at the state nor at the mukim level. Effective demand for housing is dynamic in nature since it reflects the demographics and future prospects of the local population at each specific site. There is also an internal dynamism at the level of the individual family in terms of the types of housing demanded according to family composition and the progressive changes in families’ income in the long term. While the objective of the National Housing Policy is to provide adequate, comfortable, good-quality and affordable houses to improve the wellbeing of the people, it does not provide the data and evidence on this housing need or on the effective demand that would be necessary to implement the policy in a coherent and sustainable manner.

Develop Measures to Plan for a Steady Supply of Housing at Affordable Prices (cont’d)
36 All sources for the charts and tables can be found in the “Making Housing Affordable" book
1. A National Housing Survey will provide guidance to Federal and State governments and local authorities, enabling them to plan for a steady supply of housing at affordable prices through housing programmes at the mukim level, which are based on effective demand and land suitability.
2. If made public, information collected in the National Housing Survey will also provide the general public with the requisite knowledge to make better house-buying decisions. As housing consumes a significant proportion of their household incomes, the general public needs to be able to plan for the purchase and to choose between different types of houses at different prices, which in turn will lead to better financial planning on their part as well.
3. The proposed National Housing Survey should include:
• demand-side analysis: covering the distinct demographic patterns between States at the mukim level (for example, whether mukims consist predominantly of young dependents and families, working populations or retirees) and incomes.
• supply-side analysis: a land suitability assessment including the current land-use patterns and zones.
The demand- and supply-side survey and analysis performed for each state could be repeated every five years to reflect the dynamic and organic nature of housing programmes.

Develop Measures to Plan for a Steady Supply of Housing at Affordable Prices (cont’d)
37 All sources for the charts and tables can be found in the “Making Housing Affordable" book
The National Housing Survey will provide input to each State to enable it to plan for adequate and suitable housing stock to meet the different needs of the general population at strategic locations. The state and local councils would be required to monitor the quality and quantity of these new housing stocks and provide more information (input) for the next National Housing Survey.
1. Currently, there is data available to undertake a supply-side housing land and suitability model. However, the demand-side data is limited, hence the need to undertake a National Housing Survey. Both sets of demand and supply conditions could then be analysed to determine the need and policy appropriate at each state and district level. The National Housing Survey will enable the development of various models with greater resolution and accuracy. This will provide information on the different solutions needed for each state. Among the possible outputs are:
• population forecasts • housing demand range • migration patterns • household size by housing type • social housing against social economic variables • land suitability for different housing types.
2. The National Housing Survey would be best undertaken by both the Federal Town and Country Planning Department (JPBD) and the National Housing Department (JPN).
Summary of Key Findings and Policy Recommendations
38 All sources for the charts and tables can be found in the “Making Housing Affordable" book
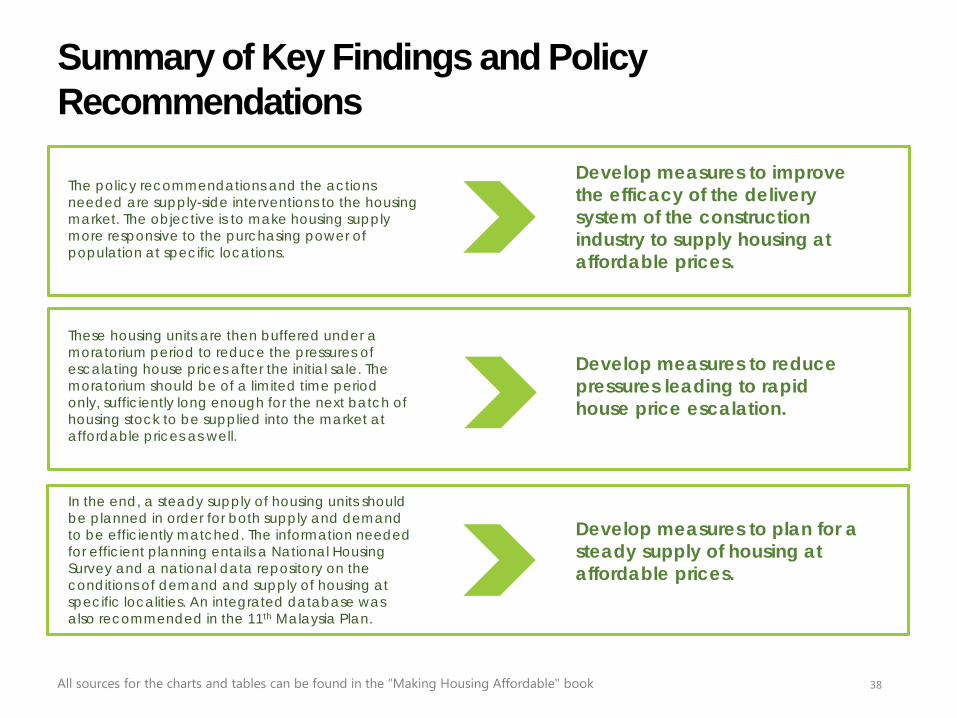
Develop measures to improve the efficacy of the delivery system of the construction industry to supply housing at affordable prices.
The policy recommendations and the actions needed are supply-side interventions to the housing market. The objective is to make housing supply more responsive to the purchasing power of population at specific locations.
Develop measures to reduce pressures leading to rapid house price escalation.
These housing units are then buffered under a moratorium period to reduce the pressures of escalating house prices after the initial sale. The moratorium should be of a limited time period only, sufficiently long enough for the next batch of housing stock to be supplied into the market at affordable prices as well.
Develop measures to plan for a steady supply of housing at affordable prices.
In the end, a steady supply of housing units should be planned in order for both supply and demand to be efficiently matched. The information needed for efficient planning entails a National Housing Survey and a national data repository on the conditions of demand and supply of housing at specific localities. An integrated database was also recommended in the 11th Malaysia Plan.

Concluding remarks

Concluding Remarks
40 All sources for the charts and tables can be found in the “Making Housing Affordable" book
In most developed countries, issues of affordability for the economically disadvantaged are dealt through social housing schemes. Social housing is seen as a necessary means of ensuring a decent home for all. However, in certain countries, this means housing very few households directly, while at the other extreme, the scale of provision can be as high as one in three households. The trends in Malaysia suggest that both the bottom 40% and the middle 40% of household income earners are likely to end up in some form of social housing if the relevant interventions are not made urgently. The available evidence suggests that unless immediate action is taken, the provision of social housing for the vast majority of the population will put unnecessary financial pressures on government spending. It makes more economic sense to ensure that the purchase of a home is financially viable to the general public than it does to rely on existing models for the provision of social housing.


