1 27 June 2017 BENCHMARK HOLDINGS PLC (“Benchmark” or the “Company” or the “Group”) INTERIM RESULTS 2017 Benchmark, the aquaculture biotechnology and food chain sustainability business announces its Interim Results for the six months ended 31 March 2017 (the “period”). £m H1 2017 H1 2016 FY 2016 Revenue 69.2 48.0 109.4 Adjusted EBITDA 1 3.3 3.0 9.2 Operating loss (6.7) (15.2) (20.5) Basic loss per share (pence) (1.58) (3.09) (4.39) Net (debt) / cash (12.8) (14.6) 0.4 Financial Highlights: • Revenue increased by 44% to £69.2m (H1 2016: £48.0m). Like-for-like sales, excluding businesses acquired in 2016, increased 14% to £31.0m (H1 2016: £27.3m). • Adjusted EBITDA 1 grew by 10% to £3.3m (H1 2016: £3.0m) • Reduced operating loss reflects: o full period impact from acquisition of INVE o a net credit of £1.9m (H1 2016: £12.1m expense) in exceptional and acquisition related expenditure resulting from a release of a provision for deferred consideration for an earlier acquisition, o offset by an increased charge for depreciation and amortisation of £11.8m (H1 2016: £6.1m) principally from the inclusion of INVE for a full six months. • Expensed R&D remained in line with the previous year at £6.4m (H1 2016: £6.0m) reflecting measured progress with, and prioritisation of, focused investment in the new product pipeline. • Construction continued on the combined land and sea based biosecure salmon production facility in Norway with £7.4m invested by Benchmark in the period. Completion expected 2019. Operational highlights: • Progress made on key strategic investment objectives: o Long-term collaboration agreement signed with Salmar, one of the world’s leading salmon producers, to provide breeding and genetics services and products related to Atlantic salmon, including R&D services and production of salmon eggs.
Transcript
1
27 June 2017 BENCHMARK HOLDINGS PLC
(“Benchmark” or the “Company” or the “Group”)
INTERIM RESULTS 2017
Benchmark, the aquaculture biotechnology and food chain sustainability business announces its Interim Results for the six months ended 31 March 2017 (the “period”).
£m H1 2017 H1 2016 FY 2016
Revenue 69.2 48.0 109.4
Adjusted EBITDA1 3.3 3.0 9.2
Operating loss (6.7) (15.2) (20.5)
Basic loss per share (pence) (1.58) (3.09) (4.39)
Net (debt) / cash (12.8) (14.6) 0.4
Financial Highlights:
• Revenue increased by 44% to £69.2m (H1 2016: £48.0m). Like-for-like sales, excluding businesses acquired in 2016, increased 14% to £31.0m (H1 2016: £27.3m).
• Adjusted EBITDA1 grew by 10% to £3.3m (H1 2016: £3.0m)
• Reduced operating loss reflects:
o full period impact from acquisition of INVE
o a net credit of £1.9m (H1 2016: £12.1m expense) in exceptional and acquisition related expenditure resulting from a release of a provision for deferred consideration for an earlier acquisition,
o offset by an increased charge for depreciation and amortisation of £11.8m (H1 2016: £6.1m) principally from the inclusion of INVE for a full six months.
• Expensed R&D remained in line with the previous year at £6.4m (H1 2016: £6.0m) reflecting measured progress with, and prioritisation of, focused investment in the new product pipeline.
• Construction continued on the combined land and sea based biosecure salmon production facility in Norway with £7.4m invested by Benchmark in the period. Completion expected 2019.
Operational highlights:
• Progress made on key strategic investment objectives:
o Long-term collaboration agreement signed with Salmar, one of the world’s leading salmon producers, to provide breeding and genetics services and products related to Atlantic salmon, including R&D services and production of salmon eggs.
2
o Further opportunities for commercial collaboration in breeding and nutrition were advanced. Contract signed with Thailand’s largest tilapia producer, Manit Farms, to distribute INVE probiotic water quality management technology.
o Continued progress in the development pipeline through targeted investment in scientific research and development, with a clear focus on 2-3 headline products which are expected to launch before the end of 2017.
o Good progress made towards the commercial field trials launch of these headline products, including ground-breaking sea lice treatment and delivery method. This moves us closer to significant organic growth as the rate of pipeline product launches increases.
• Improved performance in Breeding and Genetics with recovery in sales of salmon eggs to Chile and growth in sales volumes and prices in other markets and species
• Signs of growth returning in shrimp markets despite challenges faced by the industry and Benchmark is well positioned to leverage its distribution network and position in the market
• Benchmark’s new vaccine manufacturing facility at Braintree is now in the commissioning phase, with first commercial batches expected in H2 2017. This is a key step to securing the Group’s supply chain and protecting its know-how, as well as providing manufacturing capacity
• Continued progress made with the development of top line synergies across the Group
• Rate of new headcount growth slowed reflecting the policy to phase additions in parallel with top line growth. The majority of the increase of 31 to 915 at end H1 (FY 2016: 884) relates to the launch of new production facilities
Alex Hambro, Chairman of Benchmark, said: “I am pleased to report that the Group is increasingly recognised by its customers, some of the world’s largest aquaculture producers, as a leading technology partner. The platform Benchmark has built over the last three years is delivering products with significant commercial potential, and the management team has displayed clear focus in its prioritisation of 2-3 key products which we expect to launch by the end of 2017. The Company’s foresight and dynamic development of the new product pipeline ensures that, as predicted disease pressures grow in certain species (such as salmon), pipeline products which have already been in development for a number of years are introduced to address those pressures. Benchmark’s diversification strategy has also proved prudent, with adjusted EBITDA up 10% despite headwinds in business segments which had traditionally contributed significantly. There is a genuine feeling of excitement around those products which are near launch, and I look forward to updating shareholders on further progress at the Preliminary Results.” Interim Report The Company's Interim Report for the period ended 31 March 2017 will shortly be available to view on the Company's website (www.benchmarkplc.com).
Tavistock Tel: 020 7920 3150 Simon Hudson / Niall Walsh / Sophie Praill
For further information on Benchmark please visit www.benchmarkplc.com 1. Adjusted EBITDA is earnings before interest, tax, depreciation, amortisation, exceptional items and acquisition related
expenditure. In the period to 31 March 2017, acquisition related costs were a net credit of £2.1m (H1 2016: £11.8m expense; FY 2016: £12.9m expense), and exceptional items were £0.2m (H1 2016: £0.3m; FY 2016: £0.1m).
Benchmark Holdings plc – Interim Report for the six months ended 31 March 2017
Chairman’s Statement
4
CHAIRMAN’S STATEMENT I am pleased to report the Group’s Interim Results for the period to 31 March 2017. The first six months of the financial year has been a period of consolidation and progress as we deliver our key strategic objective of gaining market share and exploiting the long-term growth being experienced in the aquaculture industry. This is being achieved by providing a complete suite of technological solutions to existing and new customers, and by exploiting the synergies available between the different technologies and additional routes to market in the recently expanded Benchmark Group. Progress has been pleasing despite headwinds in some of our key markets. In the shrimp sector, specific disease challenges coupled with low market prices resulted in delayed customer investment and lower growth rates in the first half year. The Group has proceeded selectively with new capital investment plans, whilst continuing to progress core infrastructure projects which support long-term growth. Development of the Group-wide customer account management programme continues to demonstrate and promote the full benefit of Benchmark’s integrated technology solutions in aquaculture. Recognition of this progress was received in the period when Benchmark signed a long-term collaboration agreement with Salmar, one of the world’s largest salmon producers, to provide breeding and genetics services and products related to Atlantic salmon, including R&D services and production of salmon eggs. This is a positive acknowledgment of the benefits customers are seeing in our technology platform for their businesses. Focus is also being placed on growing sales and market share in other developing markets, including China, for the benefit of the Group’s Breeding and Genetics and Advanced Animal Nutrition divisions. During the period a new distribution contract for probiotic water quality management technology was signed with Manit Farms (Thailand’s largest breeder of tilapia). Similar combined business developments in the tilapia market are in progress in Asia and Latin America. Integration and commercial development of the INVE business has progressed well. The business has, however, continued to face headwinds in the shrimp markets in Asia and trading has followed a similar pattern to last year with a late start to the season. We are now seeing early signs of a more general recovery in shrimp prices and in the global shrimp markets and our long-term expectations for the market remain strong. As anticipated, the Animal Health division experienced low demand for Salmosan in Norway compared to last year due to the development of partial resistance to Salmosan and the renewed industry focus on developing new mechanical treatments for the significant sea lice challenge. In response, the division has focused on the development of its ground-breaking new sea lice treatment, which is scheduled to commence commercial field trials and contribute substantially in the second half of the year. This new sea lice treatment will enhance the suite of solutions that we provide to tackle what is the largest problem for the salmon production industry. This is a good example of the Group’s programme approach to new product development where we target a range of complementary technologies that together aim to solve a significant problem faced in aquaculture. Development of the Group’s product pipeline has continued to move forward in the period. Six of the products in the Animal Health division’s portfolio moved forward one step in the development process, while in the Advanced Animal Nutrition division, good progress was made towards the target of 100% substitution of live feed with replacement diet products for juvenile shrimp. This is key to ensuring there is sufficient supply of early stage feed for the shrimp production industry to unlock its future growth potential. The total Group new product pipeline includes 81 products with total peak projected annual sales of £718m. We anticipate an increasing number of product launches through FY18 and FY19.
Benchmark Holdings plc – Interim Report for the six months ended 31 March 2017
Chairman’s Statement
5
Results Revenue for the period increased by 44% to £69.2m (H1 2016: £48.0m; FY 2016: £109.4m), with the inclusion of INVE Aquaculture for the full six months rather than three months in the first half of last year (£17.3m increase) and strong growth in the Breeding and Genetics division (£8.1m). The latter has arisen from recovery of salmon egg sales in Chile where the border to imports was closed throughout H1 2016, from volume and unit price growth in other markets and partially from favourable currency exchange rates meaning revenue for that division increased 76% to £18.8m (H1 2016: £10.7m; FY 2016: £20.7m). This improvement was offset by lower revenue in the Animal Health division which fell to £7.2m (H1 2016: £12.2m; FY 2016: £24.8m). As noted above, demand for Salmosan in Norway was anticipated to be low as the industry focused on new solutions to the significant sea lice challenge. Like-for-like sales excluding acquisitions in the prior period increased by 14% as the improved performance in the Breeding and Genetics division offset the lower activity in the Animal Health division. In previous years, the Group separated the statutory IFRS results into Trading Activities and Investing Activities to present better the underlying performance and development of the business. However, following the rapid growth of the Group, both organic and through acquisition, the proportion of operating results relating to early stage business has fallen significantly. Consequently, the Board now monitors “Adjusted EBITDA” to track performance of the Group’s operations, being earnings before interest, tax, depreciation and amortisation (“EBITDA”), before exceptional and acquisition related expenditure. Operating costs in the first half increased 48% to £26.7m (H1 2016: £18.0m; FY 2016: £41.6m), reflecting a full period of inclusion of the Advanced Animal Nutrition division compared to three months in H1 2016 (an increase of £6.7m to £10.8m). As well as arising from a modest increase in headcount in the Group (Group headcount at the half year was 915 (FY 2016: 884)), the bulk of the remaining increase arose in the Breeding and Genetics division and in corporate overheads. The Breeding and Genetics division saw increased activity in the period, including the operating costs of Genetica Spring which acquired the Colombian shrimp breeding business in H2 2016 and higher costs arising from foreign exchange rate movements. The Group has implemented successful measures to control many areas of operational expenditure. Corporate overheads increased by £1.6m as the organisational structure was developed to meet the requirements of an enlarged business. Investment in scientific research and development on the Group’s product pipeline has remained at a similar level year on year. R&D expenditure in the first half was £6.4m (H1 2016: £6.0m; FY 2016: £11.7m), as we manage our investments against the balance of near and longer term opportunities. Adjusted EBITDA in the first six months was £3.3m, an increase of £0.3m compared to H1 2016 (H1 2016: £3.0m; FY 2016: £9.2m). The increase includes a full period of trading of INVE Aquaculture with adjusted EBITDA of £8.3m (H1 2016: £6.3m; FY 2016: £15.9m) and growth in the Breeding and Genetics division as noted above and also the reduced revenue in the Animal Health division which saw adjusted EBITDA for the division fall to a loss of £5.8m (H1 2016: £2.4m loss; FY 2016: £4.2m loss). This division is expected to see significant improvement in H2 following the anticipated commercial field trials launch of a ground-breaking sea lice treatment as noted above. Divisional results are shown in Note 7 to the interim statement. EBITDA after taking into account the exceptional and acquisition costs rose significantly to £5.2m in the period (H1 2016: £9.1m loss; FY 2016: £3.9m). Exceptional items and acquisition related costs in the period were a credit of £1.9m, following an exceptional credit of £2.8m from the release of a provision for deferred consideration related to the acquisition of Salmobreed which is no longer thought likely to be payable. Furthermore, the result in H1 2016 included acquisition costs of £12.9m principally on the acquisition of the INVE group and related funding. Operating loss for the period of £6.7m is an improvement of £8.5m on the previous year (H1 2016: £15.2m loss; FY 2016: £20.5m) as a full period of depreciation and amortisation on the assets acquired in the purchase of the INVE
Benchmark Holdings plc – Interim Report for the six months ended 31 March 2017
Chairman’s Statement
6
group offset the improved earnings outlined above. Amortisation in the period was £9.5m, up £4.5m on the previous period. Basic and diluted loss per share was 1.58p (H1 2016: 3.09p; FY 2016: 4.39p). Strategy and markets Benchmark’s strategy is to:
— Take a leadership position in aquaculture technology
— Have first-mover advantage in high-growth markets
— Tackle deep-rooted aquaculture issues in more mature markets We execute this by:
— Combining the fundamental biology disciplines in one aquaculture technology powerhouse with access to the entire market
— Developing and selling innovative products rich in intellectual property that deliver high margins and visibility of earnings
— Exploiting our scalable platform of production capacity and technology
— Utilising our insight into the challenges faced to partner with major food producers to drive improvement in their profitability
By executing this strategy we will continue to build a business of significant value. Despite the softness in global shrimp markets, the Group’s projections for growth in global aquaculture remain positive. The long-term drivers of growth in the Group's sectors, which include the growing global demand for innovative aquaculture products and an ever-increasing pressure to limit the use of antibiotics in the food chain, remain strong, with increasing momentum and interest in the aquaculture market. Benchmark’s strategy of offering an integrated package of both products and services to its customers is increasingly being recognised across the industry, particularly in the animal health and genetics sectors. We are excited about the potential shown by the new technologies in our research programmes and product pipeline. The application of this technology remains at the heart of what we do. Our focus on growing sales and market share in developing markets, including China, is progressing towards establishing strategic relationships with major participants in those regions. In the first phase of synergy generation, we see value in the opportunity to combine advanced nutrition and genetics in the shrimp and tilapia industries. Operations Animal Health Division As anticipated, the division has experienced low demand for Salmosan in our largest market in Norway, where the salmon industry has been focussed on trialling different new solutions to the sea lice challenge. However, sales in other global markets have partially offset this, particularly in Canada and the UK. With revenue £5.0m lower than in the comparative period in 2016, adjusted EBITDA for the division in the period was a loss of £5.8m (H1 2016: loss of £2.4m; FY 2016: loss of £4.2m).
Benchmark Holdings plc – Interim Report for the six months ended 31 March 2017
Chairman’s Statement
7
We are excited about the anticipated launch of our new sea lice treatment system and medicine which we expect to enter field trials in the next few weeks. Equipment and arrangements with customers are nearly in place and the first phase of field trials licences are in hand. Significant revenues are anticipated in the second half of the year and beyond, with the market welcoming a new and effective treatment for one of the greatest challenges it faces. The launch of this new sea lice product is expected to be complementary to Salmosan sales as it will enable more rotation of sea lice treatments and hence promote efficacy. Practical completion of the division’s new vaccine manufacturing capacity at Braintree was received in May, and validation is now underway with the first production expected to be complete in the second half of the year. The Group’s pipeline of new products includes 31 vaccines, the majority of which will be produced in Braintree. The division’s product pipeline includes 46 products with combined peak projected annual sales of £552m. During the period four discovery stage development products were dropped as early tests demonstrated insufficient evidence of technical or commercial feasibility. Breeding and Genetics Division The expanding Breeding and Genetics division has continued to demonstrate pleasing performance, assisted by partial recovery in the Chilean markets after the closure of the border to imports in the previous season. As well as this, we have seen growth in market share in other markets, and preparations are advanced for the launch of disease resistant shrimp breeding stock from the programme which was acquired from Ceniacua in the second half of last year. Commercial trials of the stock are being prepared in six of the major shrimp producing countries in Latin America and Asia. Following the increased activity in the period, adjusted EBITDA for the division was £2.8m (H1 2016: £0.9m; FY 2016: £1.4m). In March, we signed a long-term collaboration agreement with Salmar ASA, to provide breeding and genetics services and products related to Atlantic salmon, including R&D activities and production of salmon eggs. As part of the collaboration, a newly created 50/50 joint venture company, Salmar Genetics AS, has been established, and Benchmark is now managing Salmar’s genetic programme. This is a strong sign of the recognition by our customers of the unique complete suite of aquaculture services which can be tailored to the individual needs of each of our customers. Work is well underway on the new land-based, biosecure broodstock farm in northern Norway, with £7.4m invested in the period. As well as increasing capacity, this will allow us to produce Norwegian salmon eggs all year round, underpinning our strong position in the market. The recovery in salmon egg sales from Iceland to Chile continues and we are reviewing our strategy in order to reduce risk of any future border closures. We are making good progress in sales from Iceland to other key salmon markets including Canada, Scotland and the domestic Icelandic market. Advanced Animal Nutrition Division The division was formed upon the acquisition of INVE in December 2015, and therefore has been included for the whole of the half year for the first time this year. The disease challenge in the global shrimp markets which impacted the second half of 2016 continued into H1 2017, so there has been a late start to the season this year. Despite this challenge, integration and commercial development of the INVE business has shown pleasing progress, and we are now starting to see early signs of a more general recovery, so remain positive in our long-term outlook. Adjusted EBITDA for the period was £8.3m (H1 2016: £6.3m; FY 2016: £15.9m). Work on developing synergies in the tilapia markets and for the cleaner fish market in the Salmon industry is making good progress.
Benchmark Holdings plc – Interim Report for the six months ended 31 March 2017
Chairman’s Statement
8
In addition to the good progress made towards a 100% replacement diet both for shrimp and for marine fish, six products in the division’s pipeline moved to the next stage of the development pathway with several nearing launch. Knowledge Services – Sustainability Science and Technical Publishing divisions We continue to provide consultancy, R&D services, education and knowledge transfer for people and businesses in the agriculture, aquaculture, veterinary and global food supply chain industries, through our expertise across all parts of the food chain and our working research farms and sites. The new trials facility in Ardtoe is now online and is providing the infrastructure to support and deliver the Group’s development portfolio. During the period, vital testing of the new sea lice treatment was conducted at the site speeding up the development process. We commenced the production of lumpfish in the year at our new hatcheries in Northern Scotland. The first sales of lumpfish will take place in the second half. The results for the division are slightly behind the previous year with adjusted EBITDA showing a loss of £0.5m (H1 2016: £0.3m loss; FY 2016: £1.4m loss), reflecting the early stage of this production. Improve International established a new Veterinary Education and Training Facility in the period in Sheffield and this has seen good uptake of bookings since opening in May. Aquaculture UK has launched the new Aquaculture Conference 2017 which was held in Stirling in June. 200 delegates attended and the event included the 2018 Scottish Marine Aquaculture Awards which were formerly run by The Crown Estate. Funding The Group continues to use its revolving credit facility to fund operations. The facility allows up to $70m to be drawn, with $50m being drawn down throughout the first half. The balance of the facility remains available to fund working capital and small scale capital projects, with leverage and interest cover covenants tested on a quarterly basis. Cashflow and Net Debt Net cashflow from operating activities in the period was an increase in cash of £0.5m (H1 2016: £8.9m outflow; FY 2016: £10.5m outflow). This is a result of the improvement in EBITDA, including the impact of the acquisition costs incurred in the prior year as discussed above. After payments to purchase tangible and intangible fixed assets of £11.8m, principally in the Breeding and Genetics division (including the ongoing construction of the new salmon egg production facility in Norway) net cash outflow in the period was £11.8m (H1 2016: £9.5m inflow; FY 2016: £24.6m inflow). The comparative periods produced net cash inflows due to funds raised from the two share placings in the year (H1 2016: £181.3m net of costs: FY 2016: £211.8m net of costs), the proceeds of which were used to fund the INVE Aquaculture acquisition, a South American shrimp breeding programme and other strategically important projects including the Norwegian biosecure facility construction project. Net debt at the end of H1 was £12.8m (H1 2016: £14.6m; FY 2016: net cash £0.4m) Taxation There was a tax credit of £0.7m in the period (H1 2016: £1.3m credit: FY 2016: £4.0m credit) with a deferred tax credit of £2.9m offsetting current tax charges of £2.2m on overseas profits. The deferred tax credit principally arose from the reversal of timing differences from amortisation of the intangible assets arising on consolidation on recent acquisitions. After the credit for the period, the deferred tax liability remaining on these timing differences was £61.0m of the total group deferred tax liability of £62.4m.
Benchmark Holdings plc – Interim Report for the six months ended 31 March 2017
Chairman’s Statement
9
Dividend No dividends have been paid or proposed in the six months to 31 March 2017. Outlook The board anticipates that group results for the full year will be broadly in line with its expectations, despite the late start to the shrimp production season caused by the ongoing disease challenge, and the field trials launch of our new sea lice treatment occurring later in the year than anticipated. There are continuing signs of growth returning to the shrimp sector and we expect the shrimp market to show recovery as the disease challenge is managed. The commercial field trials launch of our ground-breaking new sea lice treatment is expected in the coming weeks and significant revenues from this product are anticipated in H2 2017 and beyond, which are projected to support achievement of the Board's expectations for FY 2017 in light of reducing sales of our existing sea lice treatment, Salmosan. An increasingly important driver of our organic growth will be the delivery of commercial sales from our robust pipeline of new products and, although the exact timing of new product launches is difficult to predict, a growing number of these are expected to come to market during 2017 to 2019 covering each of the key aquaculture species, with particular focus on 2-3 key products which the Company expects to commercialise in 2018. The long-term drivers of growth in the aquaculture sector remain very positive and this will continue to benefit the Group in the years to come. With new markets such as China providing potential opportunity for significant growth, and customers becoming more familiar with our integrated offering, we look forward to the future of the Blue Revolution with great confidence. The Hon. Alexander Hambro Chairman 27 June 2017
Benchmark Holdings plc
Independent Review Report to Benchmark Holdings plc
10
Conclusion
We have been engaged by the company to review the condensed set of financial statements in the half-yearly report for the six months ended 31 March 2017 which comprises the consolidated income statement, the consolidated statement of comprehensive income, the consolidated balance sheet, the consolidated statement of changes in equity, the consolidated cash flow statement and the related explanatory notes.
Based on our review, nothing has come to our attention that causes us to believe that the condensed set of financial statements in the half-yearly report for the six months ended 31 March 2017 is not prepared, in all material respects, in accordance with the recognition and measurement requirements of International Financial Reporting Standards (IFRSs) as adopted by the EU and the AIM Rules
Scope of review
We conducted our review in accordance with International Standard on Review Engagements (UK and Ireland) 2410 Review of Interim Financial Information Performed by the Independent Auditor of the Entity issued by the Auditing Practices Board for use in the UK. A review of interim financial information consists of making enquiries, primarily of persons responsible for financial and accounting matters, and applying analytical and other review procedures. We read the other information contained in the half-yearly report and consider whether it contains any apparent misstatements or material inconsistencies with the information in the condensed set of financial statements.
A review is substantially less in scope than an audit conducted in accordance with International Standards on Auditing (UK) and consequently does not enable us to obtain assurance that we would become aware of all significant matters that might be identified in an audit. Accordingly, we do not express an audit opinion.
Directors’ responsibilities
The half-yearly report is the responsibility of, and has been approved by, the directors. The directors are responsible for preparing the half-yearly report in accordance with the AIM Rules.
As disclosed in note 2, the annual financial statements of the group are prepared in accordance with IFRSs as adopted by the EU. The directors are responsible for preparing the condensed set of financial statements included in the half-yearly financial report in accordance with the recognition and measurement requirements of IFRSs as adopted by the EU.
Our responsibility
Our responsibility is to express to the company a conclusion on the condensed set of financial statements in the half-yearly report based on our review
The purpose of our review work and to whom we owe our responsibilities
This report is made solely to the company in accordance with the terms of our engagement. Our review has been undertaken so that we might state to the company those matters we are required to state to it in this report and for no other purpose. To the fullest extent permitted by law, we do not accept or assume responsibility to anyone other than the company for our review work, for this report, or for the conclusions we have reached.
Ian Beaumont for and on behalf of KPMG LLP Chartered Accountants 1 Sovereign Square, Sovereign Street, Leeds, LS1 4DA 27 June 2017
Benchmark Holdings plc
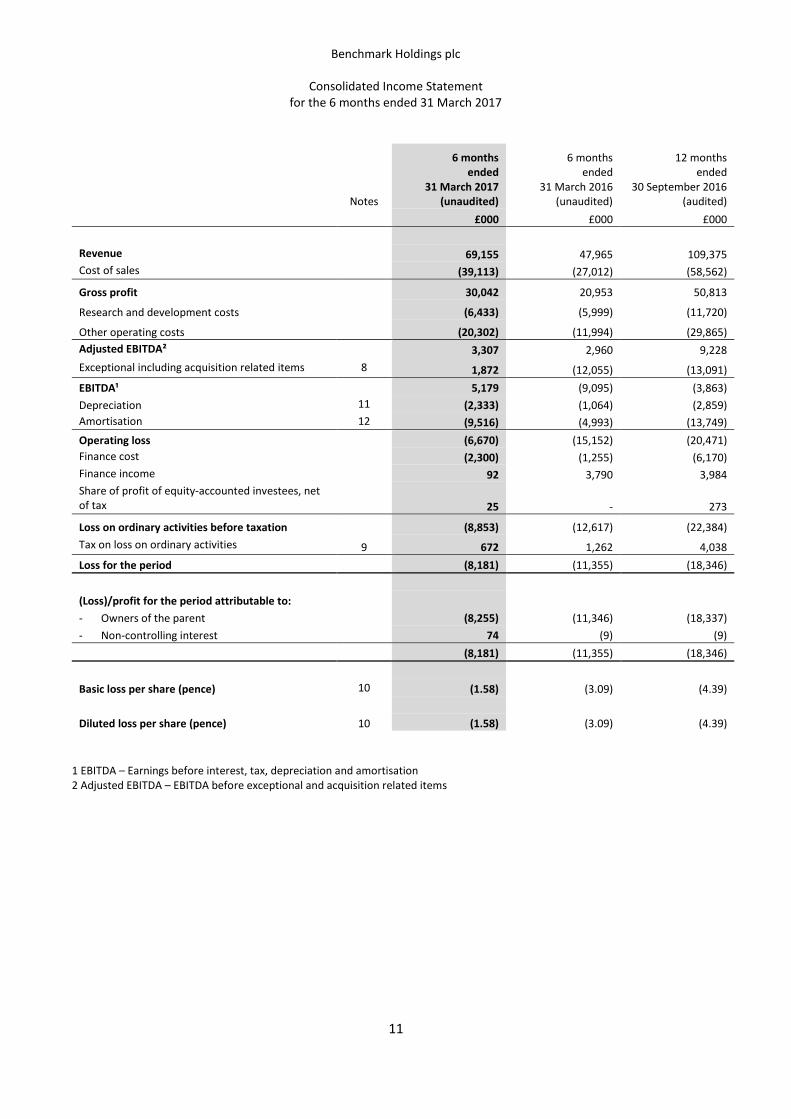
Consolidated Income Statement for the 6 months ended 31 March 2017
Research and development costs (6,433) (5,999) (11,720)
Other operating costs (20,302) (11,994) (29,865) Adjusted EBITDA² 3,307 2,960 9,228 Exceptional including acquisition related items 8 1,872 (12,055) (13,091) EBITDA¹ 5,179 (9,095) (3,863) Depreciation 11 (2,333) (1,064) (2,859) Amortisation 12 (9,516) (4,993) (13,749) Operating loss (6,670) (15,152) (20,471) Finance cost (2,300) (1,255) (6,170) Finance income 92 3,790 3,984 Share of profit of equity-accounted investees, net of tax 25 - 273
Loss on ordinary activities before taxation (8,853) (12,617) (22,384) Tax on loss on ordinary activities 9 672 1,262 4,038 Loss for the period (8,181) (11,355) (18,346) (Loss)/profit for the period attributable to: - Owners of the parent (8,255) (11,346) (18,337) - Non-controlling interest 74 (9) (9) (8,181) (11,355) (18,346)
Basic loss per share (pence) 10 (1.58) (3.09) (4.39)
Diluted loss per share (pence) 10 (1.58) (3.09) (4.39)
1 EBITDA – Earnings before interest, tax, depreciation and amortisation 2 Adjusted EBITDA – EBITDA before exceptional and acquisition related items
Benchmark Holdings plc
Consolidated Statement of Comprehensive Income for the 6 months ended 31 March 2017
12
6 months
ended 31 March 2017
(unaudited)
6 months ended
31 March 2016 (unaudited)
12 months ended
30 September 2016 (audited)
£000 £000 £000 Loss for the period (8,181) (11,355) (18,346)
Other comprehensive income
Items that are or may be reclassified subsequently to profit or loss
Movement on foreign exchange reserve 9,234 13,146 48,386
Total comprehensive income for the period 1,053 1,791 30,040
Total comprehensive income for the period attributable to: - Owners of the parent 1,013 1,693 29,752
Total contributions by and distributions to owners 47 30,484 - 566 31,097 - 31,097
Changes in ownership
Acquisition of subsidiary with NCI - - - - - 46 46
Total changes in ownership interests - - - - - 46 46
As at 30 September 2016 (audited) 521 339,431 45,370 (18,904) 366,418 1,281 367,699 Comprehensive income for the period
Loss for the period - - - (8,255) (8,255) 74 (8,181)
Other comprehensive income - - 9,268 - 9,268 (34) 9,234
Total comprehensive income for the period - - 9,268 (8,255) 1,013 40 1,053
Contributions by and distributions to owners
Share issue 1 - - - 1 - 1
Share based payment - - - 516 516 - 516
Total contributions by and distributions to owners 1 - - 516 517 - 517
Changes in ownership
Investment in subsidiary by NCI - - - - - 3,530 3,530
Total changes in ownership interests - - - - - 3,530 3,530
As at 31 March 2017 (unaudited) 522 339,431 54,638 (26,643) 367,948 4,851 372,799
Benchmark Holdings plc
Statement of Cash Flows for the 6 months ended 31 March 2017
15
6 months
ended 31 March 2017
(unaudited)
6 months ended
31 March 2016 (unaudited)
12 months ended
30 September 2016 (audited)
Notes £000 £000 £000 Cash flows from operating activities Loss for the period (8,181) (11,355) (18,346) Adjustments for: Depreciation of property, plant and equipment 11 2,333 1,064 2,859 Amortisation of intangible fixed assets 12 9,516 4,993 13,749 Loss on sale of property, plant and equipment 50 114 30 Finance income (92) (3,790) (3,984) Finance costs 2,300 1,255 6,170 Share of profit of equity-accounted investees, net of tax (25) - (273) Non-cash and other movements (472) - - Foreign exchange gains (24) (536) 6,776 Share based payment expense 516 304 749 Tax credit (672) (1,262) (4,038)
5,249 (9,213) 3,692 Decrease/(increase) in trade and other receivables 2,985 (13,257) (3,729) (Increase)/decrease in inventories and biological assets (2,728) 312 (4,704) (Decrease)/increase in trade and other payables (3,614) 13,016 (4,124) (Decrease)/increase in provisions (176) 583 (238)
1,716 (8,559) (9,103) Income taxes paid (1,192) (309) (1,429) Net cash flows from/(used in) operating activities 524 (8,868) (10,532) Investing activities Acquisition of subsidiaries, net of cash acquired - (191,176) (191,502)
Purchase of investments (185) - - Purchases of property, plant and equipment 11 (10,930) (11,192) (18,660) Purchase of intangibles 12 (840) (9) (1,523) Proceeds from sale of fixed assets 148 - 174 Interest received 92 60 254 Net cash flows used in investing activities (11,715) (202,317) (211,257) Financing activities Proceeds of share issue 1 185,693 216,519 Proceeds from bank borrowings (net of costs) - 35,929 42,254 Investment in subsidiary by NCI 191 - - Share-issue costs recognised through equity - (4,390) (4,685) Net cash flows from derivative financial instruments - 3,731 3,731 Repayment of bank borrowings - - (8,809) Interest paid (683) (198) (2,481) Payments to finance lease creditors (146) (96) (164) Net cash (outflow)/inflow from financing activities (637) 220,669 246,365 Net (decrease)/increase in cash and cash equivalents (11,828) 9,484 24,576 Cash and cash equivalents at beginning of period 38,140 13,564 13,564 Cash and cash equivalents at end of period 26,312 23,048 38,140
Benchmark Holdings plc
Unaudited notes to the interim statement for the 6 months ended 31 March 2017
16
1. Financial information This announcement does not constitute statutory financial statements within the meaning of the Companies Act 2006 and the interim financial information included within has not been audited. This information has been approved for issue by the Board of Directors of Benchmark Holdings plc, a company domiciled and incorporated in the United Kingdom. Statutory accounts for the year ended 30 September 2016 were approved by the Directors on 24 January 2017 and delivered to the Registrar of Companies. The audit report received on those accounts was unqualified and did not contain any emphasis of matter paragraph nor any statement under Section 498 of the Companies Act 2006. 2. General information and basis of preparation The financial information set out in these interim financial statements for the six months ended 31 March 2017 and the comparative figures for the six months ended 31 March 2016 are unaudited. They have been prepared in accordance with the recognition and measurement requirements of International Financial Reporting Standards (IFRS) and IFRIC interpretations issued by the International Accounting Standards Board (IASB) adopted by the European Union and the AIM Rules. They do not contain all the information required for statutory financial statements and should be read in conjunction with the consolidated financial statements of the Group for the year ended 30 September 2016, which have been prepared in accordance with IFRS as adopted by the European Union. The interim financial statements comprise the financial statements of the Group and its subsidiaries at 31 March 2017. Subsidiaries are consolidated from the date of acquisition, being the date on which the Group obtained control, and continue to be consolidated until the date when such control ceases. The interim financial statements incorporate the results of business combinations using the acquisition method. In the consolidated balance sheet, the acquiree’s identifiable assets, liabilities and contingent liabilities are initially recognised at their fair values at the acquisition date. Non-controlling interests, presented as part of equity, represent the proportion of a subsidiary’s profit or loss and net assets that is not held by the Group. The total comprehensive income or loss of non-wholly owned subsidiaries is attributed to owners of the parent and to the non-controlling interests in proportion to their respective ownership interests. On consolidation, the results of overseas operations are translated into sterling at rates approximating to those ruling when the transactions took place. All assets and liabilities of overseas operations, including goodwill arising on the acquisition of those operations, are translated at the rate ruling at the reporting date. Exchange differences arising are recognised in other comprehensive income and accumulated in the foreign exchange reserve. Exchange differences recognised in the income statement in the Group entities’ separate financial statements on the translation of long-term monetary items forming part of the Group’s net investment in the overseas operation concerned are reclassified to other comprehensive income and accumulated in the foreign exchange reserve on consolidation. The following adopted IFRSs have been issued but have not been applied by the Group in these financial statements. The Group has not yet fully quantified the potential impact of these standards.
• IFRS 9: Financial Instruments (effective date 1 January 2018) • IFRS 15: Revenue from Contracts with Customers (effective date 1 January 2017) • IFRS 16: Leases (effective date 1 January 2019) • Annual Improvements to IFRSs – 2012–2014 Cycle (effective date 1 January 2016)
The adoption of other standards is not expected to have a material effect on the financial statements. A financial review of the business is included in the Chairman’s Statement.
Benchmark Holdings plc
Unaudited notes to the interim statement for the 6 months ended 31 March 2017
17
3. Share capital On 1 December 2016, the Company issued a total of 670,173 shares of 0.1p each to certain employees of the Group relating to share options granted in August 2013 and March 2015. On 6 March 2017, the Company issued a total of 203,105 shares of 0.1p each to certain employees of the Group relating to share options granted in August 2013 and March 2015. On 13 March 2017, the Company issued a total of 25,811 shares of 0.1p each in respect of the Benchmark Share Incentive Plan (“SIP”). The shares are free matching shares issued upon certain conditions being met following purchase by eligible employees of partnership shares in 2014. 4. Going concern The Group’s business activities, together with the factors likely to affect its future development, performance and position are set out in the Chairman’s Statement. The Directors have considered these factors, the likely performance of the business and possible alternative outcomes and the financing activities available to the Group. Having taken all of these factors into consideration, including the impact on covenants relating to the external borrowing facility, the Directors confirm that forecasts and projections indicate that the Group and its Parent Company have adequate resources for the foreseeable future and at least for the period of 12 months from the date of signing the half year report. Accordingly, the financial information has been prepared on the going concern basis. 5. Accounting policies The accounting policies adopted are consistent with those of the financial year ended 30 September 2016. Taxes on income in the interim periods are accrued using the tax rate that would be applicable to expected total earnings. 6. Estimates The preparation of interim financial information requires management to make certain judgements, estimates and assumptions that affect the application of accounting policies and the reported amounts of assets and liabilities, income and expense. Actual amounts may differ from these estimates. In preparing these interim financial statements the significant judgements made by management in applying the Group’s accounting policies and the key sources of estimation uncertainty were the same as those applied to the consolidated financial statements for the year ended 30 September 2016.
Benchmark Holdings plc
Unaudited notes to the interim statement for the 6 months ended 31 March 2017
18
7. Segment information Operating segments are reported in a manner consistent with the reports made to the chief operating decision maker. It is considered that the role of chief operating decision maker is performed by the Board of Directors. The Group operates globally and for management purposes is organised into reportable segments as follows:
• Animal Health Division – provides veterinary services, environmental services diagnostics and animal health products to global aquaculture, and manufactures licenced veterinary vaccines and vaccine components;
• Breeding and Genetics Division - harnesses industry leading salmon breeding technologies combined with state-of-the-art production facilities to provide a range of year-round high genetic merit ova;
• Advanced Animal Nutrition Division - manufactures and provides technically advanced nutrition and health products to the global aquaculture industry;
• Corporate - the corporate segment represents revenues earned from recharging certain central costs to the operating divisions, together with unallocated central costs.
In addition to the above, reported together as “all other segments” are the following divisions, collectively known as “Knowledge Services”, the results of which are not significant on an individual basis:
• Sustainability Science Division – provides sustainable food production consultancy, technical consultancy and assurance services;
• Technical Publishing Division – promotes sustainable food production and ethics through online news and technical publications for the international agriculture and food processing sectors and through delivery of training courses to the industries.
Measurement of operating segment profit or loss Inter-segment sales are priced along the same lines as sales to external customers, with an appropriate discount being applied to encourage use of Group resources at a rate acceptable to local tax authorities. This policy was applied consistently throughout the current and prior period.
6 months ended 31 March 2017 (unaudited)
Animal Health
Breeding and
Genetics
Advanced Animal
Nutrition All other segments Corporate
Inter-segment
sales Total Notes £000 £000 £000 £000 £000 £000 £000 Revenue 7,151 18,821 37,868 6,415 2,151 (3,251) 69,155 Cost of sales (5,856) (10,958) (18,726) (4,447) (29) 903 (39,113) Gross profit / (loss) 1,295 7,863 19,142 1,968 2,122 (2,348) 30,042 Research and development costs (3,385) (1,590) (1,458) - - - (6,433) Other operating costs (3,708) (3,443) (9,377) (2,515) (3,607) 2,348 (20,302) Adjusted EBITDA (5,798) 2,830 8,307 (547) (1,485) - 3,307 Exceptional including acquisition related items 8 (183) 2,517 (6) (47) (409) - 1,872 EBITDA (5,981) 5,347 8,301 (594) (1,894) - 5,179 Depreciation (435) (544) (789) (493) (72) - (2,333) Amortisation (327) (1,061) (7,649) (479) - - (9,516) Operating profit / (loss) (6,743) 3,742 (137) (1,566) (1,966) - (6,670) Finance cost (2,300) Finance income 92 Share of profit of equity-accounted investees, net of tax 25 Group loss before tax (8,853)
Benchmark Holdings plc
Unaudited notes to the interim statement for the 6 months ended 31 March 2017
19
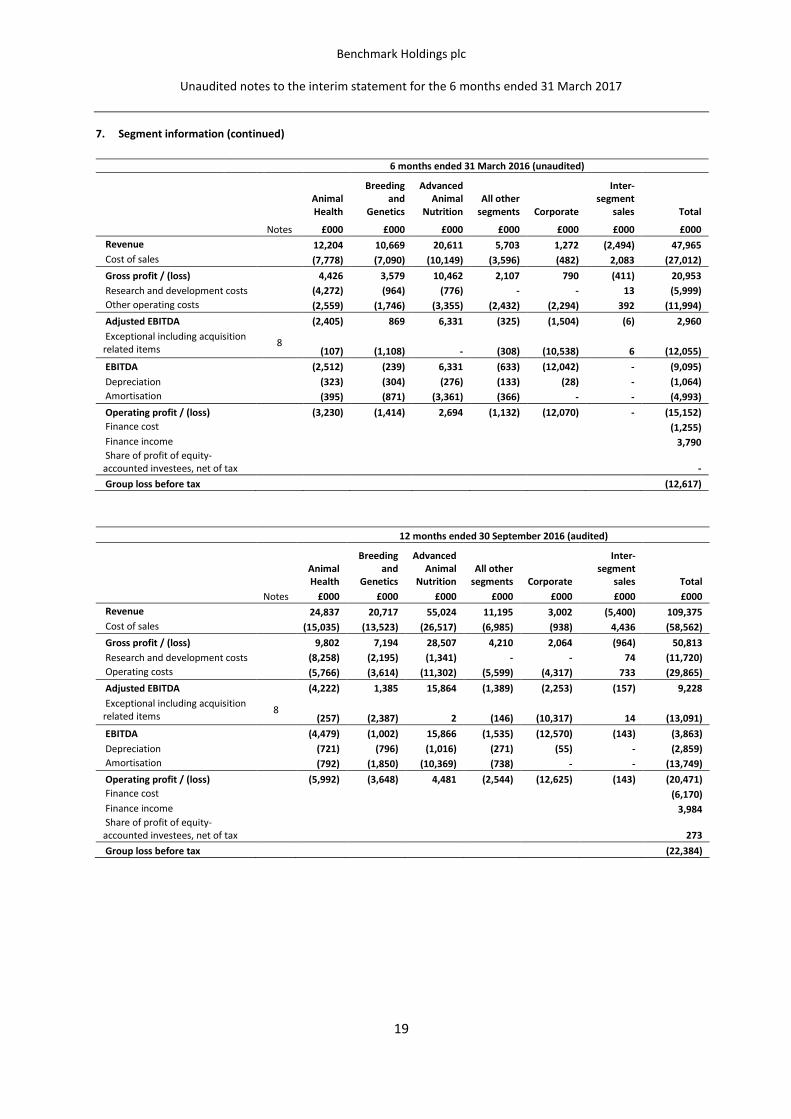
7. Segment information (continued)
6 months ended 31 March 2016 (unaudited)
Animal Health
Breeding and
Genetics
Advanced Animal
Nutrition All other segments
Corporate
Inter-segment
sales Total Notes £000 £000 £000 £000 £000 £000 £000 Revenue 12,204 10,669 20,611 5,703 1,272 (2,494) 47,965 Cost of sales (7,778) (7,090) (10,149) (3,596) (482) 2,083 (27,012) Gross profit / (loss) 4,426 3,579 10,462 2,107 790 (411) 20,953 Research and development costs (4,272) (964) (776) - - 13 (5,999) Other operating costs (2,559) (1,746) (3,355) (2,432) (2,294) 392 (11,994) Adjusted EBITDA (2,405) 869 6,331 (325) (1,504) (6) 2,960 Exceptional including acquisition related items 8
(107) (1,108) - (308) (10,538) 6 (12,055) EBITDA (2,512) (239) 6,331 (633) (12,042) - (9,095) Depreciation (323) (304) (276) (133) (28) - (1,064) Amortisation (395) (871) (3,361) (366) - - (4,993) Operating profit / (loss) (3,230) (1,414) 2,694 (1,132) (12,070) - (15,152) Finance cost (1,255) Finance income 3,790 Share of profit of equity-accounted investees, net of tax - Group loss before tax (12,617)
(257) (2,387) 2 (146) (10,317) 14 (13,091) EBITDA (4,479) (1,002) 15,866 (1,535) (12,570) (143) (3,863) Depreciation (721) (796) (1,016) (271) (55) - (2,859) Amortisation (792) (1,850) (10,369) (738) - - (13,749) Operating profit / (loss) (5,992) (3,648) 4,481 (2,544) (12,625) (143) (20,471) Finance cost (6,170) Finance income 3,984 Share of profit of equity-accounted investees, net of tax 273 Group loss before tax (22,384)
Benchmark Holdings plc
Unaudited notes to the interim statement for the 6 months ended 31 March 2017
20
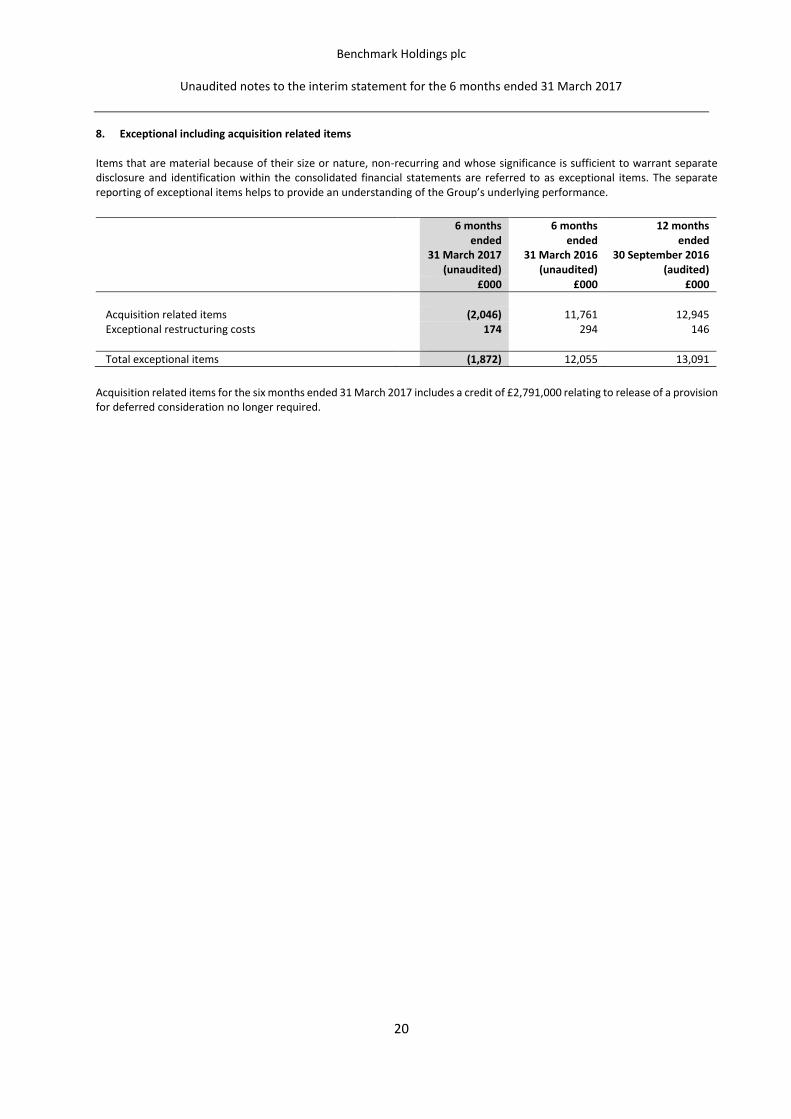
8. Exceptional including acquisition related items Items that are material because of their size or nature, non-recurring and whose significance is sufficient to warrant separate disclosure and identification within the consolidated financial statements are referred to as exceptional items. The separate reporting of exceptional items helps to provide an understanding of the Group’s underlying performance.
6 months ended
31 March 2017 (unaudited)
6 months ended
31 March 2016 (unaudited)
12 months ended
30 September 2016 (audited)
£000 £000 £000
Acquisition related items (2,046) 11,761 12,945 Exceptional restructuring costs 174 294 146 Total exceptional items (1,872) 12,055 13,091
Acquisition related items for the six months ended 31 March 2017 includes a credit of £2,791,000 relating to release of a provision for deferred consideration no longer required.
Benchmark Holdings plc
Unaudited notes to the interim statement for the 6 months ended 31 March 2017
21
9. Taxation
6 months
ended 31 March 2017
(unaudited)
6 months ended
31 March 2016 (unaudited)
12 months ended
30 September 2016
(audited) £000 £000 £000 Analysis of credit in period Current tax: Current income tax expense on profits for the period 2,165 872 1,389 Adjustment in respect of prior periods 54 (336) (1,387) Total current tax 2,219 536 2
Deferred tax expense Origination and reversal of temporary differences (2,972) (1,798) (4,025) Deferred tax movements in respect of prior periods 81 - (15) Total deferred tax (2,891) (1,798) (4,040) Total tax credit (672) (1,262) (4,038)
The reasons for the difference between the actual tax charge for the period and the standard rate of corporation tax in the United Kingdom applied to the result for the period are as follows:
6 months
ended 31 March 2017
(unaudited)
6 months ended
31 March 2016 (unaudited)
12 months ended
30 September 2016
(audited) £000 £000 £000
Loss before income tax (8,853) (12,617) (22,384)
Expected tax credit based on the standard rate of UK corporation tax at the domestic rate of 19.5% (31 March 2016: 20%, 2016: 20%) (1,726) (2,523) (4,477) Expenses not deductible for tax purposes/(untaxed income) (412) 2,139 2,982 Research and development relief - (115) (54) Deferred tax not recognised 1,401 1,091 2,592 Adjustment to tax charge in respect of prior periods 135 (336) (1,242) Profits of associate reported net of tax (5) - (54) Effects of changes in tax rates - - (475) Different tax rates in overseas jurisdictions (65) (1,518) (3,310) Total tax credit (672) (1,262) (4,038)
Benchmark Holdings plc
Unaudited notes to the interim statement for the 6 months ended 31 March 2017
22
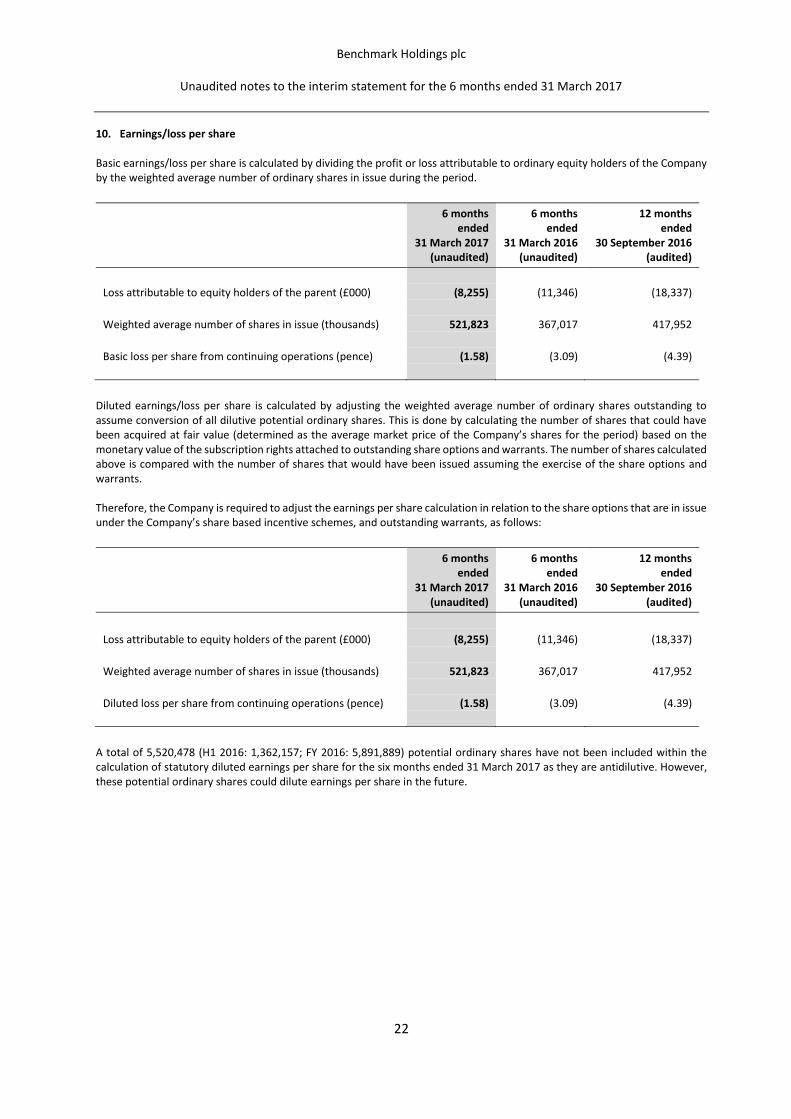
10. Earnings/loss per share Basic earnings/loss per share is calculated by dividing the profit or loss attributable to ordinary equity holders of the Company by the weighted average number of ordinary shares in issue during the period.
6 months ended
31 March 2017 (unaudited)
6 months ended
31 March 2016 (unaudited)
12 months ended
30 September 2016 (audited)
Loss attributable to equity holders of the parent (£000) (8,255) (11,346) (18,337)
Weighted average number of shares in issue (thousands) 521,823 367,017 417,952
Basic loss per share from continuing operations (pence) (1.58) (3.09) (4.39)
Diluted earnings/loss per share is calculated by adjusting the weighted average number of ordinary shares outstanding to assume conversion of all dilutive potential ordinary shares. This is done by calculating the number of shares that could have been acquired at fair value (determined as the average market price of the Company’s shares for the period) based on the monetary value of the subscription rights attached to outstanding share options and warrants. The number of shares calculated above is compared with the number of shares that would have been issued assuming the exercise of the share options and warrants. Therefore, the Company is required to adjust the earnings per share calculation in relation to the share options that are in issue under the Company’s share based incentive schemes, and outstanding warrants, as follows:
6 months ended
31 March 2017 (unaudited)
6 months ended
31 March 2016 (unaudited)
12 months ended
30 September 2016 (audited)
Loss attributable to equity holders of the parent (£000) (8,255) (11,346) (18,337)
Weighted average number of shares in issue (thousands) 521,823 367,017 417,952
Diluted loss per share from continuing operations (pence) (1.58) (3.09) (4.39)
A total of 5,520,478 (H1 2016: 1,362,157; FY 2016: 5,891,889) potential ordinary shares have not been included within the calculation of statutory diluted earnings per share for the six months ended 31 March 2017 as they are antidilutive. However, these potential ordinary shares could dilute earnings per share in the future.
Benchmark Holdings plc
Unaudited notes to the interim statement for the 6 months ended 31 March 2017
Accumulated amortisation and impairment Balance at 1 October 2015 515 618 449 261 133 3,368 380 - 5,724 Amortisation charge for the period 1 - 31 3,136 148 1,407 270 - 4,993 Exchange differences - - 3 (45) - 75 48 - 81 Balance at 31 March 2016 516 618 483 3,352 281 4,850 698 - 10,798
Balance at 1 April 2016 516 618 483 3,352 281 4,850 698 - 10,798 Amortisation charge for the period 2 - 53 6,352 201 1,842 306 - 8,756 Disposal - (345) - - - - - - (345) Exchange differences - 6 71 586 9 289 140 - 1,101 Balance at 30 September 2016 518 279 607 10,290 491 6,981 1,144 - 20,310
Balance at 1 October 2016 518 279 607 10,290 491 6,981 1,144 - 20,310 Amortisation charge for the period 5 - 36 6,931 315 1,888 341 - 9,516 Exchange differences - - (54) 319 5 (50) (5) - 215 Balance at 31 March 2017 523 279 589 17,540 811 8,819 1,480 - 30,041
Net book value At 31 March 2017 (unaudited) 50 157,508 458 125,919 6,337 37,226 24,787 2,059 354,344 At 30 September 2016 (audited) 43 152,905 468 128,100 6,292 38,245 25,045 1,440 352,538 At 31 March 2016 (unaudited) 1 137,246 475 122,174 5,983 36,485 21,298 - 323,662
Benchmark Holdings plc
Unaudited notes to the interim statement for the 6 months ended 31 March 2017
25
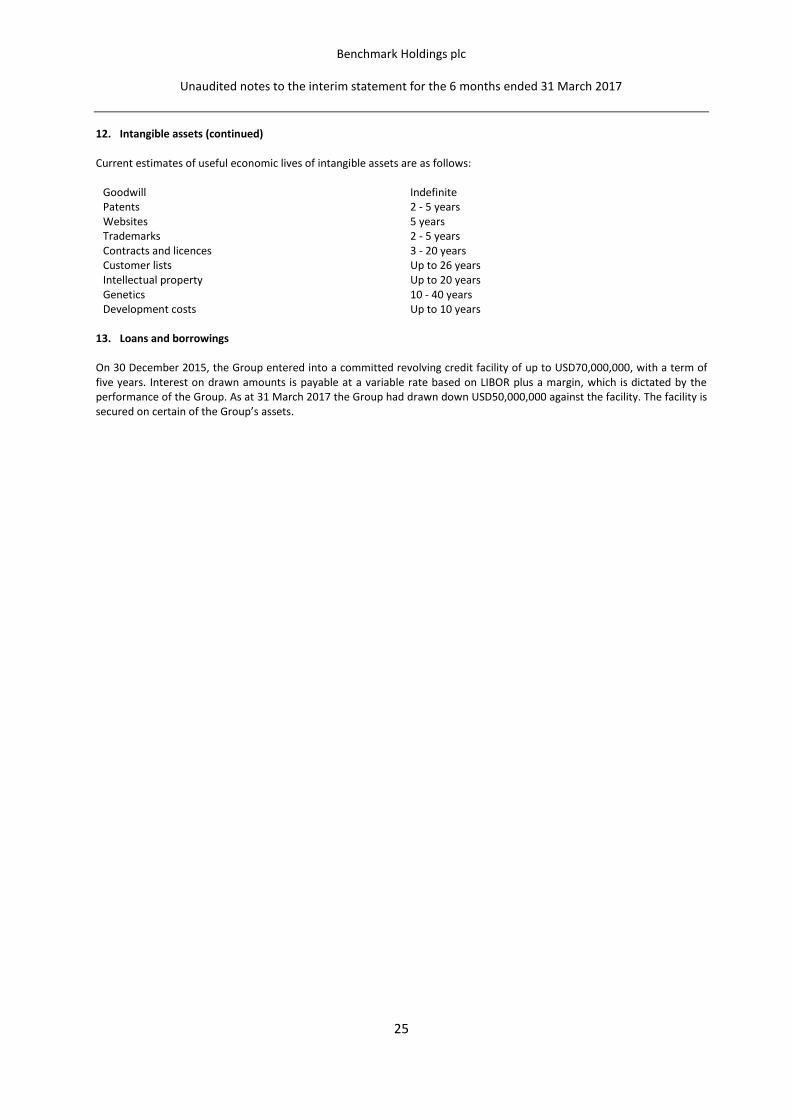
12. Intangible assets (continued) Current estimates of useful economic lives of intangible assets are as follows:
Goodwill Indefinite Patents 2 - 5 years Websites 5 years Trademarks 2 - 5 years Contracts and licences 3 - 20 years Customer lists Up to 26 years Intellectual property Up to 20 years Genetics 10 - 40 years Development costs Up to 10 years
13. Loans and borrowings On 30 December 2015, the Group entered into a committed revolving credit facility of up to USD70,000,000, with a term of five years. Interest on drawn amounts is payable at a variable rate based on LIBOR plus a margin, which is dictated by the performance of the Group. As at 31 March 2017 the Group had drawn down USD50,000,000 against the facility. The facility is secured on certain of the Group’s assets.