20
Institutional Equities
Initi
atin
g C
over
age
Reuters: KAJR.BO; Bloomberg: KJC IN
Kajaria Ceramics
The Perfect Finish The change in business model - from in-house manufacturing to joint venture-backed capacity expansion - is expected to help Kajaria Ceramics (KCL), the second-largest tile player in India, to capitalise on its strong Kajaria brand and derive incremental volume/market penetration at a lower cost. Its stock trades attractively at 12.7x/8.9x FY13/14E P/E and 6.2x/4.8x EV/EBITDA, lower than other consumer-focused companies’ stocks which trade at 11-21x P/E and 6-13x EV/EBITDA, respectively, considering the fact that KCL’s return ratios are likely to touch their highest level in FY13/FY14. Strong 22.0% revenue CAGR aided by lean working capital and debt reduction by 39.5% should drive net profit CAGR by 34.1%, generate free cash flow of Rs951mn and improve RoCE by 529bps over FY12-14E, calling for expansion of its valuation multiples. Valuing KCL at 6x FY14E EV/EBITDA, we assign a Buy rating to it with a target price of Rs227, translating into FY14E PE and P/BV of 11.5x/3.4x, respectively.
Strong free cash flow and return ratios: Following robust profitability, lower capex and lean working capital cycle, we expect KCL to generate strong operating/free cash flow of Rs2,519mn/Rs951mn over FY12-14E. In the wake of strong free cash flow, debt would reduce by 39.5% and the D/E ratio would decline from 1.0x to 0.3x over the same period. Lower debt and strong cash flow would help KCL to continue its inorganic growth. Following higher asset turnover, steady margin and lean working capital RoCE/RoE should improve by 529/218bps to 26.6%/34.2%, respectively, over FY12-14E and call for expansion of valuation multiples.
Rising market share/penetration at a lower cost via JVs: In order to increase volume/market penetration at a lower cost, KCL has formed joint ventures (51%) with small unorganised companies. KCL buys tiles from these facilities on cost plus margin basis and sells them at a premium under its Kajaria brand. JVs helped increase its tile-making capacity by 10msqm, i.e.35.3% to 38.3msqm with an equity investment of Rs324mn against manufacturing capex of ~Rs50-70mn/sqm. Apart from volume, JVs also helped KCL to increase penetration. Currently, KCL derives ~50%/20%/20% of its sales from the northern/western/southern region. Of the three JVs, two are in Gujarat and one in Andhra Pradesh, which would increase its penetration level in the western and southern regions. Following higher capacity, deeper market penetration and strong demand, KCL is expected to report volume CAGR of 15.6% over FY12-14E.
Strong brand equity-led growth on low capital base: Following rapid urbanisation, rising middle class and growing market share of organised players, the tile industry is expected to grow 15-16% over the next five years. With the JV model in place, KCL, the second-largest player with a strong brand equity and organised market share of 16.8% is best placed to convert buoyant industry growth into healthy cash flows and return ratios, by posting net sales/EBITDA/net profit CAGRs of 22.0%/21.8%/34.1%, respectively, as against the growth in capital employed of a mere 9%, over FY12-14E.
We are participating in AsiaMoney’s Brokers Poll 2012. We would be pleased if you vote for us as the feedback helps us align our equity research offerings to meet
your requirements. Click Here
BUY
Sector: Building Products
CMP: Rs177
Target Price: Rs227
Upside: 29%
Jignesh Kamani, CFA [email protected] +91-22-3926 8239
Saiprasad Prabhu [email protected] +91-22-3926 8172
Key Data
Current Shares O/S (mn) 73.6
Mkt Cap (Rsbn/US$mn) 13/233.1
52 Wk H / L (Rs) 191/83
Daily Vol. (3M NSE Avg.) 82,016
Share holding (%) 3QFY12 4QFY12 1QFY13
Promoter 53.5 53.5 53.5
FII 7.8 9.6 11.5
DII 8.6 6.8 6.0
Corporate 12.1 10.8 11.3
General Public 18.0 19.3 17.7
One Year Indexed Stock Performance
70
90
110
130
150
170
190
Jul-11 Sep-11 Nov-11 Jan-12 Mar-12 May-12 Jul-12
KAJARIA CERAMICS NSE S&P CNX NIFTY INDEX
Price Performance (%)
1 M 6 M 1 Yr
Kajaria 9.8 59.4 62.9
Nifty Index (0.5) 1.4 (9.2)
Source: Bloomberg
Y/E Mar (Rsmn) Cons. FY10 FY11 FY12 FY13E FY14E
Net sales 7,355 9,532 13,130 16,295 19,529
EBITDA 1,149 1,486 2,062 2,504 3,059
Net profit 363 617 809 1,023 1,454
EPS (Rs) 4.9 8.4 11.0 13.9 19.8
EPS growth (%) 297.5 69.9 31.0 26.5 42.2
EBITDA margin (%) 15.6 15.6 15.7 15.4 15.7
PE ratio (x) 35.8 21.0 16.1 12.7 8.9
Price/BV (x) 6.9 5.8 4.6 3.6 2.7
EV/EBITDA (x) 13.5 10.6 7.6 6.2 4.8
RoCE (%) 13.9 16.8 21.3 23.1 26.6
RoE (%) 20.7 30.0 32.1 31.7 34.2
Source: Company, Nirmal Bang Institutional Equities Research
24 July 2012
Institutional Equities
2 Kajaria Ceramics
Valuation
Currently, KCL trades at 6.2x/4.8x its FY13E/14E EV/EBITDA, close to its eight-year median of 5.3x. We expect EBITDA CAGR, at 21.8% over FY12-14E to outpace the growth in capital employed of 9.0% over the same period. The company had witnessed EBITDA CAGR of 19.5% over FY04-12 on an 11% CAGR in capital employed. Its stock trades at a P/E of 12.7x/8.9x its FY13E/FY14E EPS of Rs13.9/19.8, respectively, compared to its eight-year median of 9.2x. The stock has risen 59% over the past six months and is trading at the upper band of its valuation chart. However, we feel its historical band does not give a true picture of valuation as the company was focusing on high capex-led manufacturing along with high working capital-driven growth. As a result, its RoCE was lower, between 6-14% over FY07-10. The company reduced its working capital requirement from 20.6% of sales in FY10 to 7.7% in FY12 and this led RoCE to rise from 13.9% in FY10 to 21.3% in FY12. Following the improvement in return ratios coupled with strong growth momentum, the stock was re-rated over the past six months and it is now trading close to the upper band of its valuation parameter. Strong 22.0% revenue CAGR aided by lean working capital and debt reduction by 39.5% would drive net profit CAGR by 34.1%, generate free cash flow of Rs951mn and improve RoCE by 529bps over FY12-14E, thereby driving a further re-rating of the stock.
As shown in Exhibit 2, the company operated with a low RoCE, in line with the third-largest player, Somany Ceramics, until FY10 and as result its stock was trading at lower valuation multiples. However, KCL outperformed its peers in the past two years. In the domestic tile industry, KCL is the only listed company (apart from H&R Johnson) to transform its model from a high capex, low returns manufacturing model to a low capex, lean working capital and higher returns structure by leveraging its strong Kajaria brand in the past two years. Nitco Tiles, the fourth-largest player, witnessed strong revenue at the cost of operating margin and high working capital over the past three years, while Asian Granito, the fifth-largest player, saw pressure on its margins.
We believe KCL would continue to outperform its peers and garner market share from competitors. In the past two years, the company started leveraging on its strong brand and increased saleable capacity through JVs. As the company has taken only a 51% stake in the JVs but has access to their entire capacity and also the products are marketed under its brand Kajaria, the cost of acquisition per sqm is lower and the return on incremental capital is very high. The positive outcome of all this would be visible in FY13/FY14.
We believe KCL’s business model of strong growth and lower capex (along with lean working capital) with its focus on the strong Kajaria brand can be compared to other companies having strong brands and deriving business through focus on customers’ disposable income. Its business model can also be compared to that of Kewal Kiran Clothing, VIP Industries, Whirlpool of India, Berger Paints, TTK Prestige and similar companies which enjoy higher return ratios due to their focus on revenue by leveraging their brand with a minimum capex and working capital. We expect KCL to enjoy higher RoE, at 34.2%, compared to Kewal Kiran Clothing (24.7%), VIP Industries (21.9%), Whirlpool of India (27.1%), Kansai Nerolac (22.0%) and Berger Paints (23.9%) in FY14E. However, KCL’s stock trades at its lowest valuation of 4.8x EV/EBTIDA compared to 5.2x for Kewal Kiran Clothing, 8.3x for Whirlpool of India, 9.7x for Kansai Nerolac Paints, 9.6x for VIP Industries, and 10.9x for Berger Paints in FY14 after accounting for strong net profit CAGR of 34.1% and RoCE improvement of 529bps over FY12-14.
The company generated positive operating cash flow for 9 years out of the past 10 years, but following its focus on in-house manufacturing capacity, cumulative free cash flow was negative at Rs930mn over the same period. With KCL shifting its focus from in-house manufacturing capex-driven growth to JV-led growth with a lean working capital, we expect the company to generate free cash flow of Rs951mn over FY12-14E. Its RoCE/RoE is likely to improve by 529bps/218bps, respectively, and the D/E ratio is expected to reduce from 1.0x in FY12 to 0.3x in FY14E. As a result, we expect the valuation gap between KCL and the companies focusing on consumers’ disposable income to narrow down. We assign a Buy rating to KCL with a target price of Rs227 based on 6x FY14E EV/EBITDA.
Institutional Equities
3 Kajaria Ceramics
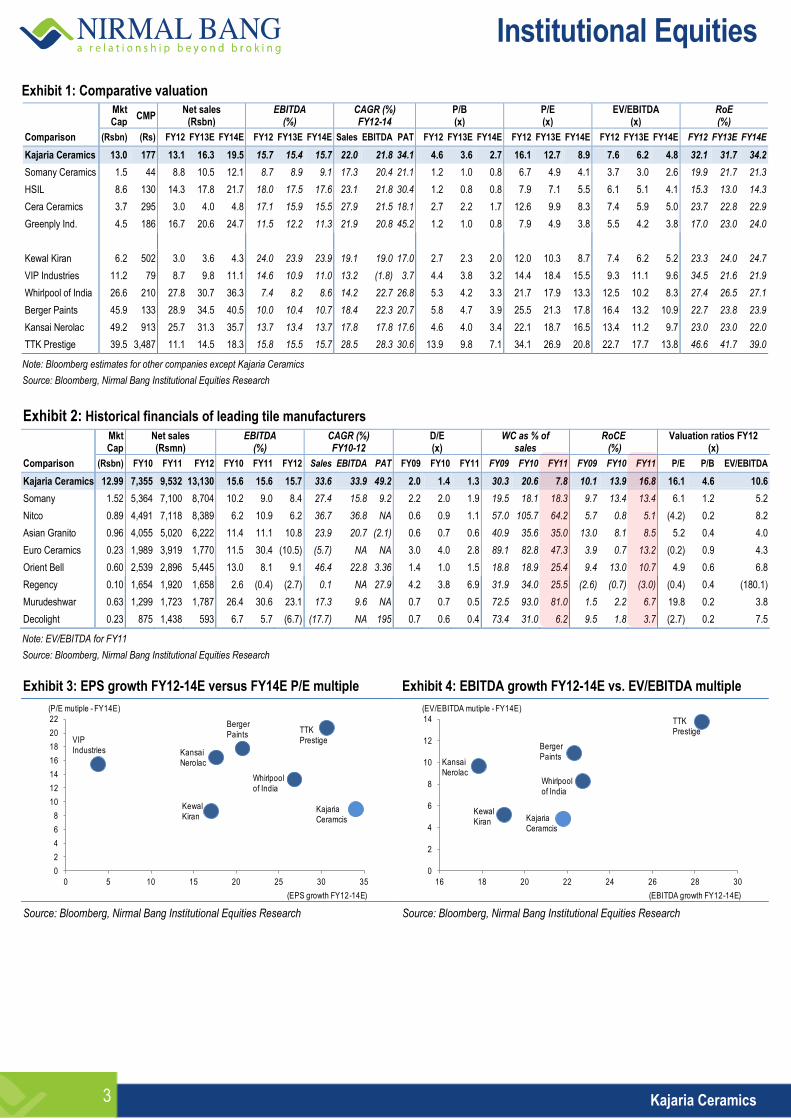
Exhibit 1: Comparative valuation
Mkt Cap
CMP Net sales
(Rsbn) EBITDA
(%) CAGR (%) FY12-14
P/B (x)
P/E (x)
EV/EBITDA (x)
RoE (%)
Comparison (Rsbn) (Rs) FY12 FY13E FY14E FY12 FY13E FY14E Sales EBITDA PAT FY12 FY13E FY14E FY12 FY13E FY14E FY12 FY13E FY14E FY12 FY13E FY14E
Kajaria Ceramics 13.0 177 13.1 16.3 19.5 15.7 15.4 15.7 22.0 21.8 34.1 4.6 3.6 2.7 16.1 12.7 8.9 7.6 6.2 4.8 32.1 31.7 34.2
Somany Ceramics 1.5 44 8.8 10.5 12.1 8.7 8.9 9.1 17.3 20.4 21.1 1.2 1.0 0.8 6.7 4.9 4.1 3.7 3.0 2.6 19.9 21.7 21.3
HSIL 8.6 130 14.3 17.8 21.7 18.0 17.5 17.6 23.1 21.8 30.4 1.2 0.8 0.8 7.9 7.1 5.5 6.1 5.1 4.1 15.3 13.0 14.3
Cera Ceramics 3.7 295 3.0 4.0 4.8 17.1 15.9 15.5 27.9 21.5 18.1 2.7 2.2 1.7 12.6 9.9 8.3 7.4 5.9 5.0 23.7 22.8 22.9
Greenply Ind. 4.5 186 16.7 20.6 24.7 11.5 12.2 11.3 21.9 20.8 45.2 1.2 1.0 0.8 7.9 4.9 3.8 5.5 4.2 3.8 17.0 23.0 24.0
Kewal Kiran 6.2 502 3.0 3.6 4.3 24.0 23.9 23.9 19.1 19.0 17.0 2.7 2.3 2.0 12.0 10.3 8.7 7.4 6.2 5.2 23.3 24.0 24.7
VIP Industries 11.2 79 8.7 9.8 11.1 14.6 10.9 11.0 13.2 (1.8) 3.7 4.4 3.8 3.2 14.4 18.4 15.5 9.3 11.1 9.6 34.5 21.6 21.9
Whirlpool of India 26.6 210 27.8 30.7 36.3 7.4 8.2 8.6 14.2 22.7 26.8 5.3 4.2 3.3 21.7 17.9 13.3 12.5 10.2 8.3 27.4 26.5 27.1
Berger Paints 45.9 133 28.9 34.5 40.5 10.0 10.4 10.7 18.4 22.3 20.7 5.8 4.7 3.9 25.5 21.3 17.8 16.4 13.2 10.9 22.7 23.8 23.9
Kansai Nerolac 49.2 913 25.7 31.3 35.7 13.7 13.4 13.7 17.8 17.8 17.6 4.6 4.0 3.4 22.1 18.7 16.5 13.4 11.2 9.7 23.0 23.0 22.0
TTK Prestige 39.5 3,487 11.1 14.5 18.3 15.8 15.5 15.7 28.5 28.3 30.6 13.9 9.8 7.1 34.1 26.9 20.8 22.7 17.7 13.8 46.6 41.7 39.0
Note: Bloomberg estimates for other companies except Kajaria Ceramics
Source: Bloomberg, Nirmal Bang Institutional Equities Research
Exhibit 2: Historical financials of leading tile manufacturers
Mkt Cap
Net sales (Rsmn)
EBITDA (%)
CAGR (%) FY10-12
D/E (x)
WC as % of sales
RoCE (%)
Valuation ratios FY12 (x)
Comparison (Rsbn) FY10 FY11 FY12 FY10 FY11 FY12 Sales EBITDA PAT FY09 FY10 FY11 FY09 FY10 FY11 FY09 FY10 FY11 P/E P/B EV/EBITDA
Kajaria Ceramics 12.99 7,355 9,532 13,130 15.6 15.6 15.7 33.6 33.9 49.2 2.0 1.4 1.3 30.3 20.6 7.8 10.1 13.9 16.8 16.1 4.6 10.6
Somany 1.52 5,364 7,100 8,704 10.2 9.0 8.4 27.4 15.8 9.2 2.2 2.0 1.9 19.5 18.1 18.3 9.7 13.4 13.4 6.1 1.2 5.2
Nitco 0.89 4,491 7,118 8,389 6.2 10.9 6.2 36.7 36.8 NA 0.6 0.9 1.1 57.0 105.7 64.2 5.7 0.8 5.1 (4.2) 0.2 8.2
Asian Granito 0.96 4,055 5,020 6,222 11.4 11.1 10.8 23.9 20.7 (2.1) 0.6 0.7 0.6 40.9 35.6 35.0 13.0 8.1 8.5 5.2 0.4 4.0
Euro Ceramics 0.23 1,989 3,919 1,770 11.5 30.4 (10.5) (5.7) NA NA 3.0 4.0 2.8 89.1 82.8 47.3 3.9 0.7 13.2 (0.2) 0.9 4.3
Orient Bell 0.60 2,539 2,896 5,445 13.0 8.1 9.1 46.4 22.8 3.36 1.4 1.0 1.5 18.8 18.9 25.4 9.4 13.0 10.7 4.9 0.6 6.8
Regency 0.10 1,654 1,920 1,658 2.6 (0.4) (2.7) 0.1 NA 27.9 4.2 3.8 6.9 31.9 34.0 25.5 (2.6) (0.7) (3.0) (0.4) 0.4 (180.1)
Murudeshwar 0.63 1,299 1,723 1,787 26.4 30.6 23.1 17.3 9.6 NA 0.7 0.7 0.5 72.5 93.0 81.0 1.5 2.2 6.7 19.8 0.2 3.8
Decolight 0.23 875 1,438 593 6.7 5.7 (6.7) (17.7) NA 195 0.7 0.6 0.4 73.4 31.0 6.2 9.5 1.8 3.7 (2.7) 0.2 7.5
Note: EV/EBITDA for FY11
Source: Bloomberg, Nirmal Bang Institutional Equities Research
Exhibit 3: EPS growth FY12-14E versus FY14E P/E multiple Exhibit 4: EBITDA growth FY12-14E vs. EV/EBITDA multiple
0
2
4
6
8
10
12
14
16
18
20
22
0 5 10 15 20 25 30 35
TTK Prestige
(P/E mutiple - FY14E)
(EPS growth FY12-14E)
Whirlpool of India
VIP Industries Kansai
Nerolac
KewalKiran
Berger Paints
Kajaria Ceramcis
0
2
4
6
8
10
12
14
16 18 20 22 24 26 28 30
TTK Prestige
(EV/EBITDA mutiple - FY14E)
(EBITDA growth FY12-14E)
Whirlpool of India
Kansai Nerolac
KewalKiran
Berger Paints
Kajaria Ceramcis
Source: Bloomberg, Nirmal Bang Institutional Equities Research Source: Bloomberg, Nirmal Bang Institutional Equities Research
Institutional Equities
4 Kajaria Ceramics
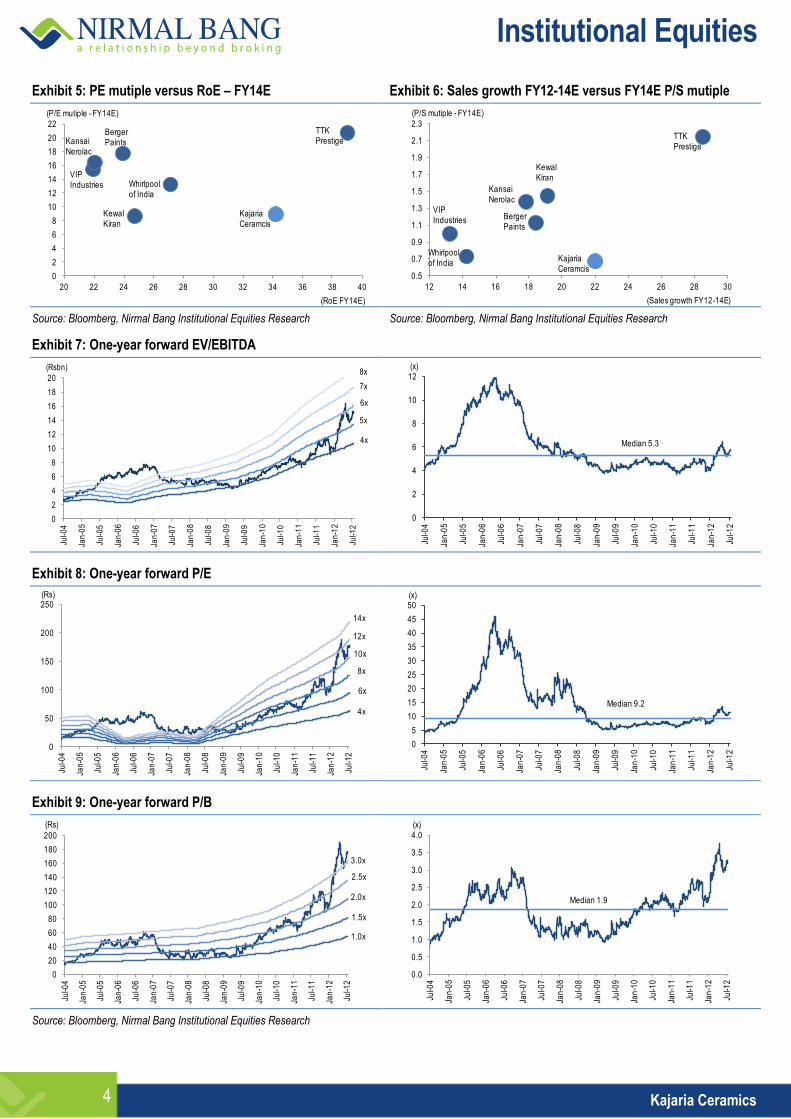
Exhibit 5: PE mutiple versus RoE – FY14E Exhibit 6: Sales growth FY12-14E versus FY14E P/S mutiple
0
2
4
6
8
10
12
14
16
18
20
22
20 22 24 26 28 30 32 34 36 38 40
TTK Prestige
(P/E mutiple - FY14E)
(RoE FY14E)
Whirlpool of India
VIP Industries
Kansai Nerolac
KewalKiran
Berger Paints
Kajaria Ceramcis
0.5
0.7
0.9
1.1
1.3
1.5
1.7
1.9
2.1
2.3
12 14 16 18 20 22 24 26 28 30
TTK Prestige
(P/S mutiple - FY14E)
(Sales growth FY12-14E)
Whirlpool of India
VIP Industries
Kansai Nerolac
KewalKiran
Berger Paints
Kajaria Ceramcis
Source: Bloomberg, Nirmal Bang Institutional Equities Research Source: Bloomberg, Nirmal Bang Institutional Equities Research
Exhibit 7: One-year forward EV/EBITDA
0
2
4
6
8
10
12
14
16
18
20
Jul-0
4
Jan
-05
Jul-0
5
Jan
-06
Jul-0
6
Jan
-07
Jul-0
7
Jan
-08
Jul-0
8
Jan
-09
Jul-0
9
Jan
-10
Jul-1
0
Jan
-11
Jul-1
1
Jan
-12
Jul-1
2
(Rsbn)
6x
4x
8x
5x
7x
0
2
4
6
8
10
12
Jul-0
4
Jan
-05
Jul-0
5
Jan
-06
Jul-0
6
Jan
-07
Jul-0
7
Jan
-08
Jul-0
8
Jan
-09
Jul-0
9
Jan
-10
Jul-1
0
Jan
-11
Jul-1
1
Jan
-12
Jul-1
2
(x)
Median 5.3
Exhibit 8: One-year forward P/E
0
50
100
150
200
250
Jul-0
4
Jan
-05
Jul-0
5
Jan
-06
Jul-0
6
Jan
-07
Jul-0
7
Jan
-08
Jul-0
8
Jan
-09
Jul-0
9
Jan
-10
Jul-1
0
Jan
-11
Jul-1
1
Jan
-12
Jul-1
2
(Rs)
10x
4x
6x
14x
8x
12x
0
5
10
15
20
25
30
35
40
45
50
Jul-0
4
Jan
-05
Jul-0
5
Jan
-06
Jul-0
6
Jan
-07
Jul-0
7
Jan
-08
Jul-0
8
Jan
-09
Jul-0
9
Jan
-10
Jul-1
0
Jan
-11
Jul-1
1
Jan
-12
Jul-1
2
(x)
Median 9.2
Exhibit 9: One-year forward P/B
0
20
40
60
80
100
120
140
160
180
200
Jul-0
4
Jan
-05
Jul-0
5
Jan
-06
Jul-0
6
Jan
-07
Jul-0
7
Jan
-08
Jul-0
8
Jan
-09
Jul-0
9
Jan
-10
Jul-1
0
Jan
-11
Jul-1
1
Jan
-12
Jul-1
2
(Rs)
2.5x
1.0x
1.5x
3.0x
2.0x
0.0
0.5
1.0
1.5
2.0
2.5
3.0
3.5
4.0
Jul-0
4
Jan
-05
Jul-0
5
Jan
-06
Jul-0
6
Jan
-07
Jul-0
7
Jan
-08
Jul-0
8
Jan
-09
Jul-0
9
Jan
-10
Jul-1
0
Jan
-11
Jul-1
1
Jan
-12
Jul-1
2
(x)
Median 1.9
Source: Bloomberg, Nirmal Bang Institutional Equities Research
Institutional Equities
5 Kajaria Ceramics
Investment Arguments
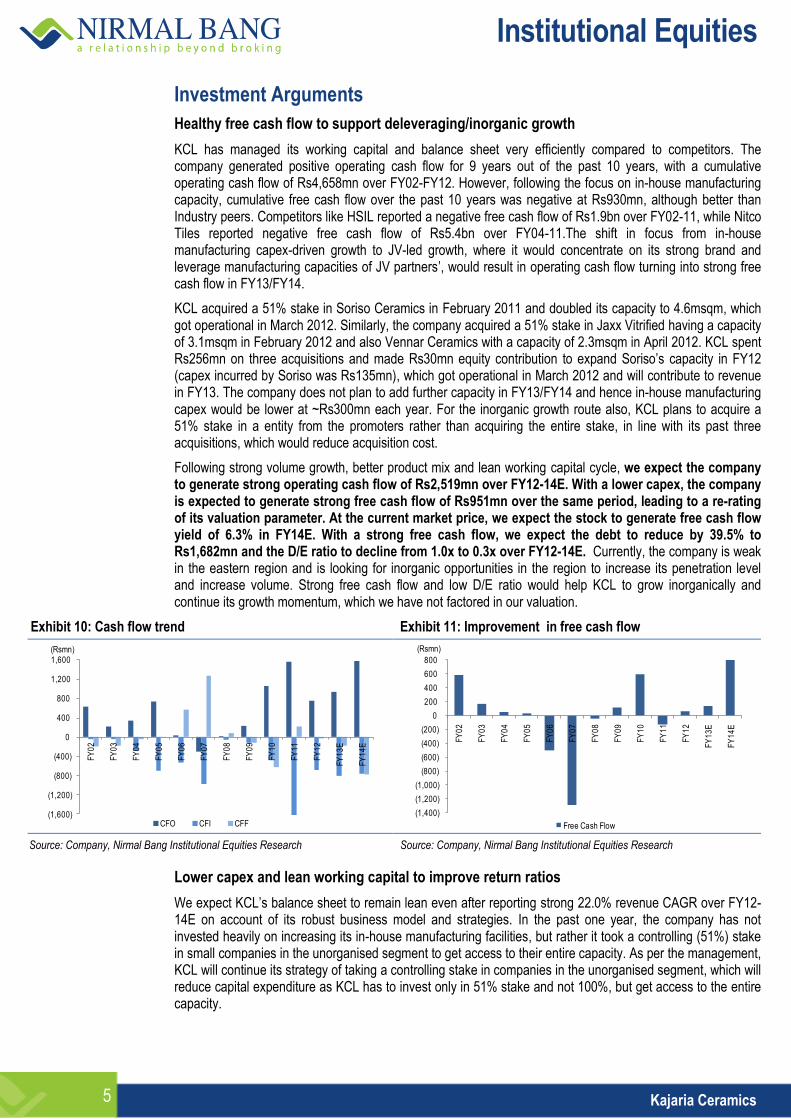
Healthy free cash flow to support deleveraging/inorganic growth
KCL has managed its working capital and balance sheet very efficiently compared to competitors. The company generated positive operating cash flow for 9 years out of the past 10 years, with a cumulative operating cash flow of Rs4,658mn over FY02-FY12. However, following the focus on in-house manufacturing capacity, cumulative free cash flow over the past 10 years was negative at Rs930mn, although better than Industry peers. Competitors like HSIL reported a negative free cash flow of Rs1.9bn over FY02-11, while Nitco Tiles reported negative free cash flow of Rs5.4bn over FY04-11.The shift in focus from in-house manufacturing capex-driven growth to JV-led growth, where it would concentrate on its strong brand and leverage manufacturing capacities of JV partners’, would result in operating cash flow turning into strong free cash flow in FY13/FY14.
KCL acquired a 51% stake in Soriso Ceramics in February 2011 and doubled its capacity to 4.6msqm, which got operational in March 2012. Similarly, the company acquired a 51% stake in Jaxx Vitrified having a capacity of 3.1msqm in February 2012 and also Vennar Ceramics with a capacity of 2.3msqm in April 2012. KCL spent Rs256mn on three acquisitions and made Rs30mn equity contribution to expand Soriso’s capacity in FY12 (capex incurred by Soriso was Rs135mn), which got operational in March 2012 and will contribute to revenue in FY13. The company does not plan to add further capacity in FY13/FY14 and hence in-house manufacturing capex would be lower at ~Rs300mn each year. For the inorganic growth route also, KCL plans to acquire a 51% stake in a entity from the promoters rather than acquiring the entire stake, in line with its past three acquisitions, which would reduce acquisition cost.
Following strong volume growth, better product mix and lean working capital cycle, we expect the company to generate strong operating cash flow of Rs2,519mn over FY12-14E. With a lower capex, the company is expected to generate strong free cash flow of Rs951mn over the same period, leading to a re-rating of its valuation parameter. At the current market price, we expect the stock to generate free cash flow yield of 6.3% in FY14E. With a strong free cash flow, we expect the debt to reduce by 39.5% to Rs1,682mn and the D/E ratio to decline from 1.0x to 0.3x over FY12-14E. Currently, the company is weak in the eastern region and is looking for inorganic opportunities in the region to increase its penetration level and increase volume. Strong free cash flow and low D/E ratio would help KCL to grow inorganically and continue its growth momentum, which we have not factored in our valuation.
Exhibit 10: Cash flow trend Exhibit 11: Improvement in free cash flow
(1,600)
(1,200)
(800)
(400)
0
400
800
1,200
1,600
FY
02
FY
03
FY
04
FY
05
FY
06
FY
07
FY
08
FY
09
FY
10
FY
11
FY
12
FY
13
E
FY
14
E
CFO CFI CFF
(Rsmn)
(1,400)
(1,200)
(1,000)
(800)
(600)
(400)
(200)
0
200
400
600
800
FY
02
FY
03
FY
04
FY
05
FY
06
FY
07
FY
08
FY
09
FY
10
FY
11
FY
12
FY
13
E
FY
14
E
Free Cash Flow
(Rsmn)
Source: Company, Nirmal Bang Institutional Equities Research Source: Company, Nirmal Bang Institutional Equities Research
Lower capex and lean working capital to improve return ratios
We expect KCL’s balance sheet to remain lean even after reporting strong 22.0% revenue CAGR over FY12-14E on account of its robust business model and strategies. In the past one year, the company has not invested heavily on increasing its in-house manufacturing facilities, but rather it took a controlling (51%) stake in small companies in the unorganised segment to get access to their entire capacity. As per the management, KCL will continue its strategy of taking a controlling stake in companies in the unorganised segment, which will reduce capital expenditure as KCL has to invest only in 51% stake and not 100%, but get access to the entire capacity.

Institutional Equities
6 Kajaria Ceramics
In addition, the volume related to the tiles bought for trading increased 72.4% in FY11 and 32.6% in FY12, accounting for 31.8% of total tiles sold in FY12, up from 21.6% in FY10. Following a higher share of trading business and growth through acquisition of a controlling stake in companies in the unorganised segment, net fixed assets turnover increased from 1.4x in FY07 to 2.8x in FY12 and we expect it to improve further to 3.6x in FY14E, the main driver for improvement in return ratios.
KCL improved inventory management in the past four years and cut inventory days from 132 in FY08 to 61 in FY12. It also brought down receivable days from 48 to 37 over the same period. Following lower inventory and receivables, ex-cash working capital as a percentage of sales reduced from 38.3% to 7.7% over FY08-12. KCL has lowest working capital in the industry, at 7.8% of sales in FY11 compared to Somay Ceramics’ 18.3%, Orient Ceramics’ 25.4%, Asian Granito’s 35%, Nitco Tiles’ 64.2% and Euro Ceramics’ 47.3%. We expect KCL to operate with a lean working capital in FY13/FY14 also. Against incremental sales of Rs6,399mn, KCL requires incremental working capital of a mere Rs697mn over FY12-14E.
Following lower capex and lean working capital requirement, we expect capital employed to remain under control. We expect capital employed to grow by a mere 9.0% against sales/EBIT growth of 22.0%/24.4%, respectively, over FY12-14E, which would improve RoCE by 529bps to 26.6% in FY14E from 21.3% in FY12. The RoE should improve by 218bps to 34.2% from 32.1% over the same period. The stock has surged 59% in the past six months, trading at its peak valuation. With the improvement in return ratios, strong free cash flow and lean balance sheet, we expect a further re-rating of the stock.
With a strong free cash flow, we expect the debt to reduce 39.5% to Rs1,682mn and the D/E ratio to decline from 1.0x to 0.3x over FY12-14E, and as a result the improvement in RoE appears to be low at 218bps compared to 529bps improvement in RoCE. Excluding the impact of lower debt, RoE would improve to 38.5% in FY14E from 32.1% in FY12.
Exhibit 12: Strong improvement in return ratios Exhibit 13: DuPont analysis
13.4 11.9
14.7 13.1
6.3
9.6 10.1
13.9 16.8
21.3 23.1
26.6
-
1
2
3
4
5
6
7
0
5
10
15
20
25
30
35
FY
03
FY
04
FY
05
FY
06
FY
07
FY
08
FY
09
FY
10
FY
11
FY
12
FY
13
E
FY
14
E
Capital employed (RHS) RoE RoCE
(%) (Rsbn)Posting growth on almost flat capital employed
Y/E March FY08 FY09 FY10 FY11 FY12 FY13E FY14E
EBIT (%) 11.6 10.5 12.0 12.5 12.7 12.6 13.2
Interest burden (x) 0.34 0.18 0.58 0.75 0.72 0.79 0.88
Tax burden (x) 0.72 0.72 0.71 0.69 0.67 0.63 0.64
Net profit/net sales (x) 2.9 1.4 4.9 6.5 6.2 6.3 7.4
Net sales/total assets (x) 0.94 1.23 1.40 1.77 2.18 2.44 2.66
Total assets/net worth (x) 3.60 3.42 2.98 2.62 2.39 2.07 1.73
RoE (%) 9.7 5.8 20.7 30.0 32.1 31.7 34.2
Source: Company, Nirmal Bang Institutional Equities Research Source: Company, Nirmal Bang Institutional Equities Research
Exhibit 14: Operating with lean working capital Exhibit 15: Best working capital position in industry
158 171
161
117
56
106
122 132
78
60
28
42 43 43
-
20
40
60
80
100
120
140
160
180
0
20
40
60
80
100
120
140
FY
01
FY
02
FY
03
FY
04
FY
05
FY
06
FY
07
FY
08
FY
09
FY
10
FY
11
FY
12
FY
13
E
FY
14
E
NWC (RHS) Inventory Debtors Creditors
(Days) (Days)
19.6 28.9 37.8 38.3 30.3 20.6 7.8 7.7 10
20
30
40
50
60
70
80
90
100
110
0
10
20
30
40
50
60
FY05 FY06 FY07 FY08 FY09 FY10 FY11 FY12
Kajaria Ceramics Somany Ceramics Orient Ceramics
Asian Granito Nitco Tiles (RHS) Euro Ceramics (RHS)
(% of sales) (% of sales)
Source: Company, Nirmal Bang Institutional Equities Research Source: Company, Nirmal Bang Institutional Equities Research

Institutional Equities
7 Kajaria Ceramics
Strong brand equity to benefit from buoyant industry growth
KCL is the largest manufacturer of tiles in terms of capacity and the second-largest in terms of revenue after H&R Johnson. The company invested Rs1,120mn on brand building in the past 10 years, over 2002-12, as a result of which it enjoys strong brand equity with a market share of 16.8% in the organised segment. As per the management, KCL is able to sell its tiles at a 5-6% premium to its competitors on the back of its strong brand equity.
Over the years, KCL has narrowed the gap between itself and the largest player H&R Johnson. Against gross sales growth of 17.5% at Rs17.3bn reported by H&R Johnson, KCL reported a growth of 40.0% at Rs14.1bn in FY12. KCL reported 26.4% CAGR in gross sales over FY07-12 compared to 13.3% CAGR posted by H&R Johnson. If KCL continues to grow at a strong pace with strong brand equity (in the backdrop of robust industry growth) coupled with its inorganic growth via JVs, the company can attain the top slot a few years down the line. H&R Johnson is more focused on government projects, while KCL is more focused on retail consumers, and as a result it would benefit the most from the shift in consumer preference towards branded products.
KCL was able to increase its market share in the organised segment from ~13.1%/13% in FY07/10 to 14.2%/16.8% in FY11/12. Following higher disposable income, rising middle class population, rapid urbanisation and rising market share of players in the organised segment, the tile industry is expected to grow 15-16% over the next five years.
KCL, the second-largest tile player in India with a strong brand equity with a market share of 16.8% in the organised segment, is best placed to convert buoyant industry growth into healthy cash flow and return rations, and is expected to register net sales/EBITDA/net profit CAGRs of 22%/21.8%/34.1%, respectively, over FY12-14E against the growth in capital employed of a mere 9%. Following premiumisation of its portfolio, average realisation in tiles should also witness a 5.4% CAGR at Rs396/sqm over the same period.
Promising industry outlook to benefit Kajaria Ceramics the most
Indian tile industry, estimated at Rs165bn with 625msqm as of FY12, has been posting a 15-16% CAGR over the past five years. The domestic industry, third-largest in the world, both in manufacturing and consumption terms, is fragmented in nature with the organised segment accounting for 50% of the market, with the balance being catered to by the unorganised segment comprising a large numbers of small players based in Morbi, Gujarat. H&R Johnson is market leader with a share of 20.6% in the organised segment followed by KCL at 16.8%, Nitco Tiles at 11.4%, Somany Ceramics at 11%, and Asian Granito at 7.4%. The tile industry in India flourished after anti-dumping duty was levied on Chinese tile imports in 2009.
Of the total 192mn houses built in CY01, the urban areas accounted for only 28.1%. The number of houses in urban areas grew at a faster pace of 2.8% CAGR compared to 1.7% CAGR in houses built in rural areas over CY01-11. On account of faster pace of growth in urban areas, the share of houses built in urban areas increased from 28.1% in CY01 to 30.3% in CY11. As per a CRISIL Research report, due to higher growth of 2.7% of houses built in urban areas compared to 1.5% growth of houses built in rural areas, the share of houses built in urban areas would go up to 31.3% by CY11-CY15E.
As a result of rapid capacity addition and a gradual shift in consumer taste towards value added products, the market share of top 10 players in the tile industry grew from ~36% in FY07 to ~41% in FY12. As per Ceramic World magazine, the middle class population in India is expected to grow at a faster pace of 14.5% CAGR over CY10-15E compared to emerging markets like China, Russia and Brazil which are expected to grow 12.8%,6.2%, 7.5%, respectively. Per capita consumption of tiles is very low in India at 0.46sqm compared to 2.61sqm for China, 3.67sqm for Brazil and 3.84sqm for Vietnam. Following higher disposable income, rising middle class population, rapid urbanisation and rising market share of players in the organised segment, the tile industry is expected to grow 15-16% over the next five years. KCL, being the second-largest player in the industry, would benefit the most from the fast-paced growth of the industry.
Institutional Equities
8 Kajaria Ceramics
Exhibit 16: Rising urbanisation Exhibit 17: Rising concentration* Exhibit 18: Indian tile industry’s growth
28.1 28.1
28.5 28.8 28.8
29.1
29.5 29.7
30.1 30.0
30.3 30.5
30.9 31.0
31.3
28.0
28.5
29.0
29.5
30.0
30.5
31.0
31.5
0
20
40
60
80
100
120
140
160
180
20
01
20
02
20
03
20
04
20
05
20
06
20
07
20
08
20
09
20
10
20
11
20
12
E
20
13
E
20
14
E
20
15
E
Urban Rural Share of urban house (%)
(mn) (%)
72
75
77 76
79
82
70
72
74
76
78
80
82
84
FY07 FY08 FY09 FY10 FY11 FY12
(%)
235 270 303 350 397 403 494 557 625
14.9
12.2
15.5
13.4
1.5
22.6
12.8 12.2
0
5
10
15
20
25
0
100
200
300
400
500
600
700
CY03 CY04 CY05 CY06 CY07 CY08 CY09 CY10 CY11
Indian tile industry Growth (%)
(msqm) (%)
Note: Revenue share of top 5 players in aggregate revenue of top 10 players (Exhibit 17)
Source: Company, Ceramic World, Industry, Nirmal Bang Institutional Equities Research
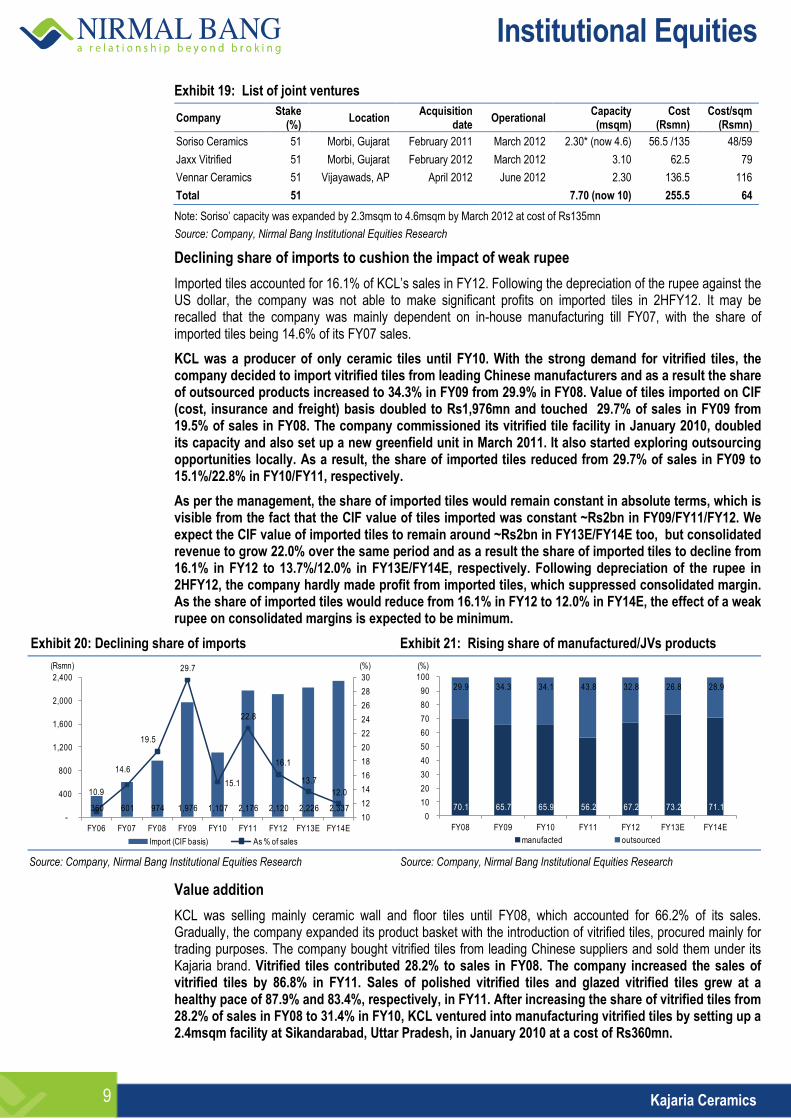
Rising market share/penetration through JVs
KCL has strong brand equity with a market share of 16.8% among players in the organised segment. In order to capitalise on brand equity, improved return ratios and a rise in capacity without lead time, the company followed the inorganic acquisition route through joint ventures. Through this route, KCL acquired a 51% stake in small companies in the unorganised segment, located in different geographies, where the existing promoters still continue to manage the operations. KCL buys tiles from the acquired companies on cost plus pre-determined margin basis (10% in most of the cases) and sells them under its Kajaria brand at a higher price.
It would be win-win situation for both, as the promoter of acquired company would be able to increase capacity utilisation, leading to higher profitability, while KCL gets access to tile capacity in various geographies with a low investment (as KCL has to invest in only 51% stake) and also the control over product quality. Tiles are bulky in nature and as a result the transportation cost is a key element affecting operating margin. For example, transportation cost from Delhi to Kerala amounts to 10-15% of sales and takes transit time of 15 days. Before the acquisitions, KCL had manufacturing plants in Rajasthan and Uttar Pradesh only, which affected its distribution reach in the western, southern and eastern regions. This was evident from that fact that of its total revenue, the northern region accounted for 50%, followed by western and southern regions at 20% each and the eastern region at just 10%. With the three acquisitions, two in Gujarat and one in Andhra Pradesh, KCL would be able to reduce transportation costs and thereby improve its market share in the western and southern regions.
The company started expansion through the JV route in February 2011 with the acquisition of Soriso Ceramics having a capacity of 2.30msqm for Rs56.5mn. KCL become aggressive on JVs off late, which is evident from the fact that in a span of just three months it acquired Jaxx Vitrified having a capacity of 3.10msqm in February 2012 for Rs62.5mn followed by Vennar Ceramics having a capacity of 2.30msqm in April 2012 for Rs136.5mn. Post acquisition, Sorisso Ceramics doubled the capacity to 4.6msqm by March 2012 at a cost of Rs135mn and out of that KCL infused Rs30mn as part of its equity contribution, with the balance amount being funded through equity infusion by the earlier promoter and also by taking additional debt on the books of Sorisso. On the back of three acquisitions at a cost of Rs255.5mn and expansion at Soriso Ceramics, the company increased its manufacturing capacity by 35.3% to 38.3msqm in FY13, as a result of which it should report strong sales volume growth of 18.1% at 46.5msqm in FY13E.
As KCL acquired small companies in the unorganised segment, the cost of acquisition was low, close to book value of the plant, which is evident from the fact that goodwill on its balance sheet was just Rs55mn (on gross basis) after an addition of Rs17mn in FY12. With the acquisition of three companies, KCL has increased its market penetration level in the western and southern regions, but continues to remain weak in the eastern region. The company is exploring opportunities to acquire a company based in the eastern region to increase its penetration level in this region. Also, as per the management, KCL would continue to explore inorganic opportunities to grow faster than the industry average, at 20-25%, for the next couple of years. As KCL has to invest only 51% in a company to get access to its full capacity, incremental RoCE would be higher. Growth through the JV route is a viable business model in the tile industry as industry leader H&R Johnson also grew aggressively through this route and had 11JVs (until FY11), contributing 45% to its total sales.
Institutional Equities
9 Kajaria Ceramics
Exhibit 19: List of joint ventures
Company Stake
(%) Location
Acquisition date
Operational Capacity (msqm)
Cost (Rsmn)
Cost/sqm (Rsmn)
Soriso Ceramics 51 Morbi, Gujarat February 2011 March 2012 2.30* (now 4.6) 56.5 /135 48/59
Jaxx Vitrified 51 Morbi, Gujarat February 2012 March 2012 3.10 62.5 79
Vennar Ceramics 51 Vijayawads, AP April 2012 June 2012 2.30 136.5 116
Total 51 7.70 (now 10) 255.5 64
Note: Soriso’ capacity was expanded by 2.3msqm to 4.6msqm by March 2012 at cost of Rs135mn
Source: Company, Nirmal Bang Institutional Equities Research
Declining share of imports to cushion the impact of weak rupee
Imported tiles accounted for 16.1% of KCL’s sales in FY12. Following the depreciation of the rupee against the US dollar, the company was not able to make significant profits on imported tiles in 2HFY12. It may be recalled that the company was mainly dependent on in-house manufacturing till FY07, with the share of imported tiles being 14.6% of its FY07 sales.
KCL was a producer of only ceramic tiles until FY10. With the strong demand for vitrified tiles, the company decided to import vitrified tiles from leading Chinese manufacturers and as a result the share of outsourced products increased to 34.3% in FY09 from 29.9% in FY08. Value of tiles imported on CIF (cost, insurance and freight) basis doubled to Rs1,976mn and touched 29.7% of sales in FY09 from 19.5% of sales in FY08. The company commissioned its vitrified tile facility in January 2010, doubled its capacity and also set up a new greenfield unit in March 2011. It also started exploring outsourcing opportunities locally. As a result, the share of imported tiles reduced from 29.7% of sales in FY09 to 15.1%/22.8% in FY10/FY11, respectively.
As per the management, the share of imported tiles would remain constant in absolute terms, which is visible from the fact that the CIF value of tiles imported was constant ~Rs2bn in FY09/FY11/FY12. We expect the CIF value of imported tiles to remain around ~Rs2bn in FY13E/FY14E too, but consolidated revenue to grow 22.0% over the same period and as a result the share of imported tiles to decline from 16.1% in FY12 to 13.7%/12.0% in FY13E/FY14E, respectively. Following depreciation of the rupee in 2HFY12, the company hardly made profit from imported tiles, which suppressed consolidated margin. As the share of imported tiles would reduce from 16.1% in FY12 to 12.0% in FY14E, the effect of a weak rupee on consolidated margins is expected to be minimum.
Exhibit 20: Declining share of imports Exhibit 21: Rising share of manufactured/JVs products
360 601 974 1,976 1,107 2,176 2,120 2,226 2,337
10.9
14.6
19.5
29.7
15.1
22.8
16.1
13.7
12.0
10
12
14
16
18
20
22
24
26
28
30
-
400
800
1,200
1,600
2,000
2,400
FY06 FY07 FY08 FY09 FY10 FY11 FY12 FY13E FY14E
Import (CIF basis) As % of sales
(Rsmn) (%)
70.1 65.7 65.9 56.2 67.2 73.2 71.1
29.9 34.3 34.1 43.8 32.8 26.8 28.9
0
10
20
30
40
50
60
70
80
90
100
FY08 FY09 FY10 FY11 FY12 FY13E FY14E
manufacted outsourced
(%)
Source: Company, Nirmal Bang Institutional Equities Research Source: Company, Nirmal Bang Institutional Equities Research
Value addition
KCL was selling mainly ceramic wall and floor tiles until FY08, which accounted for 66.2% of its sales. Gradually, the company expanded its product basket with the introduction of vitrified tiles, procured mainly for trading purposes. The company bought vitrified tiles from leading Chinese suppliers and sold them under its Kajaria brand. Vitrified tiles contributed 28.2% to sales in FY08. The company increased the sales of vitrified tiles by 86.8% in FY11. Sales of polished vitrified tiles and glazed vitrified tiles grew at a healthy pace of 87.9% and 83.4%, respectively, in FY11. After increasing the share of vitrified tiles from 28.2% of sales in FY08 to 31.4% in FY10, KCL ventured into manufacturing vitrified tiles by setting up a 2.4msqm facility at Sikandarabad, Uttar Pradesh, in January 2010 at a cost of Rs360mn.
Institutional Equities
10 Kajaria Ceramics
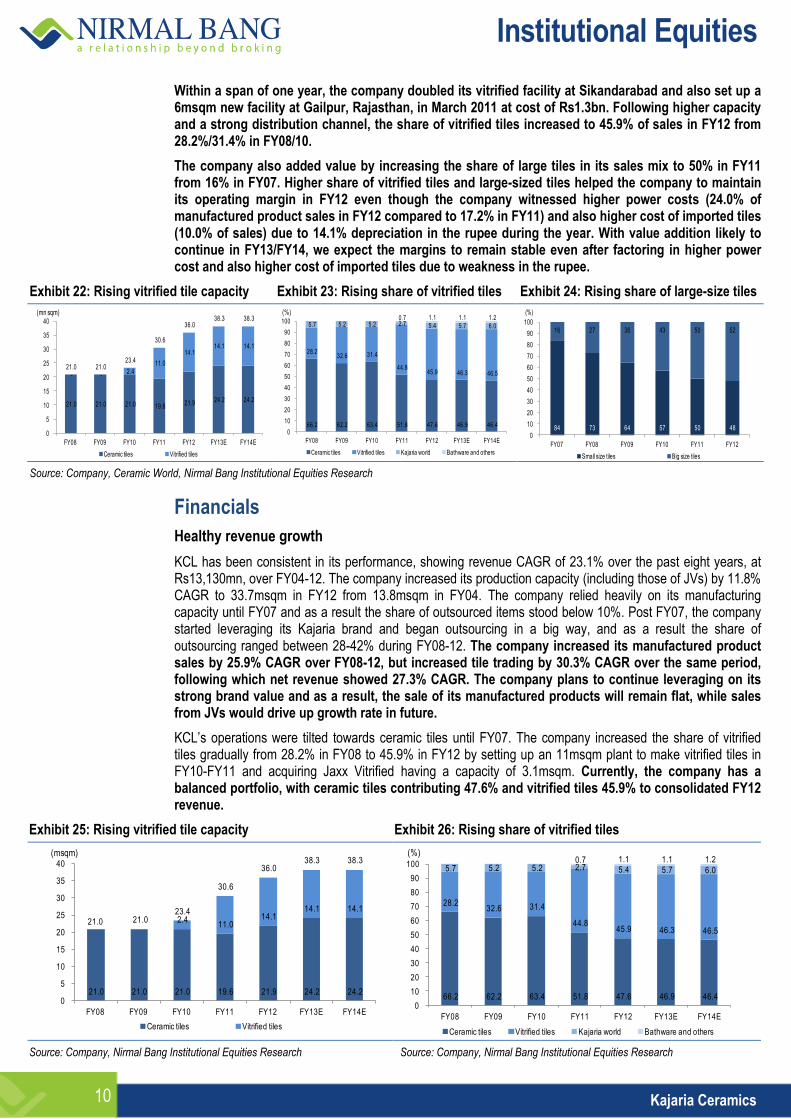
Within a span of one year, the company doubled its vitrified facility at Sikandarabad and also set up a 6msqm new facility at Gailpur, Rajasthan, in March 2011 at cost of Rs1.3bn. Following higher capacity and a strong distribution channel, the share of vitrified tiles increased to 45.9% of sales in FY12 from 28.2%/31.4% in FY08/10.
The company also added value by increasing the share of large tiles in its sales mix to 50% in FY11 from 16% in FY07. Higher share of vitrified tiles and large-sized tiles helped the company to maintain its operating margin in FY12 even though the company witnessed higher power costs (24.0% of manufactured product sales in FY12 compared to 17.2% in FY11) and also higher cost of imported tiles (10.0% of sales) due to 14.1% depreciation in the rupee during the year. With value addition likely to continue in FY13/FY14, we expect the margins to remain stable even after factoring in higher power cost and also higher cost of imported tiles due to weakness in the rupee.
Exhibit 22: Rising vitrified tile capacity Exhibit 23: Rising share of vitrified tiles Exhibit 24: Rising share of large-size tiles
21.0 21.0 21.0 19.6 21.9 24.2 24.2
- - 2.4 11.0
14.1 14.1 14.1
21.0 21.0 23.4
30.6
36.0 38.3 38.3
0
5
10
15
20
25
30
35
40
FY08 FY09 FY10 FY11 FY12 FY13E FY14E
Ceramic tiles Vitrified tiles
(mn sqm)
66.2 62.2 63.4 51.8 47.6 46.9 46.4
28.2 32.6 31.4
44.8 45.9 46.3 46.5
5.7 5.2 5.2 2.7 5.4 5.7 6.0 0.7 1.1 1.1 1.2
0
10
20
30
40
50
60
70
80
90
100
FY08 FY09 FY10 FY11 FY12 FY13E FY14E
Ceramic tiles Vitrified tiles Kajaria world Bathware and others
(%)
84 73 64 57 50 48
16 27 36 43 50 52
0
10
20
30
40
50
60
70
80
90
100
FY07 FY08 FY09 FY10 FY11 FY12
Small size tiles Big size tiles
(%)
Source: Company, Ceramic World, Nirmal Bang Institutional Equities Research
Financials
Healthy revenue growth
KCL has been consistent in its performance, showing revenue CAGR of 23.1% over the past eight years, at Rs13,130mn, over FY04-12. The company increased its production capacity (including those of JVs) by 11.8% CAGR to 33.7msqm in FY12 from 13.8msqm in FY04. The company relied heavily on its manufacturing capacity until FY07 and as a result the share of outsourced items stood below 10%. Post FY07, the company started leveraging its Kajaria brand and began outsourcing in a big way, and as a result the share of outsourcing ranged between 28-42% during FY08-12. The company increased its manufactured product sales by 25.9% CAGR over FY08-12, but increased tile trading by 30.3% CAGR over the same period, following which net revenue showed 27.3% CAGR. The company plans to continue leveraging on its strong brand value and as a result, the sale of its manufactured products will remain flat, while sales from JVs would drive up growth rate in future.
KCL’s operations were tilted towards ceramic tiles until FY07. The company increased the share of vitrified tiles gradually from 28.2% in FY08 to 45.9% in FY12 by setting up an 11msqm plant to make vitrified tiles in FY10-FY11 and acquiring Jaxx Vitrified having a capacity of 3.1msqm. Currently, the company has a balanced portfolio, with ceramic tiles contributing 47.6% and vitrified tiles 45.9% to consolidated FY12 revenue.
Exhibit 25: Rising vitrified tile capacity Exhibit 26: Rising share of vitrified tiles
21.0 21.0 21.0 19.6 21.9 24.2 24.2
2.4 11.0
14.1 14.1 14.1
21.0 21.0 23.4
30.6
36.0 38.3 38.3
0
5
10
15
20
25
30
35
40
FY08 FY09 FY10 FY11 FY12 FY13E FY14E
Ceramic tiles Vitrified tiles
(msqm)
66.2 62.2 63.4 51.8 47.6 46.9 46.4
28.2 32.6 31.4
44.8 45.9 46.3 46.5
5.7 5.2 5.2 2.7 5.4 5.7 6.0 0.7 1.1 1.1 1.2
0
10
20
30
40
50
60
70
80
90
100
FY08 FY09 FY10 FY11 FY12 FY13E FY14E
Ceramic tiles Vitrified tiles Kajaria world Bathware and others
(%)
Source: Company, Nirmal Bang Institutional Equities Research Source: Company, Nirmal Bang Institutional Equities Research
Institutional Equities
11 Kajaria Ceramics
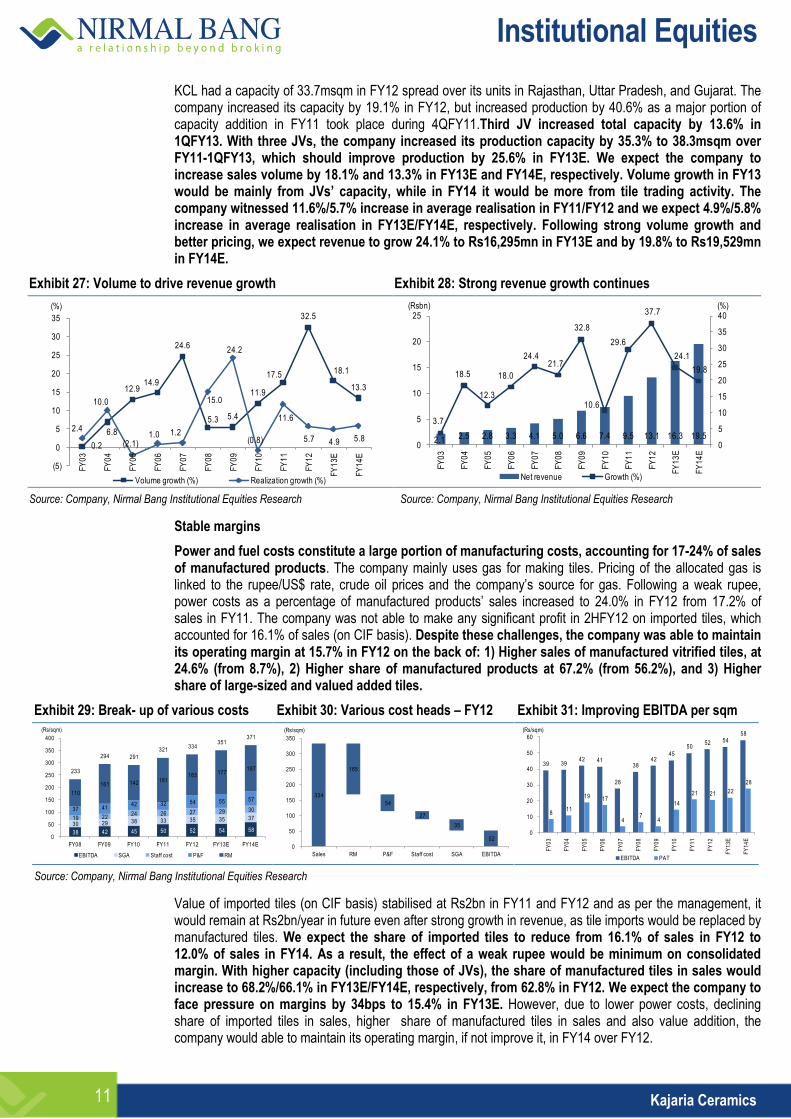
KCL had a capacity of 33.7msqm in FY12 spread over its units in Rajasthan, Uttar Pradesh, and Gujarat. The company increased its capacity by 19.1% in FY12, but increased production by 40.6% as a major portion of capacity addition in FY11 took place during 4QFY11.Third JV increased total capacity by 13.6% in 1QFY13. With three JVs, the company increased its production capacity by 35.3% to 38.3msqm over FY11-1QFY13, which should improve production by 25.6% in FY13E. We expect the company to increase sales volume by 18.1% and 13.3% in FY13E and FY14E, respectively. Volume growth in FY13 would be mainly from JVs’ capacity, while in FY14 it would be more from tile trading activity. The company witnessed 11.6%/5.7% increase in average realisation in FY11/FY12 and we expect 4.9%/5.8% increase in average realisation in FY13E/FY14E, respectively. Following strong volume growth and better pricing, we expect revenue to grow 24.1% to Rs16,295mn in FY13E and by 19.8% to Rs19,529mn in FY14E.
Exhibit 27: Volume to drive revenue growth Exhibit 28: Strong revenue growth continues
0.2
6.8
12.914.9
24.6
5.3 5.4
11.9
17.5
32.5
18.1
13.3
2.4
10.0
(2.1)1.0 1.2
15.0
24.2
(0.8)
11.6
5.7 4.9 5.8
(5)
0
5
10
15
20
25
30
35
FY
03
FY
04
FY
05
FY
06
FY
07
FY
08
FY
09
FY
10
FY
11
FY
12
FY
13
E
FY
14
E
Volume growth (%) Realization growth (%)
(%)
2.1 2.5 2.8 3.3 4.1 5.0 6.6 7.4 9.5 13.1 16.3 19.5
3.7
18.5
12.3
18.0
24.4 21.7
32.8
10.6
29.6
37.7
24.1
19.8
0
5
10
15
20
25
30
35
40
0
5
10
15
20
25
FY
03
FY
04
FY
05
FY
06
FY
07
FY
08
FY
09
FY
10
FY
11
FY
12
FY
13
E
FY
14
E
Net revenue Growth (%)
(%)(Rsbn)
Source: Company, Nirmal Bang Institutional Equities Research Source: Company, Nirmal Bang Institutional Equities Research
Stable margins
Power and fuel costs constitute a large portion of manufacturing costs, accounting for 17-24% of sales of manufactured products. The company mainly uses gas for making tiles. Pricing of the allocated gas is linked to the rupee/US$ rate, crude oil prices and the company’s source for gas. Following a weak rupee, power costs as a percentage of manufactured products’ sales increased to 24.0% in FY12 from 17.2% of sales in FY11. The company was not able to make any significant profit in 2HFY12 on imported tiles, which accounted for 16.1% of sales (on CIF basis). Despite these challenges, the company was able to maintain its operating margin at 15.7% in FY12 on the back of: 1) Higher sales of manufactured vitrified tiles, at 24.6% (from 8.7%), 2) Higher share of manufactured products at 67.2% (from 56.2%), and 3) Higher share of large-sized and valued added tiles.
Exhibit 29: Break- up of various costs Exhibit 30: Various cost heads – FY12 Exhibit 31: Improving EBITDA per sqm
38 42 45 50 52 54 58 30 29 38 33 35 35 37 19 22
24 26 27 29 30 37 41 42 32 54 55 57
110
161 142 181 165 177
187 233
294 291
321 334
351 371
0
50
100
150
200
250
300
350
400
FY08 FY09 FY10 FY11 FY12 FY13E FY14E
EBITDA SGA Staff cost P&F RM
(Rs/sqm)
334
165
54
27
35
52
0
50
100
150
200
250
300
350
Sales RM P&F Staff cost SGA EBITDA
(Rs/sqm)
39 39 42 41
28
38 42
45 50
52 54 58
8 11
19 17
4 7
4
14
21 21 22
28
0
10
20
30
40
50
60
FY
03
FY
04
FY
05
FY
06
FY
07
FY
08
FY
09
FY
10
FY
11
FY
12
FY
13
E
FY
14
E
EBITDA PAT
(Rs/sqm)
Source: Company, Nirmal Bang Institutional Equities Research
Value of imported tiles (on CIF basis) stabilised at Rs2bn in FY11 and FY12 and as per the management, it would remain at Rs2bn/year in future even after strong growth in revenue, as tile imports would be replaced by manufactured tiles. We expect the share of imported tiles to reduce from 16.1% of sales in FY12 to 12.0% of sales in FY14. As a result, the effect of a weak rupee would be minimum on consolidated margin. With higher capacity (including those of JVs), the share of manufactured tiles in sales would increase to 68.2%/66.1% in FY13E/FY14E, respectively, from 62.8% in FY12. We expect the company to face pressure on margins by 34bps to 15.4% in FY13E. However, due to lower power costs, declining share of imported tiles in sales, higher share of manufactured tiles in sales and also value addition, the company would able to maintain its operating margin, if not improve it, in FY14 over FY12.
Institutional Equities
12 Kajaria Ceramics
We expect the company to report operating margin of 15.7% in FY14E, in line with 15.7% reported in FY12. Following strong revenue growth, operating profit should grow 21.4%/22.2% in FY13E/FY14E, respectively.
Exhibit 32: Improving EBITDA/ sqm Exhibit 33: Profitability trend
39 39 42 41
28
38 42
45 50
52 54 58
8 11
19 17
4 7
4
14
21 21 22
28
0
10
20
30
40
50
60
FY
03
FY
04
FY
05
FY
06
FY
07
FY
08
FY
09
FY
10
FY
11
FY
12
FY
13
E
FY
14
E
EBITDA PAT
(Rs/sqm)
22.0 19.9
21.3 20.5
13.7
16.4
14.3 15.6 15.6 15.7 15.4 15.7
4.8 5.4
9.6 8.5
1.9 2.9
1.4
4.9 6.5 6.2 6.3
7.4
0
2
4
6
8
10
12
14
16
18
20
22
0.0
0.5
1.0
1.5
2.0
2.5
3.0
FY
03
FY
04
FY
05
FY
06
FY
07
FY
08
FY
09
FY
10
FY
11
FY
12
FY
13
E
FY
14
E
EBIDTA PAT EBIDTA (%) PAT (%)
(%)(Rsbn)
Source: Company, Nirmal Bang Institutional Equities Research Source: Company, Nirmal Bang Institutional Equities Research
Lower debt as well as interest rates to drive profitability
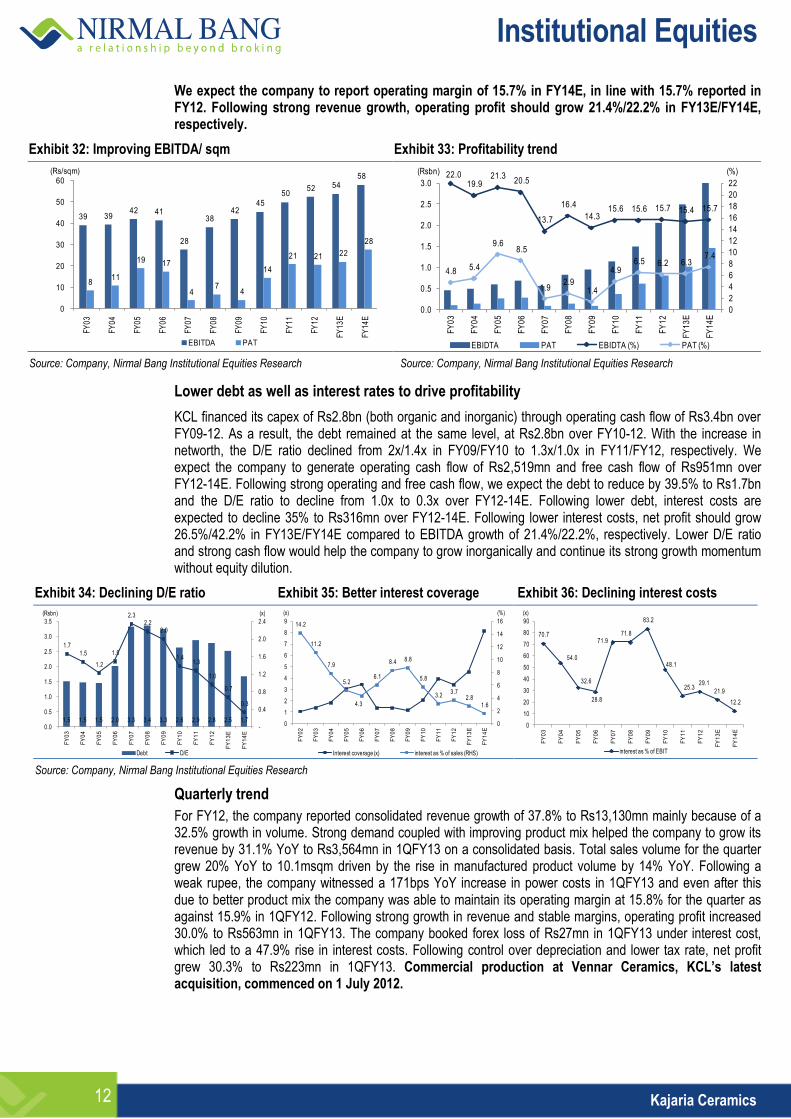
KCL financed its capex of Rs2.8bn (both organic and inorganic) through operating cash flow of Rs3.4bn over FY09-12. As a result, the debt remained at the same level, at Rs2.8bn over FY10-12. With the increase in networth, the D/E ratio declined from 2x/1.4x in FY09/FY10 to 1.3x/1.0x in FY11/FY12, respectively. We expect the company to generate operating cash flow of Rs2,519mn and free cash flow of Rs951mn over FY12-14E. Following strong operating and free cash flow, we expect the debt to reduce by 39.5% to Rs1.7bn and the D/E ratio to decline from 1.0x to 0.3x over FY12-14E. Following lower debt, interest costs are expected to decline 35% to Rs316mn over FY12-14E. Following lower interest costs, net profit should grow 26.5%/42.2% in FY13E/FY14E compared to EBITDA growth of 21.4%/22.2%, respectively. Lower D/E ratio and strong cash flow would help the company to grow inorganically and continue its strong growth momentum without equity dilution.
Exhibit 34: Declining D/E ratio Exhibit 35: Better interest coverage Exhibit 36: Declining interest costs
1.5 1.5 1.5 2.0 3.3 3.4 3.3 2.6 2.9 2.8 2.5 1.7
1.7
1.5
1.2
1.5
2.3 2.2
2.0
1.4 1.3
1.0
0.7
0.3
-
0.4
0.8
1.2
1.6
2.0
2.4
0.0
0.5
1.0
1.5
2.0
2.5
3.0
3.5
FY
03
FY
04
FY
05
FY
06
FY
07
FY
08
FY
09
FY
10
FY
11
FY
12
FY
13
E
FY
14
E
Debt D/E
(Rsbn) (x)
14.2
11.2
7.9
5.2
4.3
6.1
8.4 8.8
5.8
3.2 3.7
2.8 1.6
0
2
4
6
8
10
12
14
16
0
1
2
3
4
5
6
7
8
9
FY
02
FY
03
FY
04
FY
05
FY
06
FY
07
FY
08
FY
09
FY
10
FY
11
FY
12
FY
13
E
FY
14
E
Interest coverage (x) interest as % of sales (RHS)
(x) (%)
70.7
54.0
32.6
28.8
71.9 71.8
83.2
48.1
25.3 29.1
21.9
12.2
0
10
20
30
40
50
60
70
80
90
FY
03
FY
04
FY
05
FY
06
FY
07
FY
08
FY
09
FY
10
FY
11
FY
12
FY
13
E
FY
14
E
interest as % of EBIT
(x)
Source: Company, Nirmal Bang Institutional Equities Research
Quarterly trend
For FY12, the company reported consolidated revenue growth of 37.8% to Rs13,130mn mainly because of a 32.5% growth in volume. Strong demand coupled with improving product mix helped the company to grow its revenue by 31.1% YoY to Rs3,564mn in 1QFY13 on a consolidated basis. Total sales volume for the quarter grew 20% YoY to 10.1msqm driven by the rise in manufactured product volume by 14% YoY. Following a weak rupee, the company witnessed a 171bps YoY increase in power costs in 1QFY13 and even after this due to better product mix the company was able to maintain its operating margin at 15.8% for the quarter as against 15.9% in 1QFY12. Following strong growth in revenue and stable margins, operating profit increased 30.0% to Rs563mn in 1QFY13. The company booked forex loss of Rs27mn in 1QFY13 under interest cost, which led to a 47.9% rise in interest costs. Following control over depreciation and lower tax rate, net profit grew 30.3% to Rs223mn in 1QFY13. Commercial production at Vennar Ceramics, KCL’s latest acquisition, commenced on 1 July 2012.
Institutional Equities
13 Kajaria Ceramics
Exhibit 37: Quarterly financial performance
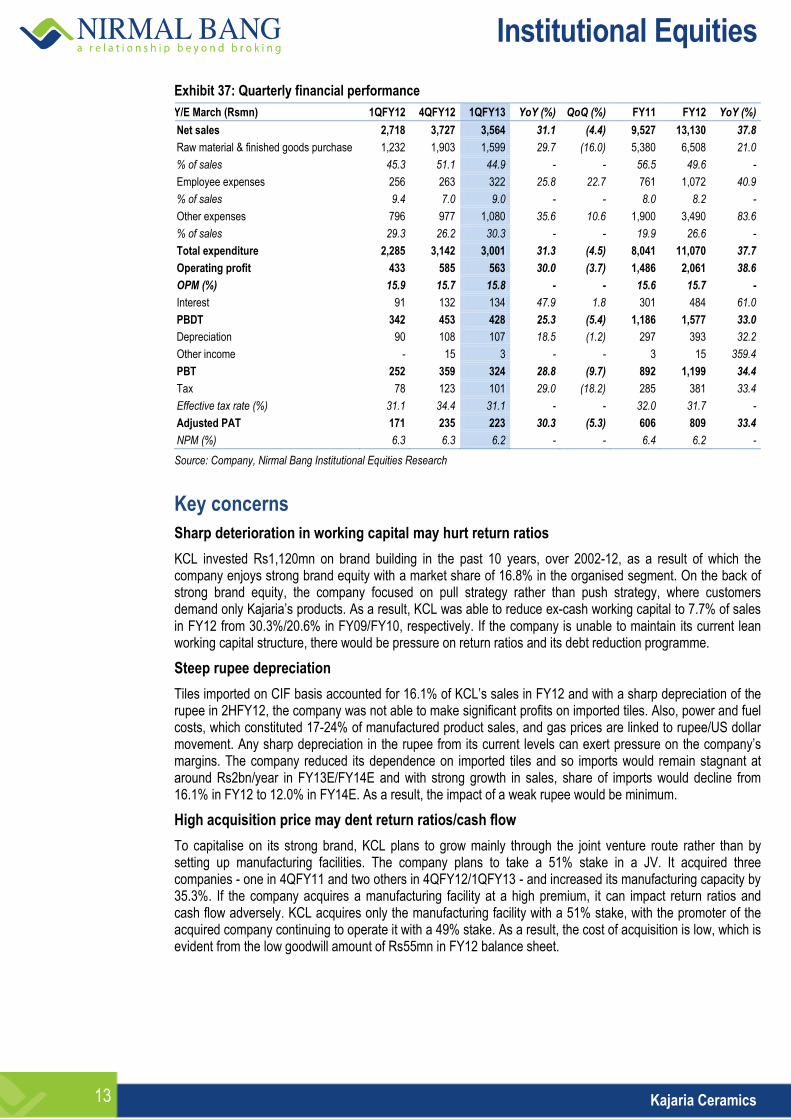
Y/E March (Rsmn) 1QFY12 4QFY12 1QFY13 YoY (%) QoQ (%) FY11 FY12 YoY (%)
Net sales 2,718 3,727 3,564 31.1 (4.4) 9,527 13,130 37.8
Raw material & finished goods purchase 1,232 1,903 1,599 29.7 (16.0) 5,380 6,508 21.0
% of sales 45.3 51.1 44.9 - - 56.5 49.6 -
Employee expenses 256 263 322 25.8 22.7 761 1,072 40.9
% of sales 9.4 7.0 9.0 - - 8.0 8.2 -
Other expenses 796 977 1,080 35.6 10.6 1,900 3,490 83.6
% of sales 29.3 26.2 30.3 - - 19.9 26.6 -
Total expenditure 2,285 3,142 3,001 31.3 (4.5) 8,041 11,070 37.7
Operating profit 433 585 563 30.0 (3.7) 1,486 2,061 38.6
OPM (%) 15.9 15.7 15.8 - - 15.6 15.7 -
Interest 91 132 134 47.9 1.8 301 484 61.0
PBDT 342 453 428 25.3 (5.4) 1,186 1,577 33.0
Depreciation 90 108 107 18.5 (1.2) 297 393 32.2
Other income - 15 3 - - 3 15 359.4
PBT 252 359 324 28.8 (9.7) 892 1,199 34.4
Tax 78 123 101 29.0 (18.2) 285 381 33.4
Effective tax rate (%) 31.1 34.4 31.1 - - 32.0 31.7 -
Adjusted PAT 171 235 223 30.3 (5.3) 606 809 33.4
NPM (%) 6.3 6.3 6.2 - - 6.4 6.2 -
Source: Company, Nirmal Bang Institutional Equities Research
Key concerns
Sharp deterioration in working capital may hurt return ratios
KCL invested Rs1,120mn on brand building in the past 10 years, over 2002-12, as a result of which the company enjoys strong brand equity with a market share of 16.8% in the organised segment. On the back of strong brand equity, the company focused on pull strategy rather than push strategy, where customers demand only Kajaria’s products. As a result, KCL was able to reduce ex-cash working capital to 7.7% of sales in FY12 from 30.3%/20.6% in FY09/FY10, respectively. If the company is unable to maintain its current lean working capital structure, there would be pressure on return ratios and its debt reduction programme.
Steep rupee depreciation
Tiles imported on CIF basis accounted for 16.1% of KCL’s sales in FY12 and with a sharp depreciation of the rupee in 2HFY12, the company was not able to make significant profits on imported tiles. Also, power and fuel costs, which constituted 17-24% of manufactured product sales, and gas prices are linked to rupee/US dollar movement. Any sharp depreciation in the rupee from its current levels can exert pressure on the company’s margins. The company reduced its dependence on imported tiles and so imports would remain stagnant at around Rs2bn/year in FY13E/FY14E and with strong growth in sales, share of imports would decline from 16.1% in FY12 to 12.0% in FY14E. As a result, the impact of a weak rupee would be minimum.
High acquisition price may dent return ratios/cash flow
To capitalise on its strong brand, KCL plans to grow mainly through the joint venture route rather than by setting up manufacturing facilities. The company plans to take a 51% stake in a JV. It acquired three companies - one in 4QFY11 and two others in 4QFY12/1QFY13 - and increased its manufacturing capacity by 35.3%. If the company acquires a manufacturing facility at a high premium, it can impact return ratios and cash flow adversely. KCL acquires only the manufacturing facility with a 51% stake, with the promoter of the acquired company continuing to operate it with a 49% stake. As a result, the cost of acquisition is low, which is evident from the low goodwill amount of Rs55mn in FY12 balance sheet.

Institutional Equities
14 Kajaria Ceramics
Competition from players in unorganised segment
Currently, players in the unorganised segment account for 50% of the tile market in India. Most of the players in the unorganised segment are located mainly at Morbi in Gujarat and because of high transportation costs the market share of these players is high in the western region and low in other regions. KCL is weak in the western region, deriving around 20% of sales from the region. In order to increase its penetration and market share in the western region, the company acquired two Morbi-based companies in the past two years. Any stiff competition from players in the unorganised segment can exert pressure on margins. The company focuses more on the pull model (through advertisements and strong brand equity) to compete with players in the organised as well as unorganised segments.
Removal of anti-dumping duty on Chinese tiles
Following stiff competition from Chinese players, the profitability of Indian tile manufacturers was under strain in FY07. KCL also witnessed a decline in its operating margin from 20.5% in FY06 to 13.7% in FY07. In order to safeguard Indian manufacturers, anti-dumping duty was levied on ceramic tiles in 2009 and on vitrified tiles in 2004. Currently, anti-dumping duty of Rs137/sqm is imposed on ceramics tiles of over 16cm in size and Rs215/sqm on all vitrified tiles imported from China. Anti-dumping duty will be reviewed in December 2014. The threat of cheaper imports may surface in case anti-dumping duty on Chinese tiles is done away with at the December 2014 review. As per industry sources, anti-dumping duty would continue even after December 2014.
Substantial slowdown in real estate/construction sector Following global slowdown, volume growth in the Indian tile sector reduced to 1.5% in CY08 from 13.4% in CY07. However, following strong retail demand the growth bounced back in CY09, posting 22.6%/12.8% growth in CY09/CY10, respectively. If the real estate market continues to remain weak for a longer period, then it may impact the demand for tiles. Even in a challenging scenario, KCL was able to report strong revenue/volume growth of 32.8%/5.4%, respectively, in FY09. Therefore, the company would be least impacted as 70% of its revenue comes from retail sales compared to 50% in the case of rest of the industry.
Company overview
KCL, promoted by Mr. Ashok Kajaria, is the largest manufacturer of ceramic/vitrified tiles and the second-largest in revenue terms in India. The company offers more than 800 options in ceramic wall and floor tiles, glazed and polished vitrified tiles, and designer tiles. These tiles come in a wide range of colours and textures. KCL’s products are marketed across India through an extensive distribution network of dealers (825), sub-dealers, company-owned showrooms and also through the project sales to major real estate developers. KCL derived 70% of its revenue from retail customers, while institutional sales accounted for 30% in FY12. The company remains at the forefront due to its brand, technology, new product innovation, quality, customer services and multi-layer distribution network.
KCL forayed into the high-end sanitaryware business, which positions the company as a complete bathroom solutions provider by way of a tie-up with Vitra (Eczacibasi Group from Turkey) and also established a foothold in wooden flooring solutions through imports from China.
With a strong brand equity and a diversified business model, KCL has a strong presence across various verticals such as ceramic tiles, vitrified tiles, sanitaryware and wooden flooring.
Exhibit 38: Business segments
Source: Company
Institutional Equities
15 Kajaria Ceramics
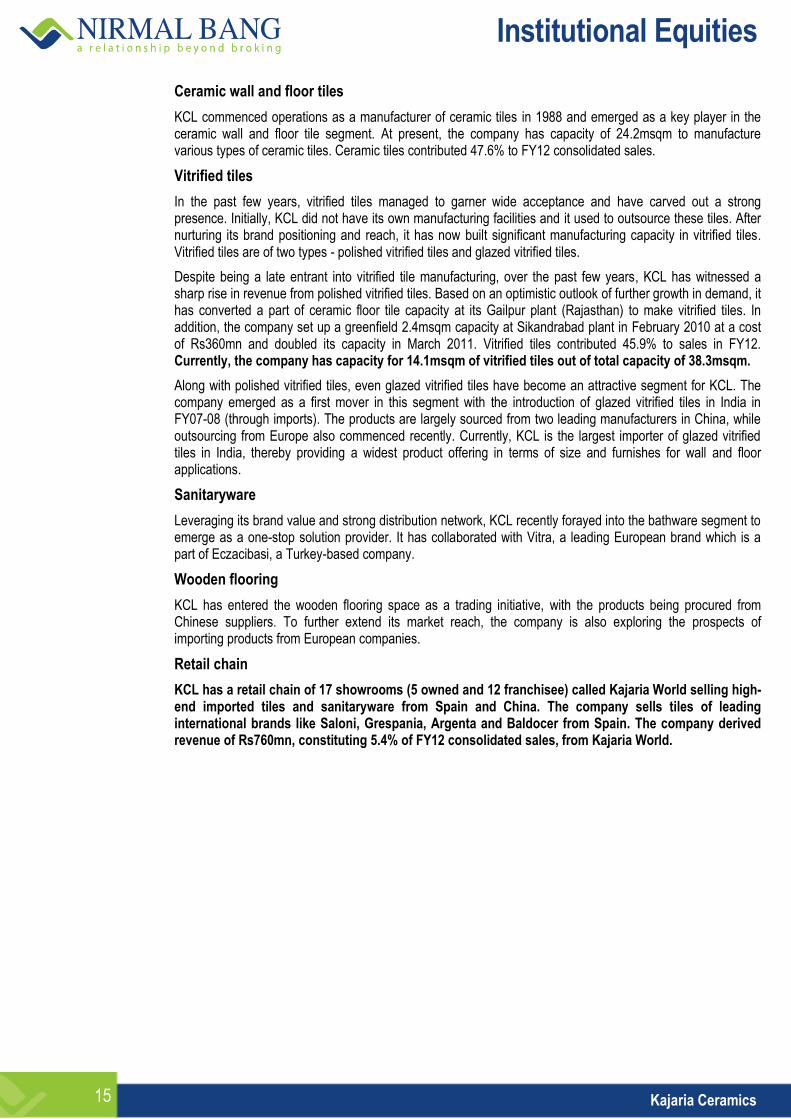
Ceramic wall and floor tiles
KCL commenced operations as a manufacturer of ceramic tiles in 1988 and emerged as a key player in the ceramic wall and floor tile segment. At present, the company has capacity of 24.2msqm to manufacture various types of ceramic tiles. Ceramic tiles contributed 47.6% to FY12 consolidated sales.
Vitrified tiles
In the past few years, vitrified tiles managed to garner wide acceptance and have carved out a strong presence. Initially, KCL did not have its own manufacturing facilities and it used to outsource these tiles. After nurturing its brand positioning and reach, it has now built significant manufacturing capacity in vitrified tiles. Vitrified tiles are of two types - polished vitrified tiles and glazed vitrified tiles.
Despite being a late entrant into vitrified tile manufacturing, over the past few years, KCL has witnessed a sharp rise in revenue from polished vitrified tiles. Based on an optimistic outlook of further growth in demand, it has converted a part of ceramic floor tile capacity at its Gailpur plant (Rajasthan) to make vitrified tiles. In addition, the company set up a greenfield 2.4msqm capacity at Sikandrabad plant in February 2010 at a cost of Rs360mn and doubled its capacity in March 2011. Vitrified tiles contributed 45.9% to sales in FY12. Currently, the company has capacity for 14.1msqm of vitrified tiles out of total capacity of 38.3msqm.
Along with polished vitrified tiles, even glazed vitrified tiles have become an attractive segment for KCL. The company emerged as a first mover in this segment with the introduction of glazed vitrified tiles in India in FY07-08 (through imports). The products are largely sourced from two leading manufacturers in China, while outsourcing from Europe also commenced recently. Currently, KCL is the largest importer of glazed vitrified tiles in India, thereby providing a widest product offering in terms of size and furnishes for wall and floor applications.
Sanitaryware
Leveraging its brand value and strong distribution network, KCL recently forayed into the bathware segment to emerge as a one-stop solution provider. It has collaborated with Vitra, a leading European brand which is a part of Eczacibasi, a Turkey-based company.
Wooden flooring
KCL has entered the wooden flooring space as a trading initiative, with the products being procured from Chinese suppliers. To further extend its market reach, the company is also exploring the prospects of importing products from European companies.
Retail chain
KCL has a retail chain of 17 showrooms (5 owned and 12 franchisee) called Kajaria World selling high-end imported tiles and sanitaryware from Spain and China. The company sells tiles of leading international brands like Saloni, Grespania, Argenta and Baldocer from Spain. The company derived revenue of Rs760mn, constituting 5.4% of FY12 consolidated sales, from Kajaria World.

Institutional Equities
16 Kajaria Ceramics
Global tile Industry overview
The global tile industry has shown a 7.1% CAGR over CY03-10 at 9,350msqm, in volume terms. Following rising manufacturing costs, there has been a shift in manufacturing capacity from developed countries. This is visible from the fact that Spain, the second-largest producer of tiles in CY03, witnessing a 7.4% CAGR decline over CY03-10. Similarly, Italy, the fourth-largest producer of tiles in CY03, witnessed a 6.1% CAGR decline over the same period. At the cost of producers in developed countries, China and India have benefited the most, witnessing 10.4% and 12.6% production CAGR, respectively, over the same period. Currently, China, Brazil and India are top three producers as well as consumers of tiles globally. China accounted for 44%/37.4%, Brazil accounted for 7.9%/7.5% while India accounted for 5.8%/6.0% of the world’s production/consumption of tiles, respectively, in CY10.
Exhibit 39: World tile production (msqm)
Production (msqm) Growth (%)
CY04 CY05 CY06 CY07 CY08 CY09 CY10 CY04 CY05 CY06 CY07 CY08 CY09 CY10
China 2,300 2,500 3,000 3,200 3,400 3,600 4,200 9.5 8.7 20.0 6.7 6.3 5.9 16.7
Brazil 566 568 594 637 713 715 753 6.0 0.4 4.6 7.2 11.9 0.3 5.3
India 270 298 340 385 390 490 550 12.5 10.4 14.1 13.2 1.3 25.6 12.2
Italy 589 570 569 559 513 368 387 (2.3) (3.2) (0.2) (1.8) (8.2) (28.3) 5.2
Iran - - 210 250 320 350 400 - - - 19.0 28.0 9.4 14.3
Spain 640 656 608 585 495 324 366 2.1 2.5 (7.3) (3.8) (15.4) (34.5) 13.0
Vietnam - - 199 254 270 295 375 - - - 27.6 6.3 9.3 27.1
Indonesia 138 176 170 235 275 278 287 3.0 27.5 (3.4) 38.2 17.0 1.1 3.2
Turkey 216 261 265 260 225 205 245 14.3 20.8 1.5 (1.9) (13.5) (8.9) 19.5
Egypt - - 122 140 160 200 220 - - - 14.8 14.3 25.0 10.0
Total 6,580 6,996 7,760 8,252 8,520 8,515 9,515 6.3 6.3 10.9 6.3 3.2 (0.1) 11.7
Source: Company, Industry
Exhibit 40: World tile consumption (msqm)
Consumption (msqm) Growth (%)
CY04 CY05 CY06 CY07 CY08 CY09 CY10 CY04 CY05 CY06 CY07 CY08 CY09 CY10
China 1,850 2,050 2,450 2,700 2,830 3,030 3,500 8.8 10.8 19.5 10.2 4.8 7.1 15.5
Brazil 449 442 484 535 605 645 700 6.7 (1.6) 9.5 10.5 13.1 6.6 8.5
India 270 303 350 397 403 494 557 14.9 12.2 15.5 13.4 1.5 22.6 12.8
Indonesia - - 148 178 262 297 277 - - - 20.3 47.2 13.4 (6.7)
Iran - - 182 236 265 295 335 - - - 29.7 12.3 11.3 13.6
Vietnam - - 145 210 220 240 330 - - - 44.8 4.8 9.1 37.5
Egypt - - 103 105 140 180 200 - - - 1.9 33.3 28.6 11.1
USA 293 305 308 249 197 173 186 11.8 4.1 1.0 (19.2) (20.9) (12.2) 7.5
Spain 361 378 319 314 240 156 - 8.7 4.7 (15.6) (1.6) (23.6) (35.0) -
Italy 192 192 199 199 176 146 - 2.7 - 3.6 - (11.6) (17.0) -
Saudi Arabia - - - 110 136 166 182 8.1 7.8 10.5 8.2 3.6 1.3 10.5
Mexico 151 156 167 173 176 163 168 8.8 10.8 19.5 10.2 4.8 7.1 15.5
Total 6,250 6,740 7,450 8,060 8,350 8,460 9,350 6.7 (1.6) 9.5 10.5 13.1 6.6 8.5
Source: Company, Industry
Indian tile industry
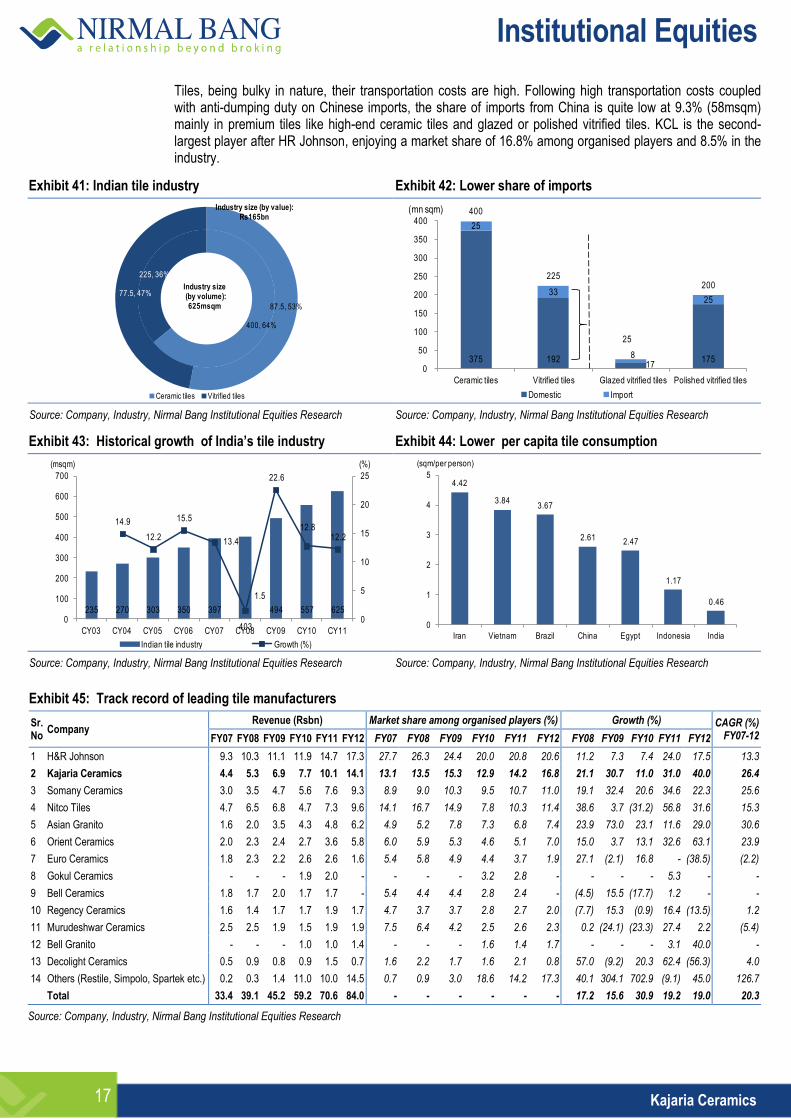
India is one the best performing markets with its consumption growing in double digits since CY03, except in CY08 following global economic meltdown. Tile consumption in India showed a 13.1% CAGR over CY03-10 at 557msqm against global consumption CAGR of 7.1% over the same period, in volume terms. Indian tile industry’s size is around 625msqm valued at ~Rs165bn as of March 2012. Players in the organised segment account for 50% of the industry while the balance 50% is contributed by players in the unorganised segment, mainly located at Morbi, Gujarat.
Ceramic tiles dominate the market with a share of 64%/53% in volume/value terms at 400msqm/Rs87.5bn, respectively. Vitrified tiles account for the balance 36%/47% in volume/value terms at 225msqm/Rs77.5bn, respectively. From the 225msqm vitrified tile segment, polished vitrified tiles account for 200msqm with the balance 25msqm comprising glazed vitrified tiles.
Institutional Equities
17 Kajaria Ceramics
Tiles, being bulky in nature, their transportation costs are high. Following high transportation costs coupled with anti-dumping duty on Chinese imports, the share of imports from China is quite low at 9.3% (58msqm) mainly in premium tiles like high-end ceramic tiles and glazed or polished vitrified tiles. KCL is the second-largest player after HR Johnson, enjoying a market share of 16.8% among organised players and 8.5% in the industry.
Exhibit 41: Indian tile industry Exhibit 42: Lower share of imports
400, 64%
225, 36%
87.5, 53%
77.5, 47%
Ceramic tiles Vitrified tiles
Industry size(by volume): 625msqm
Industry size (by value): Rs165bn
375 19217
175
25
33
8
25
400
225
25
200
0
50
100
150
200
250
300
350
400
Ceramic tiles Vitrified tiles Glazed vitrified tiles Polished vitrified tiles
Domestic Import
(mn sqm)
Source: Company, Industry, Nirmal Bang Institutional Equities Research Source: Company, Industry, Nirmal Bang Institutional Equities Research
Exhibit 43: Historical growth of India’s tile industry Exhibit 44: Lower per capita tile consumption
235 270 303 350 397
403
494 557 625
14.9
12.2
15.5
13.4
1.5
22.6
12.8 12.2
0
5
10
15
20
25
0
100
200
300
400
500
600
700
CY03 CY04 CY05 CY06 CY07 CY08 CY09 CY10 CY11
Indian tile industry Growth (%)
(msqm) (%)
4.42
3.843.67
2.612.47
1.17
0.46
0
1
2
3
4
5
Iran Vietnam Brazil China Egypt Indonesia India
(sqm/per person)
Source: Company, Industry, Nirmal Bang Institutional Equities Research Source: Company, Industry, Nirmal Bang Institutional Equities Research
Exhibit 45: Track record of leading tile manufacturers
Sr. No
Company Revenue (Rsbn) Market share among organised players (%) Growth (%) CAGR (%)
FY07-12 FY07 FY08 FY09 FY10 FY11 FY12 FY07 FY08 FY09 FY10 FY11 FY12 FY08 FY09 FY10 FY11 FY12
1 H&R Johnson 9.3 10.3 11.1 11.9 14.7 17.3 27.7 26.3 24.4 20.0 20.8 20.6 11.2 7.3 7.4 24.0 17.5 13.3
2 Kajaria Ceramics 4.4 5.3 6.9 7.7 10.1 14.1 13.1 13.5 15.3 12.9 14.2 16.8 21.1 30.7 11.0 31.0 40.0 26.4
3 Somany Ceramics 3.0 3.5 4.7 5.6 7.6 9.3 8.9 9.0 10.3 9.5 10.7 11.0 19.1 32.4 20.6 34.6 22.3 25.6
4 Nitco Tiles 4.7 6.5 6.8 4.7 7.3 9.6 14.1 16.7 14.9 7.8 10.3 11.4 38.6 3.7 (31.2) 56.8 31.6 15.3
5 Asian Granito 1.6 2.0 3.5 4.3 4.8 6.2 4.9 5.2 7.8 7.3 6.8 7.4 23.9 73.0 23.1 11.6 29.0 30.6
6 Orient Ceramics 2.0 2.3 2.4 2.7 3.6 5.8 6.0 5.9 5.3 4.6 5.1 7.0 15.0 3.7 13.1 32.6 63.1 23.9
7 Euro Ceramics 1.8 2.3 2.2 2.6 2.6 1.6 5.4 5.8 4.9 4.4 3.7 1.9 27.1 (2.1) 16.8 - (38.5) (2.2)
8 Gokul Ceramics - - - 1.9 2.0 - - - - 3.2 2.8 - - - - 5.3 - -
9 Bell Ceramics 1.8 1.7 2.0 1.7 1.7 - 5.4 4.4 4.4 2.8 2.4 - (4.5) 15.5 (17.7) 1.2 - -
10 Regency Ceramics 1.6 1.4 1.7 1.7 1.9 1.7 4.7 3.7 3.7 2.8 2.7 2.0 (7.7) 15.3 (0.9) 16.4 (13.5) 1.2
11 Murudeshwar Ceramics 2.5 2.5 1.9 1.5 1.9 1.9 7.5 6.4 4.2 2.5 2.6 2.3 0.2 (24.1) (23.3) 27.4 2.2 (5.4)
12 Bell Granito - - - 1.0 1.0 1.4 - - - 1.6 1.4 1.7 - - - 3.1 40.0 -
13 Decolight Ceramics 0.5 0.9 0.8 0.9 1.5 0.7 1.6 2.2 1.7 1.6 2.1 0.8 57.0 (9.2) 20.3 62.4 (56.3) 4.0
14 Others (Restile, Simpolo, Spartek etc.) 0.2 0.3 1.4 11.0 10.0 14.5 0.7 0.9 3.0 18.6 14.2 17.3 40.1 304.1 702.9 (9.1) 45.0 126.7
Total 33.4 39.1 45.2 59.2 70.6 84.0 - - - - - - 17.2 15.6 30.9 19.2 19.0 20.3
Source: Company, Industry, Nirmal Bang Institutional Equities Research
Institutional Equities
18 Kajaria Ceramics
Financials (consolidated)
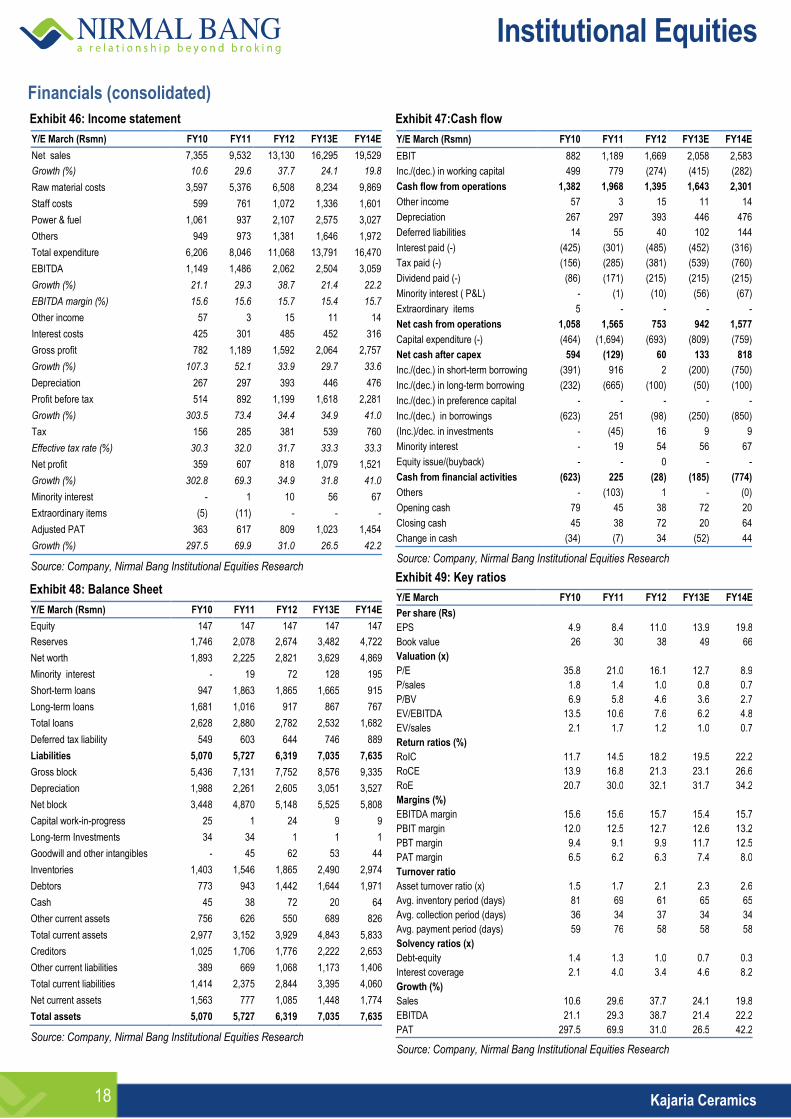
Exhibit 46: Income statement
Y/E March (Rsmn) FY10 FY11 FY12 FY13E FY14E
Net sales 7,355 9,532 13,130 16,295 19,529
Growth (%) 10.6 29.6 37.7 24.1 19.8
Raw material costs 3,597 5,376 6,508 8,234 9,869
Staff costs 599 761 1,072 1,336 1,601
Power & fuel 1,061 937 2,107 2,575 3,027
Others 949 973 1,381 1,646 1,972
Total expenditure 6,206 8,046 11,068 13,791 16,470
EBITDA 1,149 1,486 2,062 2,504 3,059
Growth (%) 21.1 29.3 38.7 21.4 22.2
EBITDA margin (%) 15.6 15.6 15.7 15.4 15.7
Other income 57 3 15 11 14
Interest costs 425 301 485 452 316
Gross profit 782 1,189 1,592 2,064 2,757
Growth (%) 107.3 52.1 33.9 29.7 33.6
Depreciation 267 297 393 446 476
Profit before tax 514 892 1,199 1,618 2,281
Growth (%) 303.5 73.4 34.4 34.9 41.0
Tax 156 285 381 539 760
Effective tax rate (%) 30.3 32.0 31.7 33.3 33.3
Net profit 359 607 818 1,079 1,521
Growth (%) 302.8 69.3 34.9 31.8 41.0
Minority interest - 1 10 56 67
Extraordinary items (5) (11) - - -
Adjusted PAT 363 617 809 1,023 1,454
Growth (%) 297.5 69.9 31.0 26.5 42.2
Source: Company, Nirmal Bang Institutional Equities Research
Exhibit 48: Balance Sheet
Y/E March (Rsmn) FY10 FY11 FY12 FY13E FY14E
Equity 147 147 147 147 147
Reserves 1,746 2,078 2,674 3,482 4,722
Net worth 1,893 2,225 2,821 3,629 4,869
Minority interest - 19 72 128 195
Short-term loans 947 1,863 1,865 1,665 915
Long-term loans 1,681 1,016 917 867 767
Total loans 2,628 2,880 2,782 2,532 1,682
Deferred tax liability 549 603 644 746 889
Liabilities 5,070 5,727 6,319 7,035 7,635
Gross block 5,436 7,131 7,752 8,576 9,335
Depreciation 1,988 2,261 2,605 3,051 3,527
Net block 3,448 4,870 5,148 5,525 5,808
Capital work-in-progress 25 1 24 9 9
Long-term Investments 34 34 1 1 1
Goodwill and other intangibles - 45 62 53 44
Inventories 1,403 1,546 1,865 2,490 2,974
Debtors 773 943 1,442 1,644 1,971
Cash 45 38 72 20 64
Other current assets 756 626 550 689 826
Total current assets 2,977 3,152 3,929 4,843 5,833
Creditors 1,025 1,706 1,776 2,222 2,653
Other current liabilities 389 669 1,068 1,173 1,406
Total current liabilities 1,414 2,375 2,844 3,395 4,060
Net current assets 1,563 777 1,085 1,448 1,774
Total assets 5,070 5,727 6,319 7,035 7,635
Source: Company, Nirmal Bang Institutional Equities Research
Exhibit 47:Cash flow
Y/E March (Rsmn) FY10 FY11 FY12 FY13E FY14E
EBIT 882 1,189 1,669 2,058 2,583
Inc./(dec.) in working capital 499 779 (274) (415) (282)
Cash flow from operations 1,382 1,968 1,395 1,643 2,301
Other income 57 3 15 11 14
Depreciation 267 297 393 446 476
Deferred liabilities 14 55 40 102 144
Interest paid (-) (425) (301) (485) (452) (316)
Tax paid (-) (156) (285) (381) (539) (760)
Dividend paid (-) (86) (171) (215) (215) (215)
Minority interest ( P&L) - (1) (10) (56) (67)
Extraordinary items 5 - - - -
Net cash from operations 1,058 1,565 753 942 1,577
Capital expenditure (-) (464) (1,694) (693) (809) (759)
Net cash after capex 594 (129) 60 133 818
Inc./(dec.) in short-term borrowing (391) 916 2 (200) (750)
Inc./(dec.) in long-term borrowing (232) (665) (100) (50) (100)
Inc./(dec.) in preference capital - - - - -
Inc./(dec.) in borrowings (623) 251 (98) (250) (850)
(Inc.)/dec. in investments - (45) 16 9 9
Minority interest - 19 54 56 67
Equity issue/(buyback) - - 0 - -
Cash from financial activities (623) 225 (28) (185) (774)
Others - (103) 1 - (0)
Opening cash 79 45 38 72 20
Closing cash 45 38 72 20 64
Change in cash (34) (7) 34 (52) 44
Source: Company, Nirmal Bang Institutional Equities Research
Exhibit 49: Key ratios
Y/E March FY10 FY11 FY12 FY13E FY14E
Per share (Rs)
EPS 4.9 8.4 11.0 13.9 19.8
Book value 26 30 38 49 66
Valuation (x)
P/E 35.8 21.0 16.1 12.7 8.9
P/sales 1.8 1.4 1.0 0.8 0.7
P/BV 6.9 5.8 4.6 3.6 2.7
EV/EBITDA 13.5 10.6 7.6 6.2 4.8
EV/sales 2.1 1.7 1.2 1.0 0.7
Return ratios (%)
RoIC 11.7 14.5 18.2 19.5 22.2
RoCE 13.9 16.8 21.3 23.1 26.6
RoE 20.7 30.0 32.1 31.7 34.2
Margins (%)
EBITDA margin 15.6 15.6 15.7 15.4 15.7
PBIT margin 12.0 12.5 12.7 12.6 13.2
PBT margin 9.4 9.1 9.9 11.7 12.5
PAT margin 6.5 6.2 6.3 7.4 8.0
Turnover ratio
Asset turnover ratio (x) 1.5 1.7 2.1 2.3 2.6
Avg. inventory period (days) 81 69 61 65 65
Avg. collection period (days) 36 34 37 34 34
Avg. payment period (days) 59 76 58 58 58
Solvency ratios (x)
Debt-equity 1.4 1.3 1.0 0.7 0.3
Interest coverage 2.1 4.0 3.4 4.6 8.2
Growth (%)
Sales 10.6 29.6 37.7 24.1 19.8
EBITDA 21.1 29.3 38.7 21.4 22.2
PAT 297.5 69.9 31.0 26.5 42.2
Source: Company, Nirmal Bang Institutional Equities Research
Institutional Equities
19 Kajaria Ceramics
Disclaimer
Stock Ratings Absolute Returns
BUY > 15%
HOLD 0-15%
SELL < 0%
This report is published by Nirmal Bang’s Institutional Equities Research desk. Nirmal Bang has other business units with independent research teams separated by Chinese walls, and therefore may, at times, have different or contrary views on stocks and markets. This report is for the personal information of the authorised recipient and is not for public distribution. This should not be reproduced or redistributed to any other person or in any form. This report is for the general information for the clients of Nirmal Bang Equities Pvt. Ltd., a division of Nirmal Bang, and should not be construed as an offer or solicitation of an offer to buy/sell any securities. We have exercised due diligence in checking the correctness and authenticity of the information contained herein, so far as it relates to current and historical information, but do not guarantee its accuracy or completeness. The opinions expressed are our current opinions as of the date appearing in the material and may be subject to change from time to time without notice. Nirmal Bang or any persons connected with it do not accept any liability arising from the use of this document or the information contained therein. The recipients of this material should rely on their own judgment and take their own professional advice before acting on this information. Nirmal Bang or any of its connected persons including its directors or subsidiaries or associates or employees or agents shall not be in any way responsible for any loss or damage that may arise to any person/s from any inadvertent error in the information contained, views and opinions expressed in this publication.
‘Access our reports on Bloomberg Type NBIE <GO>’
Team Details:
Name Email Id Direct Line
Rahul Arora CEO [email protected] +91 22 3926 8098 / 99
Hemindra Hazari Head of Research [email protected] +91 22 3926 8017 / 18
Sales and Dealing:
Neha Grover AVP Sales [email protected] +91 22 3926 8093
Ravi Jagtiani Dealing Desk [email protected] +91 22 3926 8230, +91 22 6636 8833
Sudhindar Rao Dealing Desk [email protected] +91 22 3926 8229, +91 22 6636 8832
Pradeep Kasat Dealing Desk [email protected] +91 22 3926 8100/8101, +91 22 6636 8831
Michael Pillai Dealing Desk [email protected] +91 22 3926 8102/8103, +91 22 6636 8830
Nirmal Bang Equities Pvt. Ltd.
Correspondence Address
B-2, 301/302, Marathon Innova,
Nr. Peninsula Corporate Park
Lower Parel (W), Mumbai-400013.
Board No. : 91 22 3926 8000/1
Fax. : 022 3926 8010


