New Hamburg Flood Mitigation Study Technical Memo No. 1: Flood Damage Estimates Prepared for: Grand River Conservation Authority Prepared by: Matrix Solutions Inc. Version 2.0 March 2020 Guelph, Ontario Unit 7B, 650 Woodlawn Rd. West Guelph, ON, Canada N1K 1B8 T 519.772.3777 F 226.314.1908 www.matrix-solutions.com
Transcript
New Hamburg Flood Mitigation Study Technical Memo No. 1: Flood Damage Estimates
Prepared for: Grand River Conservation Authority
Prepared by: Matrix Solutions Inc.
Version 2.0 March 2020 Guelph, Ontario
Unit 7B, 650 Woodlawn Rd. West Guelph, ON, Canada N1K 1B8 T 519.772.3777 F 226.314.1908 www.matrix-solutions.com
29006-513 New Hamburg TM1 2020-03-30 final V2.0.docx ii Matrix Solutions Inc.
NEW HAMBURG FLOOD MITIGATION STUDY New Hamburg Flood Mitigation Study
Technical Memo No. 1:
Flood Damage Estimates
Prepared for Grand River Conservation Authority, March 2020 reviewed by Peter Bishop, E.I.T. Shaina Blue, P.Eng. Water Resources Engineer in Training Water Resources Engineer
DISCLAIMER
We certify that this report is accurate and complete and accords with the information available during the site investigation. Information obtained during the site investigation or provided by third parties is believed to be accurate but is not guaranteed. We have exercised reasonable skill, care, and diligence in assessing the information obtained during the preparation of this report.
This report was prepared for Grand River Conservation Authority. The report may not be relied upon by any other person or entity without our written consent and that of Grand River Conservation Authority. Any uses of this report by a third party, or any reliance on decisions made based on it, are the responsibility of that party. We are not responsible for damages or injuries incurred by any third party, as a result of decisions made or actions taken based on this report.
29006-513 New Hamburg TM1 2020-03-30 final V2.0.docx iii Matrix Solutions Inc.
Contributors Name Job Title Role
Peter Bishop, E.I.T. Water Resources E.I.T. Matrix Solutions Inc.
Primary author
Shaina Blue, P.Eng. Water Resources Engineer Matrix Solutions Inc.
Technical review
Ziyang Zhang, E.I.T. Water Resources E.I.T. Matrix Solutions Inc.
Hydraulic modelling and flood damage assessment
Karen Hofbauer, M.A.Sc., P.Eng.
Senior Water Resources Engineer Matrix Solutions Inc.
Senior reviewer
Sam Bellamy, P.Eng. Vice President Operations, East Matrix Solutions Inc,
Project advisor
Janet Ivey, B.Sc. (Env), MA Subwatershed Planning Coordinator Grand River Conservation Authority
Project manager
Katelyn Lynch, P.Eng. Water Resources Engineer Grand River Conservation Authority
Hydraulic modelling and technical review
29006-513 New Hamburg TM1 2020-03-30 final V2.0.docx iv Matrix Solutions Inc.
Version Control Version Date Issue Type Filename Description
V0.1 06-Nov-2019 Draft 29006-513 New Hamburg TM1 2019-11-06 draft v0.1.docx
Issued to client for review
V1.0 24-Mar-2020 Final 29006-513 New Hamburg TM1 2020-03-24 final V1.0.docx
Revised based on updated existing conditions model and client comments. Issued to client
V2.0 30-Mar-2020 Final Revised
29006-513 New Hamburg TM1 2020-03-30 final V2.0.docx
Revised to reflect client comments. Issued to client.
29006-513 New Hamburg TM1 2020-03-30 final V2.0.docx v Matrix Solutions Inc.
Table of Contents 1 Introduction .............................................................................................. 1
1.1 Current Project Status ........................................................................................... 1 1.2 Objective ............................................................................................................... 2 1.3 Study Area ............................................................................................................. 2
2 Context for Flood Damage Assessment ..................................................... 3
2.1 Types of Flooding .................................................................................................. 4 2.2 Historical Flooding in New Hamburg ..................................................................... 5
3 Overview of Flood Damage Calculations ................................................... 6
3.1 Alberta Provincial Flood Assessment Study ........................................................... 6 3.2 Tangible Damages ................................................................................................. 7 3.3 Intangible Damages ............................................................................................... 7
List of Graphics Graphic A New Hamburg Floodplain and Flood Warning Zones (graphic provided by Grand River Conservation Authority) ..................................................................................................... 3 Graphic B Maximum Instantaneous Flows Recorded on the Nith River at New Hamburg from 1951 to 2020 (graphic provided by Grand River Conservation Authority) ................ 5 Graphic C Overview of Flood Damage Components (IBI 2015b) ........................................................ 8 Graphic D GRIC (1983) Depth-Damage Curves ................................................................................. 10 Graphic E GRIC (1983) Frequency-Damage Curve ............................................................................ 12 Graphic F GRIC (1983) Flow-Damage Curve ..................................................................................... 12 Graphic G Excerpt from Intact’s Study (Moudrak et al. 2017) with Summary of Flood Damages using Three Estimation Methods for First Pilot Site ............................... 16 Graphic H Excerpt from Intact’s Study (Moudrak et al., 2017) with Summary of Flood Damages using Three Estimation Methods for Second Pilot Site .......................... 16 Graphic I Flood Damage Assessment Process Diagram ................................................................... 17 Graphic J Ground Surface Representation for First-floor Elevation Recorded as MAX (Lot Drops off in Backyard) ............................................................................................... 21 Graphic K Ground Surface Representation for First-floor Elevation Recorded as MIN (Plus Risers) ...................................................................................................................... 22 Graphic L Ground Surface Representation for First-floor Elevation Recorded as MEAN (Plus Risers) ...................................................................................................................... 22 Graphic M Special Case: Set First-floor Elevation as Mean Ground Surface Minus Number of Steps ............................................................................................................... 23 Graphic N Special Case: Set First-floor Elevation as Mean Ground Surface Minus Number of Steps ............................................................................................................... 23
29006-513 New Hamburg TM1 2020-03-30 final V2.0.docx vii Matrix Solutions Inc.
Graphic O Special Case: Set First-floor Elevation as Minimum Ground Surface ............................... 24 Graphic P Picnic Shelters in Fair Grounds ......................................................................................... 27 Graphic Q Box Plot of Indirect Damages as Percentage of Direct Damages Compiled from Background Studies ................................................................................................. 32 Graphic R Schematic of Residential Building with Basement and Flooding Above First Floor ......... 33 Graphic S Schematic of Residential Building with Basement and Flooding Below First Floor ......... 34 Graphic T Schematic of Residential/Industrial, Commercial, or Institutional Building without Basement and Flooding Above First Floor .......................................................... 34 Graphic U Schematic of Residential/Industrial, Commercial, or Institutional Building without Basement and Flooding Below First Floor .......................................................... 35 Graphic V Damages Probability Distributions and Average Annual Damages .................................. 43 Graphic W Total Damages and Average Annual Damages with Climate Change Scenarios .............. 50
List of Tables Table A Nith River at New Hamburg Flood Frequency Analysis (provided by Grand River Conservation Authority) ................................................................................. 6 Table B GRIC (1983) Flood Frequencies used in Flood Damage Assessment ................................. 9 Table C GRIC (1983) Number of Buildings in Floodplain and Indirect Damages ........................... 10 Table D Summary of GRIC (1983) Total Damages for New Hamburg ........................................... 11 Table E Summary of Recent Reported Damages in New Hamburg for 2008 and 2018 Floods ... 14 Table F Residential Structure and Content Class .......................................................................... 25 Table G Industrial, Commercial, or Institutional Content Class .................................................... 26 Table H Industrial, Commercial, or Institutional Structure Class .................................................. 26 Table I Number of Inundated Buildings by Building Type and Storm Event ................................ 29 Table J Indirect Damages as Percentage of Direct Damages by Building Type ............................ 31 Table K Direct Damages Calculation Logic .................................................................................... 36 Table L Flood Flow and Probability ............................................................................................... 37 Table M Flood Damage Estimates Summary Table ........................................................................ 40 Table N Residential Direct Damages Breakdown .......................................................................... 41 Table O ICI Direct Damages Breakdown ........................................................................................ 42 Table P Flood Damage Estimates Comparison of Feb 2018, 25-year, and 50-year Events........... 44 Table Q Comparison between GRIC (1983) and Grand River Conservation Authority/ Matrix Solutions Inc. 2020 Flood Damage Assessments .................................................. 46 Table R Inventory of At-risk Infrastructure ................................................................................... 48 Table S Probability of Occurrence under Climate Change Scenarios ........................................... 49
29006-513 New Hamburg TM1 2020-03-30 final V2.0.docx viii Matrix Solutions Inc.
Figures Figure 1 Study Area Figure 2 Inundated Buildings - 2 Year (179 m3/s) Figure 3 Inundated Buildings - 5 Year (265 m3/s) Figure 4 Inundated Buildings - 10 Year (322 m3/s) Figure 5 Inundated Buildings - 15 Year (350 m3/s) Figure 6 Inundated Buildings - 20 Year (377 m3/s) Figure 7 Inundated Buildings - 25 Year (394 m3/s) Figure 8 Inundated Buildings - 50 Year (447 m3/s) Figure 9 Inundated Buildings - 100 Year (500 m3/s) Figure 10 Inundated Buildings - Regional (1,011 m3/s) Figure 11 Flood Damages - 2 Year (179 m3/s) Figure 12 Flood Damages - 5 Year (265 m3/s) Figure 13 Flood Damages - 10 Year (322 m3/s) Figure 14 Flood Damages - 15 Year (350 m3/s) Figure 15 Flood Damages - 20 Year (377 m3/s) Figure 16 Flood Damages - 25 Year (394 m3/s) Figure 17 Flood Damages - 50 Year (447 m3/s) Figure 18 Flood Damages - 100 Year (500 m3/s) Figure 19 Flood Damages - Regional (1,011 m3/s)
Appendices Appendix A Table Schema Appendix B Field Work Verification Appendix C Depth-Damage Curves Appendix D Grand River Conservation Authority Technical Memorandum on New Hamburg
Residents Survey Appendix E Digital Files
29006-513 New Hamburg TM1 2020-03-30 final V2.0.docx 1 Matrix Solutions Inc.
1 Introduction The Town of New Hamburg, population of 14,000, in the Township of Wilmot, Ontario, is located along the Nith River and is one of 27 municipal Flood Damage Centres in the Grand River watershed. The Town developed historically within the Nith River floodplain and is subject to regular routine nuisance flooding, in addition to significant flooding events in 1975, 2008, and most recently in February 2018 and January 2020. Existing water infrastructure consists of a run-of-the-river dam acquired by Grand River Conservation Authority (GRCA) in 1966 and rebuilt in 1989, a low dike system and river channelization efforts completed in the 1970s providing protection to a level less than the 5-year return event (265 m3/s), and erosion protection works built in the late 1970s and early 1980s (Figure 1).
To investigate potential mitigation strategies, the GRCA retained Matrix Solutions Inc. (Matrix) to support the New Hamburg Flood Mitigation (NHFM) study. The study was initiated in the spring of 2019 and, as it is funded in part through Intake 5 of the federal National Disaster Mitigation Program, must be completed by March 31, 2020. This study includes: an assessment of the average annual damages associated with flooding in the Town of New Hamburg; the development and evaluation of potential mitigation strategies; and support for Public Information Centres (PIC).
1.1 Current Project Status Matrix’s scope for this study includes a background review (Task 1), an assessment of the average annual damages due to flooding in the Town of New Hamburg (Task 2), the development and evaluation of potential mitigation strategies (Task 3), and support for PICs (Task 4).
Matrix has completed the background review (Task 1). This review was presented at a project team meeting and key elements are documented in this technical memorandum and in Technical Memorandum #2 (Matrix 2020). The purpose of this Technical Memo #1 is to document the context, methods, and results of the flood damage estimates (Task 2). Technical Memorandum #2 outlines the development and evaluation of potential mitigation strategies (Matrix 2020).
GRCA held three Public Information Centres (PICs) for the New Hamburg Flood Mitigation Study. GRCA held a first PIC on June 26, 2019 to introduce the study to the New Hamburg community. A second PIC was held on November 25, 2019 to present the draft findings of the existing conditions flood damage estimates, and to seek input on the evaluation criteria as well
29006-513 New Hamburg TM1 2020-03-30 final V2.0.docx 2 Matrix Solutions Inc.
as the long list of mitigation options. To obtain additional insight into the flood conditions/damages specifically experienced by New Hamburg landowners, GRCA undertook a survey in November-December 2019 (GRCA 2020). The results of the PIC and survey provided valuable input for refining preliminary flood damage estimates. A third PIC was held March 11, 2020 to present the results of the evaluation of mitigation options.
1.2 Objective The objective of the flood damages estimates for the NHFM study is to provide a basis for comparing the return-on-investment for potential flood mitigation options. While efforts were made to estimate flood damages as accurately as possible, there are limitations due to the scale, scope, and timeline of the project. In consultation with the GRCA and Township of Wilmot the approach to developing updated flood damage estimates was tailored to this objective.
1.3 Study Area The study area for the flood damages assessment and flood mitigation options is shown on Figure 1. The GRCA is concurrently updating the HEC-RAS 1-D hydraulic modelling and associated Regulatory floodplain mapping for this reach of the Nith River. GRCA has provided draft inundation mapping for use in this study. It is understood that peer review and public consultation of these products is ongoing.
The study area for the flood damage estimates includes structures within the updated (draft) Regional inundation boundary, south of the railway crossing extending to Holland Mills Road. The area north of the railroad was not included in the study area, as structures have been built outside of the Regulatory floodplain. A total of 215 buildings were assessed for flooding within the study area including residential (73%), industrial (7%), commercial (17%), and institutional (3%) buildings.
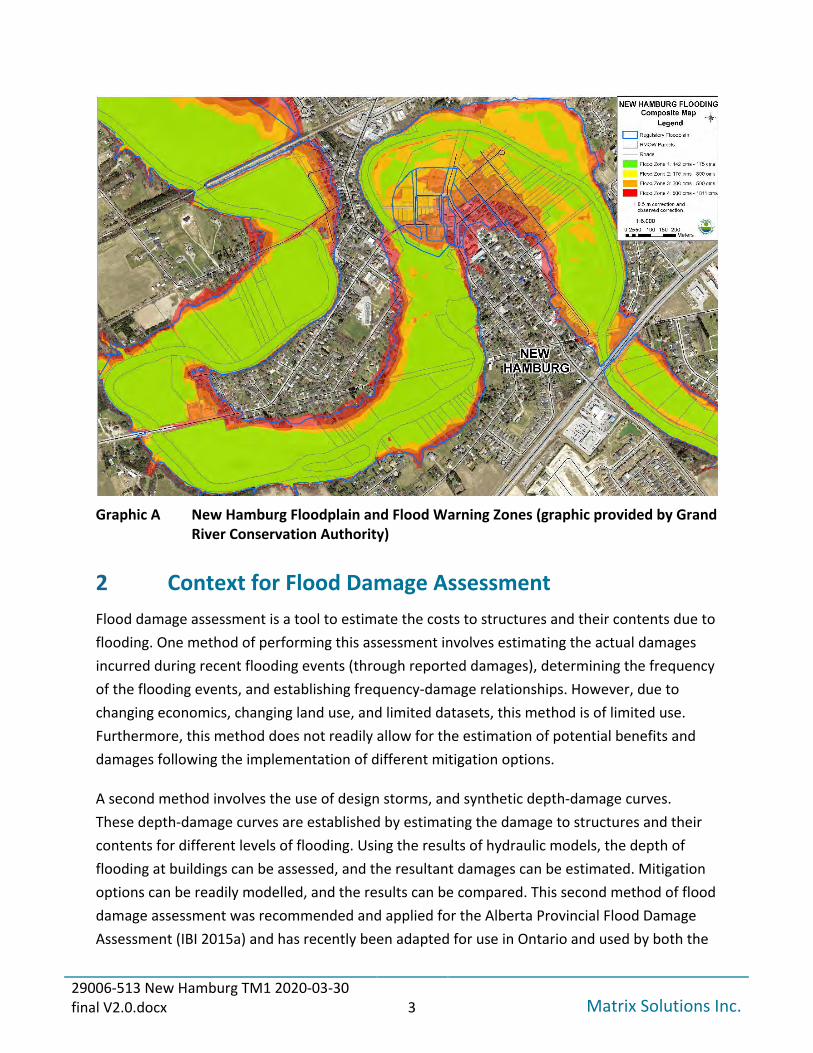
The study area is illustrated with the breakdown of the Town’s flood warning zones 1 to 4 (Graphic A). Level 1 reflects routine nuisance flooding under flows up to near the 2-year return frequency (179 m3/s), Level 2 up to near the 10-year return frequency (322 m3/s), Level 3 up to a 100-year frequency (500 m3/s), and Level 4 up the Regional Flood that is derived from Hurricane Hazel (1954; 1,011 m3/s). The recent flooding in February 2018 and January 2020 were categorized as Level 3 floods with flows approaching a 50-year and 25-year return period, respectively. Flooding affects residential, commercial, and municipal properties.
29006-513 New Hamburg TM1 2020-03-30 final V2.0.docx 3 Matrix Solutions Inc.
Graphic A New Hamburg Floodplain and Flood Warning Zones (graphic provided by Grand River Conservation Authority)
2 Context for Flood Damage Assessment Flood damage assessment is a tool to estimate the costs to structures and their contents due to flooding. One method of performing this assessment involves estimating the actual damages incurred during recent flooding events (through reported damages), determining the frequency of the flooding events, and establishing frequency-damage relationships. However, due to changing economics, changing land use, and limited datasets, this method is of limited use. Furthermore, this method does not readily allow for the estimation of potential benefits and damages following the implementation of different mitigation options.
A second method involves the use of design storms, and synthetic depth-damage curves. These depth-damage curves are established by estimating the damage to structures and their contents for different levels of flooding. Using the results of hydraulic models, the depth of flooding at buildings can be assessed, and the resultant damages can be estimated. Mitigation options can be readily modelled, and the results can be compared. This second method of flood damage assessment was recommended and applied for the Alberta Provincial Flood Damage Assessment (IBI 2015a) and has recently been adapted for use in Ontario and used by both the
29006-513 New Hamburg TM1 2020-03-30 final V2.0.docx 4 Matrix Solutions Inc.
Credit Valley Conservation Authority (CVC) and the Toronto Region Conservation Authority (TRCA; IBI 2019).
2.1 Types of Flooding The focus of this study is riverine flooding and the associated risks. The difference between urban (also called pluvial) and riverine flooding can be subtle, especially for local landowners, but the contrast is important for appreciating the scope of this study, agency responsibility, and the impacts to regulated flood hazard limits. The following sections describe the differences between and mechanism of flooding of urban and riverine flooding, as well as the mechanisms of flooding in New Hamburg.
Urban Flooding Urban flooding includes “street flooding and basement flooding [which] occurs when there is more water than the local drainage system (sewers and streets) can handle, or when there is a lack of a major overland flow route from a low-lying area. Urban storm infrastructure is the responsibility of municipalities” (TRCA 2019) and is not considered in regulated riverine flood hazard areas. Flood mechanisms causing urban flooding include undersized inlets (i.e., catchbasins, ditch inlets, etc.), undersized sewers, ill-defined overland flow paths, low-lying areas with no outlet, and combinations thereof.
Riverine Flooding Riverine flooding occurs when water levels of rivers, streams, and creeks rise and overflow their banks, spilling onto adjacent areas. “Conservation Authorities are responsible for determining the hazard from riverine flooding” (TRCA 2019). Riverine flooding naturally occurs, but impacts can be made more severe by human influences such as urbanization, structures (i.e., bridges and culverts) built with insufficient hydraulic capacity, and development within floodplains reducing the conveyance capacity of channel systems. Riverine flooding is the basis for Conservation Authority flood hazard regulations.
Mechanisms of Flooding in New Hamburg There are two distinct floodplain areas in New Hamburg, namely upstream and downstream of the New Hamburg dam. In addition to the dam, there are five existing bridges crossing the Nith River through New Hamburg (Figure 1). Structures along rivers can impede ice flow during the winter and cause debris or ice jams. Ice jam flooding is less predictable than open-water flooding. These blockages can cause backwater flooding at flow rates well below what would be encountered in open water conditions. The release of a jam can also cause a sudden surge in flow downstream. Ice jams were a contributing factor to the February 2018 floods in New
29006-513 New Hamburg TM1 2020-03-30 final V2.0.docx 5 Matrix Solutions Inc.
Hamburg, which had the third-highest flows since 1951. Ice jams have been observed behind the dam and around the Pedestrian and Highway 7/8 bridges.
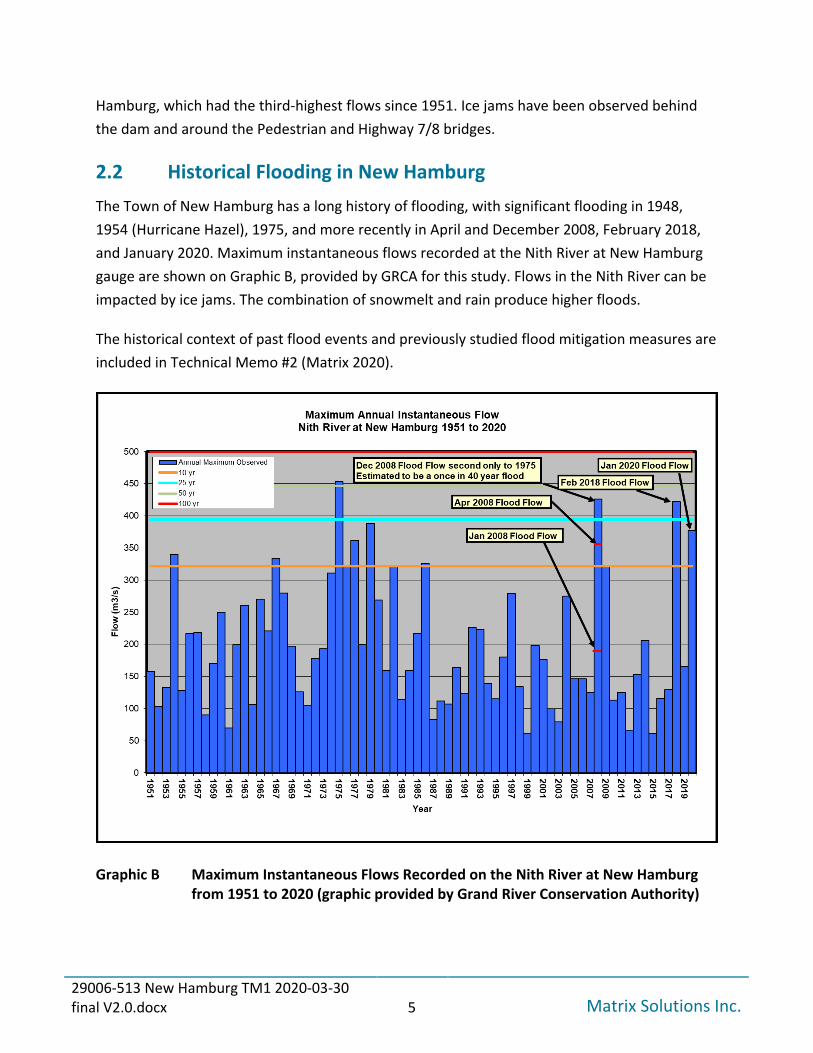
2.2 Historical Flooding in New Hamburg The Town of New Hamburg has a long history of flooding, with significant flooding in 1948, 1954 (Hurricane Hazel), 1975, and more recently in April and December 2008, February 2018, and January 2020. Maximum instantaneous flows recorded at the Nith River at New Hamburg gauge are shown on Graphic B, provided by GRCA for this study. Flows in the Nith River can be impacted by ice jams. The combination of snowmelt and rain produce higher floods.
The historical context of past flood events and previously studied flood mitigation measures are included in Technical Memo #2 (Matrix 2020).
Graphic B Maximum Instantaneous Flows Recorded on the Nith River at New Hamburg from 1951 to 2020 (graphic provided by Grand River Conservation Authority)
29006-513 New Hamburg TM1 2020-03-30 final V2.0.docx 6 Matrix Solutions Inc.
The frequency analysis and flood flows for this study (Table A) were provided by GRCA and are discussed further in Section 5.6.4.
Table A Nith River at New Hamburg Flood Frequency Analysis (provided by Grand River Conservation Authority)
3 Overview of Flood Damage Calculations This section provides an overview of the components of flood damage estimates, largely based on the Alberta Provincial Flood Assessment Study (IBI 2015a). Graphic C (IBI 2015a) shows the breakdown of flood damage estimates into tangible and intangible damages. Tangible damages are those that have a dollar value, or financial impact, whereas intangible damages refer to social impacts, as discussed further in the subsequent sections.
3.1 Alberta Provincial Flood Assessment Study After the devastating flooding in 2013, the Government of Alberta Environment and Sustainable Resource Development, retained IBI Group and Golder Associates to undertake the Provincial Flood Damage Assessment Study in 2014-2015. This study (IBI 2015a) included updating/developing flood damage curves to 2014 values and estimating flood damages for select communities in Alberta. The City of Calgary was used as a pilot study (IBI 2015b). This was the first detailed and comprehensive update of flood damage curves in the province since the 1980s. In developing the flood damage curves, the study included:
• Content inventories • Field inspections of typical buildings • Estimations of cleaning/replacing/repairing from suppliers/contractors • Damage to external and attached buildings (i.e., garages)
29006-513 New Hamburg TM1 2020-03-30 final V2.0.docx 7 Matrix Solutions Inc.
The adaptation of the Alberta depth-damage curves for use in Ontario is described in Section 5.3.
3.2 Tangible Damages The tangible, or financial, damages include direct and indirect costs. Direct costs include the internal, external, and structural components of flooded buildings. The internal component includes the building contents; the external component includes garages, sheds, etc. and the structural component includes repairs to the structure of buildings. These direct costs are accounted for in depth-damage curves.
Indirect costs include costs incurred due to:
• loss of sales/production/revenue and extra expenditure (“financial” in Graphic C) • loss of transportation/communication facilities/public services (“opportunity” in Graphic C),
and • flood fighting, removal of flood debris and discarded items (“clean up” in Graphic C)
Indirect damages are typically estimated as a percentage of direct costs. Detailed methods for calculation of tangible damages are presented in Section 5.
3.3 Intangible Damages Living in a floodplain and experiencing a flood can cause serious social impacts and can have long-lasting traumatic effects for residents, workers, volunteers, and people involved in flood fighting. We consider these related impacts as intangible damages and may include loss of life, illness, stress, depression, insecurity, inconvenience, physical risk, community relations, loss of environmental/historical assets. These intangible damages are very difficult to quantify. For this assessment, a dollar value is not included for these intangible damages; however, they will be considered within the framework of the project, particularly when developing and evaluating potential flood mitigation measures.
29006-513 New Hamburg TM1 2020-03-30 final V2.0.docx 8 Matrix Solutions Inc.
Graphic C Overview of Flood Damage Components (IBI 2015b)
29006-513 New Hamburg TM1 2020-03-30 final V2.0.docx 9 Matrix Solutions Inc.
4 Previous Flood Damage Estimates
4.1 1983 Flood Damage Estimate In 1983, the Grand River Implementation Committee (GRIC) completed flood damages in the Grand River Basin (GRIC 1983). This study assessed flood damages in six communities in the Grand River Basin that had a history of significant flooding, including New Hamburg. The study was based on the Regulatory floodplain at the time, with a flowrate of 27,000 cfs, or 765 m3/s for the Regional (Hurricane Hazel) flood event in New Hamburg. A HEC2 model was used to compute the depths along the Nith River for a series of flood frequencies (Table B). Based on the 765 m3/s flow rate, the study included 122 buildings in the floodplain (Table C).
Flood depths at buildings were derived and direct damages were computed. Depth-damage curves were used to relate flood depth at buildings to damages (Graphic D). Residential buildings were classified as frame or brick, using two depth-damage curves which had been previously developed (Acres 1968). The study assumed residences have basements but does not specify if they are finished or unfinished. These depth-damage curves combined both structure and contents. Industrial, commercial and institutional direct damages were computed using four curves (Graphic D) from Phillips (1976).
Indirect damages were computed as a ratio of the direct damages, for each of the damage classifications (Table C). Public damages were calculated as 4% of the direct plus indirect damages to all structures.
Table B GRIC (1983) Flood Frequencies used in Flood Damage Assessment
29006-513 New Hamburg TM1 2020-03-30 final V2.0.docx 11 Matrix Solutions Inc.
From these results, the total damages were calculated, as summarized in Table D, and relationships of damages vs. probability of exceedance (Graphic E) and flow vs. damages (Graphic F) and were derived. The average annual damages (AAD) was computed as the area under the frequency-damage curve at $25,000 ($1979), which is roughly equivalent to $77,500 ($2016).
All buildings were found to be protected to the ~3-year flow (227 m3/s) by the existing dike. Frequent flooding of the residential area was noted, as well as the potential for large commercial damage for higher return period storms (lower frequency). A recommendation was made to construct more detailed depth-damage curves for assessing industrial buildings.
Table D Summary of GRIC (1983) Total Damages for New Hamburg
29006-513 New Hamburg TM1 2020-03-30 final V2.0.docx 12 Matrix Solutions Inc.
Graphic E GRIC (1983) Frequency-Damage Curve
Graphic F GRIC (1983) Flow-Damage Curve
29006-513 New Hamburg TM1 2020-03-30 final V2.0.docx 13 Matrix Solutions Inc.
4.2 Residents Reported Flood Damages Information on actual damages from flood events was collected from a few sources, including:
• Documentation provided by the Township of Wilmot regarding damages incurred by the municipality resulting from the 2008 and February 2018 flood events.
• Flood damages reported by individual residents for the 2008 and February 2018 events, as collected and summarized by residents and the Nith Flooding Action Committee.
• A summary of residents’ submissions to the Province of Ontario’s Disaster Recovery Assistance for Ontarians (DRAO) program documenting losses associated with the February 2018 flood.
• GRCA’s 2019 survey of New Hamburg landowners in the Regional floodplain (see Section 5.7 and Appendix D).
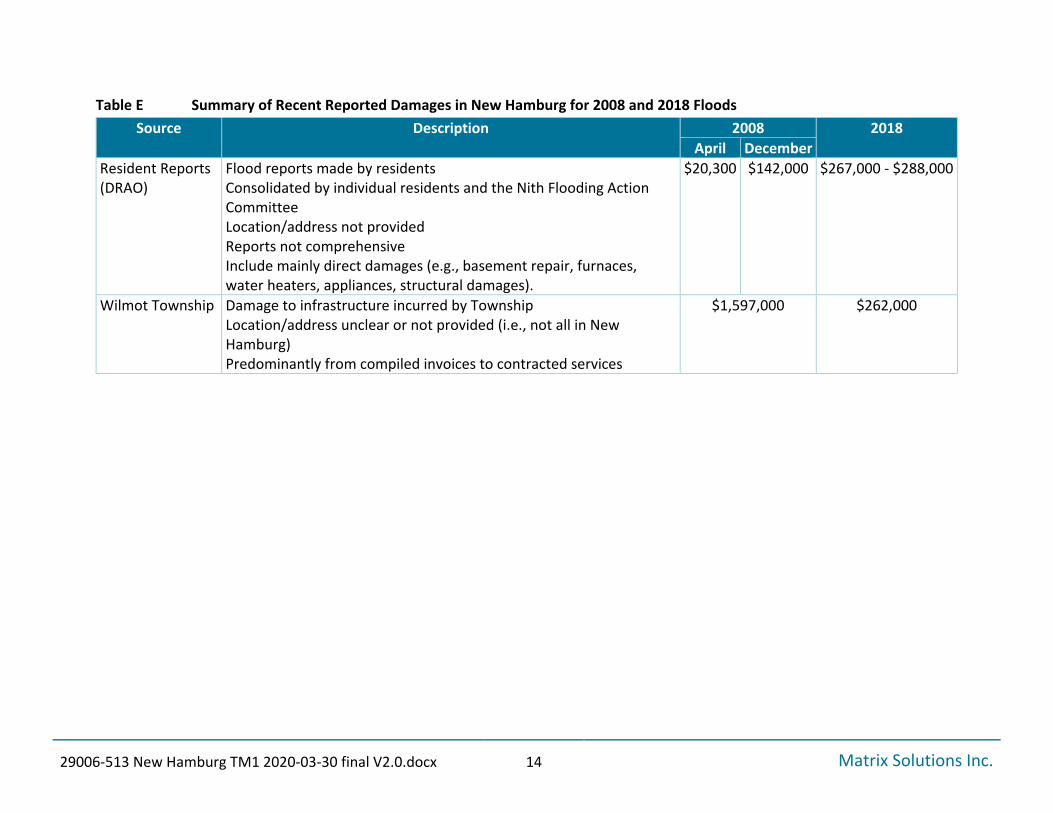
The reporting was voluntary and not comprehensive, with losses anecdotally reported by residents, for items such as furnaces, appliances, and basement repairs. Some residents had flood insurance, others not. The collected data is summarized in Table E.
29006-513 New Hamburg TM1 2020-03-30 final V2.0.docx 14 Matrix Solutions Inc.
Table E Summary of Recent Reported Damages in New Hamburg for 2008 and 2018 Floods Source Description 2008 2018
April December Resident Reports (DRAO)
Flood reports made by residents Consolidated by individual residents and the Nith Flooding Action Committee Location/address not provided Reports not comprehensive Include mainly direct damages (e.g., basement repair, furnaces, water heaters, appliances, structural damages).
$20,300 $142,000 $267,000 - $288,000
Wilmot Township Damage to infrastructure incurred by Township Location/address unclear or not provided (i.e., not all in New Hamburg) Predominantly from compiled invoices to contracted services
$1,597,000 $262,000
29006-513 New Hamburg TM1 2020-03-30 final V2.0.docx 15 Matrix Solutions Inc.
4.3 Intact Centre on Climate Adaptation 2017 Study The Intact Centre on Climate Adaptation and University of Waterloo completed a study called “When the Big Storms Hit, the Role of Wetlands to Limit Urban and Rural Flood Damage” (Moudrak et al., 2017). The study assessed the financial value of wetlands using flood damage evaluation. The study compared flood damages for Uptown Waterloo and communities in the Credit River watershed, calculated using three methods: (1) insurance claims, (2) per Ontario’s 2007 Flood Damage Estimation Guide (Water’s Edge et al., 2007) and (3) per Alberta Provincial Flood Assessment Study (IBI 2015a). For the method that follows the Alberta Provincial Flood Assessment Study (IBI 2015a), the study used the same depth-damage curves we have applied for this study, assumed fully finished basements, and reduced the building footprint area to account for roof overhang. The Alberta Provincial Flood Assessment method estimated the highest damages, but the study deemed this method as the most applicable dataset and recommended method for flood damage estimations going forward. It was used to provide a basis for comparing the mitigating effects of wetlands. Comparisons of the three methods for the two pilot study areas are included as excerpts from Moudrak et al., 2017 in Graphics G and H below.
29006-513 New Hamburg TM1 2020-03-30 final V2.0.docx 16 Matrix Solutions Inc.
Graphic G Excerpt from Intact’s Study (Moudrak et al. 2017) with Summary of Flood Damages using Three Estimation Methods for First Pilot Site
Graphic H Excerpt from Intact’s Study (Moudrak et al., 2017) with Summary of Flood Damages using Three Estimation Methods for Second Pilot Site
5 Method The methodology for computing updated flood damage estimates for the NHFM study follows the industry standard, based on the Alberta Provincial Flood Damage Assessment Study (IBI 2015a), and adapted for use in Ontario (Moudrak et al. 2017, IBI 2019).
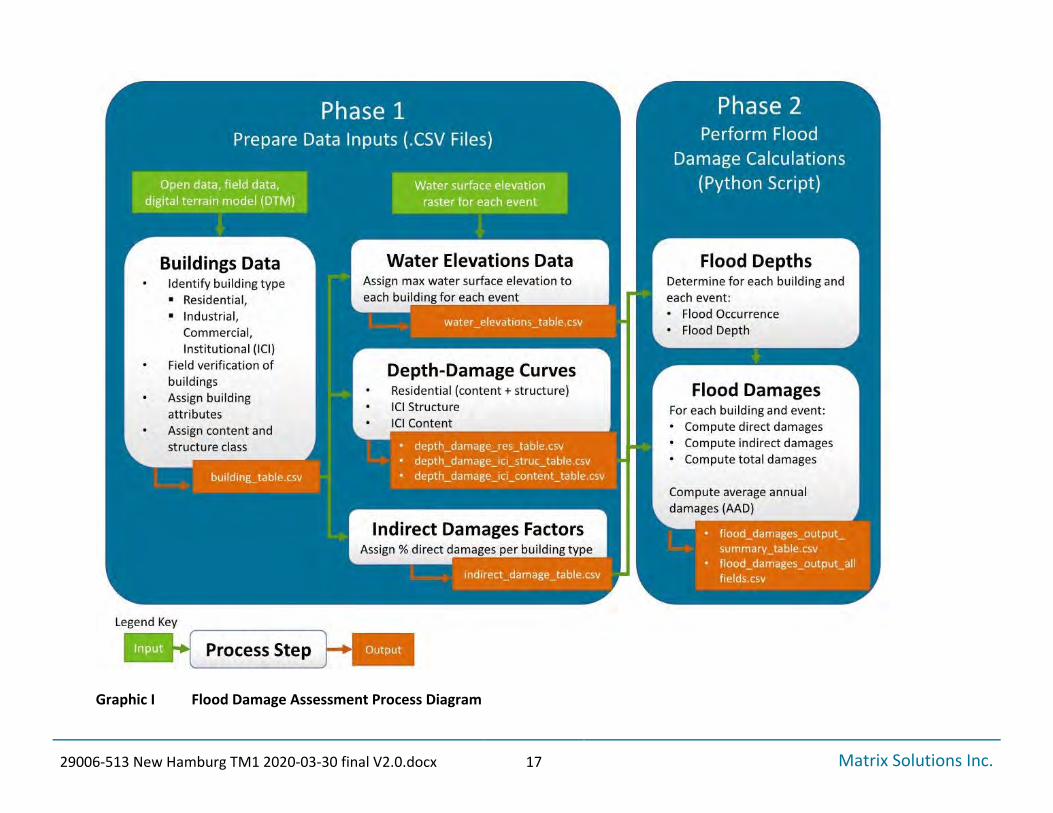
An overview of the methodology for NHFM study flood damage estimates is illustrated in the process diagram in Graphic I. It is divided into Phase 1 for the preparation of data inputs and Phase 2 for the flood damage calculations. The green boxes are external inputs, the white are processes and the orange are output tables. Tables are in comma separated values (.csv) format which are independent of software. For example, Excel or scripts such as R or Python, could be used to generate input tables. This allows for easy updates in the future and easy integration with GIS platforms.
The method for each phase is further described in the following sections.
29006-513 New Hamburg TM1 2020-03-30 final V2.0.docx 17 Matrix Solutions Inc.
Graphic I Flood Damage Assessment Process Diagram
29006-513 New Hamburg TM1 2020-03-30 final V2.0.docx 18 Matrix Solutions Inc.
PHASE 1 - PREPARE DATA INPUTS Phase 1 includes preparing the:
• Buildings data, • Water elevations data, • Depth-damage curves, and • Indirect damages factors.
5.1 Buildings Data A database was created for all primary structures (i.e., buildings) within the study area (Figure 1). Secondary structures, such as external sheds and detached garages, are not included, as these damages are already accounted for in the depth-damage curves for primary structures.
At the time of initial data preparation, Matrix did not have the updated Draft Regional inundation boundary from GRCA. In consultation with GRCA, a vertical 0.5 m buffer was applied to the 2006 Regulatory floodplain boundary (based on Regional Municipality of Waterloo 1 m contours) to serve as an initial estimate of which buildings to include in the database, and for field-verification. This was updated when a first (preliminary) draft of the Regional inundation boundary was available (in November 2019), and two additional buildings were added and verified using Google Street View.
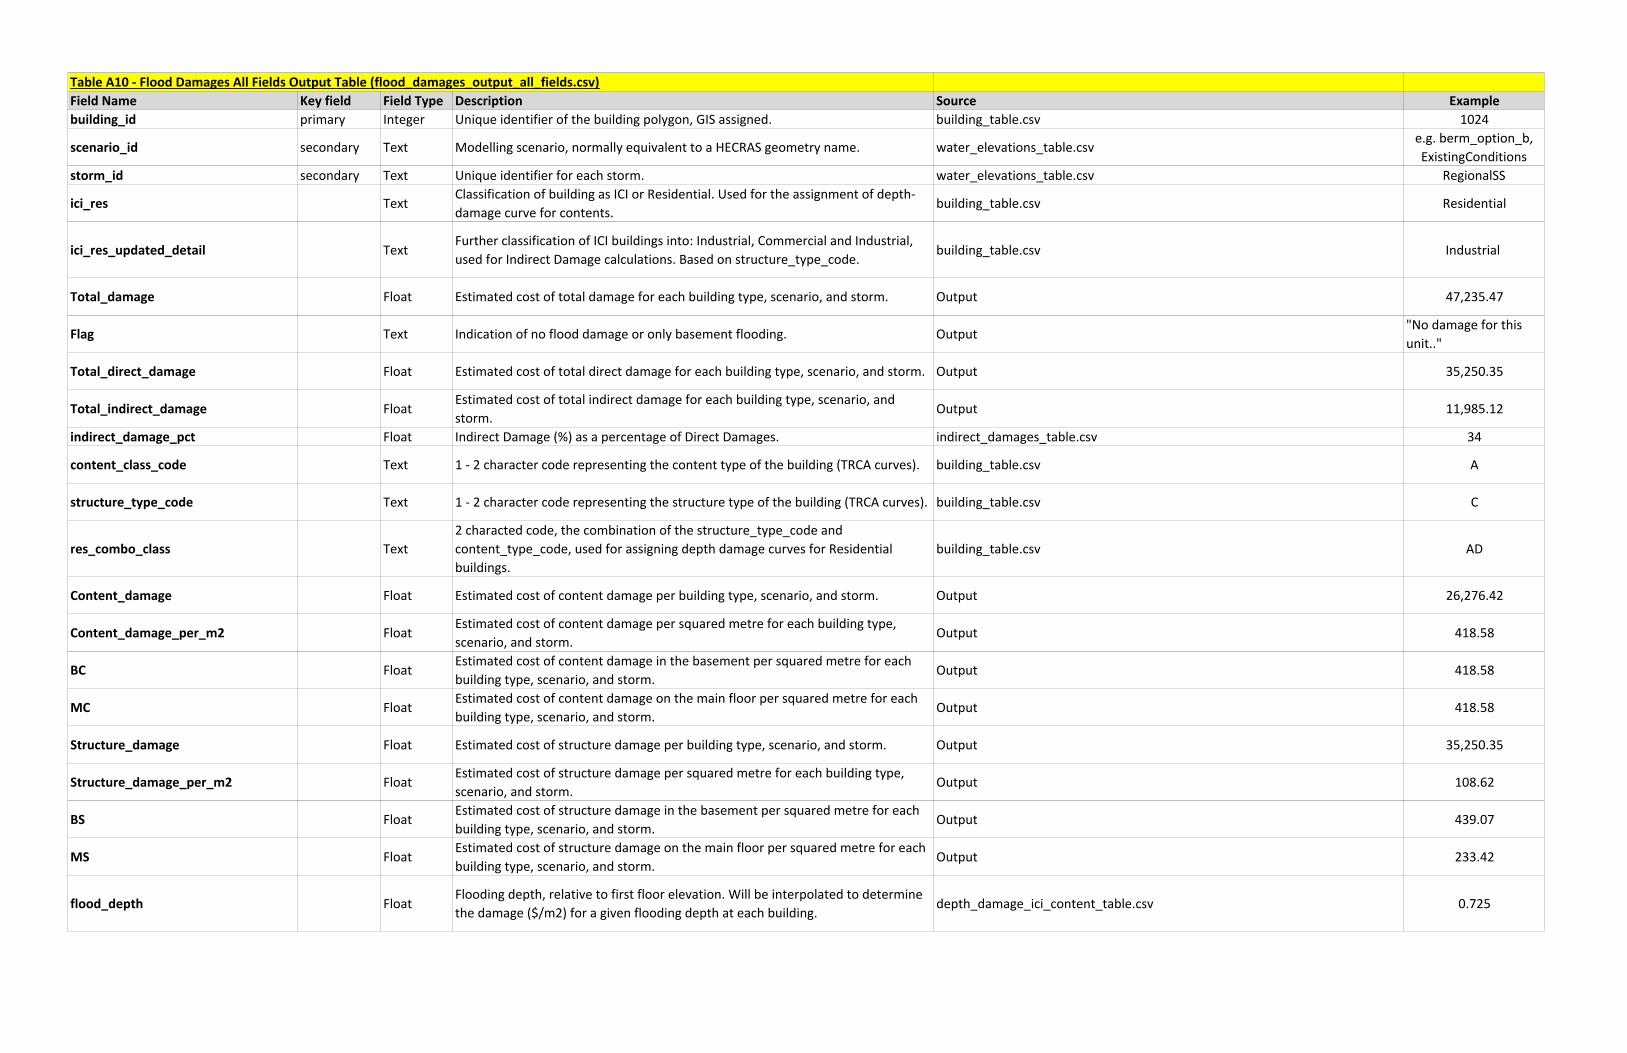
The following steps were completed to develop the structures database. The data table schema and fields are included in Appendix A.
1. Review GRCA buildings data.
a. Buildings layer metadata: GRCA reviewed the buildings footprint layer from the Regional Municipality of Waterloo open data and added additional buildings that were not included in the layer (including detached full sized garages, but not sheds), using Regional Municipality of Waterloo 2018 Orthoimagery. GRCA also transformed the coordinate system of the layer to NAD83 CSRSv6 zone 17 and added default 2m building height for inclusion in raster surface.
b. Identify usable data (subject to field-verification): building type, number of storeys.
29006-513 New Hamburg TM1 2020-03-30 final V2.0.docx 19 Matrix Solutions Inc.
c. Identify data gaps: industrial, commercial, or institutional (ICI) content type, first-floor elevation, basement presence, living area (attached garages), presence of split levels and apartment buildings.
2. Perform field verification, as described in Section 5.1.1, to improve data quality, fill data gaps, and compute more representative flood thresholds.
3. Update building attributes using data collected in the field.
a. Update open data attributes: number of storeys, building type
b. Add new fields: basement presence, number of risers (steps) to first floor, ground surface elevation best representation (min/mean /max), presence and size (number of cars) of attached garage, presence of split levels.
4. Refine building footprint areas (living space area and single floor area):
a. Living space area: Used for classifying residential building structure and content types. Does not include basement area. Used the GIS footprint area, which represents roof line, and reduced by 0.45 m (18 inch) on all sides to account for roof overhang. Further reduced by field-verified garage size (number of cars) and an assumed size for a single car garage (12 ft x 24 ft = 288 ft2) (Danley’s 2019).
b. Single floor area: Used for calculating damages from depth-damage curves. Basement area is assumed equal to main floor.
5. Classify buildings based on updated building attributes, as described in Section 5.1.2.
6. Calculate min/mean/max building elevation from digital terrain model (DTM).
a. To account for the grid cell size of 0.5 m, a buffer area of 0.5 m around each building was used to determine the minimum, mean, and maximum ground elevations at each building.
7. Calculate First-floor Elevation
a. First-floor elevation = min/mean/max ground elevation (based on best representation as identified in the field - see Section 5.1.1) plus an offset based on the number of risers, assuming a 7” riser height (0.18 m).
29006-513 New Hamburg TM1 2020-03-30 final V2.0.docx 20 Matrix Solutions Inc.
b. Special cases were identified and calculated for buildings with lower first-floor elevations (see Section 5.1.1).
8. Output building database (building_table.csv), in accordance with schema listed in Table A1 in Appendix A.
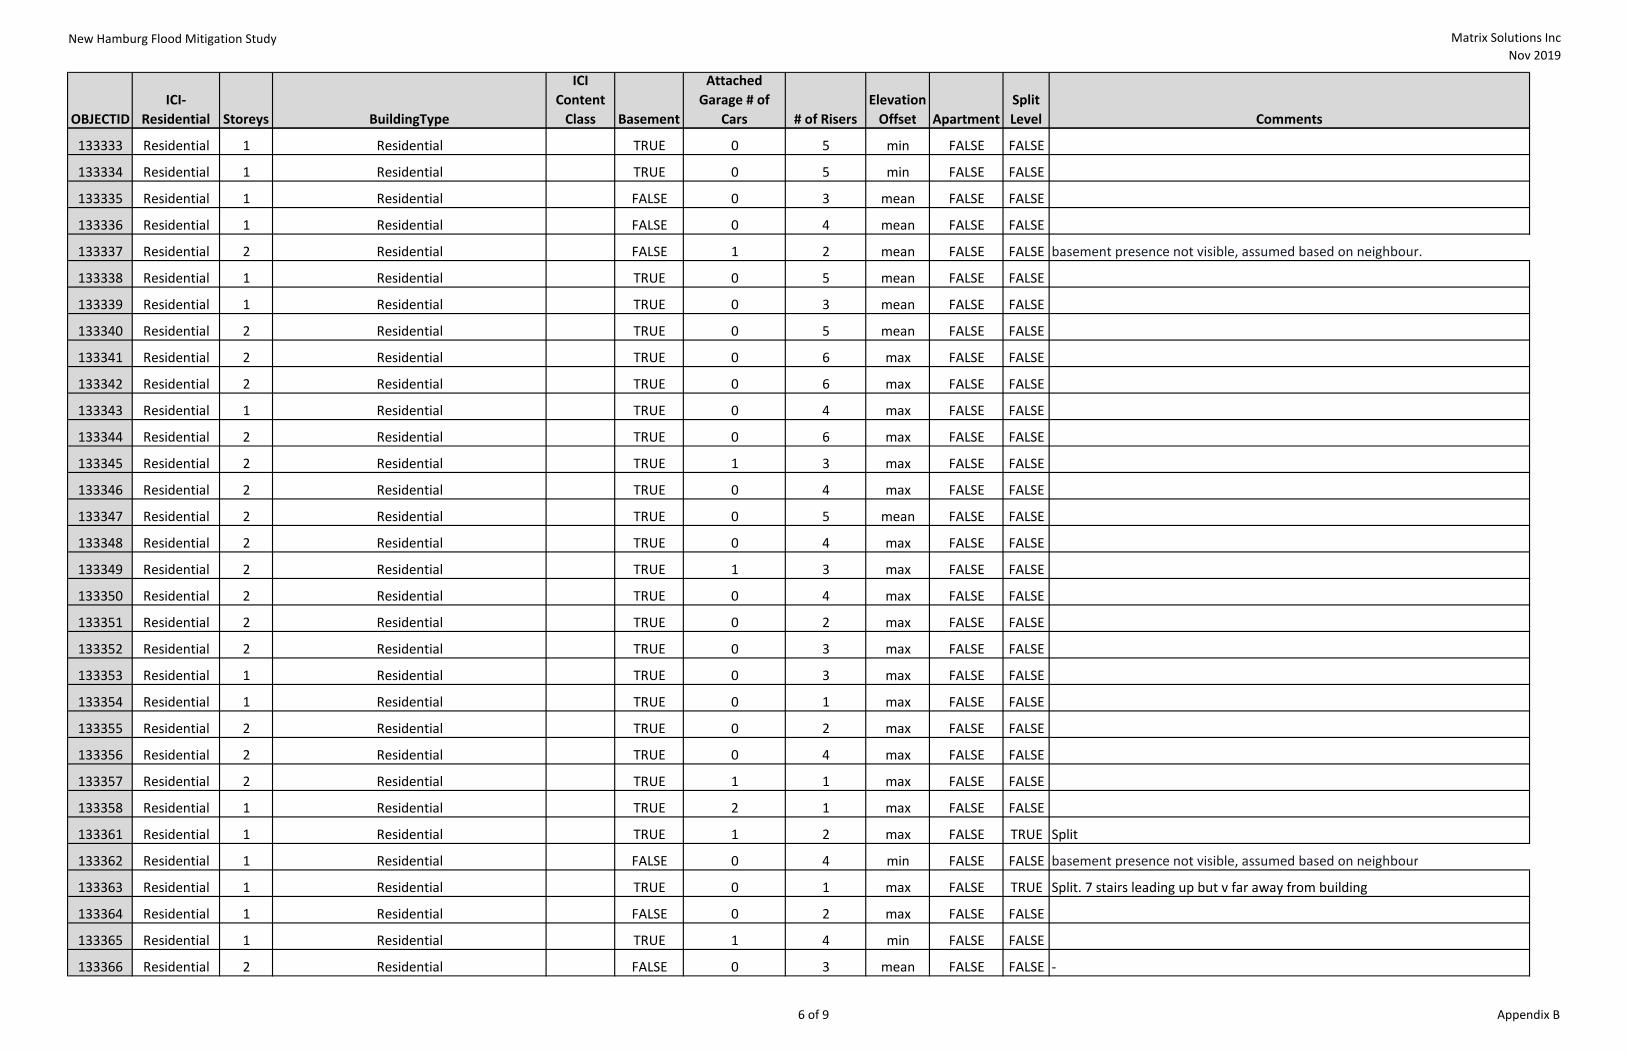
5.1.1 Field Verification
On October 8, 2019, Matrix conducted a field verification exercise to improve the quality of the buildings data, address data gaps, and to generate more representative flood thresholds. Every building within or touching the Draft Regional inundation boundary was verified. With only a few exceptions outlined below, these were done by driving through the Town and recording the following building attributes:
• ICI building type (for content class) • Number of risers (steps) to first floor • Ground surface elevation best representation (min/ mean /max) for first-floor elevation:
Record if the minimum, mean or maximum ground surface elevation would best represent first-floor elevation depending on lot grading and configuration of steps to the first floor.
Ground surface elevations are computed using zonal statistics from the DTM within a 0.5 m horizontal buffer.
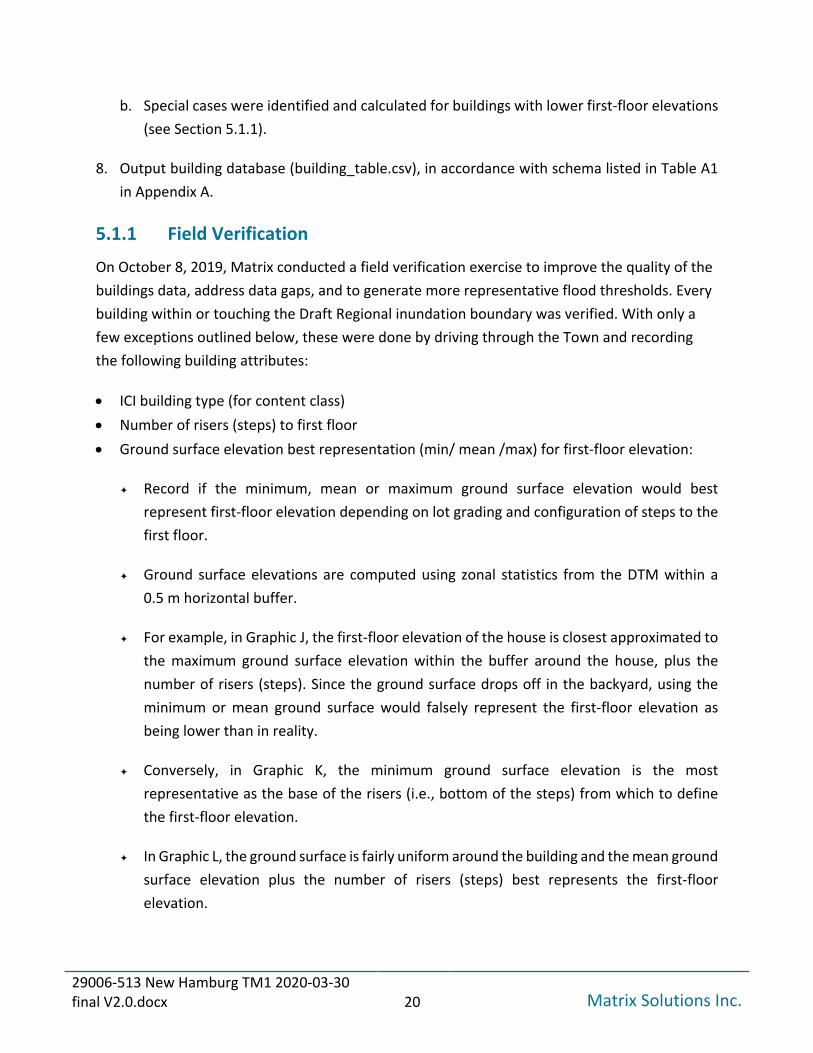
For example, in Graphic J, the first-floor elevation of the house is closest approximated to the maximum ground surface elevation within the buffer around the house, plus the number of risers (steps). Since the ground surface drops off in the backyard, using the minimum or mean ground surface would falsely represent the first-floor elevation as being lower than in reality.
Conversely, in Graphic K, the minimum ground surface elevation is the most representative as the base of the risers (i.e., bottom of the steps) from which to define the first-floor elevation.
In Graphic L, the ground surface is fairly uniform around the building and the mean ground surface elevation plus the number of risers (steps) best represents the first-floor elevation.
29006-513 New Hamburg TM1 2020-03-30 final V2.0.docx 21 Matrix Solutions Inc.
• Presence of basement • Presence and size (number of cars) of attached garage • Presence of multi-storey buildings (apartment) • Presence of split levels
The key limitation to this task is that it includes only what is visible from the street. Buildings were not entered. Basements were verified by presence of windows or walkouts. ICI buildings were not comprehensively verified for basements as the depth-damage curves do not include basements. However, special cases were identified where the standard calculations would be an oversimplification for ICI buildings where basements were observed.
The field verification data is included in Appendix B.
Graphic J Ground Surface Representation for First-floor Elevation Recorded as MAX (Lot Drops off in Backyard)
29006-513 New Hamburg TM1 2020-03-30 final V2.0.docx 22 Matrix Solutions Inc.
Graphic K Ground Surface Representation for First-floor Elevation Recorded as MIN (Plus Risers)
Graphic L Ground Surface Representation for First-floor Elevation Recorded as MEAN (Plus Risers)
29006-513 New Hamburg TM1 2020-03-30 final V2.0.docx 23 Matrix Solutions Inc.
In Graphic M, due to the lower level restaurant, the first-floor elevation was set as mean ground surface minus the number of steps. Similarly, in Graphic N, as apartment buildings also do not include basements, the first-floor elevation was set at mean ground surface minus the number of steps. In Graphic O, due to the lower level, first-floor elevation was set as minimum ground surface.
Graphic M Special Case: Set First-floor Elevation as Mean Ground Surface Minus Number of Steps
Graphic N Special Case: Set First-floor Elevation as Mean Ground Surface Minus Number
of Steps
29006-513 New Hamburg TM1 2020-03-30 final V2.0.docx 24 Matrix Solutions Inc.
Graphic O Special Case: Set First-floor Elevation as Minimum Ground Surface
There are three buildings (building ID: 132118, 132119, 132121) that Matrix was unable to visit due to construction on Lewis Street (only two of these are actually within the Draft Regional inundation boundary). These were verified using Google Street View to confirm the above details. These buildings were straight forward, and no further field verification was necessary.
As mentioned above, two buildings (building ID 132137, 132582) were outside of the initial 2006 floodplain boundary + vertical 0.5 m buffer but were touching the 2019 preliminary Draft Regional inundation boundary. As this identification occurred after the field verification task, these buildings were verified using Google Street View to confirm the above details. The revised draft (2020) Regional inundation boundary was lower than the preliminary Regional inundation boundary and therefore, all buildings within this updated boundary were accounted for in the buildings database.
5.1.2 Building Classification
Each building within the study area was classified according to content class and structure type in order to assign representative depth-damage curves. The content and structure classes are listed below. Section 5.3 further explains the depth-damage curves.
Residential content classes were assigned based on:
• Living space area (not including basement) • Home vs apartment (verified in the field)
Residential structure type was assigned based on:
29006-513 New Hamburg TM1 2020-03-30 final V2.0.docx 25 Matrix Solutions Inc.
• Region of Waterloo building layer open data attribute “number of storeys,” verified in the field
• Split level/apartment: identified in the field
The content and structure classes are combined (Table F) and used to assign the resulting direct (i.e., content and structure) depth-damage curves (see Section 5.3).
Note that any house >4,000 ft (referred to as Content Class AA) is considered as Content Class A houses (2,400 to 3,999 ft²), in accordance with TRCAs approach, as no Class AA Content Curve is available (pers. comm. N. Plato, TRCA, 2019). Only one residence within the study area was calculated at >4,000 ft² living space area.
Table F Residential Structure and Content Class Content-Structure
Combined Class Content Description Structure Description Count
ICI content class (Table G) were assigned based on:
• Field observation • When multiple retail types were present, classified as C7 Miscellaneous Retail • Mixed used buildings assigned predominant commercial class (e.g., Sobeys plaza assigned as
E1 Grocery) • Buildings with main floor retail and residential upper floors were considered as retail (since
direct damages of flooding would relate primarily to the main floor).
These classes are used to assign the content damage curve for ICI buildings (Section 5.3).
29006-513 New Hamburg TM1 2020-03-30 final V2.0.docx 26 Matrix Solutions Inc.
Table G Industrial, Commercial, or Institutional Content Class Content Class Description Count
A1 General Office 3 B1 Medical 1 C1 Shoes - C2 Clothing 1 C3 Stereos/TV 1 C4 Paper products 1 C5 Hardware/Carpet 4 C6 Retail 3 C7 Miscellaneous Retail 10 D1 Furniture/Appliances 1 E1 Groceries 2 F1 Drugs 1 G1 Auto - H1 Hotels - I1 Restaurants 4 J1 Personal Service 1 K1 Financial 3 L1 Warehouse/Industrial 14 M1 Theatres - N1 Institutional 9 O1 Hospital -
TOTAL 58
ICI structure type (Table H) were assigned based on:
• Region of Waterloo open data attribute “building type,” verified in the field
Table H Industrial, Commercial, or Institutional Structure Class GRCA Layer
("Building Type") Structure Type Count
Business S1 (Office/Retail) 36 Mercantile Industrial S2 (Industrial/Warehouse) 16 Agricultural Utility and Miscellaneous Educational S5 (Institutional) 6 Institutional Assembly TOTAL 58
29006-513 New Hamburg TM1 2020-03-30 final V2.0.docx 27 Matrix Solutions Inc.
Special consideration was made for the two picnic shelters in the fair grounds (Graphic P). These two structures (Building ID 133190 and 133191) were included in the original buildings layer; however, as damages would be quite low and more in line with external sheds, which are already accounted for in the depth-damage curves for the other structures on the property, these two structures have been removed from the assessment. As these structures are within the 2-year floodplain, they are frequently flooded.
Graphic P Picnic Shelters in Fair Grounds
5.1.3 Assumptions
The following are additional assumptions related to the structures database:
• Duplexes are considered two separate buildings (and are provided as separate polygons).
Special Case Building ID 212038; was a single polygon. In our analysis, we considered it as two separate buildings (split in half).
• Split levels are treated as 1-storey houses with a basement (this is consistent with previous studies [IBI 2015a]).
• Window wells are not accounted for in the lowest opening elevation (i.e., window well could be lower than the minimum ground level).
• Apartment buildings are assumed to have no basement (or defined as first-floor elevation at below grade as in Graphic N).
• Basement floor area is equal to first-floor living area.
29006-513 New Hamburg TM1 2020-03-30 final V2.0.docx 28 Matrix Solutions Inc.
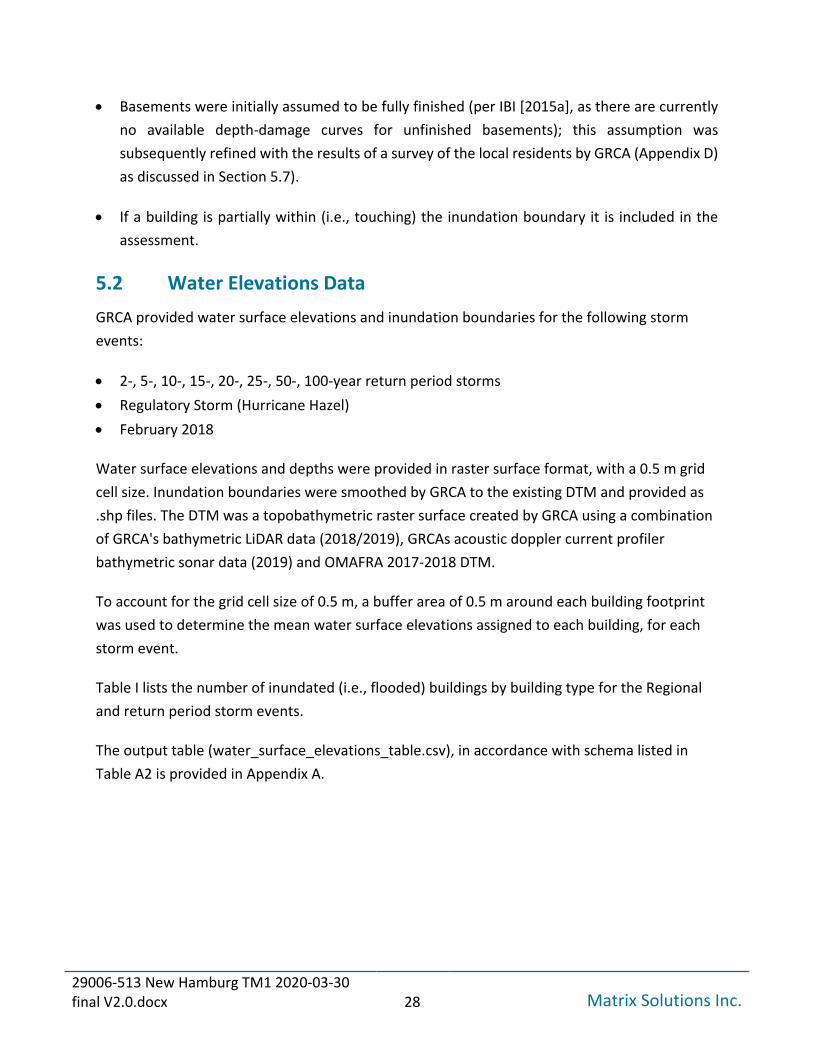
• Basements were initially assumed to be fully finished (per IBI [2015a], as there are currently no available depth-damage curves for unfinished basements); this assumption was subsequently refined with the results of a survey of the local residents by GRCA (Appendix D) as discussed in Section 5.7).
• If a building is partially within (i.e., touching) the inundation boundary it is included in the assessment.
5.2 Water Elevations Data GRCA provided water surface elevations and inundation boundaries for the following storm events:
• 2-, 5-, 10-, 15-, 20-, 25-, 50-, 100-year return period storms • Regulatory Storm (Hurricane Hazel) • February 2018
Water surface elevations and depths were provided in raster surface format, with a 0.5 m grid cell size. Inundation boundaries were smoothed by GRCA to the existing DTM and provided as .shp files. The DTM was a topobathymetric raster surface created by GRCA using a combination of GRCA's bathymetric LiDAR data (2018/2019), GRCAs acoustic doppler current profiler bathymetric sonar data (2019) and OMAFRA 2017-2018 DTM.
To account for the grid cell size of 0.5 m, a buffer area of 0.5 m around each building footprint was used to determine the mean water surface elevations assigned to each building, for each storm event.
Table I lists the number of inundated (i.e., flooded) buildings by building type for the Regional and return period storm events.
The output table (water_surface_elevations_table.csv), in accordance with schema listed in Table A2 is provided in Appendix A.
29006-513 New Hamburg TM1 2020-03-30 final V2.0.docx 29 Matrix Solutions Inc.
Table I Number of Inundated Buildings by Building Type and Storm Event Building Type 2-year 5-year 10-year 15-year 20-year 25-year 50-year 100-year Regional
29006-513 New Hamburg TM1 2020-03-30 final V2.0.docx 30 Matrix Solutions Inc.
5.3 Depth-Damage Curves Numerous sets of depth-damage curves are available for use. The previous study in New Hamburg (GRIC 1983 see Section 4.1) used two residential curves for either frame or brick houses with basements developed in the 1960s (Acres 1968) and four curves for industrial/commercial/institutional buildings developed in the 1970s (Philips 1976). Depth-damage curves from the Ministry of Natural Resources and Forestry (from studies in the 1980s) were updated in 2007 (Moudrak et al., 2017). IBI (2015a; Moudrak et al., 2017) commented that these curves are outdated, since construction method, economics, and lifestyles have changed since the original studies in the 1980s (and earlier). Furthermore, these curves provided no guidance for apartment buildings.
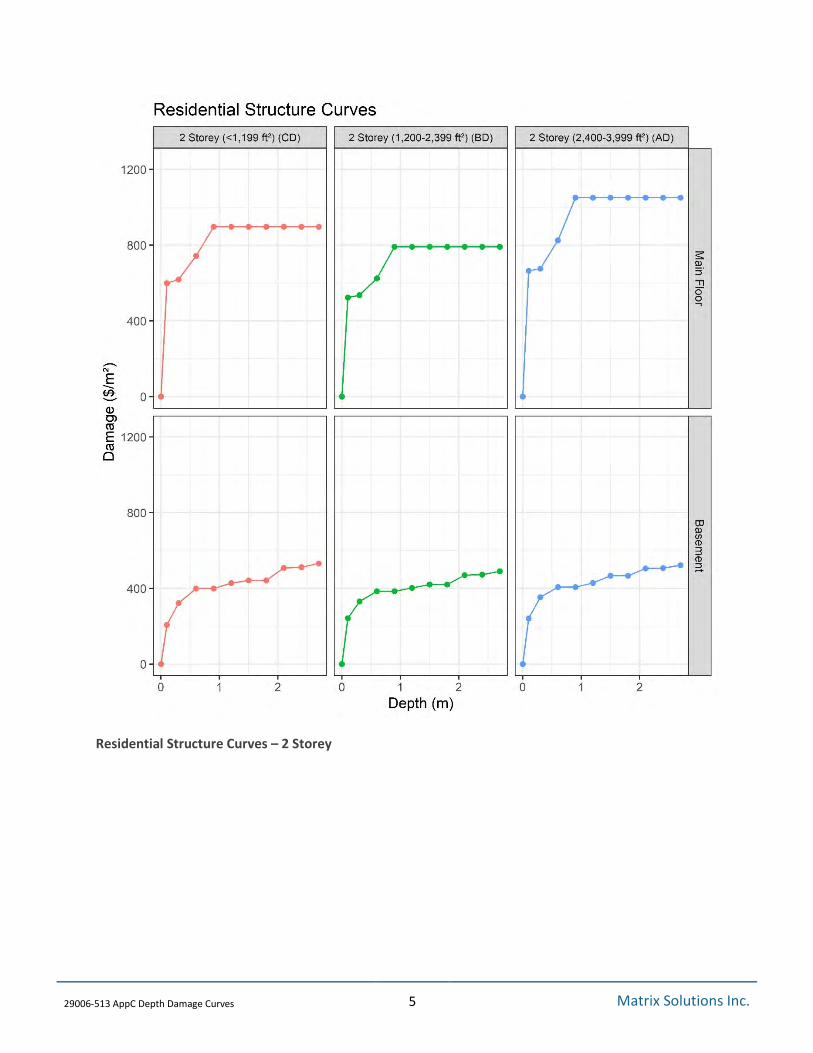
IBI (2015a) established new depth-damage curves for a wide selection of building types. Damages to building structure and contents were estimated for a series of flooding levels. These depth-damage curves represent the most up-to-date curves available in Canada and were adapted for use in Ontario by TRCA (IBI 2019) using price indexes to convert from Alberta $2014 to Ontario $2016. These curves were used in the 2017 Intact study (Moudrak et al., 2017, as described in Section 4.3). The depth-damage curves have been provided to Matrix by TRCA for use in this study and are included in Appendix C.
Structure and content curves for residential buildings are assigned based on the combination of their content class and structure type. For example, the depth-damage curves “AD” are applied for buildings with Content Class A, and Structure Class D.
ICI structure curves are assigned based on the structure type, and ICI content curves are assigned based on the building’s content class. These classes are defined in Section 5.1.2.
The depth-damage curves are separated into main floor curves and basement curves. To calculate damages for a given building, the structure is associated with its appropriate structure damage and content damage curve, depending if there is flooding in only the basement, only the main floor (if no basement is present), or both. These scenarios are described further in Section 5.5.
Basement damage curves assume fully finished basements. While this assumption is not accurate, it accounts for the possibility of residents finishing their basements at any point in time. Given the theoretical output of the damage assessment as an AAD, this assumption is conservative. Indeed, the residents of New Hamburg are accustomed to frequent flooding and are likely more prepared for a flood and have adapted to living within a flood centre, compared
29006-513 New Hamburg TM1 2020-03-30 final V2.0.docx 31 Matrix Solutions Inc.
to the residents of Alberta where the flood damage curves were generated, and the flood of 2013 caught most people unprepared. As such, GRCA undertook a survey to support the estimation of annual average flood damages in New Hamburg and refine the assumptions and approach to calculating basement flood damages (see Section 5.7 and Appendix D).
5.4 Indirect Damages Matrix reviewed available background studies to determine appropriate values for estimating indirect damages as a percentage of direct damages. These included:
• Kates (1965) • IBI and ECOS (1982) • Nichols (1979) • IBI and ECOS (1984) • Agra Earth and IBI (1998) • IBI (2015b)
The results are illustrated in Graphic Q, as a quartile box plots by building type, with the mean value marked with “X,” and the median value with a horizontal line. The values used for this study (Table J) are labelled, which correspond to the median values and are consistent with the previous flood damage estimates (GRIC 1983).
Table J Indirect Damages as Percentage of Direct Damages by Building Type
Building Group Structure Type Building Type Indirect Damage (% of Direct Damages)
29006-513 New Hamburg TM1 2020-03-30 final V2.0.docx 32 Matrix Solutions Inc.
Graphic Q Box Plot of Indirect Damages as Percentage of Direct Damages Compiled from Background Studies
PHASE 2 - FLOOD DAMAGE CALCULATIONS In consultation with GRCA, Matrix used Python (version 2.7) to compute the flood depths and damages as outlined below.
5.5 Flood Depths The first step in the calculation of flood damages is to determine flood depths. Based on the hydraulic model results from GRCA, and the input data from Phase 1, the depth of flooding at each building was determined for each storm event.
There are four cases for flood depth and damages calculations, as illustrated in the schematics in Graphics R, S, T, and U.
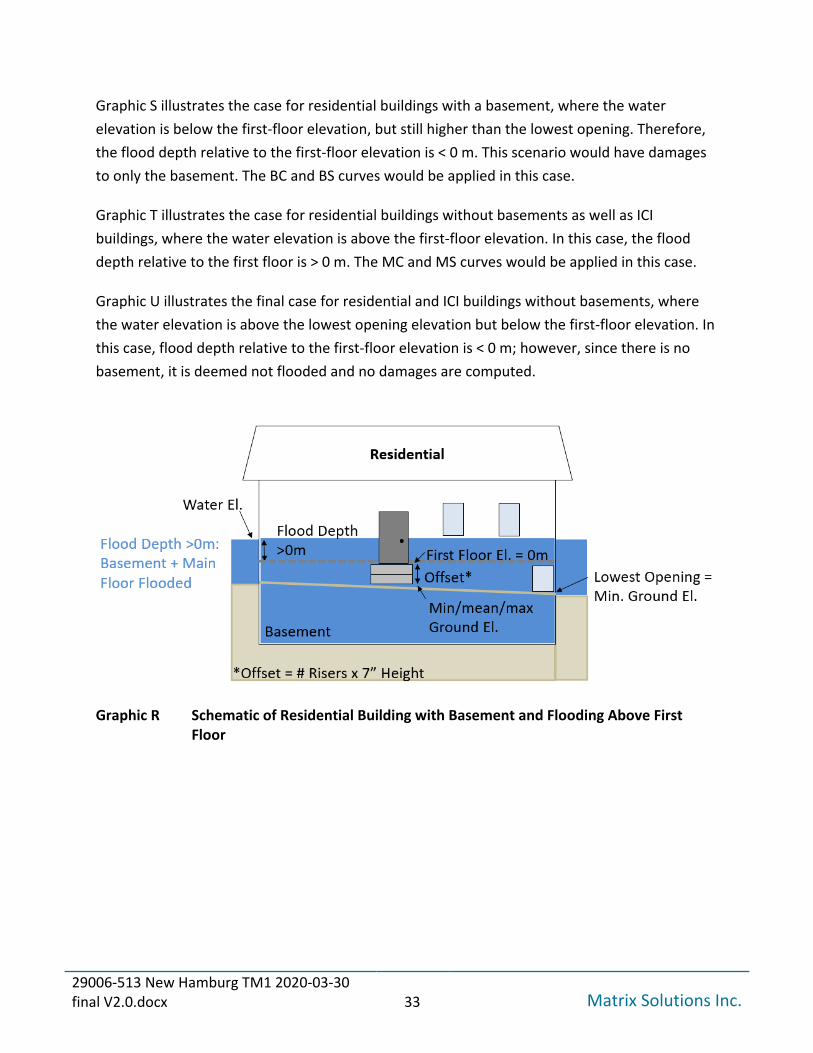
Graphic R illustrates the case for residential buildings, where a basement is present. If the water elevation is above the first-floor elevation, the flood depth relative to the first floor is > 0 m. This scenario would have damages to both the basement and main floor. The basement content (BC), basement structure (BS), main content (MC), and main structure (MS) curves would all be applied in this case.
29006-513 New Hamburg TM1 2020-03-30 final V2.0.docx 33 Matrix Solutions Inc.
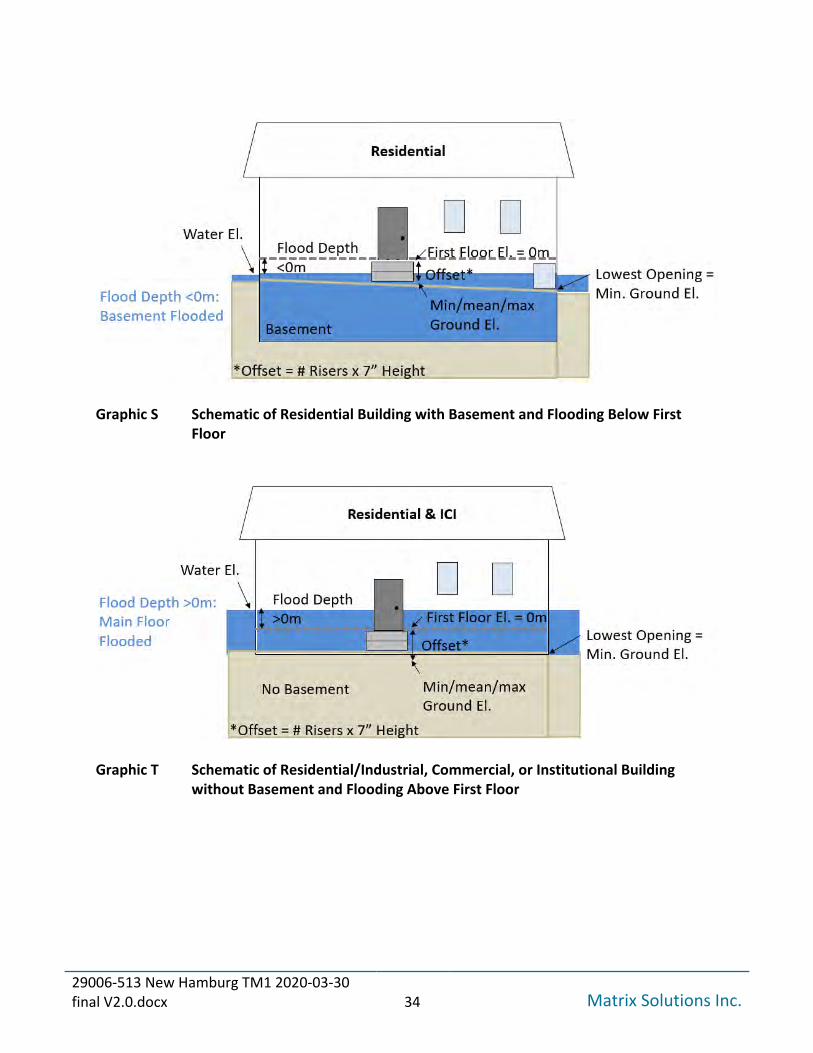
Graphic S illustrates the case for residential buildings with a basement, where the water elevation is below the first-floor elevation, but still higher than the lowest opening. Therefore, the flood depth relative to the first-floor elevation is < 0 m. This scenario would have damages to only the basement. The BC and BS curves would be applied in this case.
Graphic T illustrates the case for residential buildings without basements as well as ICI buildings, where the water elevation is above the first-floor elevation. In this case, the flood depth relative to the first floor is > 0 m. The MC and MS curves would be applied in this case.
Graphic U illustrates the final case for residential and ICI buildings without basements, where the water elevation is above the lowest opening elevation but below the first-floor elevation. In this case, flood depth relative to the first-floor elevation is < 0 m; however, since there is no basement, it is deemed not flooded and no damages are computed.
Graphic R Schematic of Residential Building with Basement and Flooding Above First Floor
29006-513 New Hamburg TM1 2020-03-30 final V2.0.docx 34 Matrix Solutions Inc.
Graphic S Schematic of Residential Building with Basement and Flooding Below First Floor
Graphic T Schematic of Residential/Industrial, Commercial, or Institutional Building without Basement and Flooding Above First Floor
29006-513 New Hamburg TM1 2020-03-30 final V2.0.docx 35 Matrix Solutions Inc.
Graphic U Schematic of Residential/Industrial, Commercial, or Institutional Building without Basement and Flooding Below First Floor
5.6 Flood Damages Based on the flooding depths, Matrix then calculated:
• Direct damages • Indirect damages • Total damages • Average annual damages
The input files were used according to the table schema (Appendix A) and as outlined in Phase 1 (see Graphic I), using the flood depth calculations. These are outlined below.
5.6.1 Direct Damages
Direct damages due to flooding were computed for the cases described above in Graphics R to U and are summarized in Table K. The depth-damage curves relate the depth of flooding at a building to expected damages ($/m²). The unit area damage ($/m²) is then multiplied by the single floor area (m²) to obtain the direct damages estimate for each building and event.
29006-513 New Hamburg TM1 2020-03-30 final V2.0.docx 36 Matrix Solutions Inc.
Table K Direct Damages Calculation Logic Building Type Basement Flood Depth Depth-Damage Calculation in $/m2
Residential Yes >0 m Basement + Main Floor Damages (BC + BS + MC + MS)
Residential Yes <0 m Basement Damages (BC + BS)
Residential No >0 m Main Floor Damages (MC + MS)
Residential No <0 m No Damages ICI No >0 m Main Floor Damages ICI No <0 m No Damages Notes: BC - basement content curve BS - basement structure curve MC - main content curve MS - main structure curve
5.6.2 Indirect Damages
The direct damages are then multiplied by the percentage in the indirect damages table to compute indirect damages, according to building type (see Table J).
5.6.3 Total Damages
Total damages are the sum of direct and indirect damages for each building and event.
5.6.4 Average Annual Flood Damages
The AAD from flooding is the cumulative potential damages occurring from various flood events over an extended period of time. The AAD is averaged over time and presented as a uniform annual amount. The AAD is computed by plotting the total damages vs probability distribution and then computing the area under the curve. The first step in this is assigning a probability to each storm event. For return period storms, this is simply the inverse of the return period (e.g., 1/2 = 50%), as shown in Table L. For the Regional storm, this is more challenging. GRCA has updated the flood frequency analysis for the Nith River at New Hamburg; however, the curves used have not been extended to capture the 1,011 m3/s Regional flow. In order to include the flood damages for the Regional event, Matrix estimated a return period of approximately 1,000 years using the relationship of the storm probability and flow. There is a high level of uncertainty in applying a return period and probability to the Regional storm based on the period of record of observed water levels at the New Hamburg gauge. We completed a
29006-513 New Hamburg TM1 2020-03-30 final V2.0.docx 37 Matrix Solutions Inc.
sensitivity analysis on this value and found that varying it from a 0.1% probability to 0.3% probability resulted in a 3% change in the AAD.
Using the same relationship, the February 2018 event was computed as having a return period equivalent to a 37-year event. This is consistent with GRCA’s flood frequency analysis.
5.7 Public Consultation and Survey GRCA held three PICs for the NHFM study. The first PIC was held June 26, 2019 and introduced the project objectives, anticipated methods and requested members of the public share information about water levels on their property during past flood events. The second PIC was held November 25, 2019, presented a preliminary estimate of annual average flood damages, and solicited input on a list of potential mitigation options.
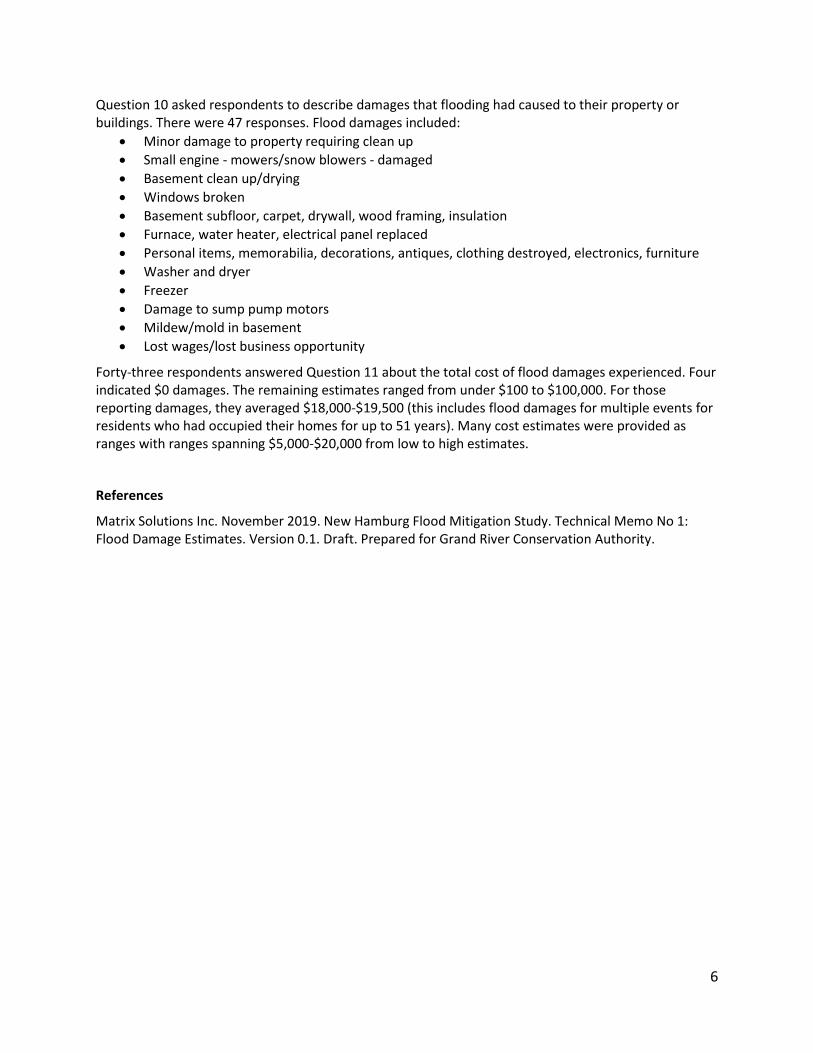
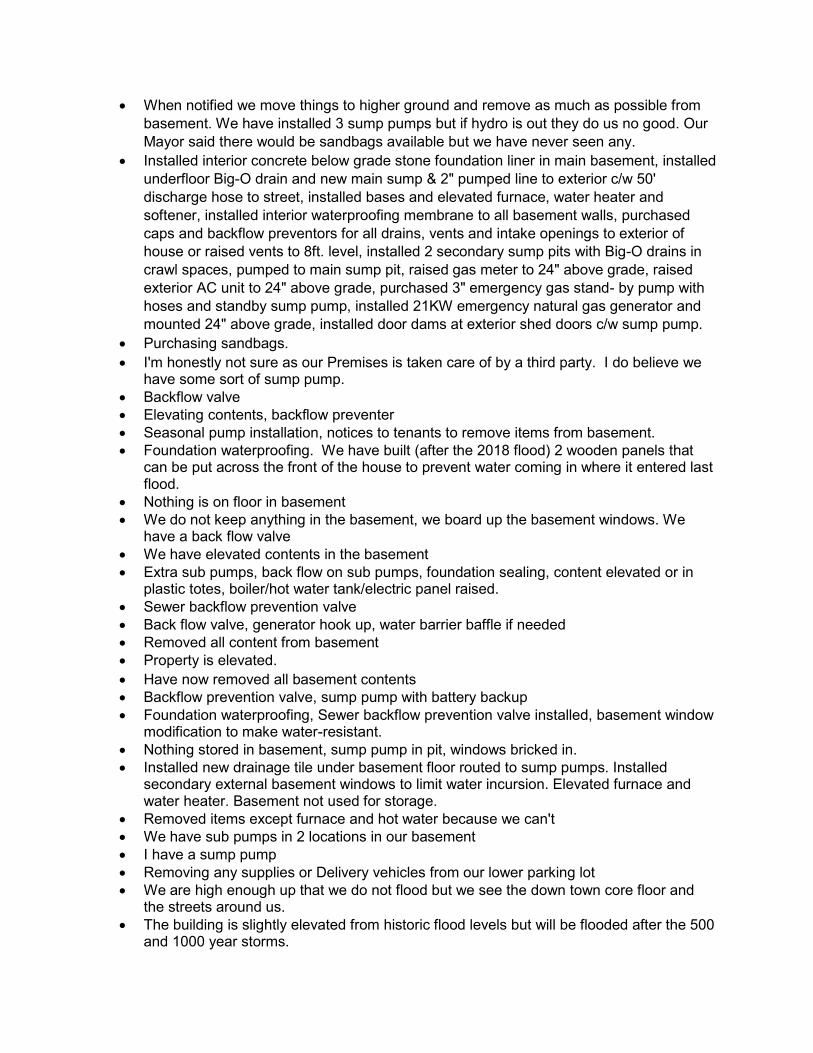
A survey of property owners in areas at risk of riverine flooding in New Hamburg was released at the second PIC, with responses collected through November and December 2019. GRCA surveyed New Hamburg residents and businesses to gather information about the characteristics of buildings in at-risk areas (e.g., whether basements are finished), types of flooding residents have experienced (river-related or sewer backup), and damages and costs associated with floods. GRCA’s technical memorandum describing the survey and results is included in Appendix D. The survey results, summarized below, were used to refine the preliminary estimate of flood damages:
• About 60% of respondents have experienced flooding • 43% have experienced damages (mostly due to basement or garage flooding)
29006-513 New Hamburg TM1 2020-03-30 final V2.0.docx 38 Matrix Solutions Inc.
• Almost half of residences have unfinished basements • 77% of respondents have taken measures to protect their property from flooding • About 70% of respondents receive flood messages
The final PIC was held on March 11, 2020 and presented study findings and next steps. GRCA compiled the comments received in response to the PICs (included under separate cover) with names and addresses removed.
6 Results The results from the flood damages assessment are summarized below. The flexibility of the output and GIS linkage allows for any of the metrics outlined in the schema (Appendix A) to be aggregated and mapped.
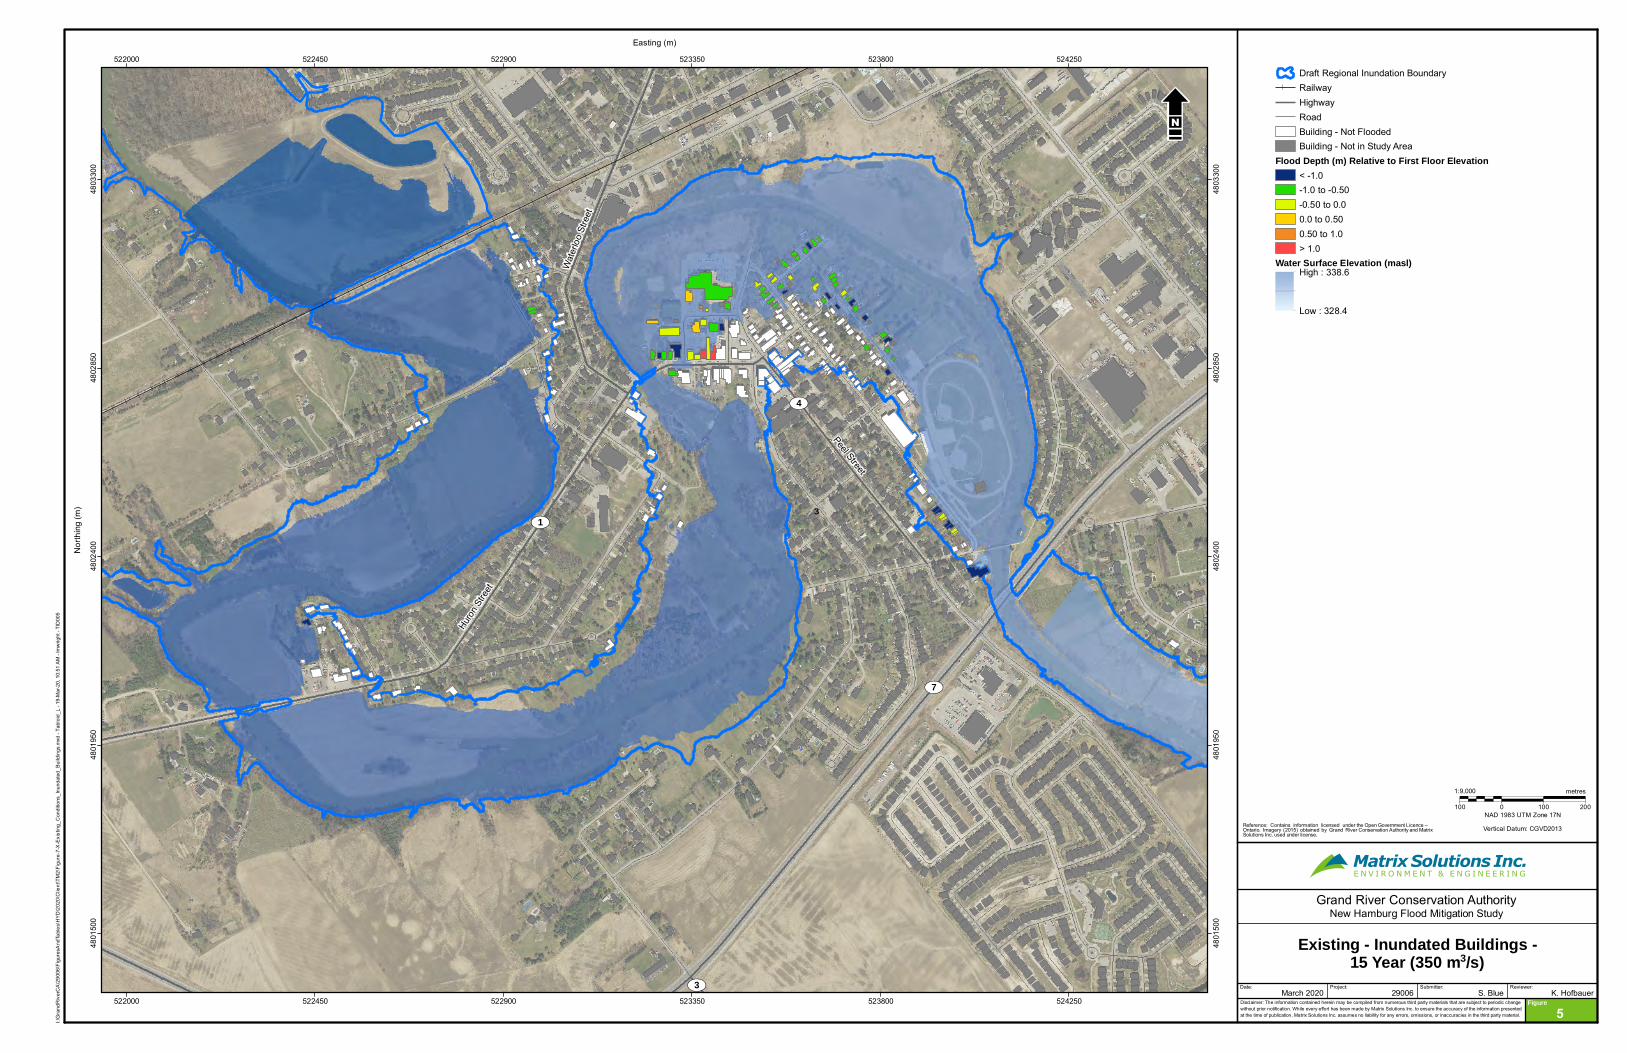
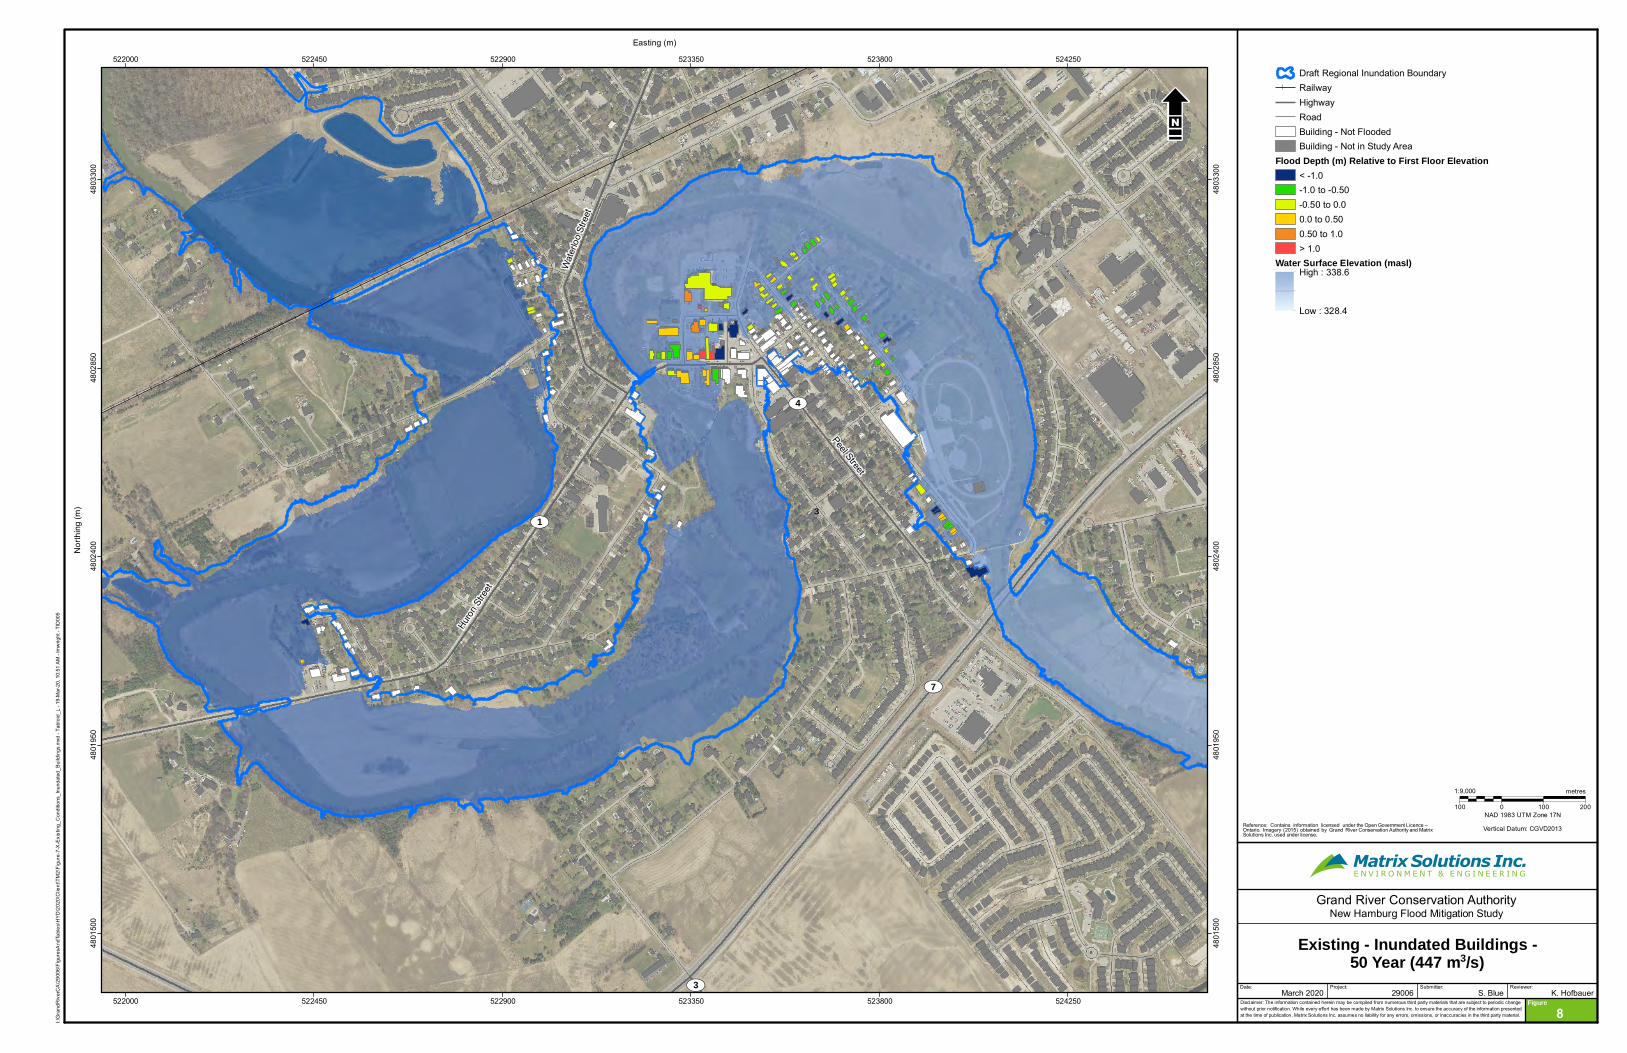
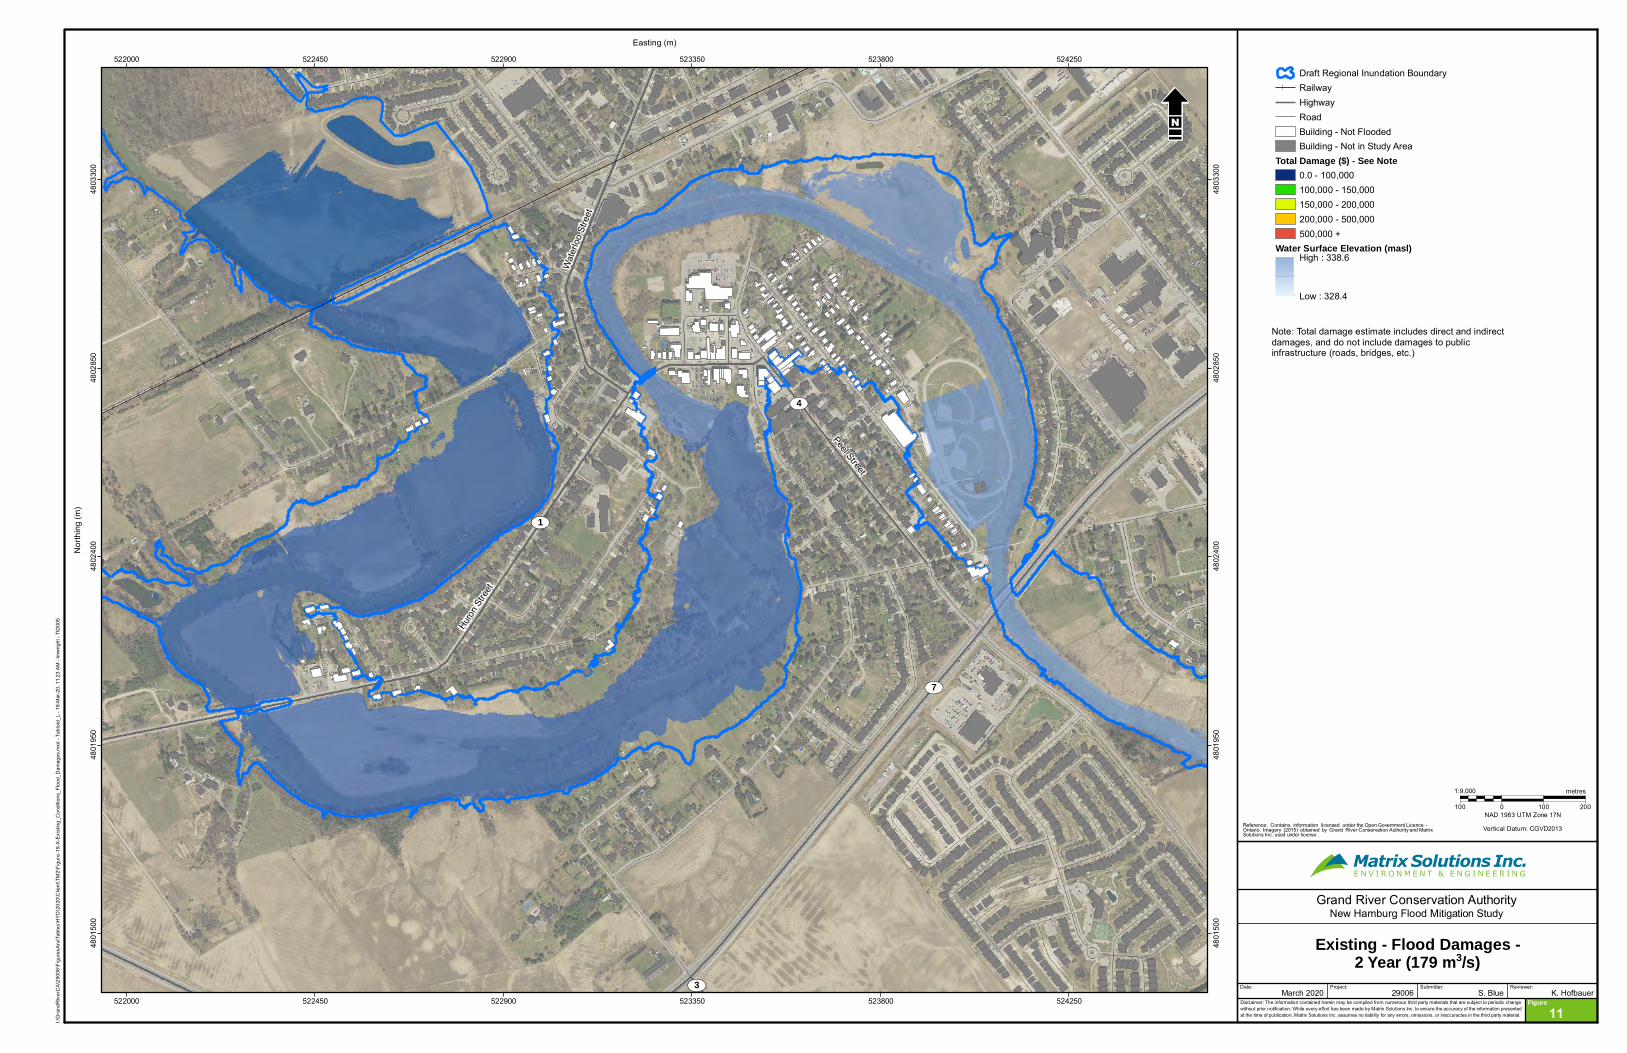
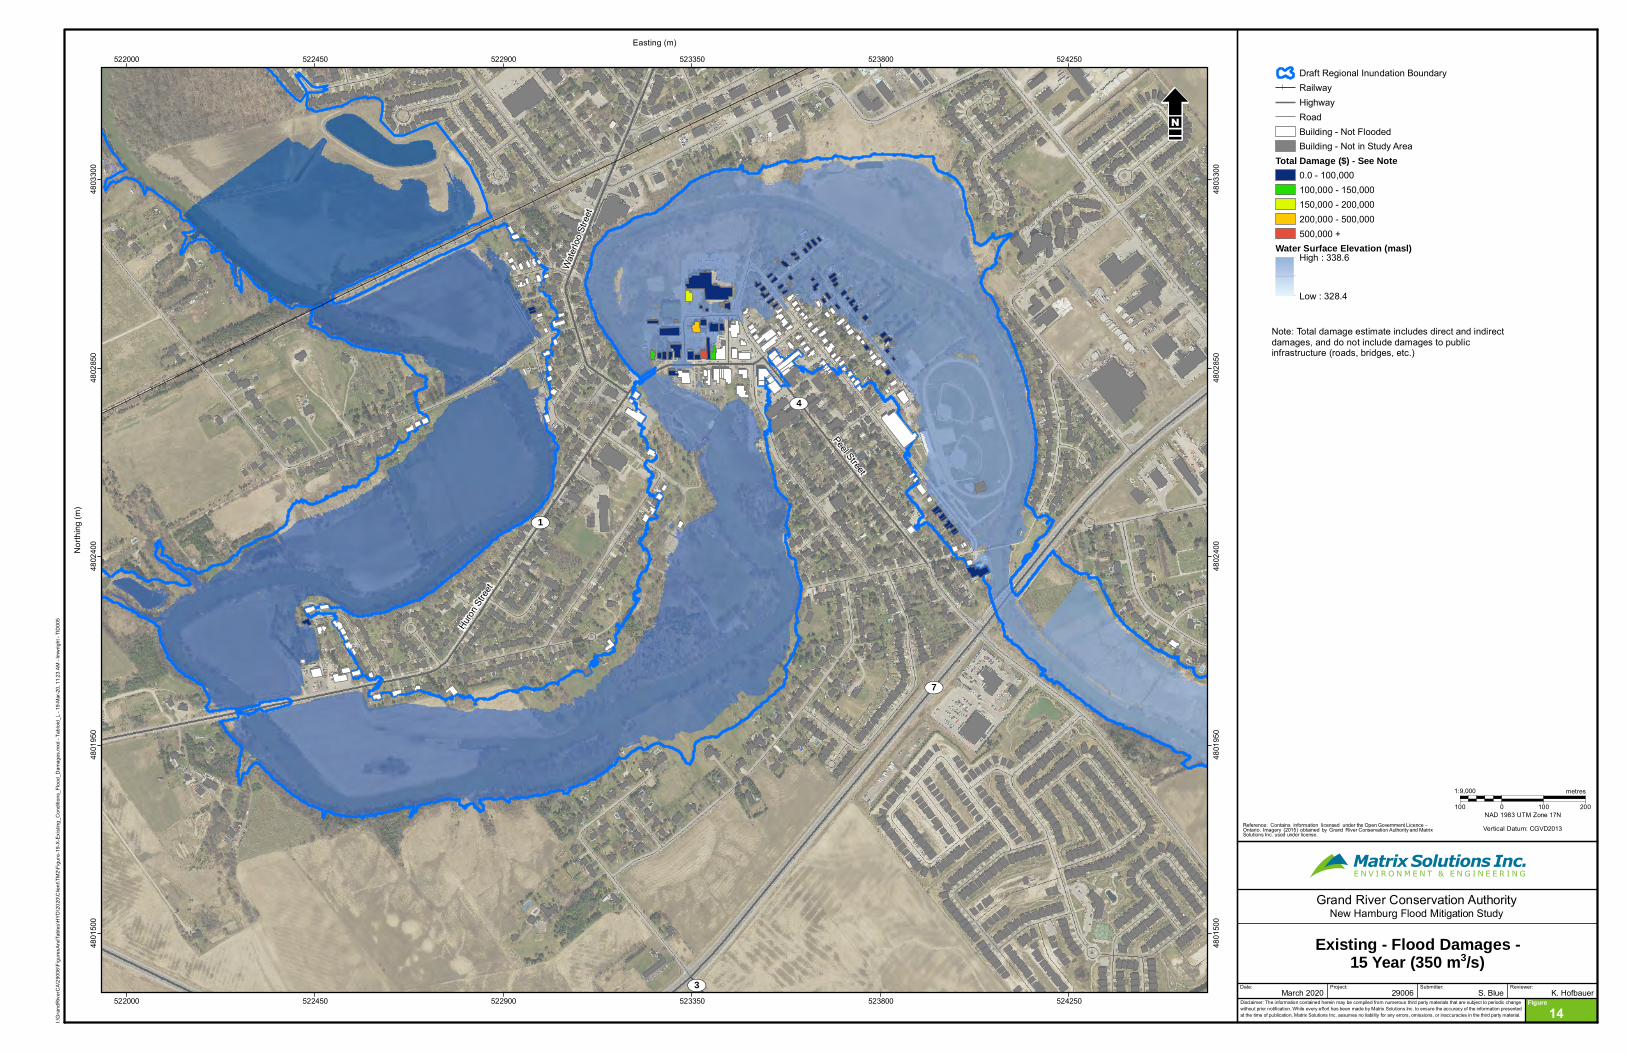
6.1 Flood Depths The estimated flood depths are shown on Figures 2 to 10 for the 2-, 5-, 10-, 15-, 20-, 25-, 50-, 100-year, and Regional, respectively. Figures 2 to 10 include the Draft Regional inundation boundary, the water surface elevation raster for the event, and the buildings. White buildings are those that were included in the study area but are not flooded under that event. Coloured buildings are represented by the flood depth relative to the first-floor elevation for each storm event. Grey buildings are not included in the study area.
As shown on these figures, there are lower flood depths with lower return period storms, indicating mainly basement flooding (green-coloured buildings). There are no flooded buildings in the 2-year event (179 m3/s). In less frequent, larger storm events, the flood depths are surpassing the first-floor elevation within the inundation area (yellow-to-brown-coloured buildings), and basement flooding occurs around the fringes of the inundation area.
6.2 Flood Damages Using the results of GRCA’s survey (Section 5.7 and Appendix D), the flood damages calculations were adjusted as follows:
• 50% reduction in basement structural damages to reflect that almost half of residences have unfinished basements.
• 25% reduction in basement contents damages to reflect that over 75% of respondents have property flood protection measures in place.
29006-513 New Hamburg TM1 2020-03-30 final V2.0.docx 39 Matrix Solutions Inc.
The estimated total flood damages are shown on Figures 11 to 19 for the 2-, 5-, 10-, 15-, 20-, 25-, 50-, 100-year, Regional, respectively. In this map series, the white buildings are those that were included in the study area but are not flooded under that event. Coloured buildings are represented by the total flood damages (direct + indirect damages) for each storm event. Grey buildings are not included in the study area.
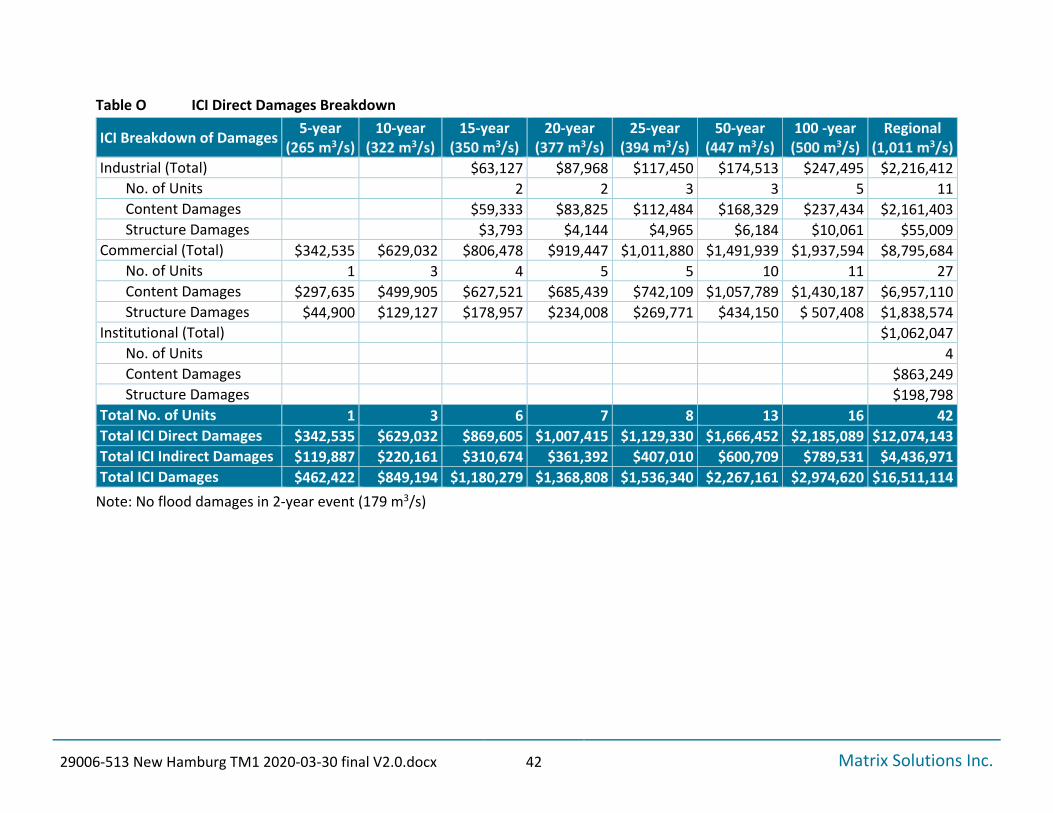
As shown on these figures, there are lower damages with lower return period storms, and higher damages for less frequent, larger storm events. The total direct and indirect damages are summarized in Table M by building type. A breakdown of the residential flood (direct) damages by basement and first floor is included in Table N. A breakdown of ICI flood damages is included in Table O. Detailed output is included in Appendix E.
29006-513 New Hamburg TM1 2020-03-30 final V2.0.docx 40 Matrix Solutions Inc.
Institutional (Total) $1,062,047 No. of Units 4 Content Damages $863,249 Structure Damages $198,798
Total No. of Units 1 3 6 7 8 13 16 42 Total ICI Direct Damages $342,535 $629,032 $869,605 $1,007,415 $1,129,330 $1,666,452 $2,185,089 $12,074,143 Total ICI Indirect Damages $119,887 $220,161 $310,674 $361,392 $407,010 $600,709 $789,531 $4,436,971 Total ICI Damages $462,422 $849,194 $1,180,279 $1,368,808 $1,536,340 $2,267,161 $2,974,620 $16,511,114
Note: No flood damages in 2-year event (179 m3/s)
29006-513 New Hamburg TM1 2020-03-30 final V2.0.docx 43 Matrix Solutions Inc.
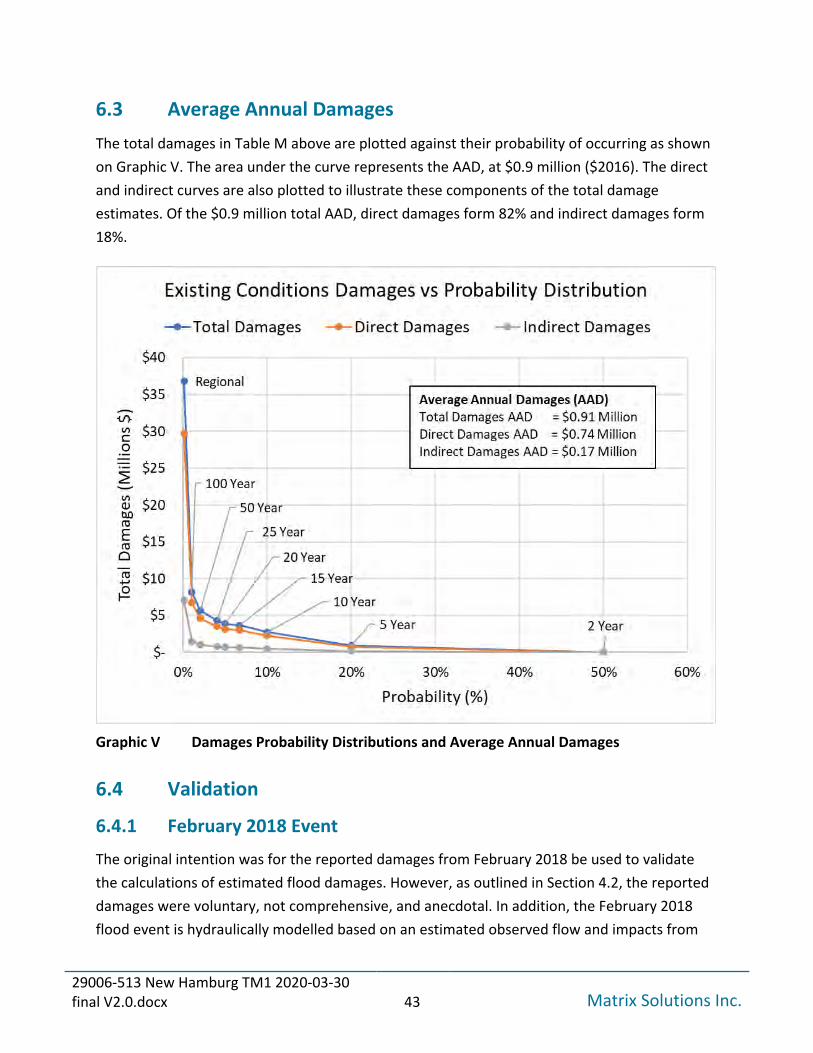
6.3 Average Annual Damages The total damages in Table M above are plotted against their probability of occurring as shown on Graphic V. The area under the curve represents the AAD, at $0.9 million ($2016). The direct and indirect curves are also plotted to illustrate these components of the total damage estimates. Of the $0.9 million total AAD, direct damages form 82% and indirect damages form 18%.
Graphic V Damages Probability Distributions and Average Annual Damages
6.4 Validation
6.4.1 February 2018 Event
The original intention was for the reported damages from February 2018 be used to validate the calculations of estimated flood damages. However, as outlined in Section 4.2, the reported damages were voluntary, not comprehensive, and anecdotal. In addition, the February 2018 flood event is hydraulically modelled based on an estimated observed flow and impacts from
29006-513 New Hamburg TM1 2020-03-30 final V2.0.docx 44 Matrix Solutions Inc.
ice and ice jams provide limitations in the accuracy of the mapping and hydraulic input data. As such, the calculations of estimated damages have not been validated with actual damages. (However, the survey results were used to refine the preliminary estimate of flood damages as described above.)
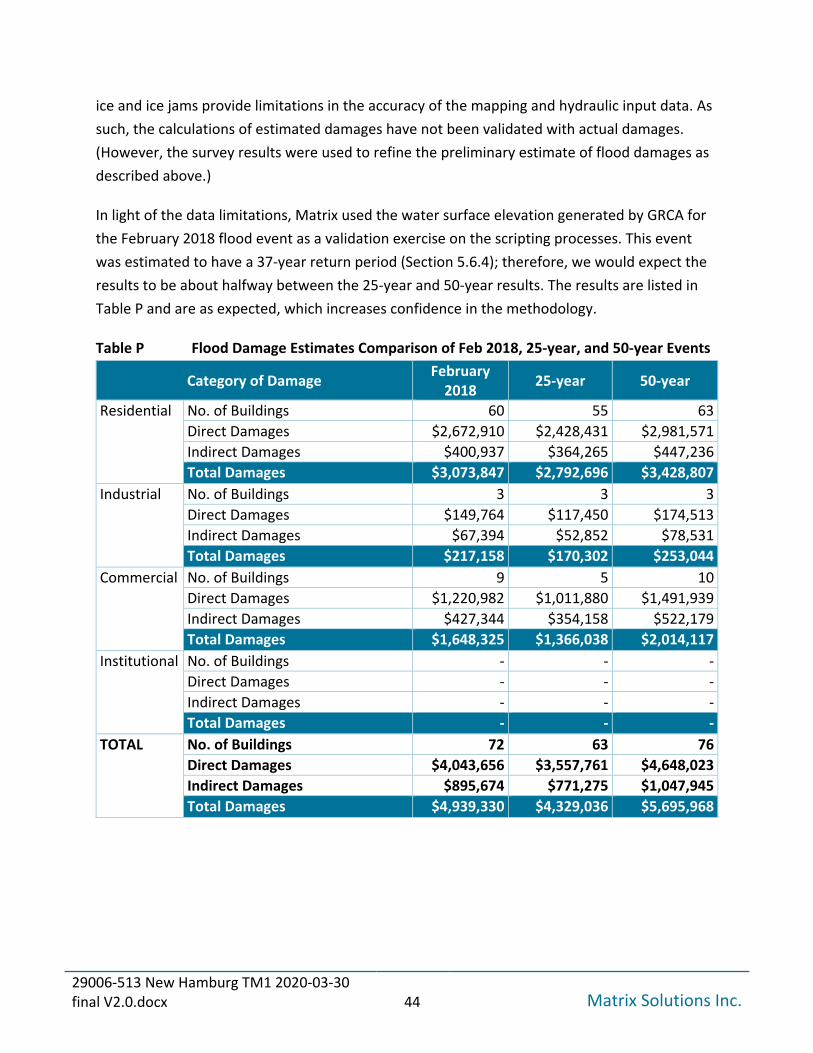
In light of the data limitations, Matrix used the water surface elevation generated by GRCA for the February 2018 flood event as a validation exercise on the scripting processes. This event was estimated to have a 37-year return period (Section 5.6.4); therefore, we would expect the results to be about halfway between the 25-year and 50-year results. The results are listed in Table P and are as expected, which increases confidence in the methodology.
Table P Flood Damage Estimates Comparison of Feb 2018, 25-year, and 50-year Events
Category of Damage February 2018 25-year 50-year
Residential No. of Buildings 60 55 63 Direct Damages $2,672,910 $2,428,431 $2,981,571 Indirect Damages $400,937 $364,265 $447,236 Total Damages $3,073,847 $2,792,696 $3,428,807
Industrial No. of Buildings 3 3 3 Direct Damages $149,764 $117,450 $174,513 Indirect Damages $67,394 $52,852 $78,531 Total Damages $217,158 $170,302 $253,044
Commercial No. of Buildings 9 5 10 Direct Damages $1,220,982 $1,011,880 $1,491,939 Indirect Damages $427,344 $354,158 $522,179 Total Damages $1,648,325 $1,366,038 $2,014,117
Institutional No. of Buildings - - - Direct Damages - - - Indirect Damages - - - Total Damages - - -
TOTAL No. of Buildings 72 63 76 Direct Damages $4,043,656 $3,557,761 $4,648,023 Indirect Damages $895,674 $771,275 $1,047,945 Total Damages $4,939,330 $4,329,036 $5,695,968
29006-513 New Hamburg TM1 2020-03-30 final V2.0.docx 45 Matrix Solutions Inc.
6.4.2 Comparison with GRIC (1983)
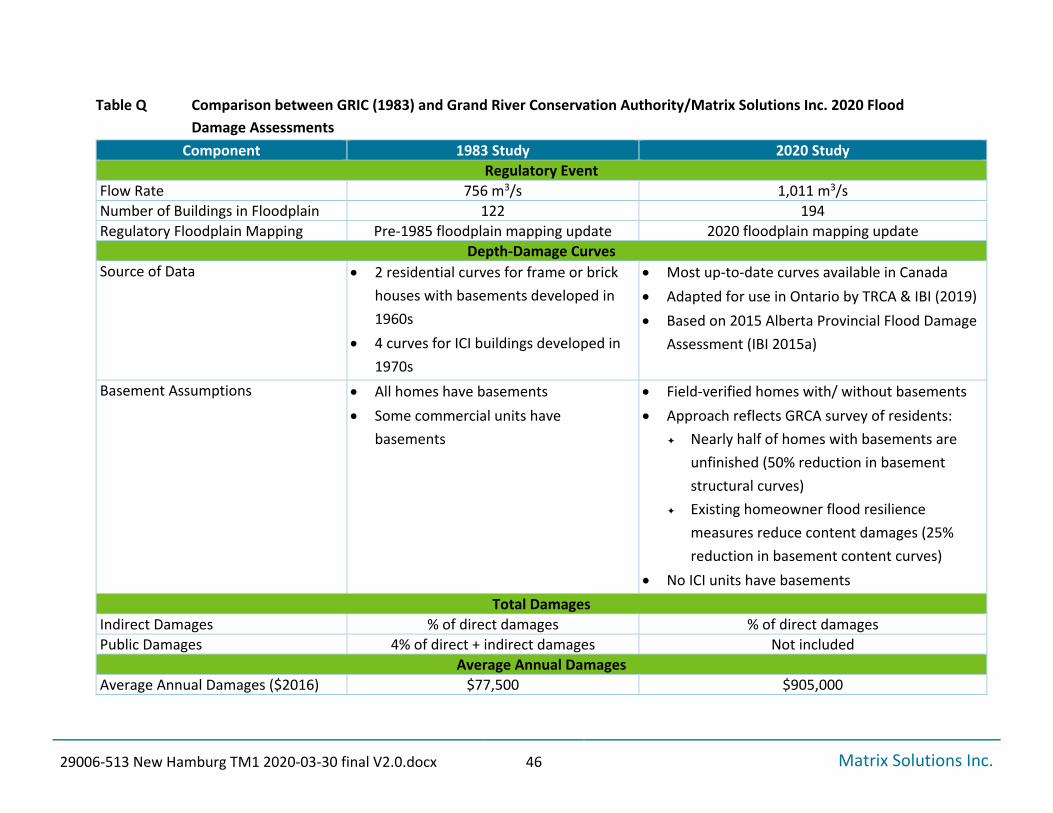
Table Q below provides a summary of the comparison between the previous flood damage estimates for New Hamburg (GRIC 1983; see Section 4.1) and the updated flood damages estimates from the current NHFM study. Flood frequencies and flows from GRIC 1983 are referenced in Table B (Section 4.1) and GRCA’s updated flood frequencies and flows are referenced in Table L (Section 5.6.4). Updates to GRCA flood frequencies are based on many more years of data and have a higher accuracy than those from GRIC 1983. The increase in the number of flooded structures (and damages) is largely due to the difference in flow rates and methods.
29006-513 New Hamburg TM1 2020-03-30 final V2.0.docx 46 Matrix Solutions Inc.
Table Q Comparison between GRIC (1983) and Grand River Conservation Authority/Matrix Solutions Inc. 2020 Flood Damage Assessments
Component 1983 Study 2020 Study Regulatory Event
Flow Rate 756 m3/s 1,011 m3/s Number of Buildings in Floodplain 122 194 Regulatory Floodplain Mapping Pre-1985 floodplain mapping update 2020 floodplain mapping update
Depth-Damage Curves Source of Data • 2 residential curves for frame or brick
houses with basements developed in 1960s
• 4 curves for ICI buildings developed in 1970s
• Most up-to-date curves available in Canada • Adapted for use in Ontario by TRCA & IBI (2019) • Based on 2015 Alberta Provincial Flood Damage
Assessment (IBI 2015a)
Basement Assumptions • All homes have basements • Some commercial units have
basements
• Field-verified homes with/ without basements • Approach reflects GRCA survey of residents:
Nearly half of homes with basements are unfinished (50% reduction in basement structural curves)
Indirect Damages % of direct damages % of direct damages Public Damages 4% of direct + indirect damages Not included
Average Annual Damages Average Annual Damages ($2016) $77,500 $905,000
29006-513 New Hamburg TM1 2020-03-30 final V2.0.docx 47 Matrix Solutions Inc.
6.5 Infrastructure Considerations Infrastructure damages (e.g., roads, bridges, utilities, public amenities, railroads) are a costly burden for the Township, Regional Municipality of Waterloo, and GRCA. These damages are very difficult to estimate as the amount of damage is a function of both the flood water characteristics (depth, velocity, debris) and ability of the infrastructure (e.g., a road) to withstand flood conditions (road surface, life span, state of repair). Infrastructure damages can be determined by the municipality, or estimated using municipal asset management plans, or alternatively, are sometimes accounted for as a percentage of direct damages (e.g., 10-25%, NRCAN 2017). If actual damages from a known event are available, this could be extrapolated to other storms by aerial extents (NRCAN 2017). As the reported damage to infrastructure for the Township (Table E) was not only for New Hamburg, and the location or address of infrastructure was not clear, this approach was not possible. In the absence of such information, and in consultation with GRCA, the NHFM study assessment has taken the following approach.
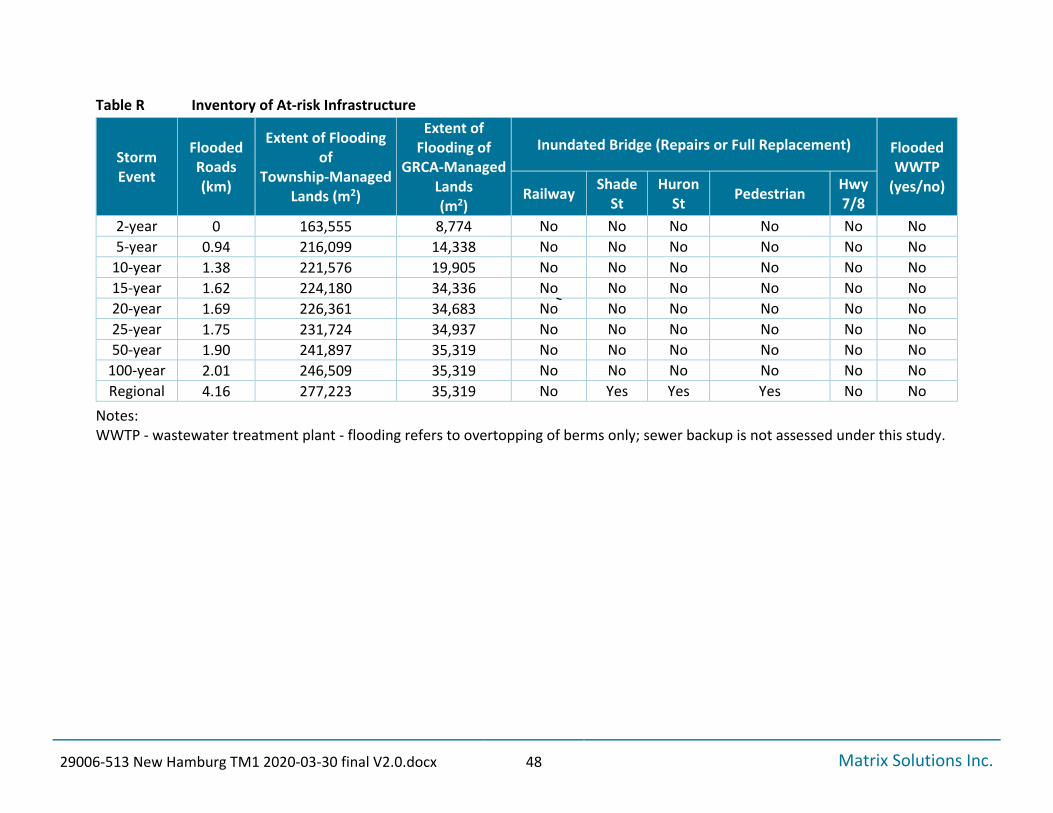
An inventory of at-risk municipal and GRCA lands and infrastructure is provided in Table R below. It includes the length of road that is inundated and the areal extent of GRCA and Township-managed lands that are inundated for each event. Damages to parks would include repair or replacement costs for items such as playgrounds, baseball diamonds, soccer fields, picnic shelters (Graphic P), gazebos, park benches, pathways, parking lots, and any other amenities not mentioned. Table R reflects that Wilmot Township manages some GRCA-owned lands under maintenance agreements (e.g., Scott Park, Kirkpatrick Park).
The inventory includes each bridge as inundated or not for each event, where inundation was defined as the water surface elevation reaching the ground surface elevation at any point along the bridge. Only the railway bridge and Highway 7/8 bridge are high enough to not be flooded during the Regional event. At the New Hamburg wastewater treatment plant (WWTP) just downstream (southeast) of the Town centre, the perimeter berms are high enough to prevent the river from spilling into the lagoons for all assessed storm events. The buildings associated with the WWTP were not included in the damage assessment.
Matrix completed flood risk mapping using the output of the GRCA’s HEC-RAS model for existing conditions and each potential flood mitigation option, which is documented in Technical Memorandum #2 (Matrix 2020).
29006-513 New Hamburg TM1 2020-03-30 final V2.0.docx 48 Matrix Solutions Inc.
Table R Inventory of At-risk Infrastructure
Storm Event
Flooded Roads (km)
Extent of Flooding of
Township-Managed Lands (m2)
Extent of Flooding of
GRCA-Managed Lands (m2)
Inundated Bridge (Repairs or Full Replacement) Flooded WWTP
(yes/no) Railway Shade St
Huron St Pedestrian Hwy
7/8 2-year 0 163,555 8,774 No No No No No No 5-year 0.94 216,099 14,338 No No No No No No
10-year 1.38 221,576 19,905 No No No No No No 15-year 1.62 224,180 34,336 No No No No No No 20-year 1.69 226,361 34,683 No No No No No No 25-year 1.75 231,724 34,937 No No No No No No 50-year 1.90 241,897 35,319 No No No No No No
100-year 2.01 246,509 35,319 No No No No No No Regional 4.16 277,223 35,319 No Yes Yes Yes No No
Notes: WWTP - wastewater treatment plant - flooding refers to overtopping of berms only; sewer backup is not assessed under this study.
29006-513 New Hamburg TM1 2020-03-30 final V2.0.docx 49 Matrix Solutions Inc.
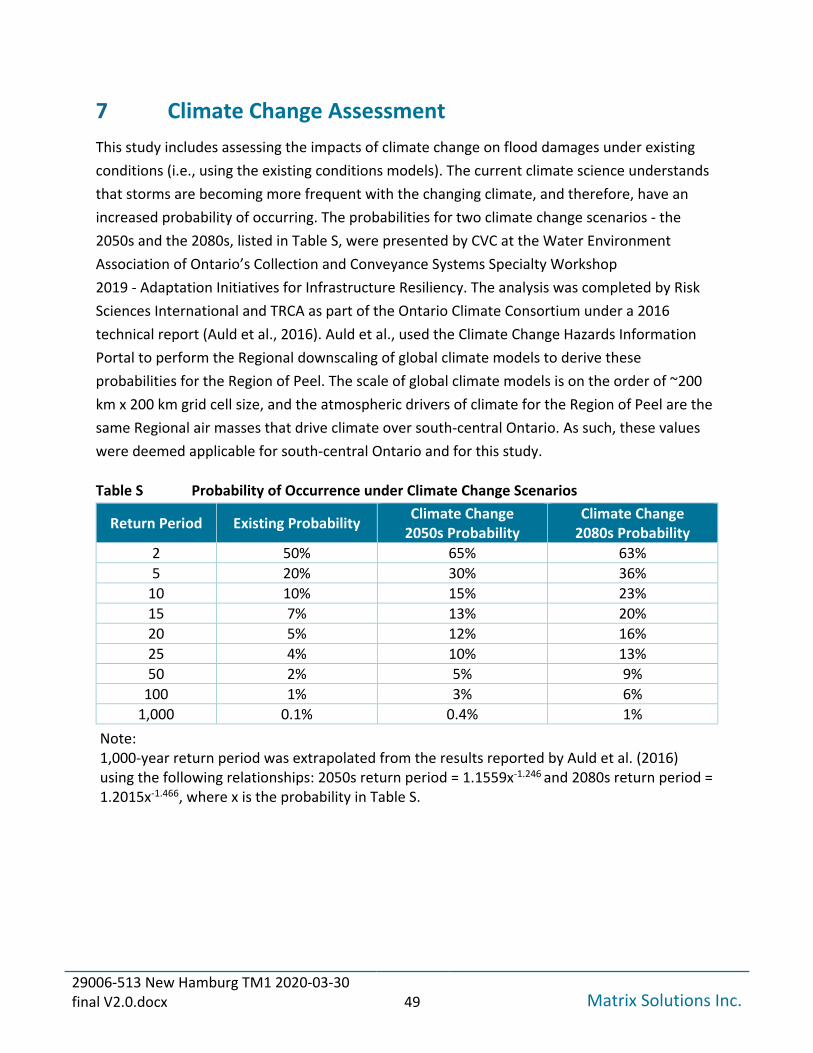
7 Climate Change Assessment This study includes assessing the impacts of climate change on flood damages under existing conditions (i.e., using the existing conditions models). The current climate science understands that storms are becoming more frequent with the changing climate, and therefore, have an increased probability of occurring. The probabilities for two climate change scenarios - the 2050s and the 2080s, listed in Table S, were presented by CVC at the Water Environment Association of Ontario’s Collection and Conveyance Systems Specialty Workshop 2019 - Adaptation Initiatives for Infrastructure Resiliency. The analysis was completed by Risk Sciences International and TRCA as part of the Ontario Climate Consortium under a 2016 technical report (Auld et al., 2016). Auld et al., used the Climate Change Hazards Information Portal to perform the Regional downscaling of global climate models to derive these probabilities for the Region of Peel. The scale of global climate models is on the order of ~200 km x 200 km grid cell size, and the atmospheric drivers of climate for the Region of Peel are the same Regional air masses that drive climate over south-central Ontario. As such, these values were deemed applicable for south-central Ontario and for this study.
Table S Probability of Occurrence under Climate Change Scenarios
Return Period Existing Probability Climate Change 2050s Probability
Note: 1,000-year return period was extrapolated from the results reported by Auld et al. (2016) using the following relationships: 2050s return period = 1.1559x-1.246 and 2080s return period = 1.2015x-1.466, where x is the probability in Table S.
29006-513 New Hamburg TM1 2020-03-30 final V2.0.docx 50 Matrix Solutions Inc.
Using these probabilities, the total damages were plotted on the flood damages probability distribution for the 2050s and 2080s climate change scenarios and existing conditions for reference (Graphic W). The AAD for the 2050s probability distribution ($1.6 million) is 75% higher than under existing conditions. The AAD for the 2080s probability distribution ($2.3 million) is 150% higher than under existing conditions. This analysis was meant to provide a high-level look at potential effects of climate change on AAD in New Hamburg. Even though they are based on the current science, the underlying assumptions and results are highly uncertain (e.g., compounding uncertainties of global climate models, downscaling Regional climate model, local climate conditions, and assumptions in the AAD calculations.)
Graphic W Total Damages and Average Annual Damages with Climate Change Scenarios
29006-513 New Hamburg TM1 2020-03-30 final V2.0.docx 51 Matrix Solutions Inc.
8 Recommendations The objective of the NHFM study flood damages estimate is to provide a basis for comparing potential flood mitigation options. The current assessment achieves this. If, as part of a future study, GRCA is looking to refine the level of detail and accuracy of the flood damage estimate, the following are suggested refinement opportunities:
• Develop unfinished basement contents depth-damage curves to further refine the basement damages estimates.
• Undertake topographic surveys of each property to refine the representative ground surface elevation and lowest opening elevation.
• Complete interior surveys of ICI buildings to determine if basements are present and select an appropriate basement contents curve.
• It is understood that the HEC-RAS model which forms the basis of the flood damage estimates is in draft and will go through peer review in the near future. Once the modelling is finalized, the results should be reviewed, and the flood damage assessment should be revised if necessary.
9 Closure Average annual flood damage estimates were computed for New Hamburg using the most up-to-date depth-damage curves available in Canada indexed for Ontario ($2016), and the draft HEC-RAS model results from GRCA’s updated floodplain mapping and modelling study. Direct and indirect damages were estimated. Intangible damages were considered but were not given a dollar value. Flood damages to infrastructure were considered separately. Climate change scenarios were used to adjust the probability of occurrence for the flood events and compute future climate AAD. The results of this study were used to evaluate the return-on-investment for potential flood mitigation options for New Hamburg (Matrix 2020).
29006-513 New Hamburg TM1 2020-03-30 final V2.0.docx 52 Matrix Solutions Inc.
10 References Acres Ltd. (Acres). 1968. Guidelines for Analysis - Stream Flows, Flood Damage, and Secondary
Flood Control Benefits. Prepared for the Governments of Canada and Ontario, Joint Task Force on Water Conservation Projects in Southern Ontario. August 1968.
AGRA Earth and Environmental Ltd. and IBI Group (Agra Earth and IBI). 1998. City of Medicine Hat Flood Damage Mitigation Study. Prepared for City of Medicine Hat. Medicine Hat, Alberta. 1998.
Auld, H., Switzman, H., Comer, N., Eng, S., Hazen, S., and Milner, G. 2016. Climate Trends and Future Projections in the Region of Peel. Ontario Climate Consortium: Toronto, ON: pp.103. https://climateconnections.ca/app/uploads/2017/07/Climate-Trends-and-Future-Projections-in-the-Region-of-Peel.pdf
Danley’s Garage World (Danley’s). 2019. Average Garage Size: What’s Right for You? https://www.danleysgarageworld.com/average-garage-size/#
Grand River Conservation Authority (GRCA). 2020. New Hamburg Flood Mitigation Study - Flood Damages Survey. Technical memorandum prepared by Janet Ivey, Subwatershed Planning Coordinator. 27 January 2020.
Grand River Implementation Committee (GRIC). 1983. ‘Flood Damages in the Grand River Basin Technical Report No. 39’. Addendum to Grand River Basin Water Management Study Technical Report Series. Cambridge, Ontario. 1983.
IBI Group and ECOS Engineering Services Ltd. (IBI and ECOS). 1984. Drumheller Flood Control Study. Prepared for Alberta Environment and the City of Drumheller. 1984.
IBI Group and ECOS Engineering Services Ltd. (IBI and ECOS). 1982. Phase 2B - Flood Damage Reduction Program - Technical Report. Prepared for Alberta Environment and the City of Fort McMurray. Fort McMurray, Alberta. 1982.
IBI Group (IBI). 2019. Toronto Flood Risk Ranking. Prepared for Toronto and Region Conservation Authority. October 2019.
IBI Group (IBI). 2015a. Provincial Flood Damage Assessment Study. Prepared for Government of Alberta ESRD - Resilience and Mitigation. Calgary, Alberta. February 2015.
29006-513 New Hamburg TM1 2020-03-30 final V2.0.docx 53 Matrix Solutions Inc.
IBI Group (IBI). 2015b. Provincial Flood Damage Assessment Study, City of Calgary: Assessment of Flood Damages. Prepared for Government of Alberta ESRD - Resilience and Mitigation. Calgary, Alberta. February 2015.
Kates R.W. 1965. Industrial Flood Losses: Damage Estimation in the Lehigh Valley. University of Chicago Press. Chicago. 1965. 98-100 pp.
Matrix Solutions Inc. (Matrix). 2020. New Hamburg Flood Mitigation Study, Technical Memorandum #2 - Flood Mitigation Options. Guelph, Ontario. March 2020.
Moudrak, N.; Huter, A.M.; Feltmate, B. 2017. When the Big Storms Hit: The Role of Wetlands to Limit Urban and Rural Flood Damage. Prepared for the Ontario Ministry of Natural Resources and Forestry. Intact Centre on Climate Adaptation, University of Waterloo.
Natural Resources Canada (NRCAN). 2017. Canadian Guidelines and Database of Flood Vulnerability Functions. Addendum to Canadian Floodplain Mapping Guidelines Series. March 2017.
Nichols and Associates Ltd. (Nichols). 1979. Economic Analysis of Fort McMurray Flood Abatement Measures. Prepared for Fort McMurray Technical Committee on Flood Abatement. Fort McMurray, Alberta. 1979.
Philips Planning and Engineering Limited (Philips). 1976. Channel Improvements and Flood Control on the Grand River in Cambridge - Galt. Prepared for the Grand River Conservation Authority. April 1976.
Plato N. (2019), Analyst, Flood Risk Management, Toronto and Region Conservation Authority. Email Communication. October 25, 2019.
Toronto and Region Conservation Authority (TRCA). 2019. Flood Plain Map - Frequently Asked Questions. https://trca.ca/conservation/flood-risk-management/flood-plain-map-viewer/
Water’s Edge Environmental Solutions Team Ltd., W.F. Baird & Associates Coastal Engineers Limited and Planning Solutions Inc., 2007. Flood Damage Estimation Guide. Report for Ontario Ministry of Natural Resources. 2007.
1Disclaimer: The information contained herein may be compiled from numerous third party materials that are subject to periodic changewithout prior notification. While every effort has been made by Matrix Solutions Inc. to ensure the accuracy of the information presentedat the time of publication, Matrix Solutions Inc. assumes no liability for any errors, omissions, or inaccuracies in the third party material.
I:\G
rand
Riv
erC
A\2
9006
\Fig
ures
And
Tabl
es\H
YD
\202
0\C
lient
\TM
2\Fi
gure
-1-S
tudy
_Are
a.m
xd -
Tabl
oid_
L - 1
9-M
ar-2
0, 1
0:22
AM
- lm
wrig
ht -
TID
005
Draft Regional Inundation BoundaryGRCA Owned but Township Managed LandsGRCA Owned and Managed LandsTownship of Wilmot Managed LandsRegion of Waterloo Managed LandsDamExisting DikeExisting Erosion Control WorksRailwayHighwayRoad
Building TypeCommercialIndustrialInstitutionalResidentialNot in Study Area
Shephard Place
Shade Street
Stonecroft Way
James Street
Steinman Street
Asmus Street
Captain
MccallumDrive
Bonaventure Drive
Bleams Road West
Wilmot Street
Good Street
Hamilton Road
Bergey Court
KingStreet
Hillfield
Drive
Jacob Street
Walter Perry Place
Mar
vin
Street
Kettle Lake
Drive
Thimbleberry Crossing
Bleams Court
Arnold Street
Devonshire Drive
Boullee Street
Eby Crescent
Catherine Street
Byro
n St
reet
Jose
ph S
treet
Nithview Drive
Fairv
iew S
treet
Lewis Street
Haysville Road
Rive
rsid
eDr
ive
Angus Glen Lane
Hunter Street
Orchard
Way
Hincks Street
Greenwo od Drive
Webster Street
Victoria Street
Shirefield Lane
Loganville Lane
George Street
Stone Street
Briarstone
Cre
scen
t
DaniellsCrescent
Maurice Street
Perth Street
Neville Street
Grand
view
Aven
ue
Piccadilly Square
UV1
UV3
UV4
UV7
Wat
erlo
o St
reet
Huron
Stre
et
Peel Street
Walker Road
Union Street
Milton Street
Mill StreetGrace Street
Highway7/8 Bridge
Pedestrian Bridge
HuronStreet(Hartman) Bridge
ShadeStreetBridge
Rail Bridge
522000
522000
522450
522450
522900
522900
523350
523350
523800
523800
524250
524250
524700
524700
4801
500
4801
500
4801
950
4801
950
4802
400
4802
400
4802
850
4802
850
4803
300
4803
300
NAD 1983 UTM Zone 17N
W
Figure
Study Area
Grand River Conservation AuthorityNew Hamburg Flood Mitigation Study
Easting (m)
Nor
thin
g (m
)
100 0 100 200
metres
Date: Project: Reviewer:Submitter:March 2020 29006 K. HofbauerS. Blue
1:10,000
Reference: Contains information licensed under the Open Government Licence –Ontario. Imagery (2015) obtained by Grand River Conservation Authority and MatrixSolutions Inc. used under license.
2Disclaimer: The information contained herein may be compiled from numerous third party materials that are subject to periodic changewithout prior notification. While every effort has been made by Matrix Solutions Inc. to ensure the accuracy of the information presentedat the time of publication, Matrix Solutions Inc. assumes no liability for any errors, omissions, or inaccuracies in the third party material.
I:\G
rand
Riv
erC
A\2
9006
\Fig
ures
And
Tabl
es\H
YD
\202
0\C
lient
\TM
2\Fi
gure
-7-X
-Exi
stin
g_C
ondi
tions
_Inu
ndat
ed_B
uild
ings
.mxd
- Ta
bloi
d_L
- 19-
Mar
-20,
10:
50 A
M -
lmw
right
- TI
D00
5
Draft Regional Inundation BoundaryRailwayHighwayRoadBuilding - Not FloodedBuilding - Not in Study Area
Flood Depth (m) Relative to First Floor Elevation< -1.0-1.0 to -0.50-0.50 to 0.00.0 to 0.500.50 to 1.0> 1.0
Water Surface Elevation (masl)High : 338.6
Low : 328.4
Huro
n St
reet
Wat
erlo
o St
reet
Peel Street
UV3
UV1
UV7
UV4
522000
522000
522450
522450
522900
522900
523350
523350
523800
523800
524250
524250
4801
500
4801
500
4801
950
4801
950
4802
400
4802
400
4802
850
4802
850
4803
300
4803
300
NAD 1983 UTM Zone 17N
W
Figure
Existing - Inundated Buildings -2 Year (179 m3/s)
Grand River Conservation AuthorityNew Hamburg Flood Mitigation Study
Easting (m)
Nor
thin
g (m
)
100 0 100 200
metres
Date: Project: Reviewer:Submitter:March 2020 29006 K. HofbauerS. Blue
1:9,000
Vertical Datum: CGVD2013Reference: Contains information licensed under the Open Government Licence –Ontario. Imagery (2015) obtained by Grand River Conservation Authority and MatrixSolutions Inc. used under license.
³
3Disclaimer: The information contained herein may be compiled from numerous third party materials that are subject to periodic changewithout prior notification. While every effort has been made by Matrix Solutions Inc. to ensure the accuracy of the information presentedat the time of publication, Matrix Solutions Inc. assumes no liability for any errors, omissions, or inaccuracies in the third party material.
I:\G
rand
Riv
erC
A\2
9006
\Fig
ures
And
Tabl
es\H
YD
\202
0\C
lient
\TM
2\Fi
gure
-7-X
-Exi
stin
g_C
ondi
tions
_Inu
ndat
ed_B
uild
ings
.mxd
- Ta
bloi
d_L
- 19-
Mar
-20,
10:
50 A
M -
lmw
right
- TI
D00
5
Draft Regional Inundation BoundaryRailwayHighwayRoadBuilding - Not FloodedBuilding - Not in Study Area
Flood Depth (m) Relative to First Floor Elevation< -1.0-1.0 to -0.50-0.50 to 0.00.0 to 0.500.50 to 1.0> 1.0
Water Surface Elevation (masl)High : 338.6
Low : 328.4
Huro
n St
reet
Wat
erlo
o St
reet
Peel Street
UV3
UV1
UV7
UV4
522000
522000
522450
522450
522900
522900
523350
523350
523800
523800
524250
524250
4801
500
4801
500
4801
950
4801
950
4802
400
4802
400
4802
850
4802
850
4803
300
4803
300
NAD 1983 UTM Zone 17N
W
Figure
Existing - Inundated Buildings -5 Year (265 m3/s)
Grand River Conservation AuthorityNew Hamburg Flood Mitigation Study
Easting (m)
Nor
thin
g (m
)
100 0 100 200
metres
Date: Project: Reviewer:Submitter:March 2020 29006 K. HofbauerS. Blue
1:9,000
Vertical Datum: CGVD2013Reference: Contains information licensed under the Open Government Licence –Ontario. Imagery (2015) obtained by Grand River Conservation Authority and MatrixSolutions Inc. used under license.
³
4Disclaimer: The information contained herein may be compiled from numerous third party materials that are subject to periodic changewithout prior notification. While every effort has been made by Matrix Solutions Inc. to ensure the accuracy of the information presentedat the time of publication, Matrix Solutions Inc. assumes no liability for any errors, omissions, or inaccuracies in the third party material.
I:\G
rand
Riv
erC
A\2
9006
\Fig
ures
And
Tabl
es\H
YD
\202
0\C
lient
\TM
2\Fi
gure
-7-X
-Exi
stin
g_C
ondi
tions
_Inu
ndat
ed_B
uild
ings
.mxd
- Ta
bloi
d_L
- 19-
Mar
-20,
10:
51 A
M -
lmw
right
- TI
D00
5
Draft Regional Inundation BoundaryRailwayHighwayRoadBuilding - Not FloodedBuilding - Not in Study Area
Flood Depth (m) Relative to First Floor Elevation< -1.0-1.0 to -0.50-0.50 to 0.00.0 to 0.500.50 to 1.0> 1.0
Water Surface Elevation (masl)High : 338.6
Low : 328.4
Huro
n St
reet
Wat
erlo
o St
reet
Peel Street
UV3
UV1
UV7
UV4
522000
522000
522450
522450
522900
522900
523350
523350
523800
523800
524250
524250
4801
500
4801
500
4801
950
4801
950
4802
400
4802
400
4802
850
4802
850
4803
300
4803
300
NAD 1983 UTM Zone 17N
W
Figure
Existing - Inundated Buildings -10 Year (322 m3/s)
Grand River Conservation AuthorityNew Hamburg Flood Mitigation Study
Easting (m)
Nor
thin
g (m
)
100 0 100 200
metres
Date: Project: Reviewer:Submitter:March 2020 29006 K. HofbauerS. Blue
1:9,000
Vertical Datum: CGVD2013Reference: Contains information licensed under the Open Government Licence –Ontario. Imagery (2015) obtained by Grand River Conservation Authority and MatrixSolutions Inc. used under license.
³
5Disclaimer: The information contained herein may be compiled from numerous third party materials that are subject to periodic changewithout prior notification. While every effort has been made by Matrix Solutions Inc. to ensure the accuracy of the information presentedat the time of publication, Matrix Solutions Inc. assumes no liability for any errors, omissions, or inaccuracies in the third party material.
I:\G
rand
Riv
erC
A\2
9006
\Fig
ures
And
Tabl
es\H
YD
\202
0\C
lient
\TM
2\Fi
gure
-7-X
-Exi
stin
g_C
ondi
tions
_Inu
ndat
ed_B
uild
ings
.mxd
- Ta
bloi
d_L
- 19-
Mar
-20,
10:
51 A
M -
lmw
right
- TI
D00
5
Draft Regional Inundation BoundaryRailwayHighwayRoadBuilding - Not FloodedBuilding - Not in Study Area
Flood Depth (m) Relative to First Floor Elevation< -1.0-1.0 to -0.50-0.50 to 0.00.0 to 0.500.50 to 1.0> 1.0
Water Surface Elevation (masl)High : 338.6
Low : 328.4
Huro
n St
reet
Wat
erlo
o St
reet
Peel Street
UV3
UV1
UV7
UV4
522000
522000
522450
522450
522900
522900
523350
523350
523800
523800
524250
524250
4801
500
4801
500
4801
950
4801
950
4802
400
4802
400
4802
850
4802
850
4803
300
4803
300
NAD 1983 UTM Zone 17N
W
Figure
Existing - Inundated Buildings -15 Year (350 m3/s)
Grand River Conservation AuthorityNew Hamburg Flood Mitigation Study
Easting (m)
Nor
thin
g (m
)
100 0 100 200
metres
Date: Project: Reviewer:Submitter:March 2020 29006 K. HofbauerS. Blue
1:9,000
Vertical Datum: CGVD2013Reference: Contains information licensed under the Open Government Licence –Ontario. Imagery (2015) obtained by Grand River Conservation Authority and MatrixSolutions Inc. used under license.
³
6Disclaimer: The information contained herein may be compiled from numerous third party materials that are subject to periodic changewithout prior notification. While every effort has been made by Matrix Solutions Inc. to ensure the accuracy of the information presentedat the time of publication, Matrix Solutions Inc. assumes no liability for any errors, omissions, or inaccuracies in the third party material.
I:\G
rand
Riv
erC
A\2
9006
\Fig
ures
And
Tabl
es\H
YD
\202
0\C
lient
\TM
2\Fi
gure
-7-X
-Exi
stin
g_C
ondi
tions
_Inu
ndat
ed_B
uild
ings
.mxd
- Ta
bloi
d_L
- 19-
Mar
-20,
10:
51 A
M -
lmw
right
- TI
D00
5
Draft Regional Inundation BoundaryRailwayHighwayRoadBuilding - Not FloodedBuilding - Not in Study Area
Flood Depth (m) Relative to First Floor Elevation< -1.0-1.0 to -0.50-0.50 to 0.00.0 to 0.500.50 to 1.0> 1.0
Water Surface Elevation (masl)High : 338.6
Low : 328.4
Huro
n St
reet
Wat
erlo
o St
reet
Peel Street
UV3
UV1
UV7
UV4
522000
522000
522450
522450
522900
522900
523350
523350
523800
523800
524250
524250
4801
500
4801
500
4801
950
4801
950
4802
400
4802
400
4802
850
4802
850
4803
300
4803
300
NAD 1983 UTM Zone 17N
W
Figure
Existing - Inundated Buildings -20 Year (377 m3/s)
Grand River Conservation AuthorityNew Hamburg Flood Mitigation Study
Easting (m)
Nor
thin
g (m
)
100 0 100 200
metres
Date: Project: Reviewer:Submitter:March 2020 29006 K. HofbauerS. Blue
1:9,000
Vertical Datum: CGVD2013Reference: Contains information licensed under the Open Government Licence –Ontario. Imagery (2015) obtained by Grand River Conservation Authority and MatrixSolutions Inc. used under license.
³
7Disclaimer: The information contained herein may be compiled from numerous third party materials that are subject to periodic changewithout prior notification. While every effort has been made by Matrix Solutions Inc. to ensure the accuracy of the information presentedat the time of publication, Matrix Solutions Inc. assumes no liability for any errors, omissions, or inaccuracies in the third party material.
I:\G
rand
Riv
erC
A\2
9006
\Fig
ures
And
Tabl
es\H
YD
\202
0\C
lient
\TM
2\Fi
gure
-7-X
-Exi
stin
g_C
ondi
tions
_Inu
ndat
ed_B
uild
ings
.mxd
- Ta
bloi
d_L
- 19-
Mar
-20,
10:
51 A
M -
lmw
right
- TI
D00
5
Draft Regional Inundation BoundaryRailwayHighwayRoadBuilding - Not FloodedBuilding - Not in Study Area
Flood Depth (m) Relative to First Floor Elevation< -1.0-1.0 to -0.50-0.50 to 0.00.0 to 0.500.50 to 1.0> 1.0
Water Surface Elevation (masl)High : 338.6
Low : 328.4
Huro
n St
reet
Wat
erlo
o St
reet
Peel Street
UV3
UV1
UV7
UV4
522000
522000
522450
522450
522900
522900
523350
523350
523800
523800
524250
524250
4801
500
4801
500
4801
950
4801
950
4802
400
4802
400
4802
850
4802
850
4803
300
4803
300
NAD 1983 UTM Zone 17N
W
Figure
Existing - Inundated Buildings -25 Year (394 m3/s)
Grand River Conservation AuthorityNew Hamburg Flood Mitigation Study
Easting (m)
Nor
thin
g (m
)
100 0 100 200
metres
Date: Project: Reviewer:Submitter:March 2020 29006 K. HofbauerS. Blue
1:9,000
Vertical Datum: CGVD2013Reference: Contains information licensed under the Open Government Licence –Ontario. Imagery (2015) obtained by Grand River Conservation Authority and MatrixSolutions Inc. used under license.
³
8Disclaimer: The information contained herein may be compiled from numerous third party materials that are subject to periodic changewithout prior notification. While every effort has been made by Matrix Solutions Inc. to ensure the accuracy of the information presentedat the time of publication, Matrix Solutions Inc. assumes no liability for any errors, omissions, or inaccuracies in the third party material.
I:\G
rand
Riv
erC
A\2
9006
\Fig
ures
And
Tabl
es\H
YD
\202
0\C
lient
\TM
2\Fi
gure
-7-X
-Exi
stin
g_C
ondi
tions
_Inu
ndat
ed_B
uild
ings
.mxd
- Ta
bloi
d_L
- 19-
Mar
-20,
10:
51 A
M -
lmw
right
- TI
D00
5
Draft Regional Inundation BoundaryRailwayHighwayRoadBuilding - Not FloodedBuilding - Not in Study Area
Flood Depth (m) Relative to First Floor Elevation< -1.0-1.0 to -0.50-0.50 to 0.00.0 to 0.500.50 to 1.0> 1.0
Water Surface Elevation (masl)High : 338.6
Low : 328.4
Huro
n St
reet
Wat
erlo
o St
reet
Peel Street
UV3
UV1
UV7
UV4
522000
522000
522450
522450
522900
522900
523350
523350
523800
523800
524250
524250
4801
500
4801
500
4801
950
4801
950
4802
400
4802
400
4802
850
4802
850
4803
300
4803
300
NAD 1983 UTM Zone 17N
W
Figure
Existing - Inundated Buildings -50 Year (447 m3/s)
Grand River Conservation AuthorityNew Hamburg Flood Mitigation Study
Easting (m)
Nor
thin
g (m
)
100 0 100 200
metres
Date: Project: Reviewer:Submitter:March 2020 29006 K. HofbauerS. Blue
1:9,000
Vertical Datum: CGVD2013Reference: Contains information licensed under the Open Government Licence –Ontario. Imagery (2015) obtained by Grand River Conservation Authority and MatrixSolutions Inc. used under license.
³
9Disclaimer: The information contained herein may be compiled from numerous third party materials that are subject to periodic changewithout prior notification. While every effort has been made by Matrix Solutions Inc. to ensure the accuracy of the information presentedat the time of publication, Matrix Solutions Inc. assumes no liability for any errors, omissions, or inaccuracies in the third party material.
I:\G
rand
Riv
erC
A\2
9006
\Fig
ures
And
Tabl
es\H
YD
\202
0\C
lient
\TM
2\Fi
gure
-7-X
-Exi
stin
g_C
ondi
tions
_Inu
ndat
ed_B
uild
ings
.mxd
- Ta
bloi
d_L
- 19-
Mar
-20,
10:
52 A
M -
lmw
right
- TI
D00
5
Draft Regional Inundation BoundaryRailwayHighwayRoadBuilding - Not FloodedBuilding - Not in Study Area
Flood Depth (m) Relative to First Floor Elevation< -1.0-1.0 to -0.50-0.50 to 0.00.0 to 0.500.50 to 1.0> 1.0
Water Surface Elevation (masl)High : 338.6
Low : 328.4
Huro
n St
reet
Wat
erlo
o St
reet
Peel Street
UV3
UV1
UV7
UV4
522000
522000
522450
522450
522900
522900
523350
523350
523800
523800
524250
524250
4801
500
4801
500
4801
950
4801
950
4802
400
4802
400
4802
850
4802
850
4803
300
4803
300
NAD 1983 UTM Zone 17N
W
Figure
Existing - Inundated Buildings -100 Year (500 m3/s)
Grand River Conservation AuthorityNew Hamburg Flood Mitigation Study
Easting (m)
Nor
thin
g (m
)
100 0 100 200
metres
Date: Project: Reviewer:Submitter:March 2020 29006 K. HofbauerS. Blue
1:9,000
Vertical Datum: CGVD2013Reference: Contains information licensed under the Open Government Licence –Ontario. Imagery (2015) obtained by Grand River Conservation Authority and MatrixSolutions Inc. used under license.
³
10Disclaimer: The information contained herein may be compiled from numerous third party materials that are subject to periodic changewithout prior notification. While every effort has been made by Matrix Solutions Inc. to ensure the accuracy of the information presentedat the time of publication, Matrix Solutions Inc. assumes no liability for any errors, omissions, or inaccuracies in the third party material.
I:\G
rand
Riv
erC
A\2
9006
\Fig
ures
And
Tabl
es\H
YD
\202
0\C
lient
\TM
2\Fi
gure
-7-X
-Exi
stin
g_C
ondi
tions
_Inu
ndat
ed_B
uild
ings
.mxd
- Ta
bloi
d_L
- 19-
Mar
-20,
10:
52 A
M -
lmw
right
- TI
D00
5
Draft Regional Inundation BoundaryRailwayHighwayRoadBuilding - Not FloodedBuilding - Not in Study Area
Flood Depth (m) Relative to First Floor Elevation< -1.0-1.0 to -0.50-0.50 to 0.00.0 to 0.500.50 to 1.0> 1.0
Grand River Conservation AuthorityNew Hamburg Flood Mitigation Study
Easting (m)
Nor
thin
g (m
)
100 0 100 200
metres
Date: Project: Reviewer:Submitter:March 2020 29006 K. HofbauerS. Blue
1:9,000
Vertical Datum: CGVD2013Reference: Contains information licensed under the Open Government Licence –Ontario. Imagery (2015) obtained by Grand River Conservation Authority and MatrixSolutions Inc. used under license.
³
11Disclaimer: The information contained herein may be compiled from numerous third party materials that are subject to periodic changewithout prior notification. While every effort has been made by Matrix Solutions Inc. to ensure the accuracy of the information presentedat the time of publication, Matrix Solutions Inc. assumes no liability for any errors, omissions, or inaccuracies in the third party material.
I:\G
rand
Riv
erC
A\2
9006
\Fig
ures
And
Tabl
es\H
YD
\202
0\C
lient
\TM
2\Fi
gure
-19-
X-E
xist
ing_
Con
ditio
ns_F
lood
_Dam
ages
.mxd
- Ta
bloi
d_L
- 19-
Mar
-20,
11:
23 A
M -
lmw
right
- TI
D00
5
Draft Regional Inundation BoundaryRailwayHighwayRoadBuilding - Not FloodedBuilding - Not in Study Area
Total Damage ($) - See Note0.0 - 100,000100,000 - 150,000150,000 - 200,000200,000 - 500,000500,000 +
Water Surface Elevation (masl)High : 338.6
Low : 328.4
Huro
n St
reet
Wat
erlo
o St
reet
Peel Street
UV3
UV1
UV7
UV4
522000
522000
522450
522450
522900
522900
523350
523350
523800
523800
524250
524250
4801
500
4801
500
4801
950
4801
950
4802
400
4802
400
4802
850
4802
850
4803
300
4803
300
NAD 1983 UTM Zone 17N
W
Figure
Existing - Flood Damages -2 Year (179 m3/s)
Grand River Conservation AuthorityNew Hamburg Flood Mitigation Study
Easting (m)
Nor
thin
g (m
)
100 0 100 200
metres
Date: Project: Reviewer:Submitter:March 2020 29006 K. HofbauerS. Blue
1:9,000
Note: Total damage estimate includes direct and indirectdamages, and do not include damages to publicinfrastructure (roads, bridges, etc.)
Vertical Datum: CGVD2013Reference: Contains information licensed under the Open Government Licence –Ontario. Imagery (2015) obtained by Grand River Conservation Authority and MatrixSolutions Inc. used under license.
12Disclaimer: The information contained herein may be compiled from numerous third party materials that are subject to periodic changewithout prior notification. While every effort has been made by Matrix Solutions Inc. to ensure the accuracy of the information presentedat the time of publication, Matrix Solutions Inc. assumes no liability for any errors, omissions, or inaccuracies in the third party material.
I:\G
rand
Riv
erC
A\2
9006
\Fig
ures
And
Tabl
es\H
YD
\202
0\C
lient
\TM
2\Fi
gure
-19-
X-E
xist
ing_
Con
ditio
ns_F
lood
_Dam
ages
.mxd
- Ta
bloi
d_L
- 19-
Mar
-20,
11:
23 A
M -
lmw
right
- TI
D00
5
Draft Regional Inundation BoundaryRailwayHighwayRoadBuilding - Not FloodedBuilding - Not in Study Area
Total Damage ($) - See Note0.0 - 100,000100,000 - 150,000150,000 - 200,000200,000 - 500,000500,000 +
Water Surface Elevation (masl)High : 338.6
Low : 328.4
Huro
n St
reet
Wat
erlo
o St
reet
Peel Street
UV3
UV1
UV7
UV4
522000
522000
522450
522450
522900
522900
523350
523350
523800
523800
524250
524250
4801
500
4801
500
4801
950
4801
950
4802
400
4802
400
4802
850
4802
850
4803
300
4803
300
NAD 1983 UTM Zone 17N
W
Figure
Existing - Flood Damages -5 Year (265 m3/s)
Grand River Conservation AuthorityNew Hamburg Flood Mitigation Study
Easting (m)
Nor
thin
g (m
)
100 0 100 200
metres
Date: Project: Reviewer:Submitter:March 2020 29006 K. HofbauerS. Blue
1:9,000
Note: Total damage estimate includes direct and indirectdamages, and do not include damages to publicinfrastructure (roads, bridges, etc.)
Vertical Datum: CGVD2013Reference: Contains information licensed under the Open Government Licence –Ontario. Imagery (2015) obtained by Grand River Conservation Authority and MatrixSolutions Inc. used under license.
13Disclaimer: The information contained herein may be compiled from numerous third party materials that are subject to periodic changewithout prior notification. While every effort has been made by Matrix Solutions Inc. to ensure the accuracy of the information presentedat the time of publication, Matrix Solutions Inc. assumes no liability for any errors, omissions, or inaccuracies in the third party material.
I:\G
rand
Riv
erC
A\2
9006
\Fig
ures
And
Tabl
es\H
YD
\202
0\C
lient
\TM
2\Fi
gure
-19-
X-E
xist
ing_
Con
ditio
ns_F
lood
_Dam
ages
.mxd
- Ta
bloi
d_L
- 19-
Mar
-20,
11:
23 A
M -
lmw
right
- TI
D00
5
Draft Regional Inundation BoundaryRailwayHighwayRoadBuilding - Not FloodedBuilding - Not in Study Area
Total Damage ($) - See Note0.0 - 100,000100,000 - 150,000150,000 - 200,000200,000 - 500,000500,000 +
Water Surface Elevation (masl)High : 338.6
Low : 328.4
Huro
n St
reet
Wat
erlo
o St
reet
Peel Street
UV3
UV1
UV7
UV4
522000
522000
522450
522450
522900
522900
523350
523350
523800
523800
524250
524250
4801
500
4801
500
4801
950
4801
950
4802
400
4802
400
4802
850
4802
850
4803
300
4803
300
NAD 1983 UTM Zone 17N
W
Figure
Existing - Flood Damages -10 Year (322 m3/s)
Grand River Conservation AuthorityNew Hamburg Flood Mitigation Study
Easting (m)
Nor
thin
g (m
)
100 0 100 200
metres
Date: Project: Reviewer:Submitter:March 2020 29006 K. HofbauerS. Blue
1:9,000
Note: Total damage estimate includes direct and indirectdamages, and do not include damages to publicinfrastructure (roads, bridges, etc.)
Vertical Datum: CGVD2013Reference: Contains information licensed under the Open Government Licence –Ontario. Imagery (2015) obtained by Grand River Conservation Authority and MatrixSolutions Inc. used under license.
14Disclaimer: The information contained herein may be compiled from numerous third party materials that are subject to periodic changewithout prior notification. While every effort has been made by Matrix Solutions Inc. to ensure the accuracy of the information presentedat the time of publication, Matrix Solutions Inc. assumes no liability for any errors, omissions, or inaccuracies in the third party material.
I:\G
rand
Riv
erC
A\2
9006
\Fig
ures
And
Tabl
es\H
YD
\202
0\C
lient
\TM
2\Fi
gure
-19-
X-E
xist
ing_
Con
ditio
ns_F
lood
_Dam
ages
.mxd
- Ta
bloi
d_L
- 19-
Mar
-20,
11:
23 A
M -
lmw
right
- TI
D00
5
Draft Regional Inundation BoundaryRailwayHighwayRoadBuilding - Not FloodedBuilding - Not in Study Area
Total Damage ($) - See Note0.0 - 100,000100,000 - 150,000150,000 - 200,000200,000 - 500,000500,000 +
Water Surface Elevation (masl)High : 338.6
Low : 328.4
Huro
n St
reet
Wat
erlo
o St
reet
Peel Street
UV3
UV1
UV7
UV4
522000
522000
522450
522450
522900
522900
523350
523350
523800
523800
524250
524250
4801
500
4801
500
4801
950
4801
950
4802
400
4802
400
4802
850
4802
850
4803
300
4803
300
NAD 1983 UTM Zone 17N
W
Figure
Existing - Flood Damages -15 Year (350 m3/s)
Grand River Conservation AuthorityNew Hamburg Flood Mitigation Study
Easting (m)
Nor
thin
g (m
)
100 0 100 200
metres
Date: Project: Reviewer:Submitter:March 2020 29006 K. HofbauerS. Blue
1:9,000
Note: Total damage estimate includes direct and indirectdamages, and do not include damages to publicinfrastructure (roads, bridges, etc.)
Vertical Datum: CGVD2013Reference: Contains information licensed under the Open Government Licence –Ontario. Imagery (2015) obtained by Grand River Conservation Authority and MatrixSolutions Inc. used under license.
15Disclaimer: The information contained herein may be compiled from numerous third party materials that are subject to periodic changewithout prior notification. While every effort has been made by Matrix Solutions Inc. to ensure the accuracy of the information presentedat the time of publication, Matrix Solutions Inc. assumes no liability for any errors, omissions, or inaccuracies in the third party material.
I:\G
rand
Riv
erC
A\2
9006
\Fig
ures
And
Tabl
es\H
YD
\202
0\C
lient
\TM
2\Fi
gure
-19-
X-E
xist
ing_
Con
ditio
ns_F
lood
_Dam
ages
.mxd
- Ta
bloi
d_L
- 19-
Mar
-20,
11:
23 A
M -
lmw
right
- TI
D00
5
Draft Regional Inundation BoundaryRailwayHighwayRoadBuilding - Not FloodedBuilding - Not in Study Area
Total Damage ($) - See Note0.0 - 100,000100,000 - 150,000150,000 - 200,000200,000 - 500,000500,000 +
Water Surface Elevation (masl)High : 338.6
Low : 328.4
Huro
n St
reet
Wat
erlo
o St
reet
Peel Street
UV3
UV1
UV7
UV4
522000
522000
522450
522450
522900
522900
523350
523350
523800
523800
524250
524250
4801
500
4801
500
4801
950
4801
950
4802
400
4802
400
4802
850
4802
850
4803
300
4803
300
NAD 1983 UTM Zone 17N
W
Figure
Existing - Flood Damages -20 Year (377 m3/s)
Grand River Conservation AuthorityNew Hamburg Flood Mitigation Study
Easting (m)
Nor
thin
g (m
)
100 0 100 200
metres
Date: Project: Reviewer:Submitter:March 2020 29006 K. HofbauerS. Blue
1:9,000
Note: Total damage estimate includes direct and indirectdamages, and do not include damages to publicinfrastructure (roads, bridges, etc.)
Vertical Datum: CGVD2013Reference: Contains information licensed under the Open Government Licence –Ontario. Imagery (2015) obtained by Grand River Conservation Authority and MatrixSolutions Inc. used under license.
16Disclaimer: The information contained herein may be compiled from numerous third party materials that are subject to periodic changewithout prior notification. While every effort has been made by Matrix Solutions Inc. to ensure the accuracy of the information presentedat the time of publication, Matrix Solutions Inc. assumes no liability for any errors, omissions, or inaccuracies in the third party material.
I:\G
rand
Riv
erC
A\2
9006
\Fig
ures
And
Tabl
es\H
YD
\202
0\C
lient
\TM
2\Fi
gure
-19-
X-E
xist
ing_
Con
ditio
ns_F
lood
_Dam
ages
.mxd
- Ta
bloi
d_L
- 19-
Mar
-20,
11:
24 A
M -
lmw
right
- TI
D00
5
Draft Regional Inundation BoundaryRailwayHighwayRoadBuilding - Not FloodedBuilding - Not in Study Area
Total Damage ($) - See Note0.0 - 100,000100,000 - 150,000150,000 - 200,000200,000 - 500,000500,000 +
Water Surface Elevation (masl)High : 338.6
Low : 328.4
Huro
n St
reet
Wat
erlo
o St
reet
Peel Street
UV3
UV1
UV7
UV4
522000
522000
522450
522450
522900
522900
523350
523350
523800
523800
524250
524250
4801
500
4801
500
4801
950
4801
950
4802
400
4802
400
4802
850
4802
850
4803
300
4803
300
NAD 1983 UTM Zone 17N
W
Figure
Existing - Flood Damages -25 Year (394 m3/s)
Grand River Conservation AuthorityNew Hamburg Flood Mitigation Study
Easting (m)
Nor
thin
g (m
)
100 0 100 200
metres
Date: Project: Reviewer:Submitter:March 2020 29006 K. HofbauerS. Blue
1:9,000
Note: Total damage estimate includes direct and indirectdamages, and do not include damages to publicinfrastructure (roads, bridges, etc.)
Vertical Datum: CGVD2013Reference: Contains information licensed under the Open Government Licence –Ontario. Imagery (2015) obtained by Grand River Conservation Authority and MatrixSolutions Inc. used under license.
17Disclaimer: The information contained herein may be compiled from numerous third party materials that are subject to periodic changewithout prior notification. While every effort has been made by Matrix Solutions Inc. to ensure the accuracy of the information presentedat the time of publication, Matrix Solutions Inc. assumes no liability for any errors, omissions, or inaccuracies in the third party material.
I:\G
rand
Riv
erC
A\2
9006
\Fig
ures
And
Tabl
es\H
YD
\202
0\C
lient
\TM
2\Fi
gure
-19-
X-E
xist
ing_
Con
ditio
ns_F
lood
_Dam
ages
.mxd
- Ta
bloi
d_L
- 19-
Mar
-20,
11:
24 A
M -
lmw
right
- TI
D00
5
Draft Regional Inundation BoundaryRailwayHighwayRoadBuilding - Not FloodedBuilding - Not in Study Area
Total Damage ($) - See Note0.0 - 100,000100,000 - 150,000150,000 - 200,000200,000 - 500,000500,000 +
Water Surface Elevation (masl)High : 338.6
Low : 328.4
Huro
n St
reet
Wat
erlo
o St
reet
Peel Street
UV3
UV1
UV7
UV4
522000
522000
522450
522450
522900
522900
523350
523350
523800
523800
524250
524250
4801
500
4801
500
4801
950
4801
950
4802
400
4802
400
4802
850
4802
850
4803
300
4803
300
NAD 1983 UTM Zone 17N
W
Figure
Existing - Flood Damages -50 Year (447 m3/s)
Grand River Conservation AuthorityNew Hamburg Flood Mitigation Study
Easting (m)
Nor
thin
g (m
)
100 0 100 200
metres
Date: Project: Reviewer:Submitter:March 2020 29006 K. HofbauerS. Blue
1:9,000
Note: Total damage estimate includes direct and indirectdamages, and do not include damages to publicinfrastructure (roads, bridges, etc.)
Vertical Datum: CGVD2013Reference: Contains information licensed under the Open Government Licence –Ontario. Imagery (2015) obtained by Grand River Conservation Authority and MatrixSolutions Inc. used under license.
18Disclaimer: The information contained herein may be compiled from numerous third party materials that are subject to periodic changewithout prior notification. While every effort has been made by Matrix Solutions Inc. to ensure the accuracy of the information presentedat the time of publication, Matrix Solutions Inc. assumes no liability for any errors, omissions, or inaccuracies in the third party material.
I:\G
rand
Riv
erC
A\2
9006
\Fig
ures
And
Tabl
es\H
YD
\202
0\C
lient
\TM
2\Fi
gure
-19-
X-E
xist
ing_
Con
ditio
ns_F
lood
_Dam
ages
.mxd
- Ta
bloi
d_L
- 19-
Mar
-20,
11:
24 A
M -
lmw
right
- TI
D00
5
Draft Regional Inundation BoundaryRailwayHighwayRoadBuilding - Not FloodedBuilding - Not in Study Area
Total Damage ($) - See Note0.0 - 100,000100,000 - 150,000150,000 - 200,000200,000 - 500,000500,000 +
Water Surface Elevation (masl)High : 338.6
Low : 328.4
Huro
n St
reet
Wat
erlo
o St
reet
Peel Street
UV3
UV1
UV7
UV4
522000
522000
522450
522450
522900
522900
523350
523350
523800
523800
524250
524250
4801
500
4801
500
4801
950
4801
950
4802
400
4802
400
4802
850
4802
850
4803
300
4803
300
NAD 1983 UTM Zone 17N
W
Figure
Existing - Flood Damages -100 Year (500 m3/s)
Grand River Conservation AuthorityNew Hamburg Flood Mitigation Study
Easting (m)
Nor
thin
g (m
)
100 0 100 200
metres
Date: Project: Reviewer:Submitter:March 2020 29006 K. HofbauerS. Blue
1:9,000
Note: Total damage estimate includes direct and indirectdamages, and do not include damages to publicinfrastructure (roads, bridges, etc.)
Vertical Datum: CGVD2013Reference: Contains information licensed under the Open Government Licence –Ontario. Imagery (2015) obtained by Grand River Conservation Authority and MatrixSolutions Inc. used under license.
19Disclaimer: The information contained herein may be compiled from numerous third party materials that are subject to periodic changewithout prior notification. While every effort has been made by Matrix Solutions Inc. to ensure the accuracy of the information presentedat the time of publication, Matrix Solutions Inc. assumes no liability for any errors, omissions, or inaccuracies in the third party material.
I:\G
rand
Riv
erC
A\2
9006
\Fig
ures
And
Tabl
es\H
YD
\202
0\C
lient
\TM
2\Fi
gure
-19-
X-E
xist
ing_
Con
ditio
ns_F
lood
_Dam
ages
.mxd
- Ta
bloi
d_L
- 19-
Mar
-20,
11:
24 A
M -
lmw
right
- TI
D00
5
Draft Regional Inundation BoundaryRailwayHighwayRoadBuilding - Not FloodedBuilding - Not in Study Area
Total Damage ($) - See Note0.0 - 100,000100,000 - 150,000150,000 - 200,000200,000 - 500,000500,000 +
Water Surface Elevation (masl)High : 338.6
Low : 328.4
Huro
n St
reet
Wat
erlo
o St
reet
Peel Street
UV3
UV1
UV7
UV4
522000
522000
522450
522450
522900
522900
523350
523350
523800
523800
524250
524250
4801
500
4801
500
4801
950
4801
950
4802
400
4802
400
4802
850
4802
850
4803
300
4803
300
NAD 1983 UTM Zone 17N
W
Figure
Existing - Flood Damages -Regional (1,011 m3/s)
Grand River Conservation AuthorityNew Hamburg Flood Mitigation Study
Easting (m)
Nor
thin
g (m
)
100 0 100 200
metres
Date: Project: Reviewer:Submitter:March 2020 29006 K. HofbauerS. Blue
1:9,000
Note: Total damage estimate includes direct and indirectdamages, and do not include damages to publicinfrastructure (roads, bridges, etc.)
Vertical Datum: CGVD2013Reference: Contains information licensed under the Open Government Licence –Ontario. Imagery (2015) obtained by Grand River Conservation Authority and MatrixSolutions Inc. used under license.
Appendix A Table Schema
Appendix A - Overview of Data Tables
Table # Table Filename Contents Usage
A1 Building building_table.csv All building attributes Python Input
A2 Water Elevations water_elevations_table.csv Stores hydraulic model results. Flood elevations for all storms and scenarios. Python Input
A4 Depth-Damage Curve (ICI Structure) depth_damage_ici_struc_table.csv Depth-Damage values for ICI building (content) Python Input
A5 Depth-Damage Curve (ICI Content) depth_damage_ici_content_table.csv Depth-Damage values for ICI building (structure) Python Input
A6 Content Class Reference Table content_class_ref_table.csv Lookup from content class code to description for reporting. Information Only
A7 Structure Type Reference Table structure_type_ref_table.csv Lookup from structure type code to description for reporting. Information Only
A8 Indirect Damage Table indirect_damage_table.csv Stores indirect damage as % of direct damges Python Input
A9 Flood Damages Summary Output Table flood_damages_output_summary_table.csv Summary output of # buildings, and direct, indirect,and total damages by building type Python Output
A10 Flood Damages All Fields Output Table flood_damages_output_all_fields.csv Output of all fields from Python Script Python Output
A11 Average Annual Damages Input Table AAD_input_table.csv stores inputs for calculation of Average Annual Damages script Python Input
Table A1 - Building Data Table (building_table.csv)
Field Name Key field Field Type Description Source Example
building_id primary Integer Unique identifier of the building polygon, GIS assigned. GIS Generated 1024
rmow_building_id IntegerSame as OBJECTID in GRCA building layer. Some polygons (digitized sheds, new
construction) had OBJECTID = 0. GRCA building layer ("OBJECTID" attribute) 102912
ici_res TextClassification of building as ICI or Residential. Used for the assignment of depth-
damage curve for contents.
Reclassification GRCA building layer "BuildingType" attribute, reclass table
provided in report. Residential
ici_res_updated_detail TextFurther classification of ICI buildings into: Industrial, Commercial and Industrial,
used for Indirect Damage calculations. Based on structure_type_code. Reclassification "structure_type_code" field, reclass table provided in report. Industrial
structure_type_code Text 1 - 2 character code representing the structure type of the building (TRCA curves).
For ICI: Reclassification GRCA building layer "BuildingType" attribute, reclass
table provided in report. .
For Residential: based on n_storeys, and field-verified classification of
apartment and split level houses.
C
content_type_code Text 1 - 2 character code representing the content type of the building (TRCA curves)
For ICI: from field classification based on building purpose (e.g. Medical, Retail).
For Residential: based on area_living_space_ft, and in-field classification of
apartment and split level houses, reclass table provided in report.
A
res_combo_code Text
2 characted code, the combination of the structure_type_code and
content_type_code, used for assigning depth damage curves for Residential
buildings.
For ICI: Null
For Residential: Concatenation of: content_type_code + structure_type_code.
in_floodplain_2006_zero5 Boolean Building is within a 0.5m vertical buffer of the 2006 Floodplain
GIS Generated
TRUE: In floodplain
FALSE: Not in floodplain
TRUE
in_indun_bound_2019_cleaned BooleanBuilding is within the draft 2019 Regional Inundation Boundary (cleaned up
version by GRCA)
GIS Generated
TRUE: In inundation boundary
FALSE: Not in inundation boundary
TRUE
n_risers IntegerNumber of risers (i.e. steps to main floor). Counted in the field. Was used to
determine the z_first_floor_m. Field-verified 3
ff_offset_method Text
First floor offset method; indicates best representation of ground surface
elevation at risers. Used to determine z_first_floor_m. Specifies whether n_risers
were counted from min/mean/or max of the ground elevation. E.g. if door and
risers for a house were at the high point of the property, this is max.
Field-verified max
basement_presence BooleanPresence of basement (for Residential buildings only). Used to determine if
basement damages should be calculated.
Field-verified:
TRUE: Has basement
FALSE: No basement
TRUE
attached_garage_n_cars IntegerNumber of cars of an attached garage, if present. "0" if no attached garage. Was
used to determine living_space_area_ft2 and area_single_floor_m2.Field-verified 2
z_building_min_m Float Minimum Elevation within 0.5m buffer of building GIS Sampled from: NewHamburg_Topobathymetric 335.1
z_building_mean_m Float Mean Elevation within 0.5m buffer of building GIS Sampled from: NewHamburg_Topobathymetric 335.4
z_building_max_m Float Maximum Elevation within 0.5m buffer of building GIS Sampled from: NewHamburg_Topobathymetric 335.6
z_first_floor_m FloatFirst floor elevation, used to calculate flooding depth (flood_depth_m). Used an
assumed riser height of 7 inches (0.178m).
If:
ff_offset_method = min, then: z_building_min + n_risers * 0.178 m
ff_offset_method = mean, then: z_building_mean + n_risers * 0.178 m
ff_offset_method = max, then: z_building_max + n_risers * 0.178 m
335.2
z_lowest_opening_m FloatElevation of lowest opening. Assumed equal to z_building_min, but stored as a
separate field for flexibility. z_building_min 335.1
field_verified_date_ymd TextDate on which the building was field verified (YMD).
If blank, the building was not field verified. Field 2019-10-03
Table A2 - Water Elevations (water_elevations_table.csv)
Field Name Key field Field Type Description Source Example
building_id primary Integer Unique identifier of the building polygon. 1234
storm_id secondary Text Unique identifier for each storm. User input RegionalSS
scenario_id secondary Text Modelling scenario, normally equivalent to a HECRAS geometry name. User inpute.g. berm_option_b,
ExistingConditions
z_water_min_m FloatMinimum water elevation within 0.5m buffer of building. For QAQC (mean depth
is used in calculations). Sampled from HECRAS Water Elevation Results raster. 335.2
z_water_mean_m FloatMean water elevation within buffer of building (distance TBD). Used for flood
depth calculations.Sampled from HECRAS Water Elevation Results raster. 335.3
z_water_max_m FloatMaximum water elevation within 0.5m buffer of building. For QAQC (mean depth
is used in calculations). Sampled from HECRAS Water Elevation Results raster. 335.4
Subject: New Hamburg Flood Mitigation Study – Flood Damages Survey
The Grand River Conservation Authority (GRCA) initiated a Flood Mitigation Study for New Hamburg in 2019. The objectives of the study were to update flood mapping, estimate annual average flood damage costs, identify potential options to reduce flood damages, and complete a preliminary technical feasibility and cost-benefit analysis of the options.
The industry standard method for estimating annual average flood damages employs relationships between depth of flooding and damages to structures and contents (i.e., depth-damage curves) originally developed for Alberta following flooding in 2013, and updated for use in Ontario using price indexes. Some assumptions are inherent in the methods, such as the assumptions that all residential basements are fully finished, and preparedness and mitigation measures have not been widely adopted (e.g., flood warnings, removing possessions from basement floors, foundation waterproofing).
GRCA surveyed New Hamburg residents and businesses to gather information about the characteristics of buildings in at-risk areas (e.g., whether basements are finished), types of flooding residents have experienced (river-related or sewer back-up), and damages and costs associated with floods. This information is expected to support estimation of annual average flood damages.
The purpose of this technical memo is to document survey methods, responses, and analysis. Maps are included in Appendix A. Aggregated verbatim responses to selected questions are included in Appendix C.
Methods
An 11-question survey was developed in consultation with the study’s project team. On-line (SurveyMonkey) and hardcopy (Appendix B) versions of the survey were created. The survey was released at a November 25, 2019 Public Information Center for the study. Hardcopies of the survey and introductory letter were hand delivered by November 28th by Township of Wilmot and GRCA staff to properties within the study area (Regional inundation boundary, draft 2019 update, south of the railway crossing) (see Table 1, Map 1). The survey was delivered only to those properties that were expected to have occupied buildings (203 street addresses).
Responses were requested by December 6, 2019, at which point the on-line survey was closed. All on-line responses and hardcopy surveys received by December 23rd, 2019, are included in this summary. A geodatabase was created, using addresses provided in survey responses, to allow for spatial review of the results.
Results and Discussion
Ninety-seven (97) responses were received (41 on-line), 90 of which were from addresses within the study area (Table 2). Responses from the 7 addresses outside of the Regional inundation boundary were excluded from analysis of survey questions 2-6. Six properties returned 2 surveys each. Of these 6 properties, the second surveys from 2 of the properties were deemed duplicates (near identical
2
answers) and removed. The remaining multiple responses were assumed to be responses from tenants in multiple-occupancy buildings, and were retained. The response rate within the Regional inundation boundary was about 43% (88/203).
Table 1: Number of inundated buildings by building type and return period flood (e.g., the 100-year inundation area is the area with a 1% chance of flooding in a given year) (Source: Matrix Solutions Inc, November 2019 DRAFT).
Building Type
2 Year
5 Year
10 Year
15 Year
20 Year
25 Year
50 Year
100 Year
Regional
Residential 1 39 54 61 66 69 83 97 157
Industrial 0 0 3 3 3 3 4 6 13
Commercial 0 2 4 5 5 7 10 13 30
Institutional 0 0 0 0 0 0 0 0 5
Total ICI 0 2 7 8 8 10 14 19 48
Grand Total 1 41 61 69 74 79 97 116 205
Of the 86 survey responses, the majority (74%) were identified as residential properties (Table 3, Map 2). Forty (40) responses (45%) were from properties in frequently flooded areas (i.e., within the 25-year inundation boundary).
Table 2. Number of survey responses by return period flood inundation area flood (e.g., the 100-year inundation area is the area with a 1% chance of flooding in a given year).
Return Period
None (Outside)
2 Year
5 Year
10 Year
15 Year
20 Year
25 Year
50 Year
100 Year
Regional
Responses 7 0 13 32 36 39 40 52 61 87
Table 3: Responses by property type (Question 2).
Property type Count %
Residential 64 74
Industrial 1 1
Commercial 17 19
Institutional 0 0
Other 5 6
Total responses to Question 2 86*
* One response selected multiple property types.
3
Half the survey respondents (51%) indicated their buildings either did not have basements or had unfinished basements (Table 4). Of the residential respondents, almost half (43%) indicated they had unfinished basements. Only 20% of residential respondents in the 25 year inundation zone had fully finished basements. This result suggests that the assumption in the flood damages estimation methodology that all residential basements are fully finished is not representative of New Hamburg residences within the floodplain. Further, of the 17 commercial properties, more than half indicated their buildings had basements, in contrast to the flood damages estimation methodology which assumes commercial buildings do not have basements. Of the 10 commercial properties with basements, half were identified as being either partially (2) or fully (3) finished.
Table 4: Basement characteristics (Question 3).
Basement All property types Residential properties
Count % Count %
Fully finished 18 21 15 24
Partially finished 24 28 20 32
Not finished 34 39 27 43
No basement 10 12 1 1
Total responses 86 63
Survey results suggest New Hamburg residents and businesses within the floodplain have begun to adapt to flood risk, and taken steps to mitigate impacts:
Sixty-nine per cent (69%) of respondents indicated they receive flood messages from at least one source (email, social media feeds, Alert Waterloo Region) (Figure 1). Seventeen per cent (17%) of respondents receive flood messages from more than one source. Within the 25 year inundation zone 85% of respondents receive flood messages from at least one source.
Forty (40) respondents to Question 5 indicated they had taken measures to protect their properties against flooding (77% of the 52 respondents that answered Question 5; 47% of overall survey respondents). Those that indicated no measures were taken also reported no damages due to flooding. Mitigation measures included:
o Removing items from basement/flood prone areas on property, o Raising items in storage in basement off of floor, o Installing sump pumps, o Procuring back-up generators, o Raising furnace and water heater or relocating to first floor, o Sewer backflow prevention valve, o Foundation waterproofing, o Sandbags, o Flood gates (plywood), o Replace construction materials in basement to those that are not as damaged by water
(cement board instead of drywall, painted cement floor)
4
Figure 1: Responses to Question 4 - Do you receive flood messages?
Of the 82 responses to Question 6 (4 did not answer), 61% indicated they’d experienced flooding (Figure 2). About 43% had experienced damages due to flooding. Of the 45 responses to Question 7, flooding was reported most commonly in 2018 (78%) and 2008 (40%). Fewer respondents noted flooding in 2009 (4 responses) and 2017 (5 responses). Respondents were not asked how long they’d occupied their floodplain property.
Figure 2: Responses to Question 6: Have you experienced flooding?
In the on-line version of the survey (41 responses), if a respondent selected “No, my property has not flooded”, survey logic directed them to the end of the survey (i.e., skipped questions 7-11 regarding flooding experiences). Survey logic was not applied to hardcopy surveys.
Of the 44 responses to Question 8 about what floors of their home or business were flooded, 80% reported flooding of basements only (Figure 3). Some respondents selected multiple responses. The
27
11
39
27
0
5
10
15
20
25
30
35
40
45
Yes, I receive GRCA floodmessages by email
Yes, I follow GRCA onTwitter at grca_flood_msg
or Facebook
Yes, I receive floodmessages from Alert
Waterloo Region by phone,text or email
No, I do not receive floodmessages
14
36
32
0
5
10
15
20
25
30
35
40
Yes, my property has flooded, therewere no damages
Yes, my property has flooded, therewere damages
No, my property has not flooded
5
most common responses for the “other” category were garage-only flooding. Of the 46 responses to Question 9 regarding entry of floodwaters, the most common response was leaking foundation (57%) (Figure 4) (multiple responses were allowed). Most of the “other” responses (32%) also indicated foundation or basement flood leakage. Damages due to sewer backup (35%) may not be attributable to riverine flooding.
Figure 3: Responses to Question 8: What floors of your home or business were flooded?
Figure 4: Responses to Question 9: How did the floodwaters enter your home or business?
5
35
1 0
15
0
5
10
15
20
25
30
35
40
No flooding occurredinside buildings or
garages
Basement only Basement and firstfloor
First floor only (nobasement present)
Other (please specify)
13
23
1617
0
5
10
15
20
25
Water entry throughwindow or door
Leaking foundation Sewer back up Other (please specify)
6
Question 10 asked respondents to describe damages that flooding had caused to their property or buildings. There were 47 responses. Flood damages included:
Personal items, memorabilia, decorations, antiques, clothing destroyed, electronics, furniture
Washer and dryer
Freezer
Damage to sump pump motors
Mildew/mold in basement
Lost wages/lost business opportunity
Forty-three respondents answered Question 11 about the total cost of flood damages experienced. Four indicated $0 damages. The remaining estimates ranged from under $100 to $100,000. For those reporting damages, they averaged $18,000-$19,500 (this includes flood damages for multiple events for residents who had occupied their homes for up to 51 years). Many cost estimates were provided as ranges with ranges spanning $5,000-$20,000 from low to high estimates.
References
Matrix Solutions Inc. November 2019. New Hamburg Flood Mitigation Study. Technical Memo No 1: Flood Damage Estimates. Version 0.1. Draft. Prepared for Grand River Conservation Authority.
7
Appendix A: Maps
8
Map 1: Buildings within the New Hamburg flood mitigation study area by building type (Source: Matrix Solutions Inc, November 2019 DRAFT).
9
Map 2: Survey responses by property type.
Appendix B: Survey and Cover Letter
November 20, 2019 Dear Occupant, The Grand River Conservation Authority (GRCA) is undertaking a Flood Mitigation Study for New Hamburg. The objectives of the study are to update flood mapping, estimate annual average flood damage costs, identify potential options to reduce flood damages, and complete a preliminary technical feasibility and cost-benefit analysis of the options. Public Information Centres were held in June and November of 2019. Posters from the information sessions are available at the study web page: www.grandriver.ca/NHFloodStudy. GRCA is seeking input from New Hamburg residents and businesses. Information about the characteristics of buildings in at-risk areas (e.g., whether basements are finished), types of flooding residents have experienced (river-related or sewer back-up), and damages and costs associated with floods, will provide valuable context for the study. Please fill out and return the enclosed survey or complete the on-line version by December 6, 2019.
Pursuant to section 29(2) of the Municipal Freedom of Information and Protection of Individual Privacy Act R.S.O. 1990, C. M.56 the personal information contained on this survey is collected under the legal authority of the Conservation Authorities Act, R.S.O. 1990, chapter C.27 and will be used for research purposes in support of the New Hamburg Flood Mitigation Study.
The data collected as part of this survey will be shared with consultant Matrix Solutions Inc, and the Project Team, which includes representatives from the Township of Wilmot.
Questions about the collection of personal information should be directed to Janet Ivey, Subwatershed Planning Coordinator, GRCA, PO Box 729, 400 Clyde Road, Cambridge, Ontario, N1R 5W6, Tel: 519-621-2761 ext 2325 or [email protected].
Thank you for your assistance. Best regards, Janet Ivey
New Hamburg Flood Mitigation Study Survey of Residents and Businesses
Please choose one of the following options: Fill out the survey online at www.surveymonkey.com/r/FloodStudy or scan the QR
code above, or Fill out this sheet and fax it to (519) 621-4844, scan and email to
[email protected], or mail it to us using the postage paid envelope provided.
Submit your survey by Friday December 6, 2019. Thank you for your input! 1. Please provide your address: _____________________________________ 2. What type of property are you completing this survey for? (circle one)
a. Residential b. Industrial c. Commercial d. Institutional e. Other:______________
3. Does your home or business have a finished basement? (circle one)
a. Yes, fully finished b. Yes, partially finished c. Not finished d. No basement
4. Do you subscribe to or receive flood messages? (circle all that apply)
a. Yes, I receive GRCA flood messages by email b. Yes, I follow GRCA on Twitter at grca_flood_msg or Facebook c. Yes, I receive flood messages from Alert Waterloo Region by phone, text or email d. No, I do not receive flood messages
5. Please describe any flood protection measures that you have taken (e.g., elevating or removing contents in the basement, sewer backflow prevention valve, foundation waterproofing).
6. Have you experienced flooding on your New Hamburg property? (circle one)
a. Yes, my property has flooded, there were no damages b. Yes, my property has flooded, there were damages c. No, my property has not flooded
If you have experienced flooding, please answer questions 7 to 11 for a specific flood event. 7. When was your property flooded? e.g., 2008, 2018 8. What floors of your home or business were flooded? (circle one)
a. No flooding occurred inside buildings or garages b. Basement flooding only c. Basement and first floor d. First floor only (no basement present) e. Other:______________________________________
Pursuant to section 29(2) of the Municipal Freedom of Information and Protection of Individual Privacy Act R.S.O. 1990, C. M.56 the personal information contained on this survey is collected under the legal authority of the Conservation Authorities Act, R.S.O. 1990, chapter C.27 and will be used for research purposes in support of the New Hamburg Flood Mitigation Study. The data collected as part of this survey will be shared with Matrix Solutions Inc, the consultant for the Study, and the Project Team, which includes representatives from the Township of Wilmot. Questions about the collection of personal information should be directed to Janet Ivey, Subwatershed Planning Coordinator, Grand River Conservation Authority, PO Box 729, 400 Clyde Road, Cambridge, Ontario, N1R 5W6. Tel: 519-621-2761 ext 2325 or [email protected].
9. How did the floodwaters enter your home or business? (circle all that apply)
a. Water entry through window or door b. Leaking foundation c. Sewer back-up d. Other:_____________________________________
10. Please describe the damage the flooding caused on your property or to your building(s): 11. Please estimate the total cost of the flood damages you experienced: $_____________
Appendix C: Aggregate verbatim responses to survey questions 5, 7, 10 and 11
New Hamburg Flood Mitigation Study Aggregate Responses
Question 5. Please describe any flood protection measures that you have taken (e.g., elevating or removing contents in the basement, sewer backflow prevention valve, foundation waterproofing).
I have installed two sumps. The downtown people of New Hamburg collected money to assist people whose property is affected by flooding.
We removed all contents that was possible in the basement. We open a valve in the foundation to let water flow away. Sandbags if available from the township.
My house has a 3 foot drop from backyard to the farmer’s field. The field floods, it has never come over the bank even when downtown is under water.
Replaced main sewer backflow valve. Installed a sump pump. Sandbags around main doors Elevated shelves for storage in the basement. Made flood gates. Painted foundation waterproofing paint. We elevated sine if the contents in the basement. However, had we not been home,
there probably would have been damage. Sewer prevention backflow valve, 3 sump pit and pumps We have moved our storage in the basement up on plastic shelving. Keep very little, not valuable in the basement. Removing any vehicles or produce from lower plaza parking lot to higher ground. Drain back flow prevention Removed carpet and wood subfloor. Floor is now painted concrete. Replaced wood
framed walls with concrete block walls. Installed sewer backflow valve. Installed sump pump and standby generator. Built flood covers for basement windows. Purchased flood-seal system for exterior door. Raised electrical outlets and installed GFEI.
Sump pump, floor pumps, higher furnace, stay up all night to protect property Keep things elevated I have installed a sump pump. I have installed a gas generator that plugs into the electric
breaker box in case of a power outage. I use attic for storage rather than risk water damage due to flooding. I drive to Kitchener and rent a submersible sump pump to help take the strain off the installed sump pump. I try not to go away for extended periods in the winter and spring.
Installed two sumps plus a generator in case power goes off. Dams – plywood, sump pumps. Sump pump. Nothing else required. Put steel studs instead of wood, spray foam, elevate wood/cloth furniture and
electronics, steel framed furniture and shelving. We have our freezer, washer and dryer sitting on bricks and when flooding is a threat,
remove all items from the floor and put them higher up, on shelving. Our furniture is on cinder blocks 1 ½ feet off the floor. We have a plug we can use for the drain.
When notified we move things to higher ground and remove as much as possible from basement. We have installed 3 sump pumps but if hydro is out they do us no good. Our Mayor said there would be sandbags available but we have never seen any.
Installed interior concrete below grade stone foundation liner in main basement, installed underfloor Big-O drain and new main sump & 2" pumped line to exterior c/w 50' discharge hose to street, installed bases and elevated furnace, water heater and softener, installed interior waterproofing membrane to all basement walls, purchased caps and backflow preventors for all drains, vents and intake openings to exterior of house or raised vents to 8ft. level, installed 2 secondary sump pits with Big-O drains in crawl spaces, pumped to main sump pit, raised gas meter to 24" above grade, raised exterior AC unit to 24" above grade, purchased 3" emergency gas stand- by pump with hoses and standby sump pump, installed 21KW emergency natural gas generator and mounted 24" above grade, installed door dams at exterior shed doors c/w sump pump.
Purchasing sandbags. I'm honestly not sure as our Premises is taken care of by a third party. I do believe we
have some sort of sump pump. Backflow valve Elevating contents, backflow preventer Seasonal pump installation, notices to tenants to remove items from basement. Foundation waterproofing. We have built (after the 2018 flood) 2 wooden panels that
can be put across the front of the house to prevent water coming in where it entered last flood.
Nothing is on floor in basement We do not keep anything in the basement, we board up the basement windows. We
have a back flow valve We have elevated contents in the basement Extra sub pumps, back flow on sub pumps, foundation sealing, content elevated or in
plastic totes, boiler/hot water tank/electric panel raised. Sewer backflow prevention valve Back flow valve, generator hook up, water barrier baffle if needed Removed all content from basement Property is elevated. Have now removed all basement contents Backflow prevention valve, sump pump with battery backup Foundation waterproofing, Sewer backflow prevention valve installed, basement window
modification to make water-resistant. Nothing stored in basement, sump pump in pit, windows bricked in. Installed new drainage tile under basement floor routed to sump pumps. Installed
secondary external basement windows to limit water incursion. Elevated furnace and water heater. Basement not used for storage.
Removed items except furnace and hot water because we can't We have sub pumps in 2 locations in our basement I have a sump pump Removing any supplies or Delivery vehicles from our lower parking lot We are high enough up that we do not flood but we see the down town core floor and
the streets around us. The building is slightly elevated from historic flood levels but will be flooded after the 500
and 1000 year storms.
Sandbags. Elevated contents in basement, plugs for sewer backflow protection. All basement appliances area raised off the floor. Any contents are in waterproof
containers. Nothing valuable is kept in the basement. Too bad that I have such limited use of an entire floor of the house, water comes in through the side door. I have sealed off the basement windows with Plexiglas (no longer functional).
We have made efforts to waterproof the foundation. Nothing to date. I get a little water in the basement every spring thaw and heavy rainfalls. I run a
dehumidifier spring to fall. 2 sump pumps, furnace on main floor, water heater on main floor. Basement now emptied of stored items. Foundation replaced at back of house. Old
stone foundation needs waterproofing. Removing contents in crawl space. If [our property] floods, the whole town is under water.
Question 7. When was your property flooded? e.g., 2008, 2018
1970 and about every 1 in 3 years. 2008 – yes, 2018 – yes. February 2017. Can’t remember the other year. 2018 – Sewer backflow during the big flood. No ground water came in. 2008, 2018. Tough question for dates when the municipal parking lot out back on the river floods –
we do too. 2018 I have lived in New Hamburg my entire life and have seen a lot of floods. Even though
my wife and I live close to the Nith River and floodplain (farmer’s field) the water level would have to go up at least 6 feet more before it would be any kind of concern to us. We experienced the flood of Xmas 2008, it being the worst flood for New Hamburg in quite a few years and it didn’t come close to our home. If it even came close to our home, downtown New Hamburg would be a disaster.
Our property has been flooded many times since we have lived here but the most severe flooding was 2008 and 2018.
2018 We have lived here since 1974 so we have experienced all floods!!! Bad 1975, 2008,
2018. Minor ones only water in the driveway. 2018 We have consistent flooding in the side yard by Milton Street – often comes half way up
the yard. In 2018 it came almost to the house at the front corner. This was the highest it has been. Have been in this house since 1982.
December 2008; February 2009; February 2018. During heavy rain event about ten years ago. Yearly. Home – never. Lower land area inundates with water when river (Nith) level
exceeds channel. December 2007; Spring 2008; February 2018. December 2008; February 2017
2008 and 2018 2018 Annually to a degree. 1975 – large flood in basement, 2008, minor in 2018. It was flooded 2 or 3 times in 2008/09 and again (the worst) in 2018. Twice 2008 and 2018 February 2018 February/2018 2018 2018 2018 and 2008 2008 and 2018 2018; 2010 2008, 2017, 2018 Numerous times starting in 1965 the year after I moved in. Most recent 2008/2009/2018 Both 2008 and 2018 2018 I don’t recall years exactly. In 2005ish I experienced 3 floods in one year. At one point
basement was filled. I believe it was 2017 when there was a flash flood and basement was filled again.
2008 and 2018 Spring 2018. 2018 Both 2008 and 2018. I have experienced 3 floods (2 in 2008 and 1 in 2018) and an
almost flood a few years ago. 2018 2018 2018 Since moving there. 2009, 2010, 2017 Feb. Yes, both years. Actually it was three times we got flooded out. Sheds in yard – contents
got damaged. Question 10. Please describe the damage the flooding caused on your property or to your building(s):
The water usually is about 2 feet. On bad years the water gets to within 6” of the Hydro Control panels, at about 5’ to 6’ above basement floor level.
Furniture, rugs, couch, bed, mattress, photos, books, electrical, paneling, some clothing, some flooring, floor mats, antique dresser.
~$30,000 in damages. Carpet and sub floor were damaged. Baseboards and 3” of drywall (from floor up). Furniture.
Loss of business for 3-4 days. Large amount of mud and debris around buildings. Nothing I could not clean up.
Had to replace drywall, carpet, lost some furniture, pictures that were stored in the basement.
To this point there has been nothing significant, other than moisture which could cause damage in time. Also, a lot of clean-up on property e.g., Wood, corn stalks, mud in sheds.
Debris from the river washed up. Carpets, doors, moldings, drywall etc. Items stored in basement in boxes were ruined. Deterioration of stone foundation; cracking floor We have not had property damage but regularly have to clean a huge mess of tree limbs
and other debris that comes across Milton from the field. Some are quite large and more than I can clear myself. The last few flood have definitely dumped more debris than the earlier years.
No physical damage, other than water that penetrates old parking lot, and causes purging due to frost.
Damaged flooring, drywall Flood debris cleanup is a yearly chore. Ice flow causes tree damage (straighten or
replace). Motor boat damage to river bank (wake damage) has caused more problems than any flood. Built home in 1980 and have lost (in some areas) up to 10 feet of bank to this issue. No motor boats; motor size limit; no water skiing; speed limit; no wake zone.
Fiberglass insulation ruined, wood framed walls wet and moldy, wood subfloor and carpet ruined; drywall ruined.
Flooring, steps, walls, door, brick wall Furnace was damaged in 2008 flood. I had to replace a part. Just wet floor. Ice damage to structure and fields. Remove carpet underlay, removed bottom drywall and replaced with cement board. Water damage to walls and furniture, hot water heater, tools, electronics, carpets,
washed pool deck away, picnic tables. Have invested in an additional industrial pump so when it came up through the drain and
started to rise we had to take out screen in the window, throw sump pump hose out the window into the water that was surrounding the house and cap the drain…then started pumping out the basement. Even though we pumped out the water and shop-vac’ed everything up, we still get mold. We are now in our 70s and have been here close to 40 years. The floods are getting worse and we’re not sure how much longer we can go through this.
3 times in last 10 years we have had between 3 feet and 5 feet of water pour into our basement which destroyed our furnace, hot water tank, washer and dryer, freezer full of meat. The 1st time in 2008 we had no notice so we lost clothing, some Xmas decoration and mementos from my children’s school days. Also in 2008 we sustained substantial damage outside losing our lawn mower, snow blower, bike and miscellaneous items. Not only loosing material articles but the stress of not knowing id our sump pumps will keep up at least enough to stop water from reaching main floor.
Damaged furnace, floors, walls, furniture, electronics, heirlooms I have lived here for 45 years and have experienced many floods over the years,
sometimes 2 per year. I have fixed foundation wall damage property damage, sump
pump damage, basement sewage back-up multiple times, mildew and mold problems as a result of flood water and sewage back-ups, re-painting, damaged insulation and damage to my personal property. As a result I believe in pre-planning and preparation to battle the flooding that occurs yearly. I have little almost no record of the damage costs involved, save to say that I have bore the majority of all the costs plus the cost of the flood preparations noted above.
Garage – items sitting on the floor, garage door; Hallway – baseboards, walls; Bedroom – floor, walls, vanity; Crawl space – Christmas items
The basement ended up with 21 inches of water and the entire basement had to be gutted with all wet materials discarded due to asbestos concern. This also caused our server, phone system and security systems to go out and need to be replaced. We also had to close for 5 business days due to this.
Hot water heaters, boiler, laundry machines, tenant belongings. Carpet and under padding was soaked and needed to be replaced. Damaged found ration and plumbing, damaged items in garage (lawnmower, furniture
etc) Backyard was completely flooded (3ft of water), cars had to be relocated, basement had
substantial amounts of water coming in through the walls which had to be repaired, foundation floor cracked, many personal items lost.
2 to 3 inches of water over the carpet floor on the basement. Water damage to the drywall walls in the basement
Windows broken, 2 doors ruined, deck rot, driveway destroyed, snow blower and lawnmower destroyed, building materials (drywall, wood) destroyed, anything stored in garage was thrown out due to water damage. Floor and wall water damage in main building, furnace damaged by water/mud in intake ducts.
In 1965 we lost our front porch, over the years we have lost numerous items. In 2008 the furnace was replaced and hung from the ceiling and the water heater was replaced at our cost. In 2009 the furnace had to be repaired and the water heater was replaced and moved upstairs. A friend’s car parked in our driveway was covered and her insurance covered it. In 2018 the water came up an inch from the main floor. The furnace was replaced and moved to the main floor, the electrical panel was replaced and moved to the main floor. The basement was dryed out. Insurance covered these items. It was the first time insurance was ever used and only because the sewer backed up first. Insurance has told us they will never cover it again.
Furniture, finishings and chattle in basement. Chattle in Garage. Breakers box needed to be replaced. Hydro had to come and cut power line and then
restore after flooding. I have had to replace my furnace and water heater 2 times. My electrical panel has
been underwater 2 times and some breakers needed replacement. Sump pump had to be replaced 1 time as well.
Had to replace a brand new furnace that was less than 6 months old with another one. Hot tub got ruined. The first floor lost a lot of stuff that was down in basement.
Basement carpet had to be replaced as well as most of the drywall. Garage had to be sanitized.
Minor damage to some contents. No appliance damage. Professional cleaning due to sewer backup.
Basement items have to be waterproof or up high. Shed has to be emptied out in flood times. I am fortunate, but live in fear that my sump pump might quit working or the pump is the only thing that keeps it from being very bad.
There was water damage to the basement walls and to a small number of articles in storage.
Not much water entered. No damage. Just float around material. No damage. ’09 basement filled most everything stored there $1700 to repair furnace and water
heater. Now have rebuilt house and put in new foundation on back of house and upgraded crawl space with insulation and cement floor. Old stone foundation is still in need of waterproofing when water levels rise water comes through foundation and up through floors.
Damaged a finished room (had to redo), our pool liner was damaged along with pool pump (in ground pool). Hydro panel was submerged in water. Contents in basement (crawl space) were lost. Contents in sheds i.e., Lawn mower, garden stuff, dressers that were stored, table top.
Question 11. Please estimate the total cost of the flood damages you experienced.
$5,000 - 1-2 days of lost sales due to forced closing, profit on sales, employees lost wages.
I know in the last 11 years we have spent over $10,000-$12,000 out of pocket and another $15,000 from insurances. I would not know how to even estimate the previous 44 years.
$15,000 to $20,000 $5,000 $30,000 - $50,000 in 3 major floods The most recent flood over 4000 for a new furnace plus the 6000 of the new one we had
just put in a few months before. $8,000 $8,000 $40,000-$50,000 or about $1,000 average per year $20,000 to $30,000. Damage would have been higher if we didn't move some items out
of the basement. Approx $5,000 2008: $35,000 2018: $12,000 $2000, 8 hours of bailing incoming water out of the basement, a weekend of
cleaning/drying and weeks of repairs. $6,000 $100 $1,000/day closed $75,000 $0 $30,000 $2,500 $15,000
$4,000-$7,000 The pleasure of living on the river area far exceeds any monetary damage caused by
flooding. 10 hours of labour clean up. $27,000 Lots We no longer have insurance as it cost $4,000 a year. We are worried with the potential
for a regional flood. $2,500 $20,000 $100,000 $1,000 $1,000 for bare minimum foundation restoration, plus cost of lawnmower and patio
furniture $15,300. $300 to $500 per year since 1968 $4,000 $70 for burned out sump pump Unsure. We rented at the time. Unknown as this information was not provided to me. 15,000. Claimed through insurance - we have overland coverage. Many of our neighbors
do not. $3,000 $40,000 0 0 0 $20,000 $27,000
Other comments received:
Have you studied impacts of increased tile drainage in recent years? There are significantly more lands being cleared, then tiled. Tile runs are also much closer together in 2018/19 than in the past. Trees are being removed at an increasing rate (trees prevent runoff as well as store carbon).
We no longer have insurance as it cost $4,000 a year. We are worried with the potential for a regional flood.
We need help in flood proofing our homes. How can I stop the water from coming in at my side door? Any funding available? I need a sewer backflow valve. Notifications kept the flood damages from being worse.