Page 1
298 CHEMICAL PROBLEMS 2020 no. 3 (18) ISSN 2221-8688
CHEMICAL PROBLEMS 2020 no. 3 (18) www.chemprob.org
UDC 620.91
SOLID OXIDE FUEL CELL STACK SIMULATION USING EFFECTIVE MEDIUM
APPROXIMATION
A.U. Sharafutdinov, Yu.S. Fedotov, S.I. Bredikhin
Institute of Solid State Physics RAS,
142432, Russia, Chernogolovka, Moscow region, Academician Ossipyan, 2,
e-mail: [email protected]
Received 28.05.2019
Accepted 11.08.2020
NiO/10Sc1CeSZ/LSM membrane-electrode assembly (MEA) was prepared using screen printing
technology. A series of current-voltage characteristics was measured. Using experimental data a
numerical model of SOFC stack was composed in COMSOL Multiphysics finite element analysis
software. Distributions of temperature, reactants concentrations, gas pressures and velocities were
calculated using the effective media approximation. Comparing the results with known theoretical
observations revealed that the effective media approximation allows one to simulate the SOFC
stack behavior adequately and reduce corresponding computational mesh size by a factor of 1 310 10 depending the stack size. It was found that high heat exchange efficiency at the stack
microchannels suppresses the dependence of temperature variation amplitude in the reaction zone
on the input airflow temperature. This allows one to lower both the rate of input airflow and its
temperature avoiding significant growth of temperature gradients across the stack.
Keywords: SOFC, COMSOL, electrolyte-supported cell, fuel cell stack, computational fluid
dynamics, effective medium.
DOI: 10.32737/2221-8688-2020-3-298-314
Introduction
Over recent decades the developed
countries have made many efforts to reduce the
percentage of traditional energy sources in
overall energy balance as well as to increase the
energy efficiency. The solid oxide fuel cells
technology has great potential in the field due to
high energy efficiency and purity compared to
traditional ones. It bases on the galvanic
process, in which the electrolyte is solid,
conducts only O2-
and forms a membrane
between the oxidizer, typically air, from the one
side and fuel gas from the other side. The
process at the electrodes takes place as long as
air and fuel gas are separately fed to the cell. As
a result the cell produces the electrical energy,
heat, steam and CO2. The working temperature
of such devices varies in the range 600–900°C
depending on the materials and structure used
[1]. As for the fuel, it may be either pure
hydrogen or syngas, a product of hydrocarbons
complete or partial reforming, containing H2,
CO and a certain amount of CH4.
Electrochemical fuel oxidation at denoted
temperatures does not lead to formation of
poisonous nitrogen oxides in contrast with
conventional fuel combustion. The efficiency of
the cell is limited not by the Carnot cycle but by
the oxidation Gibbs free energy divided by the
heat of combustion [2]. Hence, the energy
efficiency for natural gas can potentially reach
70%, which is extremely rewarding.
The fuel cell always contains three main
parts: an electrolyte membrane and two
electrodes, an anode at the fuel side and a
cathode at the air side. Therefore, the cell is
often named membrane-electrode assembly
(MEA) to distinguish a certain item from the
technology name. The typical operating voltage
of a cell is 0.7–0.8 V, typical current density
0.2–1 A/cm2. MEAs differ in geometry and
mechanical support. The main geometry types
are planar and tubular [3] while the supporting
Page 2
A.U. SHARAFUTDINOV et al. 299
CHEMICAL PROBLEMS 2020 no. 3 (18)
role may be assigned to either the electrolyte
membrane, anode, cathode or special external
layer [4]. In this paper we focus on the planar
electrolyte-supported cells (ESC) since they are
developed in ISSP RAS. For energy production
the MEAs are combined into stacks containing
20–60 pieces. It leads to multiplying the voltage
up to values suitable for a practical use. Cell
stacking allows one to reach high power
densities minimizing current collecting and gas
supply subsystems (up to 2.5 kW/kg, [5, 6]).
High power densities require effective cooling
of the stack, e.g. by the excess amount of air.
Additional effort is also required to lower
temperature gradients across the stack as the
power density grows. Therefore the questions of
air cooling and uniform gas distribution in the
fuel cell stacks are still the focal point of
analytical, numerical and experimental studies
[7, 8].
In the adiabatic standalone operating mode of
SOFC stack the major sources of the thermal
gradients are non-uniform current distribution
due to fuel exhaustion and non-uniform heat
exchange with inflow air [9]. In [10] it was
shown that using the co-flow design one can
choose the optimal temperature and flow rate of
input air flux in such a way that these thermal
features partially compensate each other.
Any fuel cell stack contains a set of
small-scale structures: the microchannels with
0.1-1 mm cross section dimensions and 0.01-0.5
mm thick MEA layers. An explicit account of
these structures is expensive in the terms of
computational cost.
One can reduce computational mesh size
by a factor of 101-10
3 (depending on the stack
size) imitating the small-scale structures by
properly designed continuous media. Definitely,
such an "effective media" approximation must
be validated. Generally, the widths of current
collector ribs and microchannels are small
enough to neglect the oscillations of the
temperature and reactants concentrations within
one period of the microchannel structure.
However, the applicability of the method to the
flow and pressure distributions is in question.
Since the heat, electrical and gas flow problems
are closely connected, errors rooted in one
phenomenon simulation extend to the others. To
maintain uniform chemical and thermal
conditions one should keep the gas flows
uniform across the stack. In [11] an influence of
gas supply unequal in stacking direction was
investigated. The authors demonstrated that
unequal fuel distribution across the stack
enhances the current distribution
inhomogeneities, whereas unequal air supply
influences primarily the temperature
distribution.
Let us summarize known experimentally
verified results on gas distribution in fuel cell
stacks for the subsequent comparison with our
simulation results. The air and fuel flows in
microchannels of the stack are normally laminar
and can be described by Poiseuille equation,
whereas the flows in the distribution headers
and pipelines can be either laminar, turbulent or
transitional [12]. To get the flow distribution in
the headers of the stack one can base on the
momentum conservation law (MCL) [12, 13]:
2 0h h
Pp u u
(1)
Here is the wall shear stress and p is the
header cross section perimeter, hu is the axial
flow velocity, is defined as follows: the axial
component of flow velocity at the entrance of
microchannel is equal to hu . Pressure and
velocity distributions are assumed to be
averaged in the flow cross section. Thus, the
pressure drop in the microchannels is
determined by the following equation:
2
, ,2( ) (2 2 ) 0
in out outin in out out in out h in h in
in
P P Ap p u u
A
(2)
Here /in outA is the cross-sectional area of input/output header (see Fig. 1).
It is worth noting that the pressure drop in a
microchannel in out f hcP P P P is
determined by the viscous friction term fP
and the header-microchannel transition losses
Page 3
300 SOLID OXIDE FUEL CELL STACK SIMULATION
CHEMICAL PROBLEMS 2020 no. 3 (18)
hcP . The latter is due to abrupt
expansion/contraction and 90º turning of the
flow.
Fig. 1. Schematic diagram of the gas distribution subsystem.
The exact analytical solution of the last equation
has been found in [14] in an assumption that the
wall shear stress is given by Darcy–Weisbach
formula 2 / 8hf u and the factor f is
independent of the gas velocity hu .
Typically the air pressure distribution in
the headers is determined by the inertia rather
than by the viscous friction. Neglecting viscous
friction terms the authors of [13] have solved
the following equation:
2
, ,2(2 2 ) 0
in out inin out h in h in
out
P P Au u
A
(3)
In this limit the pressure in the input header
grows from the entrance to the interior of the
stack due to the pressure recovery phenomenon.
But the recovery is not complete since the
fraction in of gas slows down by reaction
forces in the microchannels rather than by the
pressure gradient. This picture has been
confirmed experimentally in [15].
Formation of large-scale vortices leads
to additional suppression of the pressure
recovery in the input header [8]. The
coefficients depend on the header/microchannel
cross-sectional area ratio, flow velocities ratio
and distance between microchannels [16]. As
the microchannels flow velocity exceeds that of
the header flow out tends to negative values
[16]. At a very large velocity of the
microchannels flow an unstable jets formation
begins in the output header [17].
The opposite limit of low volumetric
flows has been considered in [18, 19]. In this
case the pressure distribution is determined by
viscous friction and the MCL (see Eq. 2) takes
the following form
( ) 0in out
in in out out
P Pp p
(4)
Purpose of the article
In this paper we present the three-
dimensional multiphysics model of SOFC stack
based on computational cost-saving method of
effective medium. According to the method we
replace layered structures of the stack by
continuous media with anisotropic properties.
We compare the results of such approach with
the known MCL-based theoretical and
experimental results for the pressure distribution
in the fuel cell stacks and list the applicability
limits of the effective media method.
Page 4
A.U. SHARAFUTDINOV et al. 301
CHEMICAL PROBLEMS 2020 no. 3 (18)
Experimental part
Electrolyte-supported MEA was made
by electrode deposition on a ceramic electrolyte
plate using screen printing technique. Plates of
ceramic electrolyte were prepared in the
following sequence: 1) preparation of a ceramic
slurry 2) ceramic tape casting 3) tape drying 4)
lamination of stacks 5) removing bundles 6)
sintering [20]. Electrolyte gains mechanical
stability during the sintering process at 1500 ºС.
At this temperature the density of resulting
electrolyte is maximal. Chemical composition
of electrolyte was as follows: 10%Sc2O3
1%CeO2 89%ZrO2, the thickness was 250 µm.
The anode and cathode were deposited by
screen printing technique followed by sintering.
HERAEUS V-006 was used as a binder
for screen printing pastes. Both electrodes were
built in two layers: functional and current
collection layer. The anode functional layer of
15 µm thickness consisted of 40 wt.% NiO and
60 wt.% 10Sc1CeSZ. The anode current
collection layer (ACCL) of 30 µm thickness
contained 60 wt.% NiO and 40 wt.%
10Sc1CeSZ. After anode deposition the plate
was fired at 1380 ºС. Then the cathode was
deposited. The cathode functional layer of 15
µm thickness contained 60 wt.%
(La0.8Sr0.2)0.95MnO3 and 40 wt.% 10Sc1CeSZ.
The cathode current collection layer (CCCL) of
30 µm thickness consisted of pure
(La0.8Sr0.2)0.95MnO3. After cathode deposition
the plate was fired at 1100 ºС.
Current-voltage characteristics were
measured on a button cell of 21 mm diameter.
Four-probe method was applied for the
measurement using potentiostat/galvanostat.
Platinum mesh and wiring were used to connect
MEA to potentiostat/galvanostat [21]. Air and
fuel flow rates were high enough to assume
uniform concentrations of chemical species
across the button cell surface.
The aforementioned characteristics
provide us enough information on
electrochemical transport to build a numerical
model of the fuel cells stack based on this MEA.
NUMERICAL MODEL
Nomenclature
R Universal gas constant
F Faradey constant
T Temperature
q Heat flow
j Density of electronic current
gu Effective gas flow speed (here
and further index g stands for air
or fuel)
g Density of gas g
g Dynamic viscosity of gas g
ip Pressure of gas specie i
lh Height of layer corresponding to
one SOFC in stack
pk Thermal conductivity matrix of
effective body
1. Geometric setup
The model is composed in COMSOL
Multiphysics finite-element analysis software
[22] based on the prototype crossflow SOFC
stack design, which is being developed in ISSP
RAS. The model consists of SOFC stack, air
and fuel supply pipes and thermal insulation.
Page 5
302 SOLID OXIDE FUEL CELL STACK SIMULATION
CHEMICAL PROBLEMS 2020 no. 3 (18)
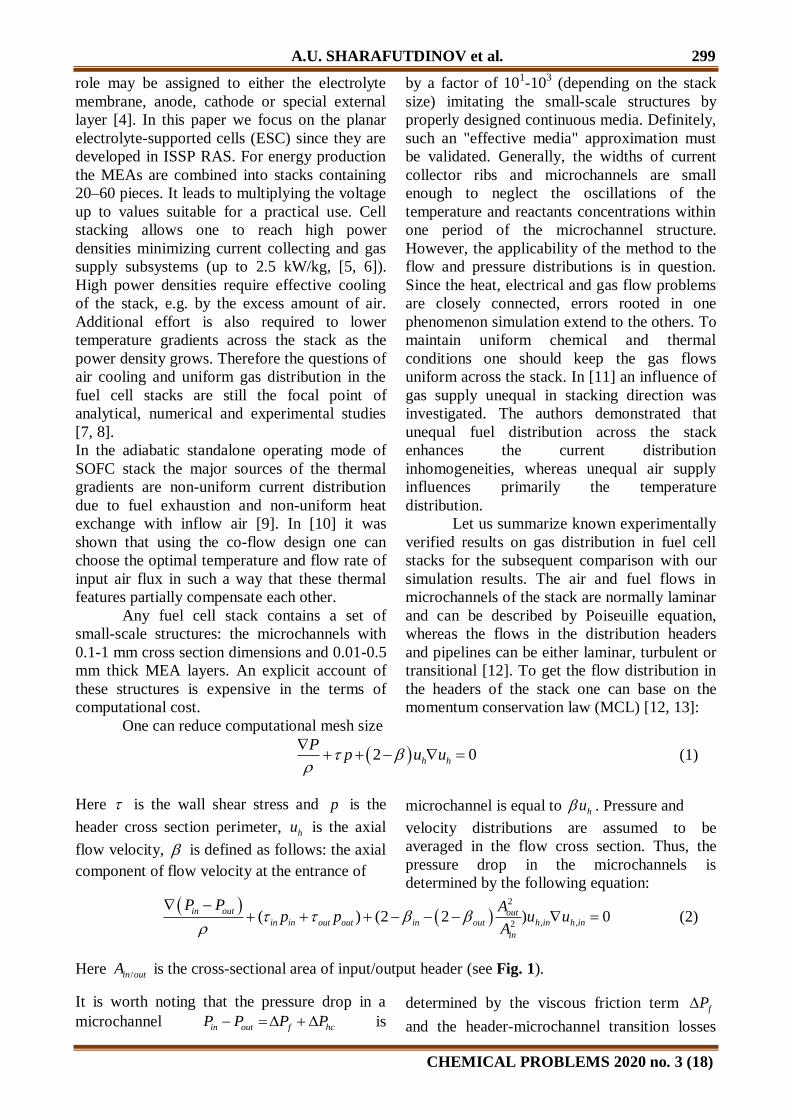
A stack consists of 34 MEAs alternated
with Crofer 22APU steel interconnects (
Fig. 2) and high-temperature glass-
ceramic sealing compound [23]. The stack is
compressed between two thick 20 mm Crofer
22APU steel plates to ensure sealing.
Reactants reach the MEA electrodes
through the microchannels milled on the plates
surface. The channels width is small enough to
assume lossless current collection (Table 1).
According to the effective medium
approach we do not define the channels
explicitly in our model. Instead, we divide the
stack into effective media domains describing
the layered structure in terms of averaged
parameters such as porosity, anisotropic thermal
and electric conductivities etc.
Fig. 2. Membrane electrode assembly and interconnect plate. The width and depth of the
microchannels are doubled for visualization. All dimensions are in millimeters.
Table 1. Dimensions of key components of the reaction zone
Stack component Thickness/Width
Glass-ceramic sealing 150 µm
Steel interconnect 2,3 mm
Electrolyte membrane 250 µm
Electrodes 45 µm
Air channels 0,8 mm/2 mm
Fuel channels 0,4 mm/2 mm
Thus, we have virtual media of six types:
1 – reaction zone; 2 – gas distributor; 3 –
stiffening bridges; 4 – outer frame; 5 – end
plates (Fig. 3); 6 – air and fuel distribution
headers (suppressed notches).
Page 6
A.U. SHARAFUTDINOV et al. 303
CHEMICAL PROBLEMS 2020 no. 3 (18)
Fig. 3. Stack with domains of various virtual media denoted. All dimensions are in millimeters.
Air and fuel supply lines were assumed
to be welded to the upper end plate (see Fig. 4).
Parameters of PROMALIGHT-1000X have
been used to model 50 mm-thick thermal
insulation.
Fig. 4. Outline of the full model. The frontal part of insulation is hidden. All dimensions are in
millimeters.
2. Physical model
A. Heat transfer
The temperature distribution is given by the heat equation in porous media:
g
g p g VgC u T q Q (5)
Page 7
304 SOLID OXIDE FUEL CELL STACK SIMULATION
CHEMICAL PROBLEMS 2020 no. 3 (18)
pq k T (6)
Here summation (index g) runs over gases
flowing through the effective medium – air or
fuel. VQ stands for heat dissipation resulting
from reaction heat and ohmic heating. g
pC is
specific heat of gas flowing through the
channels.
The thermal output of the hydrogen
oxidation reaction is proportional to the current
density in MEA and entropy change during the
reaction:
2
r q
jQ T S jU
F
(7)
Using the tabulated values of entropy change
during hydrogen oxidation, the values of qU
were found at 1000 K, 1100 K и 1200 K. Then
we linearly interpolated qU :
2 2
2
4
0
0,0282 3,15 10 / 2
H O
q
H O
p pRTU V V K T ln
F p p
(8)
The specific heat of gas mixtures was
calculated as an average specific heat of
components weighted by mass fractions. One
can neglect the heat conductivity of gases in
porous media in comparison with that of the
steel plates. The heat conductivity matrix pk is
anisotropic in virtual media 1, 2, 3 and 4 due to
the laminated structure of the stack and presence
of gas channels (
Table 2).
Table 2. Components of thermal conductivity matrix (W
mK) at 780 ºC.
xx
pk yy
pk zz
pk
Reaction
zone
14,8 13,5 9,0
Air
distributor
18,3 16,0 8,5
Fuel
distributor
19,5 20,4 9,6
Stiffening
bridges
(air)
16,1 16,1 0,1
Stiffening
bridges
(fuel)
20,0 20,0 0,1
Outer
frame
23,9 23,9 10,9
Surface-to-surface radiative heat transfer was accounted for within the manifolds.
B. Charge transfer
The distribution of electric current is defined by the charge conservation law
Page 8
A.U. SHARAFUTDINOV et al. 305
CHEMICAL PROBLEMS 2020 no. 3 (18)
0j , (9)
and electrochemical transport equations with anisotropic conductivity matrix:
2
.rev
lO
Uj
z h
(10)
Here is the electrochemical potential [24],
2Oz is the charge of 2O ion ( 2e ), revU is the
output voltage of a single SOFC in open circuit
regime. revU is defined by the local temperature
and concentrations of reactants.
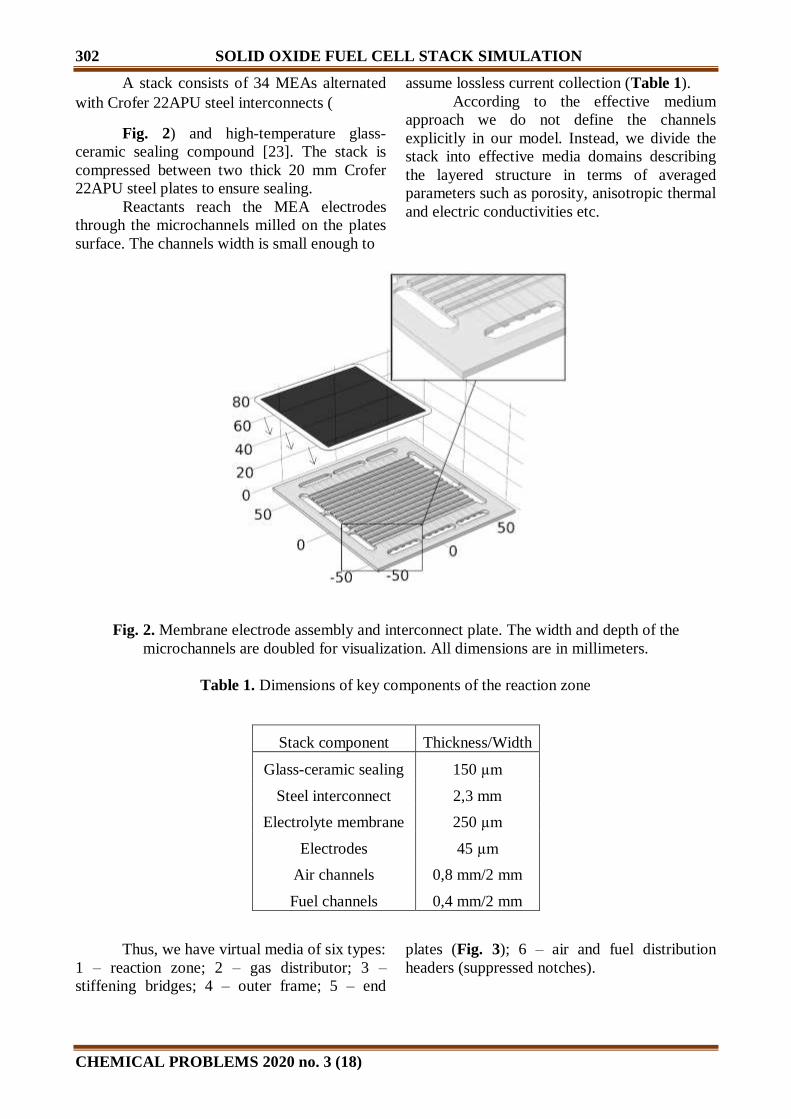
Due to nonlinear electrode kinetics the
effective medium conductivity should generally
depend on the current density. We obtained this
dependence from experimental current-voltage
characteristics (see Fig. 5).
Fig. 5. Current voltage characteristics of ESC.
The current-voltage characteristics were fitted using the following approximation functions:
U
b
Ui
B Ae
(11)
Here A, B and b are fitting parameters depending on the temperature (see Table 3).
Table 3. Fitting parameters of the current-voltage characteristics
800°С 850°С 900°С
A 2,87584 2,08166 1,29107
b 0,33113 0,23256 0,1548
B 0,54941 0,48132 0,37532
C. Transfer of chemical species.
Page 9
304 SOLID OXIDE FUEL CELL STACK SIMULATION
CHEMICAL PROBLEMS 2020 no. 3 (18)
The equations stated in the next two
sections are gas-specific, index g is omitted for
brevity.
Fuel in the model is a mixture of H2 and
H2O while air is approximated as a mixture of
N2 and O2. To find the evolution of gas mixtures
chemical composition across the stack we used
the following equations:
1
0
1
,
i i
i i ik kk
k k k k
k ik i
k i
j u
j D d
d x x pp
x M MM M
(12)
ij – relative mass flux of the specie i.
ikD – Fick’s diffusion coefficients
kd – diffusional driving force
kx – mole fraction of the specie k
iM – molar mass of the specie i .
Gases are assumed to obey the ideal gas equation of state:
i ii
px M
RT (13)
The dynamic viscosity of gases was calculated on the basis of molecular kinetic theory [25]:
21 1
2 4
1
2
1
8 1
i i
ij ijj
ji
j i
ij
i
j
x
x
M
M
M
M
(14)
Here i stands for dynamic viscosity of specie i.
D. Fluid flow
The dynamics of air and fuel in the supply manifolds is governed by Navier-Stokes
equations with inertial term:
2
3
0
Tu u pl u u u l
u
(15)
Page 10
A.U. SHARAFUTDINOV et al. 307
CHEMICAL PROBLEMS 2020 no. 3 (18)
In the reaction zone and gas distributors one can neglect all dissipative terms except wall friction:
1pl k u
u Q
(16)
Here Q is the density of gas volume generation rate. k is the permeability of the corresponding
virtual media.
3. Calculation details
A tetrahedral mesh with 106 elements
was used to solve the computational model. The
solution time to reach estimated relative error
less than 10-3
was about 2 hours with the server
based on Intel Xeon CPU-2630. For comparison
the authors of [26] used 1.6×10⁷ elements to
model a 30 times smaller stack.
Results and discussion
A typical temperature distribution is
presented on Fig. 6. One can observe an abrupt
increase in the airflow temperature on the
boundary between the input header and air
distributor. This is due to high-efficiency heat
exchange in the shallow air channels of the
distributor. To confirm this behavior we
simulated the temperature distribution in a
single air channel independently (see Fig. 7).
Fig. 6. Temperature distribution in the median section of the stack. The reference level is 780 ºC.
Voltage of 0.75 V on MEA, current 20 A, fuel utilization 65%. Fuel consists 97% H2 3% H2O.
Page 11
306 SOLID OXIDE FUEL CELL STACK SIMULATION
CHEMICAL PROBLEMS 2020 no. 3 (18)
Fig. 7. Temperature distribution in one of the microchannels (half) of the air distributor in the cross-
section parallel to the cell planes. Air flows from left to right, average air velocity in the channel – 3
m/s.
One can see that the temperature of input
airflow equilibrates with the temperature of
bipolar plate within a distance of 5 mm. Thus,
one can assume the temperature of the air
penetrating the stack to be equal to that of the
cells. But the assumption that the cell entrance
zone temperature is equal to the inlet gas
temperature is in a sense impractical due to the
aforementioned temperature jump [10].
Actually, this jump grows with the dissipated
heat power at constant inlet air temperature.
This fact leads us to interesting consequences.
Energy losses for air pumping through
the stack depend severely on the airflow rate
(Fig. 8). Hereby, lowering the temperature of
input airflow one can use less air and therefore
increase overall SOFC plant efficiency. But this
is limited by thermomechanical stresses causing
cracks in ceramic MEAs and by the abrupt
shrinkage of the power density in cold MEA
zones. At glance, mainly the temperature
difference between the hottest and the coldest
points of the stack is equal to the air temperature
difference, so lowering the air temperature
should strongly increase the temperature
gradients across the stack. However, our
simulation shows that the range of temperature
variation inside the stack grows much slower
than the temperature difference between the
output and input airflows (Fig. 8). Thus
equating gas and solid temperature ranges can
lead to excessive stack protection at the cost of
efficiency.
Fig. 8. Minimum temperature across the stack (black squares), air inflow temperature (black circles)
and energy losses for pumping air through the stack (red squares) dependence on temperature
difference between the air outflow and inflow. The average stack temperature and voltage on a
single MEA are maintained 850°C and 0.75 V respectively. The diameter of the input air pipe 18 d mm . The reference level is 850°C.
Page 12
A.U. SHARAFUTDINOV et al. 309
CHEMICAL PROBLEMS 2020 no. 3 (18)
Fig. 9 shows the dependence of the heat
energy amount taken in the stack by air on the
average air velocity in the air supply line. This
curve was obtained by variation of the air pipes
diameter keeping the volumetric air inflow rate
constant. The red line corresponds to inevitable
amount of energy needed to overcome viscous
wall friction of air within the reaction zone and
air distributors channels. The additional losses
grow as the flow velocity cubed (see Fig. 9).
For small pipe diameters they are primarily
caused by flow turning and expansion at the
header entrance and exit. As the pipe cross
section exceeds that of the header the pressure
losses at the header-microchannel transition
became dominant.
Fig. 9. The energy losses for pumping air through the stack on the average air velocity in the input
air pipe. Here d is the diameter of the input air pipe.
Let us note that the cross-section
averaged air pressure distribution along the
exhaust header is close to parabolic one (see
Fig. 10) as predicted by MCL (Eq. 3). However
the approximation of uniform velocity
distribution across the header cross section
prevents from quantitative agreement with the
theory: the normalization coefficients
22
h hN u u (in the notation of [15], where
... is averaging over the header cross section,
should be introduced. When using the effective
media approximation much attention should be
paid to the flow boundary conditions on the
interface between the headers and the stack
interior.
Page 13
308 SOLID OXIDE FUEL CELL STACK SIMULATION
CHEMICAL PROBLEMS 2020 no. 3 (18)
Fig. 10. Cross-section-averaged air pressure in the exhaust header on z for different air flows (the
exit is on the right). Also the MCL results [13] with 1.2N and the exact 2D simulation results are
presented.
One can see (Fig. 11) that the
inhomogeneity N grows with the
microchannel/header flow velocities ratio c hu u
. In the notations of [13] out becomes more
negative in the low flow velocity region of the
exhaust header. This means that the effective
media method leads to substantial errors in the
velocity distribution in this region. However due
to low velocities in this region the pressure
distribution is in reasonable agreement with
exact simulation results (see Fig. 10).
Let us note that experimental values of
1.15 1.25N from Fig 4 of [15] are close to
the results of effective media simulation despite
the scale differences.
Fig. 11. The flow inhomogeneity coefficient N on z-coordinate for the effective medium method
and exact 2D simulation in the exhaust header (the exit is on the right).
Page 14
A.U. SHARAFUTDINOV et al. 309
CHEMICAL PROBLEMS 2020 no. 3 (18)
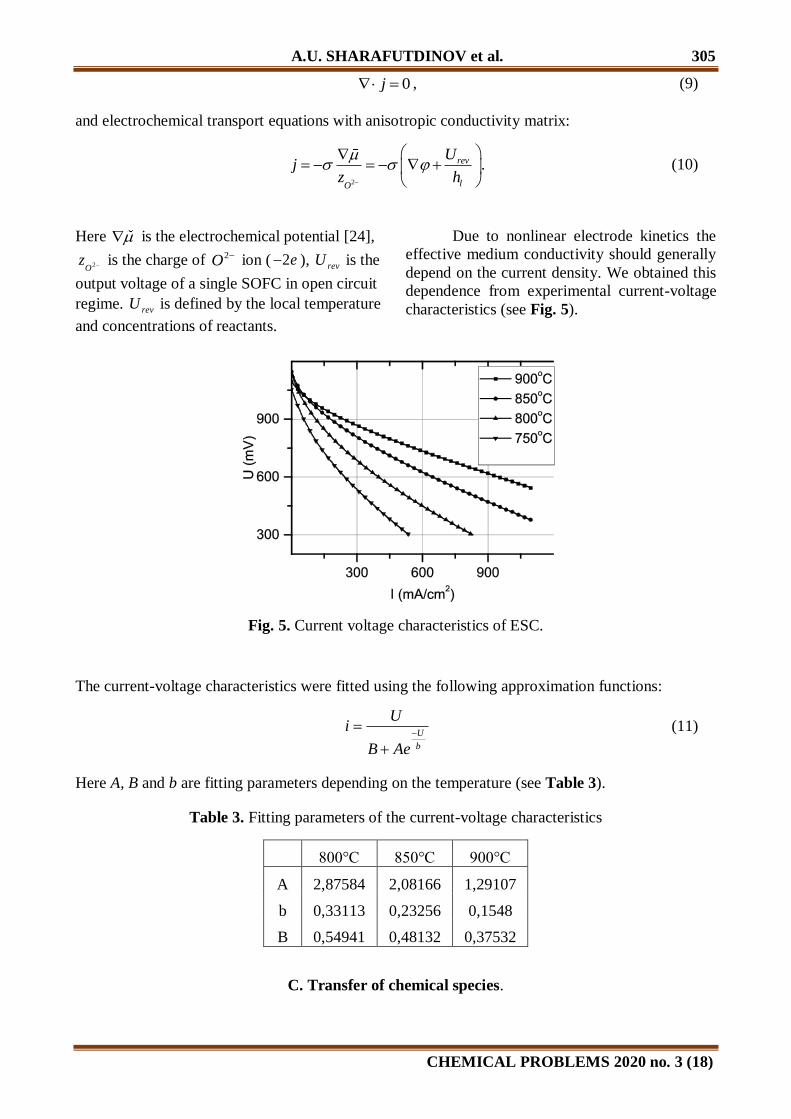
Fig. 12. The cross section averaged pressure on z-coordinate in the input header (the entrance is on
the right).
One should account for the pressure drop
in header-microchannel junctions hcP by
modification of boundary conditions in the
effective media model. In the exhaust header an
abrupt expansion occurs and one can use Borda-
Carnot equation 2 1out
hc cP u where cu
is the microchannel flow velocity, is the ratio
of the channel and header cross sections. In the
input header it is more difficult to find the
pressure drop due to the combination of turning
and expansion and due to the influence of the
neighboring microchannels flow. The naive
boundary condition of normal flow leads to
overestimated pressure values in the inlet header
since it assumes 0in . Expressions for t-
branching are not applicable, since the
microchannel flows are not independent.
Anyway the input pressure drop in
hcP profile
can be obtained using exact simulation of this
part of the stack. This additional work should be
attributed to the drawbacks of the effective
media method.
Let us note that according to MCL [13] one can
make the gas flow exactly uniform across the
stack choosing the ratio of the exhaust and input
header cross sections equal to 2 . The
uniformity is maintained for intermediate flow
velocities – high enough for viscous friction to
be negligible and low enough to prevent large-
scale vortices formation in the input header
(Fig. 12).
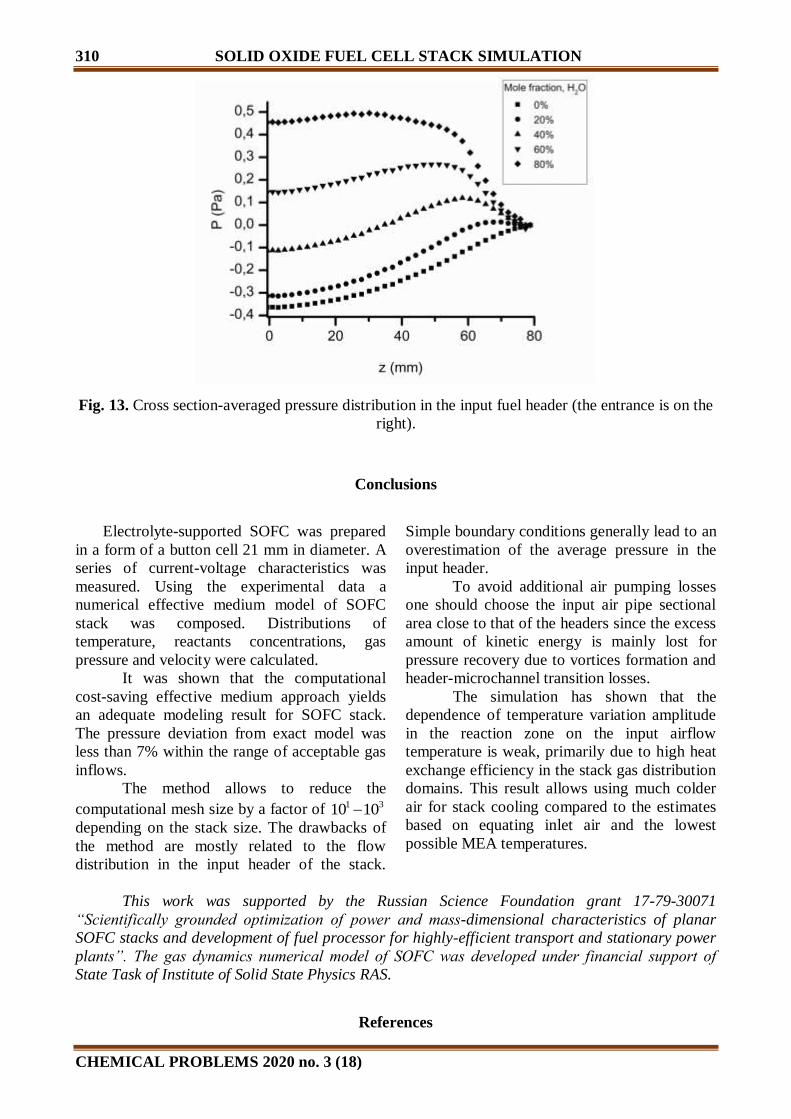
In the fuel headers the pressure
distribution can be determined either by the
viscous friction or by inertia depending on fuel
composition. One can see from Fig. 13 how the
air recovery arises as the density of fuel grows.
Thus it is impossible to make the fuel
distribution uniform by geometrical-only means
(see e.g. [27]) due to the natural fuel
composition volatility during the stack
operation. The pressure would be uniform only
for the single working point implying certain
temperature, fuel flow, current and stack
quality.
Page 15
310 SOLID OXIDE FUEL CELL STACK SIMULATION
CHEMICAL PROBLEMS 2020 no. 3 (18)
Fig. 13. Cross section-averaged pressure distribution in the input fuel header (the entrance is on the
right).
Conclusions
Electrolyte-supported SOFC was prepared
in a form of a button cell 21 mm in diameter. A
series of current-voltage characteristics was
measured. Using the experimental data a
numerical effective medium model of SOFC
stack was composed. Distributions of
temperature, reactants concentrations, gas
pressure and velocity were calculated.
It was shown that the computational
cost-saving effective medium approach yields
an adequate modeling result for SOFC stack.
The pressure deviation from exact model was
less than 7% within the range of acceptable gas
inflows.
The method allows to reduce the
computational mesh size by a factor of 1 310 10
depending on the stack size. The drawbacks of
the method are mostly related to the flow
distribution in the input header of the stack.
Simple boundary conditions generally lead to an
overestimation of the average pressure in the
input header.
To avoid additional air pumping losses
one should choose the input air pipe sectional
area close to that of the headers since the excess
amount of kinetic energy is mainly lost for
pressure recovery due to vortices formation and
header-microchannel transition losses.
The simulation has shown that the
dependence of temperature variation amplitude
in the reaction zone on the input airflow
temperature is weak, primarily due to high heat
exchange efficiency in the stack gas distribution
domains. This result allows using much colder
air for stack cooling compared to the estimates
based on equating inlet air and the lowest
possible MEA temperatures.
This work was supported by the Russian Science Foundation grant 17-79-30071
“Scientifically grounded optimization of power and mass-dimensional characteristics of planar
SOFC stacks and development of fuel processor for highly-efficient transport and stationary power
plants”. The gas dynamics numerical model of SOFC was developed under financial support of
State Task of Institute of Solid State Physics RAS.
References
Page 16
A.U. SHARAFUTDINOV et al. 313
CHEMICAL PROBLEMS 2020 no. 3 (18)
1. Isabella Burch J.G. A Survey on Global
Activity to Phase Out Internal Combustion
Engine Vehicles, Center for Climate
Protection, 2018.
https://climateprotection.org/wp-
content/uploads/2018/10/Survey-on-
Global-Activities-to-Phase-Out-ICE-
Vehicles-FINAL-Oct-3-2018.pdf. Accessed
14-May-2019.
2. Tokyo Aims to Realize “Hydrogen Society”
by 2020. We Are Tomodachi. 2016, vol. 14,
pp. 24–25.
3. Minh N.Q., Takahashi T. Science and
Technology of Ceramic Fuel Cells.
Burlington, Elsevier, 1995, 379 p.
4. Vielstich W., Lamm A., Gasteiger H.A.
Handbook of fuel cells. Chichester, Wiley,
2003, 488 p.
5. Bove R., Ubertini S. Modeling solid oxide
fuel cells. Great Britain, Springer, 2008,
397 p.
6. Tucker M.C. Progress in metal-supported
solid oxide fuel cells: A review. J. Power
Sources. 2010, vol. 195, pp. 4570–4582.
7. Cable T.L., Sofie S.W. A symmetrical,
planar SOFC design for NASA's high
specific power density requirements.
Journal of Power Sources. 2007, vol. 174,
pp. 221–227.
8. Thomas L Cable, John A Setlock, Serene C
Farmer. Method for making a fuel cell.
9. Ramadhani F., Hussain M.A., Mokhlis H.,
Hajimolana S. Optimization strategies for
Solid Oxide Fuel Cell (SOFC) application:
A literature survey. Renewable Sustainable
Energy Rev. 2017, vol. 76, pp. 460–484.
10. Liu H.-H., Cheng C.-H., Hsueh K.-L., Hong
C.-W. Modeling and design of air-side
manifolds and measurement on an
industrial 5-kW hydrogen fuel cell stack.
Int. J. Hydrogen Energy. 2017, vol. 42,
pp. 19216–19226.
11. Amiri A., Tang S., Vijay P., Tadé M.O.
Planar Solid Oxide Fuel Cell Modeling and
Optimization Targeting the Stack’s
Temperature Gradient Minimization. Ind.
Eng. Chem. Res. 2016, vol. 55, pp. 7446–
7455.
12. Inui Y., Ito N., Nakajima T., Urata A.
Analytical investigation on cell temperature
control method of planar solid oxide fuel
cell. Energy Convers. Manage. 2006, vol.
47, pp. 2319–2328.
13. Yuan P. Effect of inlet flow maldistribution
in the stacking direction on the performance
of a solid oxide fuel cell stack. Journal of
Power Sources. 2008, vol. 185, pp. 381–
391.
14. Koh J.-H., Seo H.-K., Lee C.G., Yoo Y.-S.,
Lim H.C. Pressure and flow distribution in
internal gas manifolds of a fuel-cell stack.
Journal of Power Sources. 2003, vol. 115,
pp. 54–65.
15. Bassiouny M.K., Martin H. Flow
distribution and pressure drop in plate heat
exchangers—I U-type arrangement. Chem.
Eng. Sci. 1984, vol. 39, pp. 693–700.
16. WANG J. Pressure drop and flow
distribution in parallel-channel
configurations of fuel cells: U-type
arrangement. Int. J. Hydrogen Energy.
2008, vol. 33, pp. 6339–6350.
17. Costamagna P., Arato E., Achenbach E.,
Reus U. Fluid dynamic study of fuel cell
devices: simulation and experimental
validation. Journal of Power Sources. 1994,
vol. 52, pp. 243–249.
18. Bajura R.A. A Model for Flow Distribution
in Manifolds. Journal of Engineering for
Power. 1971, vol. 93, pp. 7–12.
19. Chernyavsky B., Sui P.C., Jou B.S., Djilali
N. Turbulent flow in the distribution header
of a PEM fuel cell stack. Int. J. Hydrogen
Energy. 2011, vol. 36, pp. 7136–7151.
20. Maharudrayya S., Jayanti S., Deshpande
A.P. Flow distribution and pressure drop in
parallel-channel configurations of planar
fuel cells. Journal of Power Sources. 2005,
vol. 144, pp. 94–106.
21. Huang W.L., Zhu Q. Flow distribution in
U-type layers or stacks of planar fuel cells.
Journal of Power Sources. 2008, vol. 178,
pp. 353–362.
22. Greco F., Frandsen H.L., Nakajo A.,
Madsen M.F., van herle J. Modelling the
impact of creep on the probability of failure
of a solid oxide fuel cell stack. J. Eur.
Ceram. Soc. 2014, vol. 34, pp. 2695–2704.
23. Cheng H., Jing S., Xu Y., Deng Z., Li J., Li
X. Control-oriented modeling analysis and
optimization of planar solid oxide fuel cell
system. Int. J. Hydrogen Energy. 2016, vol.
41, pp. 22285–22304.
Page 17
312 SOLID OXIDE FUEL CELL STACK SIMULATION
CHEMICAL PROBLEMS 2020 no. 3 (18)
24. Bao C., Wang Y., Feng D., Jiang Z., Zhang
X. Macroscopic modeling of solid oxide
fuel cell (SOFC) and model-based control
of SOFC and gas turbine hybrid system.
Prog. Energy Combust. Sci. 2018, vol. 66,
pp. 83–140.
25. Burmistrov I., Agarkov D., Bredikhin S.,
Nepochatov Y., Tiunova O., Zadorozhnaya
O. Multilayered Electrolyte-Supported
SOFC Based on NEVZ-Ceramics
Membrane. ECS Trans. 2013, vol. 57,
pp. 917–923.
26. Burmistrov I., Drozhzhin O.A., Istomin
S.Y., Sinitsyn V.V., Antipov E.V.,
Bredikhin S.I. Sr0.75Y0.25Co0.5Mn0.5O3−y
Perovskite Cathode for Solid Oxide Fuel
Cells. J. Electrochem. Soc. 2009, vol. 156,
p. B1212.
27. Dickinson E.J.F., Ekström H., Fontes E.
COMSOL Multiphysics®: Finite element
software for electrochemical analysis. A
mini-review. Electrochem. Commun. 2014,
vol. 40, pp. 71–74.
28. Sudaprasert K., Travis R.P., Martinez-Botas
R.F. A Study of Temperature Distribution
Across a Solid Oxide Fuel Cell Stack. J.
Fuel Cell Sci. Technol. 2010, vol. 7,
p. 11002.
29. Kharton V.V. Solid state electrochemistry.
Weinheim, Chichester, Wiley-VCH, 2009-
2011, 506 p.
30. Wilke C.R. A Viscosity Equation for Gas
Mixtures. J. Chem. Phys. 1950, vol. 18,
pp. 517–519.
31. Jackson J.M., Hupert M.L., Soper S.A.
Discrete geometry optimization for
reducing flow non-uniformity, asymmetry,
and parasitic minor loss pressure drops in
Z-type configurations of fuel cells. Journal
of Power Sources. 2014, vol. 269, pp. 274–
283.
МУЛЬТИФИЗИЧЕСКОЕ МОДЕЛИРОВАНИЕ БАТАРЕИ ТВЕРДООКСИДНЫХ
ТОПЛИВНЫХ ЭЛЕМЕНТОВ В ПРИБЛИЖЕНИИ ЭФФЕКТИВНОЙ СРЕДЫ
А.У. Шарафутдинов1, Ю.С. Федотов
1, С.И. Бредихин
1
Федеральное государственное бюджетное учреждение науки
Институт физики твердого тела Российской академии наук,
142432, Россия, Черноголовка, Московская область, Академика Осипьяна, 2,
e-mail: [email protected]
Мембранно-электродный блок(МЭБ) NiO/10Sc1CeSZ/LSM был изготовен с помощью
технологии трафаретной печати. Был измерен ряд вольт-амперных характеристик. По
этим данным была построена численная модель батареи топливных элементов в ПО для
конечно-элементных расчетов COMSOL Multiphysics. Были найдены распределения
температур, концентраций реагентов, давления и скорости газов. Сравнением с
теоретическими закономерностями показано, что метод эффективной среды позволяет
адекватно моделировать поведение батареи топливных элементов, позволяя при этом
снизить размер расчетной сетки в 1 310 10 раз в зависимости от размера батареи. Было
обнаружено, что высокая эффективность теплообмена в газораспределительных зонах
батареи подавляет зависимость разброса температур в зоне реакции от температуры
втекающего в батарею воздуха. Это позволяет понизить количество воздуха,
используемого для охлаждения батареи, не увеличивая значительно градиентов
температуры в батарее.
Page 18
A.U. SHARAFUTDINOV et al. 313
CHEMICAL PROBLEMS 2020 no. 3 (18)
Ключевые слова: ТОТЭ, COMSOL, электролит-поддерживающая ячейка, батарея ТОТЭ,
вычислительная гидродинамика, эффективная среда
BƏRKOKSİD YANACAQ BATAREYANIN EFFEKTİV MÜHİT ŞƏRAİTİ ÜÇÜN
MULTİFİZİK MODELLƏŞDİRİLMƏSİ
A.U. Şərəfuddinov, Yu.S. Fedotov, S.İ. Bredixin
Bərk cisimlərin fizikası institutu
142432, Rusiya, Çernoqolovka şəh., akad. Osipyan küç., 2; e-mail: [email protected]
Bərkoksid yanacaq batareyanın NiO/10Sc1CeSZ/LSM membran-elektrod bloku trafaret çap usulu
ilə hazırlanıb. Bir sıra volt-amper xarakteristikalar təyin edilib və onlar əsasında yanacaq
batareyanın rəqəmsal modeli yaradılıb. Temperaturun, reagentlərin qatılığının, qazların təzyiq və
sürətinin paylanması müəyyən edilib. Göstərilib ki, effektiv mühit metodu yanacaq element
batareyalarının işləmə rejimini adekvat modelləşdirməyə imkan verir.
Açar sözlər: bərkoksid yanacaq batareyaları, volt-amper xarakteristikalar, membran-elektrod
bloku, effektiv mühit metodu