2. DEMOGRAPHIC TRANSITION India accounts for only 2.4 % of the world surface areas and yet it supports and sustains 16.2 % of the world population (Figure 2.1). In 1950, China with 21 % share of the population was the most populous country followed by India, which had a share of 14.2 %. It is estimated that by 2050, India will overtake China to become the most populous country with about 17.2 % of global population. A comparison of some demographic parameters between India and some of the neighboring countries is given in Table 2.1. China and Sri Lanka are far ahead of India in all these parameters. Figure 2.1: Population: India and the world Other Countries China India USA Indonesia Brazil Pakistan Russian Fed Bangladesh Japan Nigeria Source: Reference 2.2Demographic transition 1947-2007 Demographic transition is a global phenomenon. Demographers recognize four phases of demographic transition. In the first phase improved health care technologies and improved access to health care result in reduction in mortality rates but, birth rate continues to be high and therefore population growth occurs. In the second there is reduction in birth rate but the reduction in death rate is higher than reduction in birth rate, as a result population increases. In the third phase, birth rates and death rates are both low; however population growth continues because of a large number of individuals in the reproductive age group. In the fourth phase the Table 2.1: Some demographic parameters: India and its neighbors Country Life expectancy at birth (years) Under-five mortality rate (per 1000 live births) Infant mortality rate (per 1000 live births) Maternal mortality ratio (per 100,000 live births) 2000-05 1990 2004 1990 2004 2004 China 71 49 31 38 26 51 India 63 123 85 80 62* 540* Nepal 61 145 76 100 59 740 Pakistan 63 128 101 96 80 530 Sri Lanka 74 23 14 19 12 92 Bangladesh 63 144 77 96 56 380 South Asia 63 126 84 84 62 NA NA: Not available* Figures shown for India are at variance with off icial figures of the Office of Registrar General of India for MMR and IMR. Data shown in the table are as per t he methodology and adjustment made by UNDP. Source: Reference 2.27
India accounts for only 2.4 % of theworld surface areas and yet it
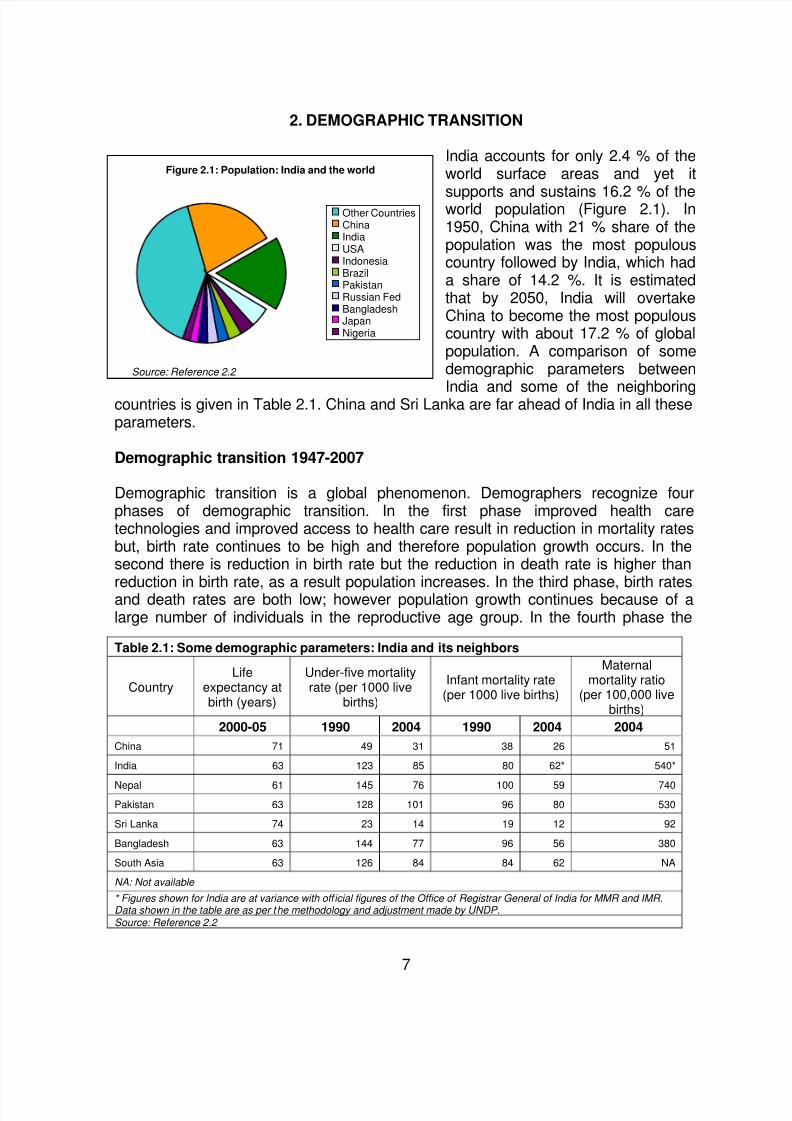
supports and sustains 16.2 % of theworld population (Figure 2.1). In1950, China with 21 % share of thepopulation was the most populouscountry followed by India, which hada share of 14.2 %. It is estimatedthat by 2050, India will overtakeChina to become the most populouscountry with about 17.2 % of globalpopulation. A comparison of somedemographic parameters between
India and some of the neighboringcountries is given in Table 2.1. China and Sri Lanka are far ahead of India in all theseparameters.
Figure 2.1: Population: India and the world
Other CountriesChinaIndiaUSAIndonesiaBrazilPakistanRussian FedBangladeshJapanNigeria
Source: Reference 2.2
Demographic transition 1947-2007
Demographic transition is a global phenomenon. Demographers recognize fourphases of demographic transition. In the first phase improved health caretechnologies and improved access to health care result in reduction in mortality ratesbut, birth rate continues to be high and therefore population growth occurs. In thesecond there is reduction in birth rate but the reduction in death rate is higher than
reduction in birth rate, as a result population increases. In the third phase, birth ratesand death rates are both low; however population growth continues because of alarge number of individuals in the reproductive age group. In the fourth phase the
Table 2.1: Some demographic parameters: India and its neighbors
CountryLife
expectancy atbirth (years)
Under-five mortalityrate (per 1000 live
births)
Infant mortality rate(per 1000 live births)
Maternalmortality ratio
(per 100,000 livebirths)
2000-05 1990 2004 1990 2004 2004
China 71 49 31 38 26 51
India 63 123 85 80 62* 540*
Nepal 61 145 76 100 59 740
Pakistan 63 128 101 96 80 530
Sri Lanka 74 23 14 19 12 92
Bangladesh 63 144 77 96 56 380
South Asia 63 126 84 84 62 NA
NA: Not available
* Figures shown for India are at variance with off icial figures of the Office of Registrar General of India for MMR and IMR.Data shown in the table are as per the methodology and adjustment made by UNDP.Source: Reference 2.2
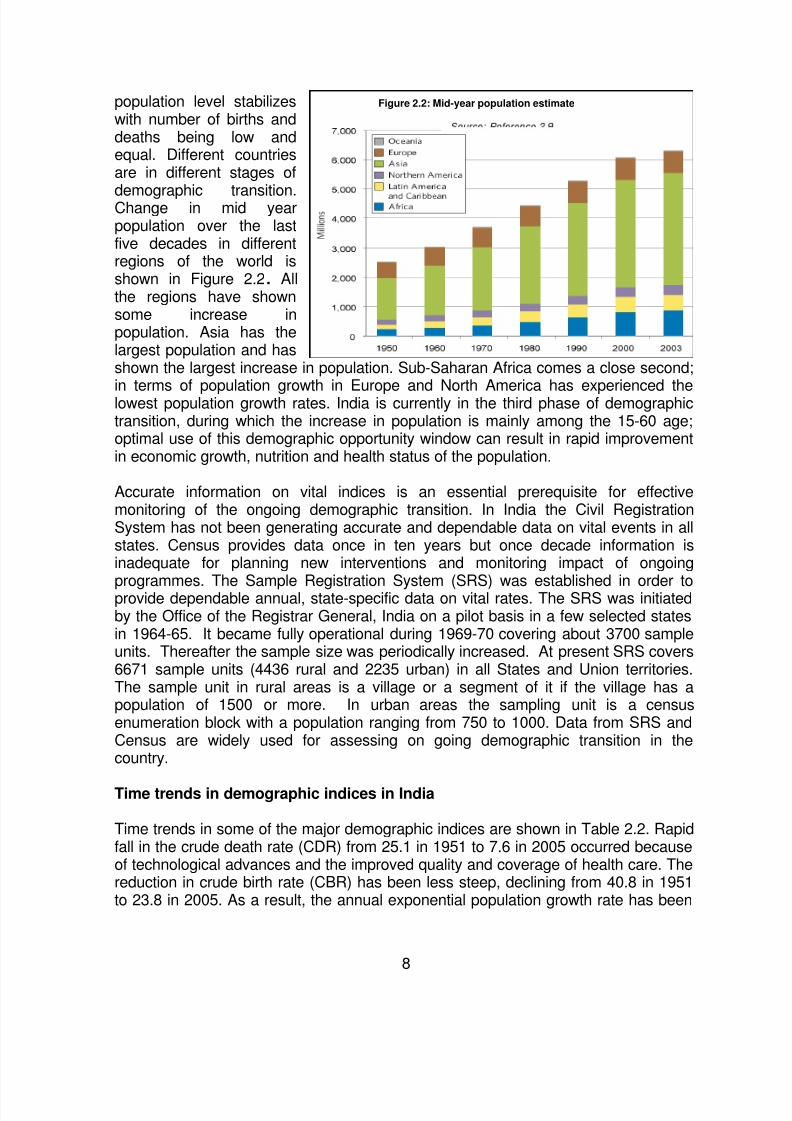
Figure 2.2: Mid-year population estimatepopulation level stabilizeswith number of births anddeaths being low andequal. Different countriesare in different stages of
demographic transition.Change in mid yearpopulation over the lastfive decades in differentregions of the world isshown in Figure 2.2. Allthe regions have shownsome increase inpopulation. Asia has thelargest population and hasshown the largest increase in population. Sub-Saharan Africa comes a close second;
in terms of population growth in Europe and North America has experienced thelowest population growth rates. India is currently in the third phase of demographictransition, during which the increase in population is mainly among the 15-60 age;optimal use of this demographic opportunity window can result in rapid improvementin economic growth, nutrition and health status of the population.
Accurate information on vital indices is an essential prerequisite for effectivemonitoring of the ongoing demographic transition. In India the Civil RegistrationSystem has not been generating accurate and dependable data on vital events in allstates. Census provides data once in ten years but once decade information isinadequate for planning new interventions and monitoring impact of ongoingprogrammes. The Sample Registration System (SRS) was established in order toprovide dependable annual, state-specific data on vital rates. The SRS was initiatedby the Office of the Registrar General, India on a pilot basis in a few selected statesin 1964-65. It became fully operational during 1969-70 covering about 3700 sampleunits. Thereafter the sample size was periodically increased. At present SRS covers6671 sample units (4436 rural and 2235 urban) in all States and Union territories.The sample unit in rural areas is a village or a segment of it if the village has apopulation of 1500 or more. In urban areas the sampling unit is a censusenumeration block with a population ranging from 750 to 1000. Data from SRS andCensus are widely used for assessing on going demographic transition in thecountry.
Time trends in demographic indices in India
Time trends in some of the major demographic indices are shown in Table 2.2. Rapidfall in the crude death rate (CDR) from 25.1 in 1951 to 7.6 in 2005 occurred becauseof technological advances and the improved quality and coverage of health care. Thereduction in crude birth rate (CBR) has been less steep, declining from 40.8 in 1951to 23.8 in 2005. As a result, the annual exponential population growth rate has been
over 2 % in the 1971-1991 periods (Table 2.2). The 1991 Census showed that thepopulation growth rate had fallen below 2 % after three decades (Figure 2.3). CensusTable 2.2: India selected- health indicators
2001 confirmed that the pace of demographic transition in India has been steadyeven though it is slow and that the India has joined China as the populationbillionaire. Demographic profile of India from Census 2001 is given in Annexure 2.1.As of 2006, India’s population is 1112 million. There are 25 million births and 2.3million under five deaths in the country. Life expectancy is 65.4 years.
Decadal growth: 1991-2001
The population of India, which at the turn of the twentieth century, was only around238 million increased by over four times to reach 1027 million by 2001. Thepopulation grew by one and half times in the first half of the twentieth century, while
in the next fifty years it recorded a three-fold increase. In absolute terms, thepopulation of India during the decade 1991-2001 increased by a 180.6 million, morethan the estimated population of Brazil, the fifth most populous country in the world.
Figure 2.3: Demographic transition in India
0
20
40
60
80
100
120
1951 1961 1971 1981 1991 2001
I n C r o r e s
051015
202530354045
T F R / D e a t h
r a t e / B i r t h r a t e
Population (in crores)TFR
Crude Death Rate Crude Birth Rate
Source: Reference 2.8
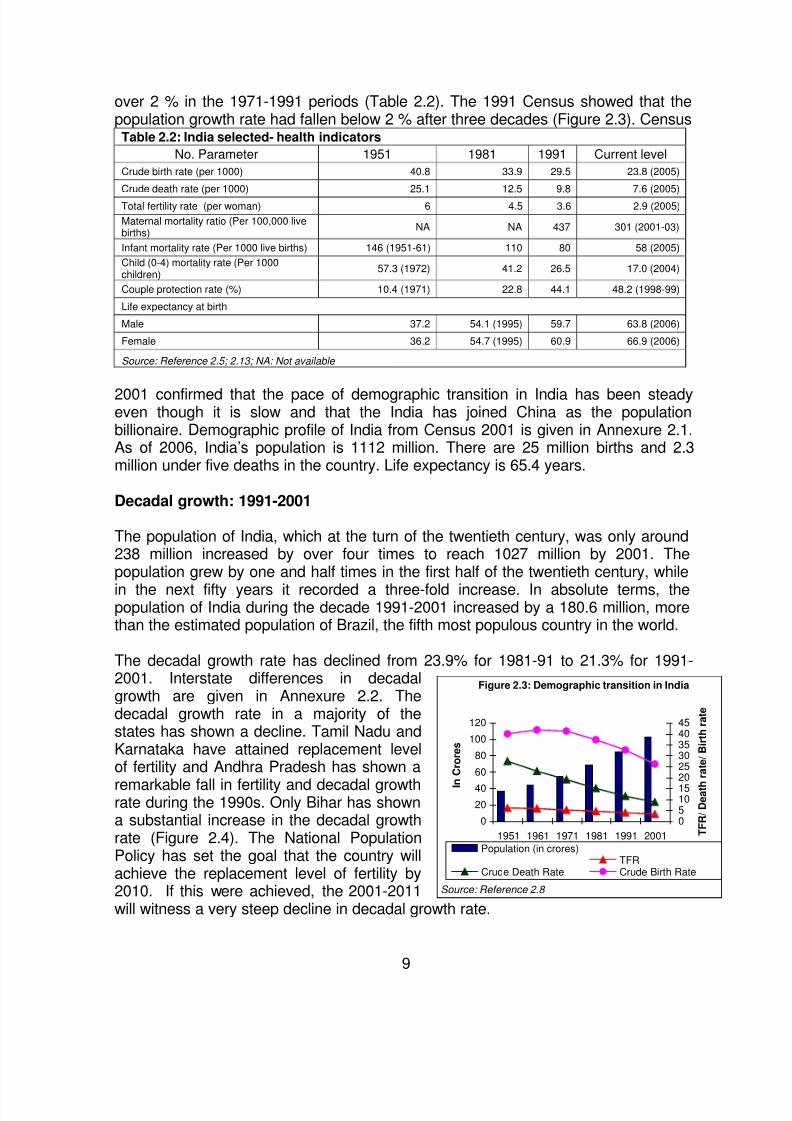
The decadal growth rate has declined from 23.9% for 1981-91 to 21.3% for 1991-2001. Interstate differences in decadalgrowth are given in Annexure 2.2. Thedecadal growth rate in a majority of thestates has shown a decline. Tamil Nadu andKarnataka have attained replacement levelof fertility and Andhra Pradesh has shown a
remarkable fall in fertility and decadal growthrate during the 1990s. Only Bihar has showna substantial increase in the decadal growthrate (Figure 2.4). The National PopulationPolicy has set the goal that the country willachieve the replacement level of fertility by2010. If this were achieved, the 2001-2011will witness a very steep decline in decadal growth rate.
Figure 2.4: Interstatedifferences in Decadal Growth Rate
0
5
10
15
20
25
30
K E
T N
A P
O R
K A
W B
A S
P U
I N D I A
G U J
M H
M P
U P
H R
R A
B H
P e r c e n t
1981-1991 1991-2001Source: Reference 2. 5
In India, the proportion of children in the age group of 0-6 years decreased from 18%
in 1991 to 15% in 2001. A fairly strong positive relationship exists betweenpercentage of child population in the age group 0-6 years and the level of fertility. In1991 only four states/Union Territories had child population less than fourteen %; in2001 the number of the states and Union Territories with child population less than14% is sixteen. This is indicative of a fairly wide spread fall in fertility across manystates/Union Territories.
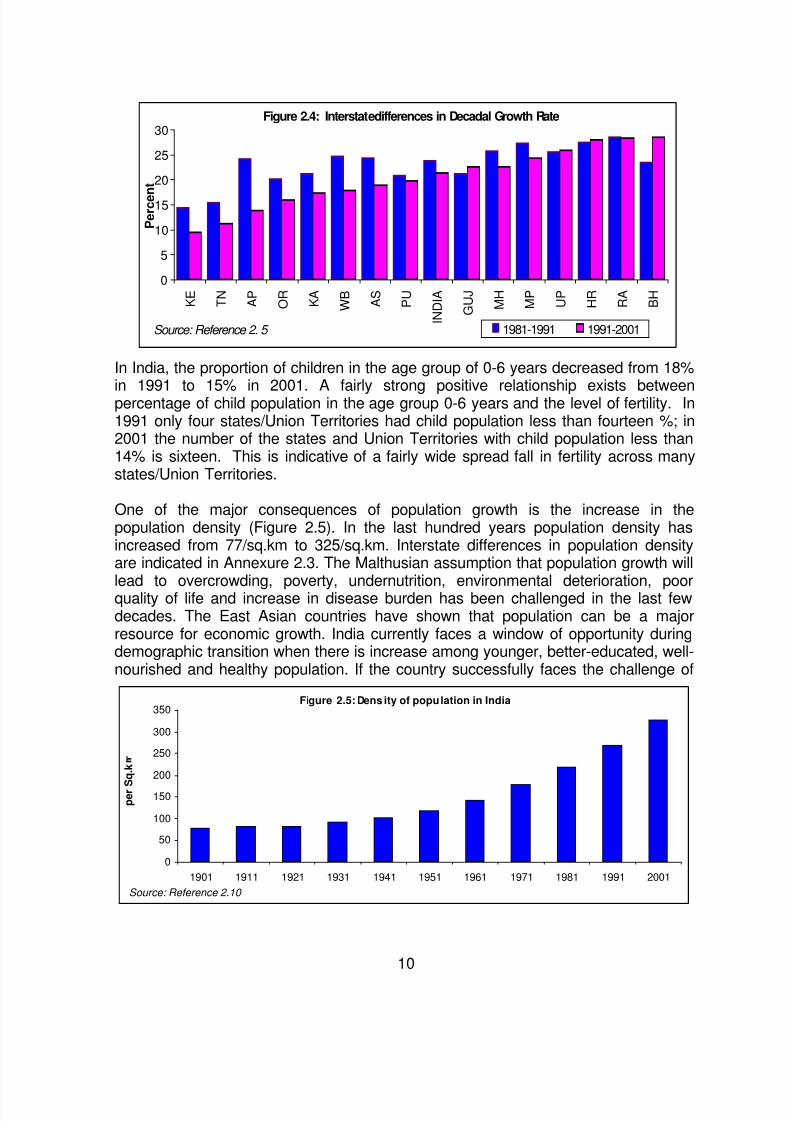
One of the major consequences of population growth is the increase in thepopulation density (Figure 2.5). In the last hundred years population density hasincreased from 77/sq.km to 325/sq.km. Interstate differences in population densityare indicated in Annexure 2.3. The Malthusian assumption that population growth willlead to overcrowding, poverty, undernutrition, environmental deterioration, poorquality of life and increase in disease burden has been challenged in the last fewdecades. The East Asian countries have shown that population can be a majorresource for economic growth. India currently faces a window of opportunity duringdemographic transition when there is increase among younger, better-educated, well-nourished and healthy population. If the country successfully faces the challenge of
Industrialized countriesDeveloping countriesLeast developed countriesWorld
Source : Referene 2.11
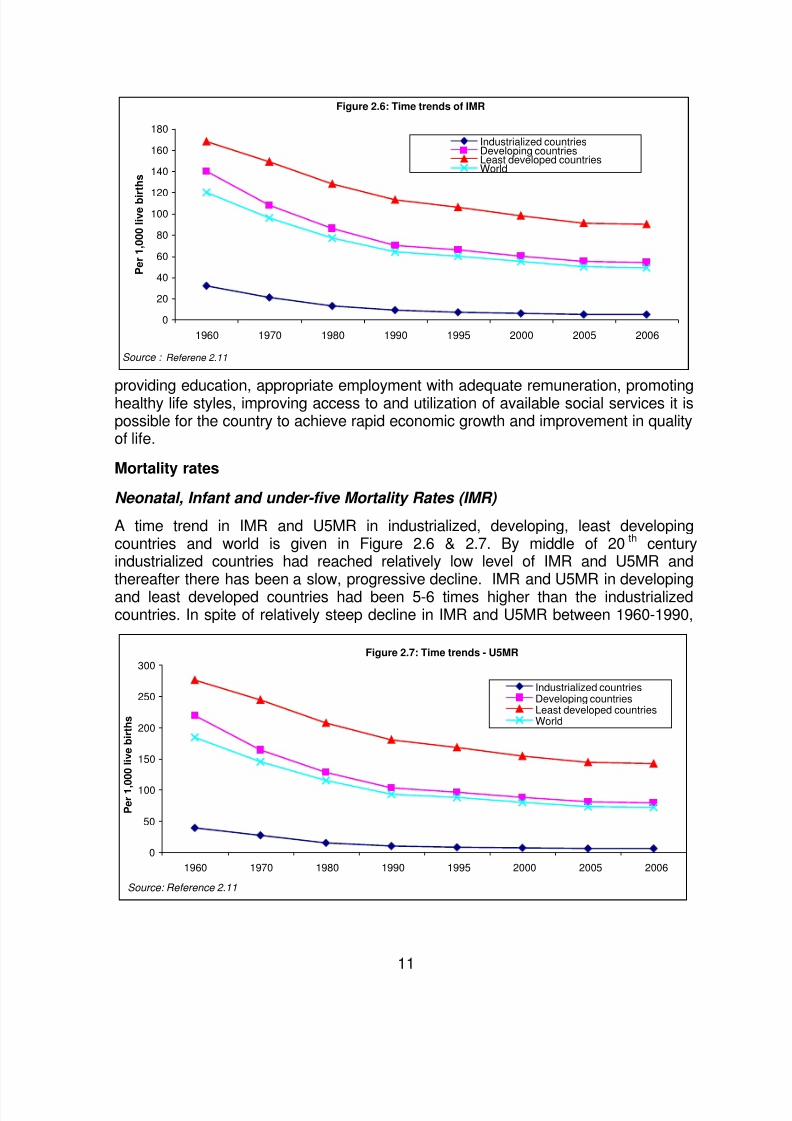
providing education, appropriate employment with adequate remuneration, promotinghealthy life styles, improving access to and utilization of available social services it ispossible for the country to achieve rapid economic growth and improvement in qualityof life.
Mortality rates
Neonatal, Infant and under-five Mortality Rates (IMR)
A time trend in IMR and U5MR in industrialized, developing, least developingcountries and world is given in Figure 2.6 & 2.7. By middle of 20th centuryindustrialized countries had reached relatively low level of IMR and U5MR andthereafter there has been a slow, progressive decline. IMR and U5MR in developingand least developed countries had been 5-6 times higher than the industrializedcountries. In spite of relatively steep decline in IMR and U5MR between 1960-1990,
Figure 2.7: Time trends - U5MR
0
50
100
150
200
250
300
1960 1970 1980 1990 1995 2000 2005 2006
P e r 1 , 0 0 0 l i v e b i r t h s
Industrialized countriesDeveloping countriesLeast developed countriesWorld
Sub-Saharan AfricaEastern and Southern AfricaWest and Central AfricaMiddle East and North Africa
Source: Reference 2.11
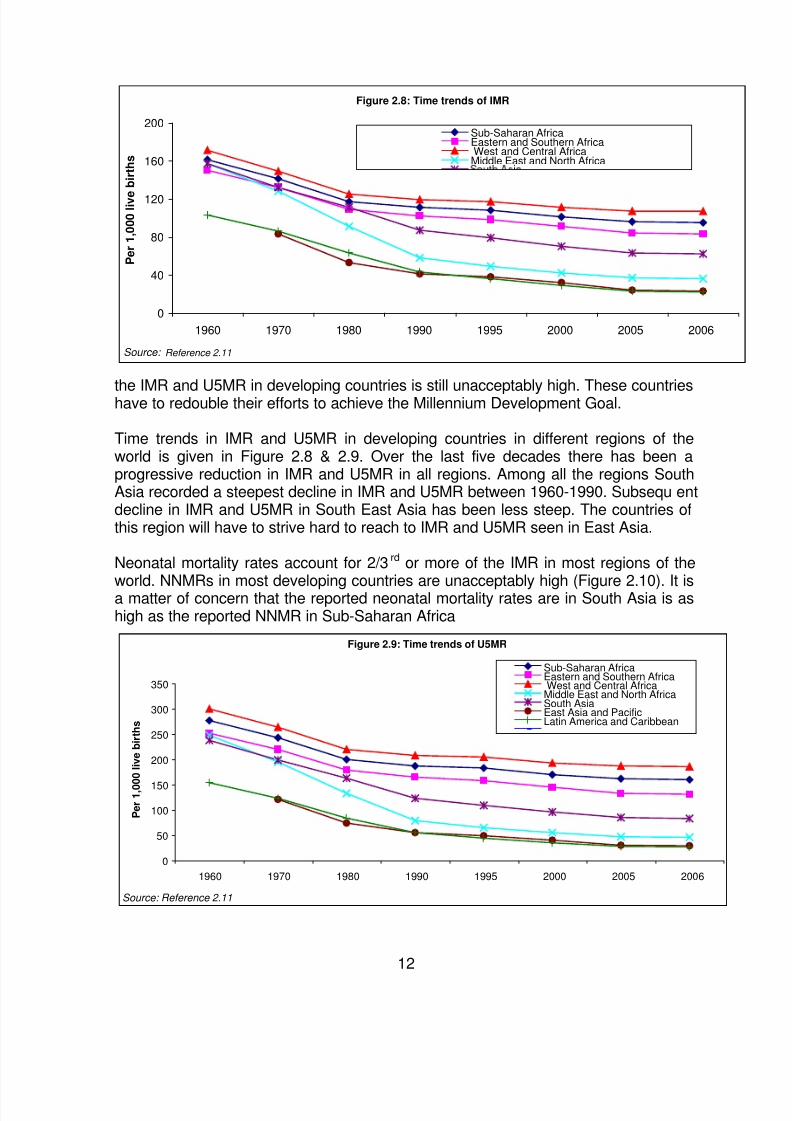
the IMR and U5MR in developing countries is still unacceptably high. These countries
entecline in IMR and U5MR in South East Asia has been less steep. The countries of
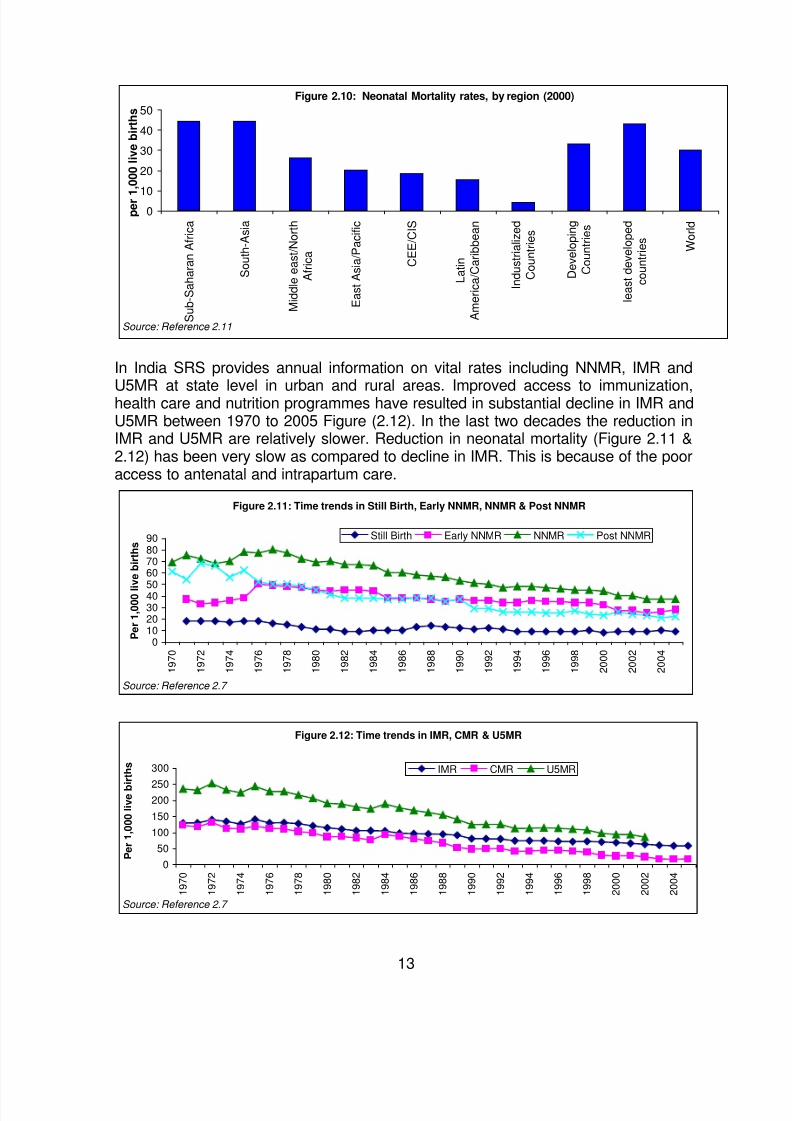
world. NNMRs in most developing countries are unacceptably high (Figure 2.10). It is
have to redouble their efforts to achieve the Millennium Development Goal.
Time trends in IMR and U5MR in developing countries in different regions of theworld is given in Figure 2.8 & 2.9. Over the last five decades there has been aprogressive reduction in IMR and U5MR in all regions. Among all the regions SouthAsia recorded a steepest decline in IMR and U5MR between 1960-1990. Subsequdthis region will have to strive hard to reach to IMR and U5MR seen in East Asia.
Neonatal mortality rates account for 2/3rd or more of the IMR in most regions of the
a matter of concern that the reported neonatal mortality rates are in South Asia is ashigh as the reported NNMR in Sub-Saharan Africa
Figure 2.9: Time trends of U5MR
0
50
100
150
200
250
300
350
12
1960 1970 1980 1990 1995 2000 2005 2006
P e r 1 , 0 0 0 l i v e b i r t h s
Sub-Saharan AfricaEastern and Southern AfricaWest and Central Africa
Middle East and North AfricaSouth AsiaEast Asia and PacificLatin America and Caribbean
Figure 2.10: Neonatal Mortality rates, by region (2000)
010
20
30
40
50
p e r 1 , 0 0 0 l i v e b i r t h s
S u b - S a h a r a n A f r i c a
S o u t h - A s i a
M i d d l e e a s t / N o r t h
A f r i c a
E a s t A s i a / P a c i f i c
C E E / C I S
L a t i n
A m e r i c a / C a r i b b e a n
I n d u s t r i a l i z e d
C o u n t r i e s
D e v e l o p i n g
C o u n t r i e s
l e a s t d e v e l o p e d
c o u n t r i e s
W o r l d
Source: Reference 2.11
In India SRS provides annual information on vital rates including NNMR, IMR and
U5MR at state level in urban and rural areas. Improved access to immunization,health care and nutrition programmes have resulted in substantial decline in IMR andU5MR between 1970 to 2005 Figure (2.12). In the last two decades the reduction in
R and U5MR are relatively slower. Reduction in neonatal mortality (Figure 2.11 &IM2.12) has been very slow as compared to decline in IMR. This is because of the pooraccess to antenatal and intrapartum care.
Figure 2.11: Time trends in Still Birth, Early NNMR, NNMR & Post NNMR
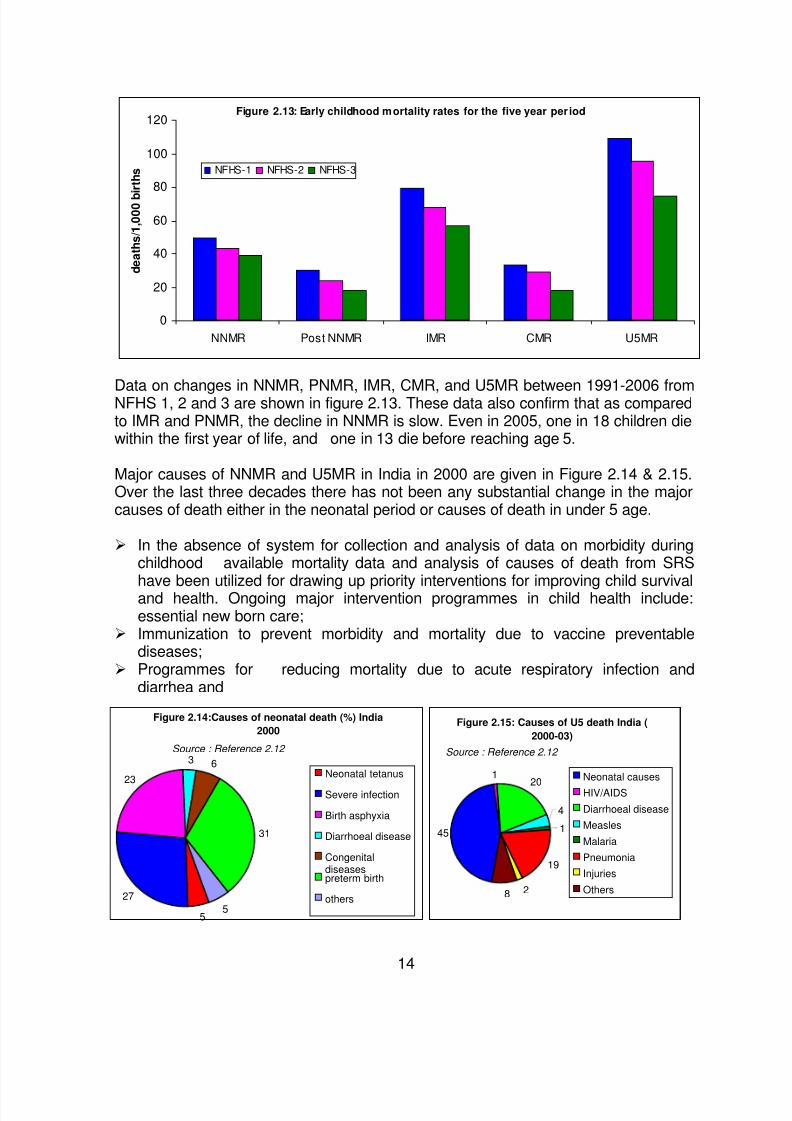
Figure 2.13: Early childhood mortality rates for the five year per iod
0
20
40
60
80
100
120
NNMR Post NNMR IMR CMR U5MR
d e a t h s / 1 , 0
0 0 b
i r t h s NFHS-1 NFHS-2 NFHS-3
Data on changes in NNMR, PNMR, IMR, CMR, and U5MR between 1991-2006 fromNFHS 1, 2 and 3 are shown in figure 2.13. These data also confirm that as comparedto IMR and PNMR, the decline in NNMR is slow. Even in 2005, one in 18 children diewithin the first year of life, and one in 13 die before reaching age 5.
Major causes of NNMR and U5MR in India in 2000 are given in Figure 2.14 & 2.15.Over the last three decades there has not been any substantial change in the majorcauses of death either in the neonatal period or causes of death in under 5 age.
In the absence of system for collection and analysis of data on morbidity duringchildhood available mortality data and analysis of causes of death from SRShave been utilized for drawing up priority interventions for improving child survivaland health. Ongoing major intervention programmes in child health include:essential new born care;
Immunization to prevent morbidity and mortality due to vaccine preventablediseases;
Programmes for reducing mortality due to acute respiratory infection anddiarrhea and
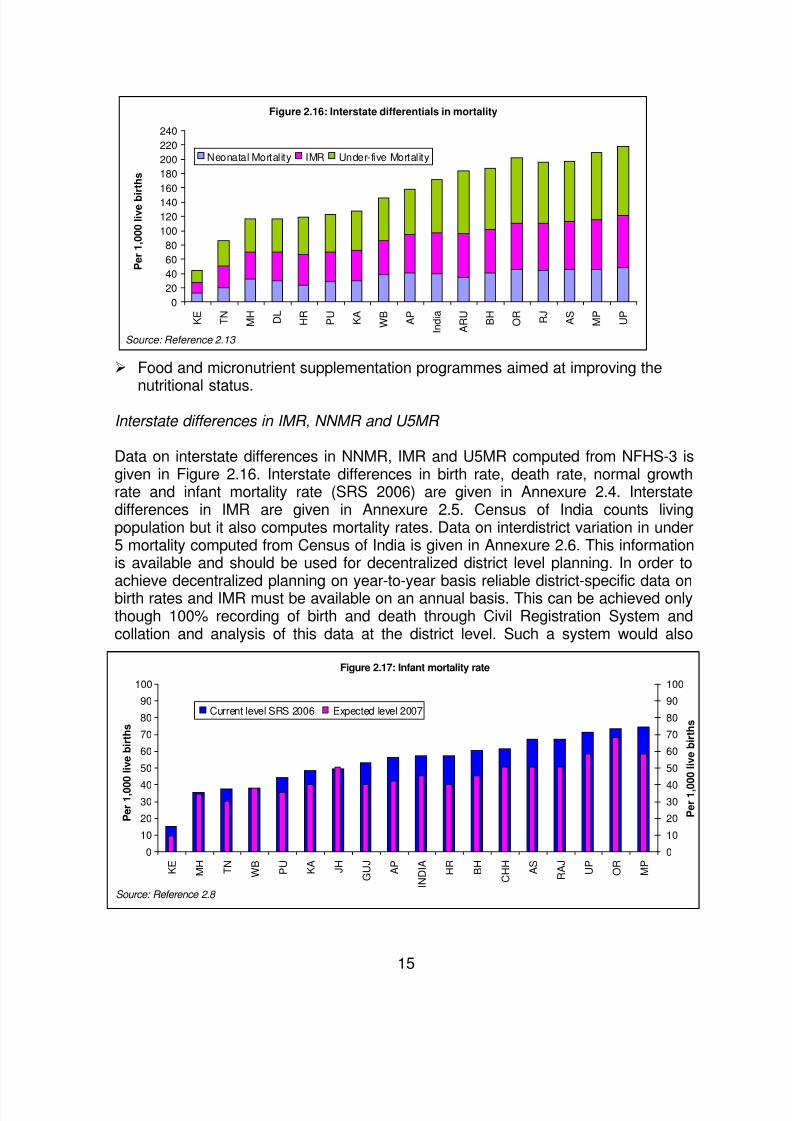
Figure 2.16: Interstate differentials in mortality
0
20
40
60
80
100
120
140
160
180
200
220
240
K E
T N
M H
D L
H R
P U
K A
W B
A P
I n d i a
A R U
B H
O R
R J
A S
M P
U P
P e r 1 , 0 0 0 l i v e b i r t h s
Neonatal Mortality IMR Under-five Mortality
Source: Reference 2.13
Food and micronutrient supplementation programmes aimed at improving the
nutritional status.
Interstate differences in IMR, NNMR and U5MR
Data on interstate differences in NNMR, IMR and U5MR computed from NFHS-3 isgiven in Figure 2.16. Interstate differences in birth rate, death rate, normal growthrate and infant mortality rate (SRS 2006) are given in Annexure 2.4. Interstatedifferences in IMR are given in Annexure 2.5. Census of India counts livingpopulation but it also computes mortality rates. Data on interdistrict variation in under5 mortality computed from Census of India is given in Annexure 2.6. This informationis available and should be used for decentralized district level planning. In order toachieve decentralized planning on year-to-year basis reliable district-specific data onbirth rates and IMR must be available on an annual basis. This can be achieved onlythough 100% recording of birth and death through Civil Registration System andcollation and analysis of this data at the district level. Such a system would also
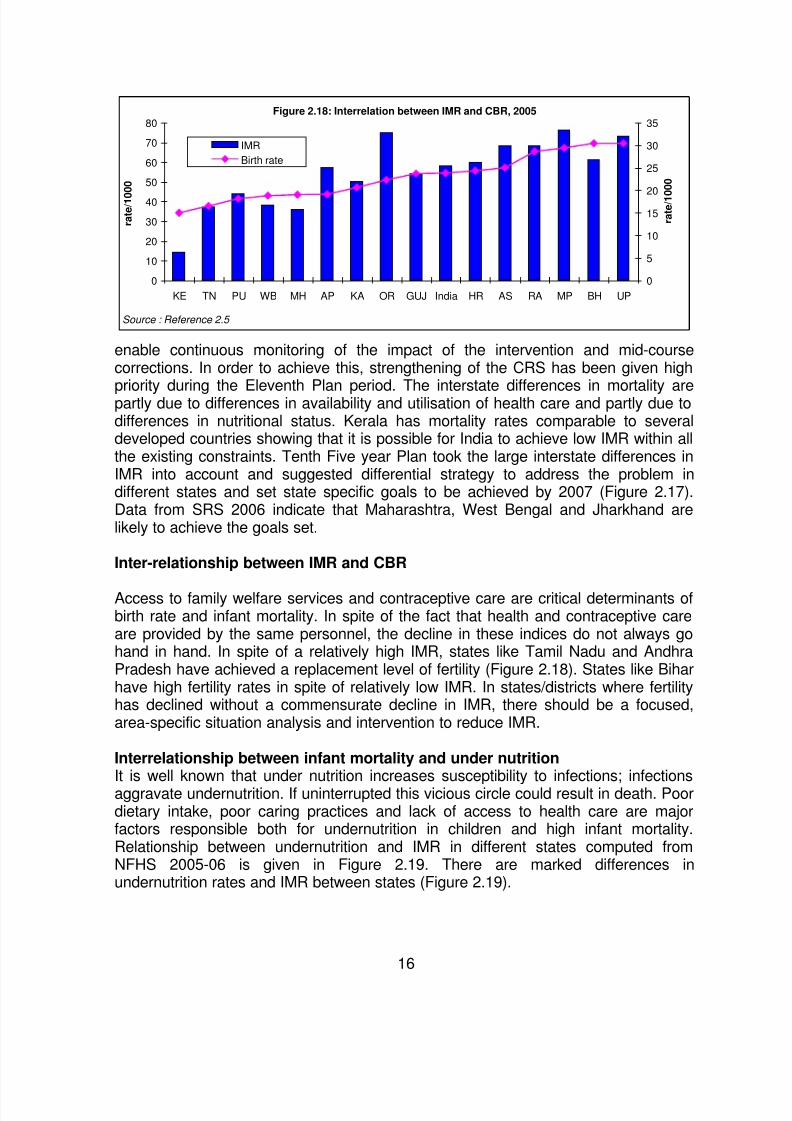
Figure 2.18: Interrelation between IMR and CBR, 2005
0
10
20
30
40
50
60
70
80
KE TN PU WB MH AP KA OR GUJ India HR AS RA MP BH UP
r a t e / 1 0
0 0
0
5
10
15
20
25
30
35
r a t e / 1 0 0 0
IMR
Birth rate
Source : Reference 2.5
enable continuous monitoring of the impact of the intervention and mid-coursecorrections. In order to achieve this, strengthening of the CRS has been given high
priority during the Eleventh Plan period. The interstate differences in mortality arepartly due to differences in availability and utilisation of health care and partly due todifferences in nutritional status. Kerala has mortality rates comparable to severaldeveloped countries showing that it is possible for India to achieve low IMR within allthe existing constraints. Tenth Five year Plan took the large interstate differences inIMR into account and suggested differential strategy to address the problem indifferent states and set state specific goals to be achieved by 2007 (Figure 2.17).Data from SRS 2006 indicate that Maharashtra, West Bengal and Jharkhand arelikely to achieve the goals set.
Inter-relationship between IMR and CBR
Access to family welfare services and contraceptive care are critical determinants ofbirth rate and infant mortality. In spite of the fact that health and contraceptive careare provided by the same personnel, the decline in these indices do not always gohand in hand. In spite of a relatively high IMR, states like Tamil Nadu and AndhraPradesh have achieved a replacement level of fertility (Figure 2.18). States like Biharhave high fertility rates in spite of relatively low IMR. In states/districts where fertilityhas declined without a commensurate decline in IMR, there should be a focused,area-specific situation analysis and intervention to reduce IMR.
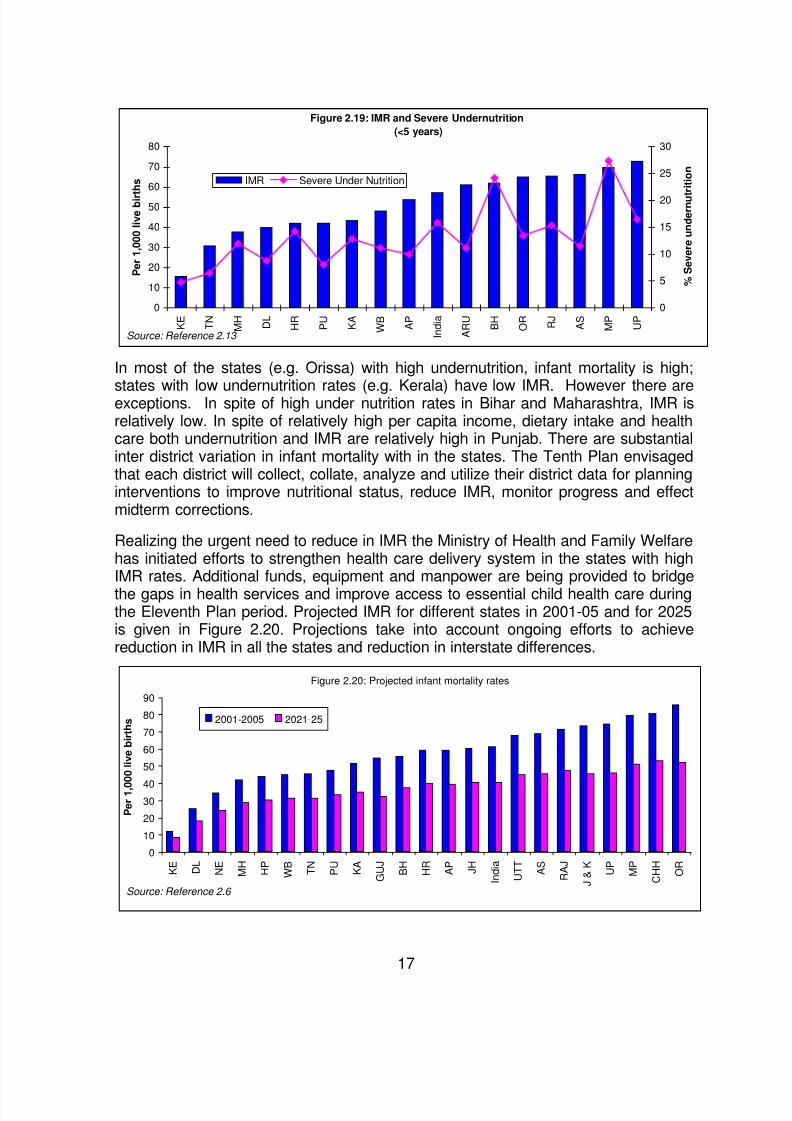
Interrelationship between infant mortality and under nutritionIt is well known that under nutrition increases susceptibility to infections; infectionsaggravate undernutrition. If uninterrupted this vicious circle could result in death. Poordietary intake, poor caring practices and lack of access to health care are majorfactors responsible both for undernutrition in children and high infant mortality.Relationship between undernutrition and IMR in different states computed fromNFHS 2005-06 is given in Figure 2.19. There are marked differences inundernutrition rates and IMR between states (Figure 2.19).
In most of the states (e.g. Orissa) with high undernutrition, infant mortality is high;
states with low undernutrition rates (e.g. Kerala) have low IMR. However there areexceptions. In spite of high under nutrition rates in Bihar and Maharashtra, IMR isrelatively low. In spite of relatively high per capita income, dietary intake and healthcare both undernutrition and IMR are relatively high in Punjab. There are substantialinter district variation in infant mortality with in the states. The Tenth Plan envisagedthat each district will collect, collate, analyze and utilize their district data for planninginterventions to improve nutritional status, reduce IMR, monitor progress and effectmidterm corrections.
Realizing the urgent need to reduce in IMR the Ministry of Health and Family Welfarehas initiated efforts to strengthen health care delivery system in the states with highIMR rates. Additional funds, equipment and manpower are being provided to bridge
the gaps in health services and improve access to essential child health care duringthe Eleventh Plan period. Projected IMR for different states in 2001-05 and for 2025is given in Figure 2.20. Projections take into account ongoing efforts to achievereduction in IMR in all the states and reduction in interstate differences.
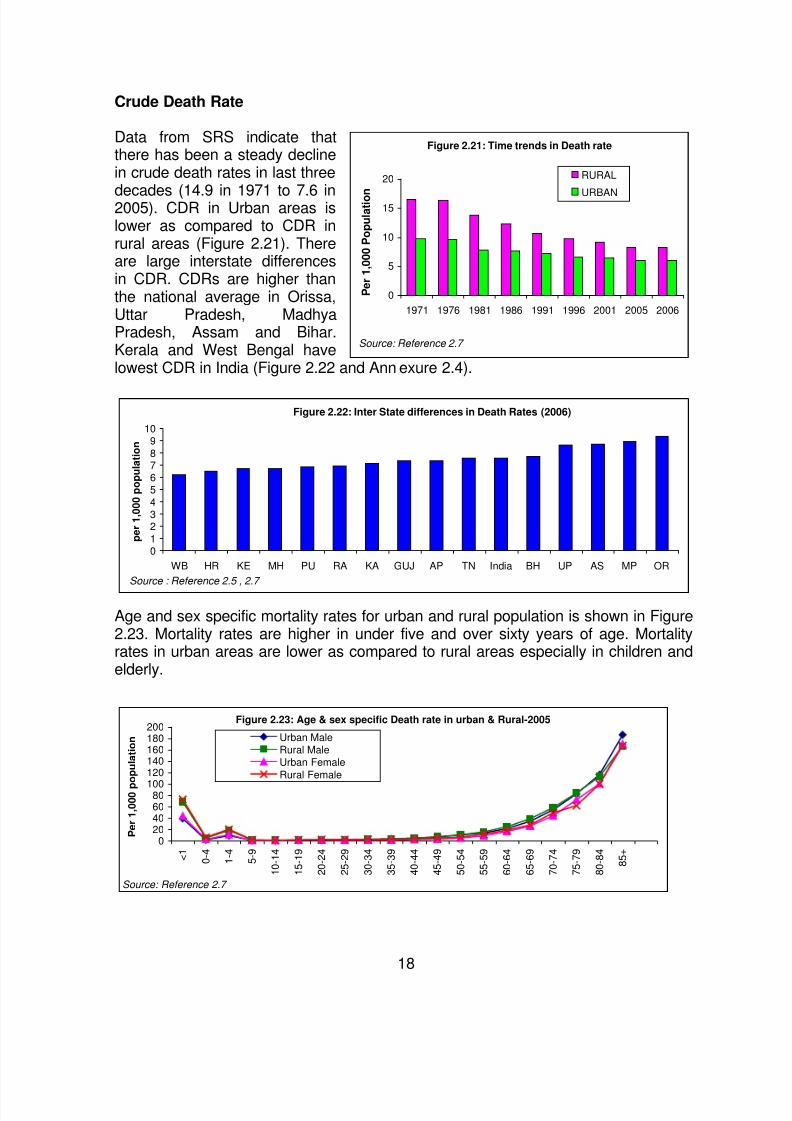
Data from SRS indicate thatthere has been a steady declinein crude death rates in last three
decades (14.9 in 1971 to 7.6 in2005). CDR in Urban areas islower as compared to CDR inrural areas (Figure 2.21). Thereare large interstate differencesin CDR. CDRs are higher thanthe national average in Orissa,Uttar Pradesh, MadhyaPradesh, Assam and Bihar.Kerala and West Bengal havelowest CDR in India (Figure 2.22 and Ann
Figure 2.21: Time trends in Death rate
0
5
10
15
20
1971 1976 1981 1986 1991 1996 2001 2005 2006
P e r 1 , 0 0 0 P o p u l a t i o n
RURAL
URBAN
Source: Reference 2.7
exure 2.4).
Figure 2.22: Inter State differences in Death Rates (2006)
0123456789
10
WB HR KE MH PU RA KA GUJ AP TN India BH UP AS MP OR
p e r 1 , 0 0 0 p o p u l a t i o n
Source : Reference 2.5 , 2.7
Age and sex specific mortality rates for urban and rural population is shown in Figure2.23. Mortality rates are higher in under five and over sixty years of age. Mortalityrates in urban areas are lower as compared to rural areas especially in children andelderly.
Figure 2.23: Age & sex specific Death rate in urban & Rural-2005
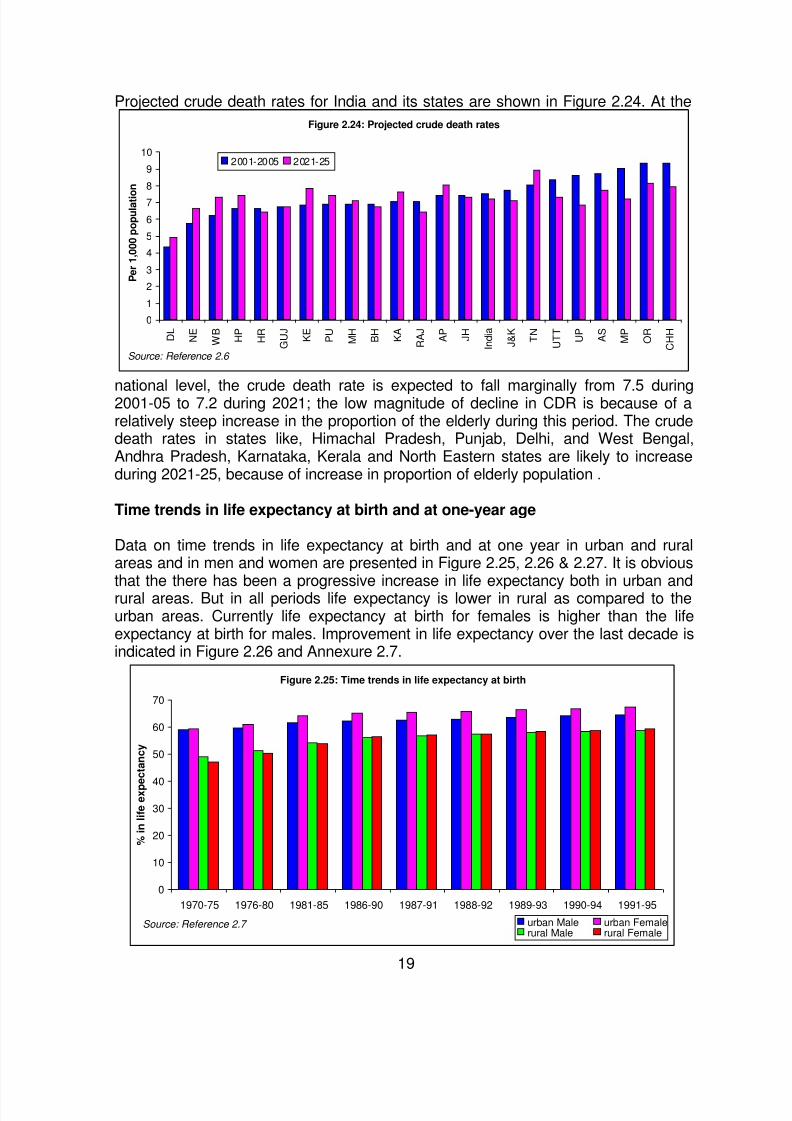
Projected crude death rates for India and its states are shown in Figure 2.24. At the
national level, the crude death rate is expected to fall marginally from 7.5 during2001-05 to 7.2 during 2021; the low magnitude of decline in CDR is because of arelatively steep increase in the proportion of the elderly during this period. The crudedeath rates in states like, Himachal Pradesh, Punjab, Delhi, and West Bengal,Andhra Pradesh, Karnataka, Kerala and North Eastern states are likely to increaseduring 2021-25, because of increase in proportion of elderly population.
Figure 2.24: Projected crude death rates
0
1
2
3
4
5
6
7
8
9
10
D L
N E
W B
H P
H R
G U J
K E
P U
M H
B H
K A
R A J
A P
J H
I n d i a
J & K
T N
U T T
U P
A S
M P
O R
C H H
P e r 1 , 0 0 0 p o p u l a t i o n
2001-2005 2021-25
Source: Reference 2.6
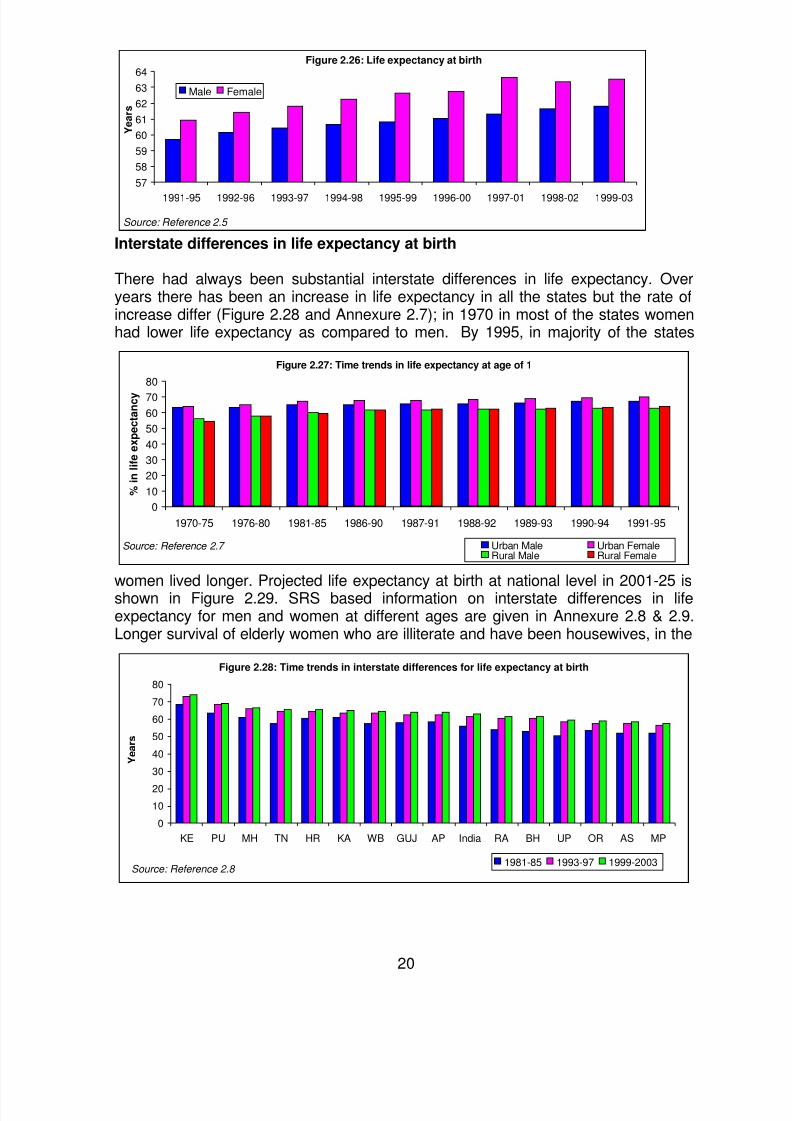
Time trends in life expectancy at birth and at one-year age
Data on time trends in life expectancy at birth and at one year in urban and ruralareas and in men and women are presented in Figure 2.25, 2.26 & 2.27. It is obviousthat the there has been a progressive increase in life expectancy both in urban andrural areas. But in all periods life expectancy is lower in rural as compared to theurban areas. Currently life expectancy at birth for females is higher than the lifeexpectancy at birth for males. Improvement in life expectancy over the last decade isindicated in Figure 2.26 and Annexure 2.7.
Figure 2.25: Time trends in life expectancy at birth
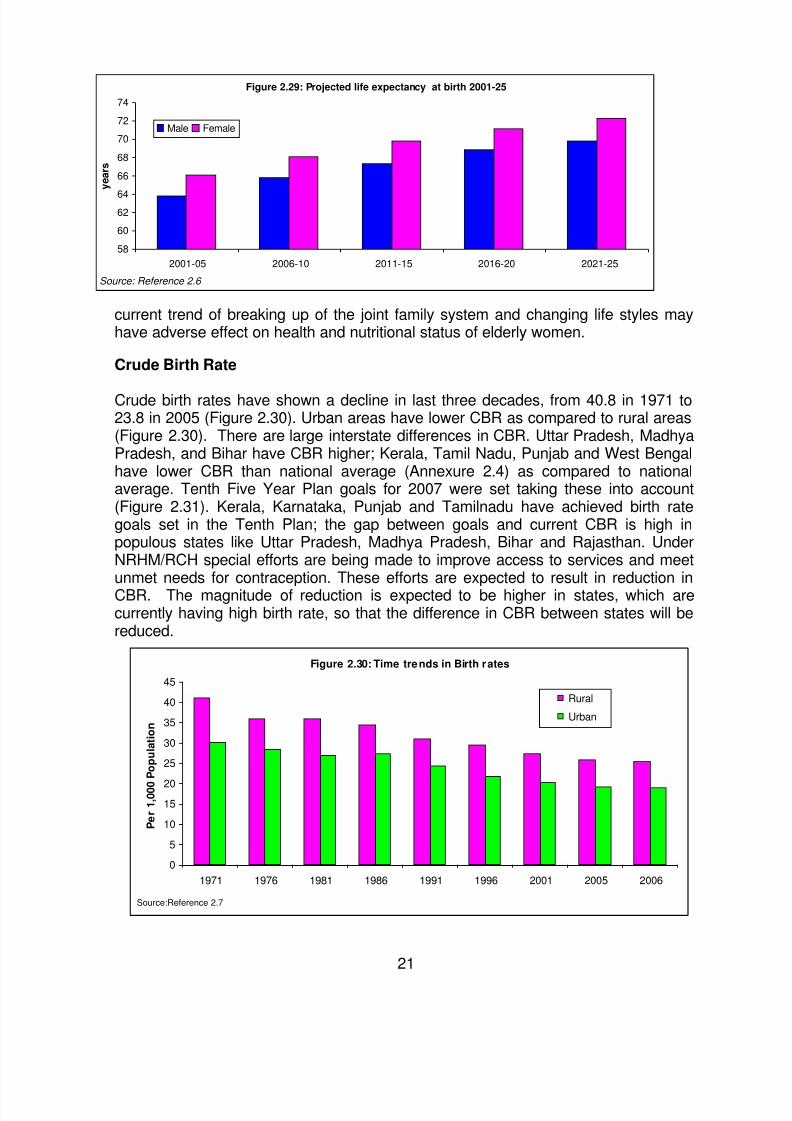
Interstate differences in life expectancy at birth
There had always been substantial interstate differences in life expectancy. Overyears there has been an increase in life expectancy in all the states but the rate ofincrease differ (Figure 2.28 and Annexure 2.7); in 1970 in most of the states womenhad lower life expectancy as compared to men. By 1995, in majority of the states
women lived longer. Projected life expectancy at birth at national level in 2001-25 isshown in Figure 2.29. SRS based information on interstate differences in lifeexpectancy for men and women at different ages are given in Annexure 2.8 & 2.9.Longer survival of elderly women who are illiterate and have been housewives, in the
Figure 2.27: Time trends in life expectancy at age of 1
Figure 2.29: Projected life expectancy at birth 2001-25
58
60
6264
66
68
70
72
74
2001-05 2006-10 2011-15 2016-20 2021-25
y e a r s
Male Female
Source: Reference 2.6
current trend of breaking up of the joint family system and changing life styles mayhave adverse effect on health and nutritional status of elderly women.
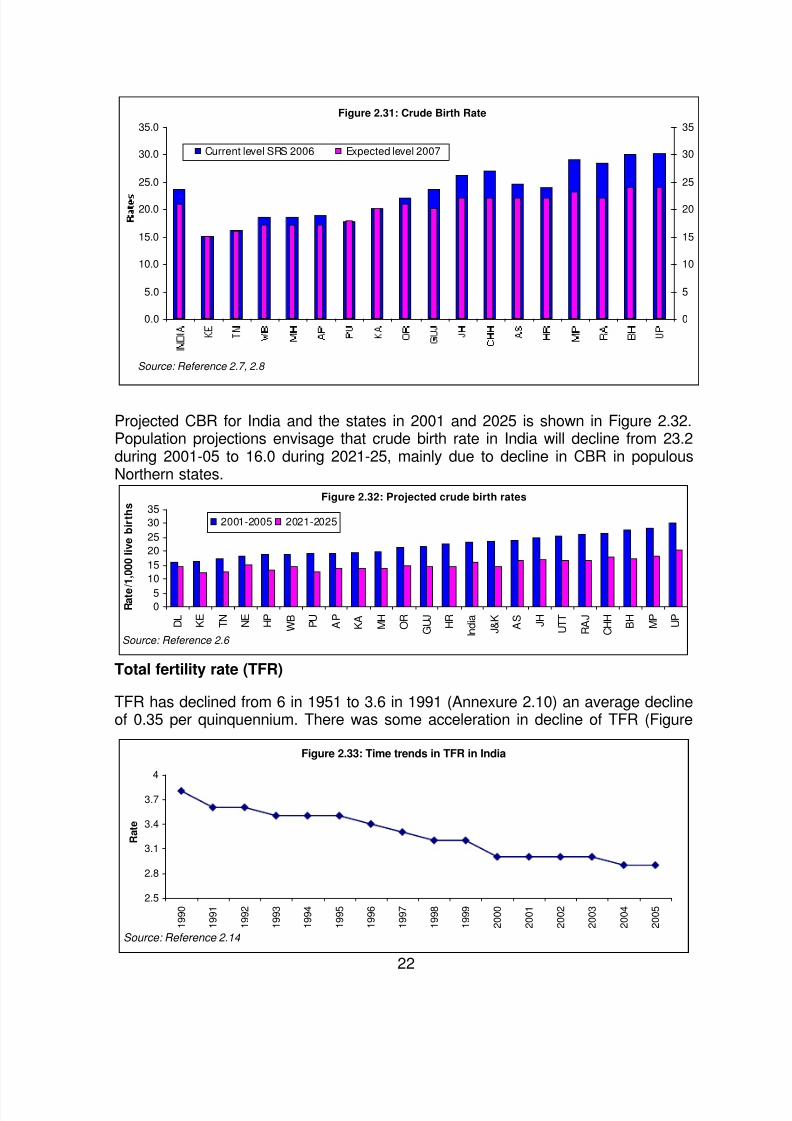
Crude Birth Rate
Crude birth rates have shown a decline in last three decades, from 40.8 in 1971 to23.8 in 2005 (Figure 2.30). Urban areas have lower CBR as compared to rural areas(Figure 2.30). There are large interstate differences in CBR. Uttar Pradesh, MadhyaPradesh, and Bihar have CBR higher; Kerala, Tamil Nadu, Punjab and West Bengalhave lower CBR than national average (Annexure 2.4) as compared to nationalaverage. Tenth Five Year Plan goals for 2007 were set taking these into account(Figure 2.31). Kerala, Karnataka, Punjab and Tamilnadu have achieved birth rategoals set in the Tenth Plan; the gap between goals and current CBR is high inpopulous states like Uttar Pradesh, Madhya Pradesh, Bihar and Rajasthan. UnderNRHM/RCH special efforts are being made to improve access to services and meetunmet needs for contraception. These efforts are expected to result in reduction inCBR. The magnitude of reduction is expected to be higher in states, which arecurrently having high birth rate, so that the difference in CBR between states will bereduced.
Projected CBR for India and the states in 2001 and 2025 is shown in Figure 2.32.Population projections envisage that crude birth rate in India will decline from 23.2during 2001-05 to 16.0 during 2021-25, mainly due to decline in CBR in populousNorthern states.
Figure 2.32: Projected crude birth rates
0
5
10
15
20
25
30
35
D L
K E
T N
N E
H P
W B
P U
A P
K A
M H
O R
G U J
H R
I n d i a
J & K
A S J H
U T T
R A J
C H H
B H
M P
U P
R a t e / 1 , 0
0 0 l i v e b i r t h s
2001-2005 2021-2025
Source: Reference 2.6
Total fertility rate (TFR)
TFR has declined from 6 in 1951 to 3.6 in 1991 (Annexure 2.10) an average declineof 0.35 per quinquennium. There was some acceleration in decline of TFR (Figure
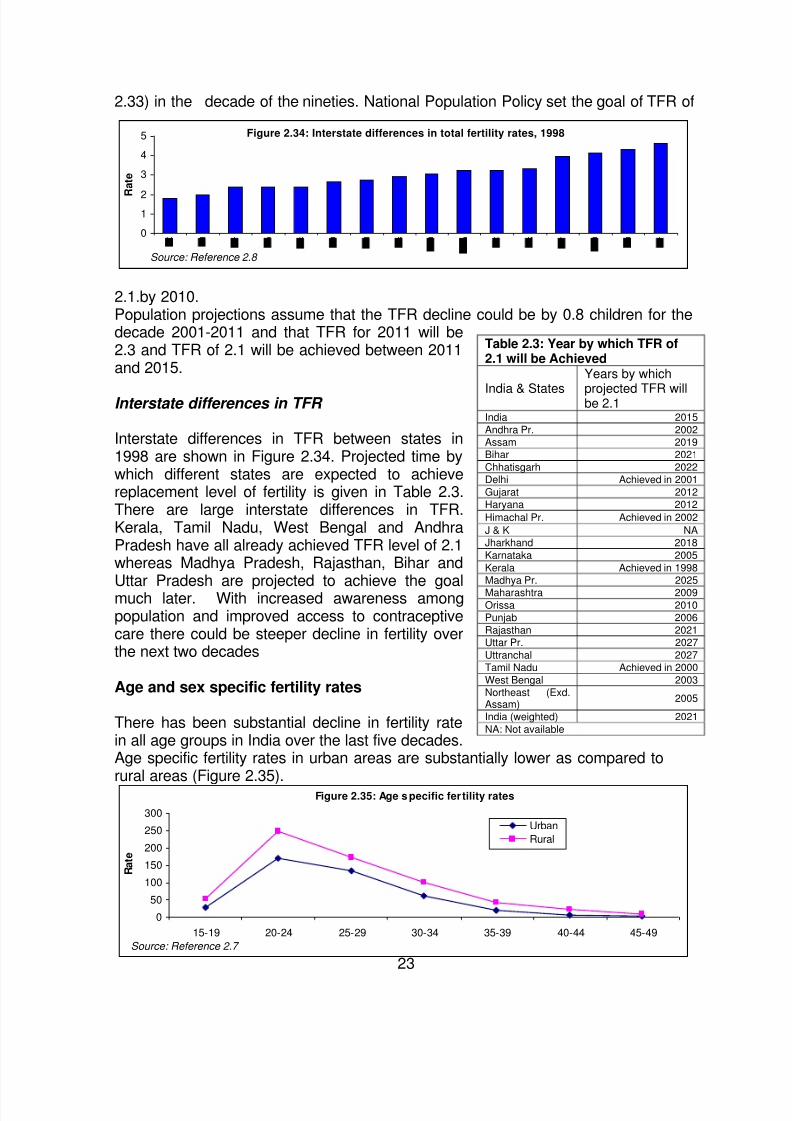
Figure 2.34: Interstate differences in total fertility rates, 1998
0
1
2
3
4
5
Source: Reference 2.8
R a t e
2.33) in the decade of the nineties. National Population Policy set the goal of TFR of
2.1.by 2010.Population projections assume that the TFR decline could be by 0.8 children for thedecade 2001-2011 and that TFR for 2011 will be2.3 and TFR of 2.1 will be achieved between 2011and 2015.
Interstate differences in TFR
Interstate differences in TFR between states in1998 are shown in Figure 2.34. Projected time bywhich different states are expected to achievereplacement level of fertility is given in Table 2.3.There are large interstate differences in TFR.Kerala, Tamil Nadu, West Bengal and AndhraPradesh have all already achieved TFR level of 2.1whereas Madhya Pradesh, Rajasthan, Bihar andUttar Pradesh are projected to achieve the goalmuch later. With increased awareness amongpopulation and improved access to contraceptivecare there could be steeper decline in fertility overthe next two decades
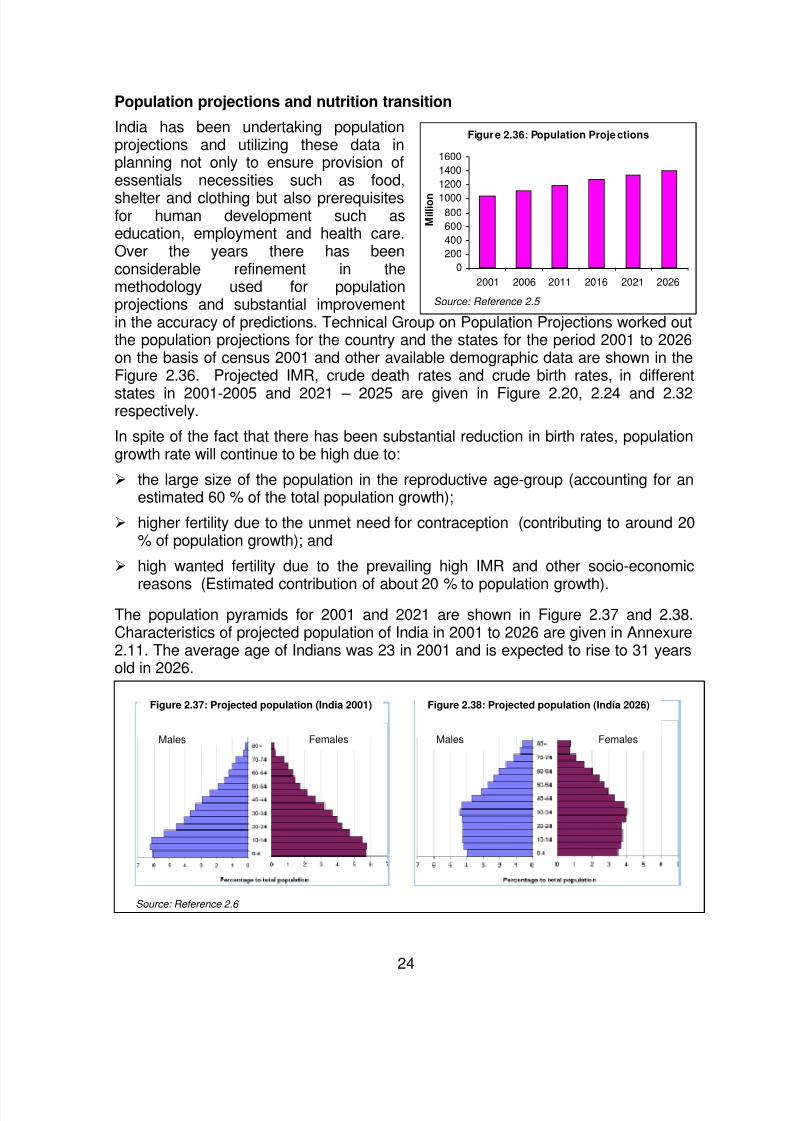
Age and sex specific fertility rates
There has been substantial decline in fertility ratein all age groups in India over the last five decades.Age specific fertility rates in urban areas are substantially lower as compared torural areas (Figure 2.35).
Table 2.3: Year by which TFR of2.1 will be Achieved
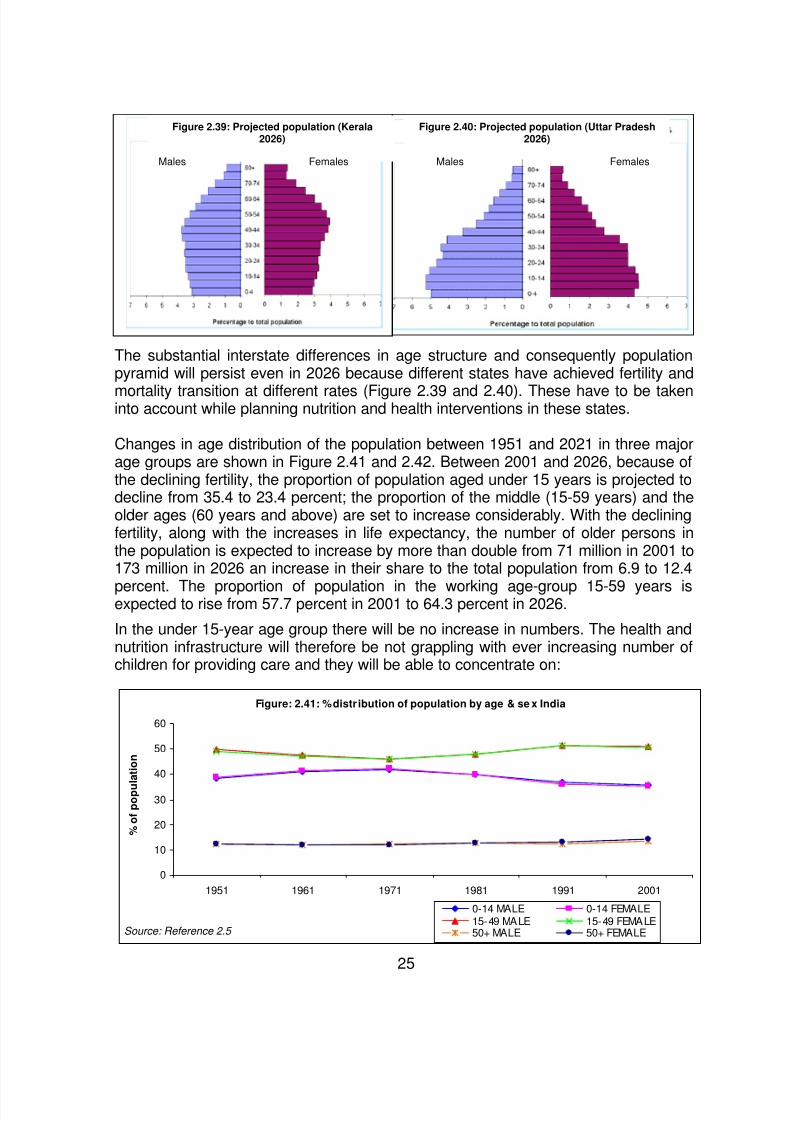
India has been undertaking populationprojections and utilizing these data inplanning not only to ensure provision ofessentials necessities such as food,
shelter and clothing but also prerequisitesfor human development such aseducation, employment and health care.Over the years there has beenconsiderable refinement in themethodology used for populationprojections and substantial improvementin the accuracy of predictions. Technical Group on Population Projections worked outthe population projections for the country and the states for the period 2001 to 2026on the basis of census 2001 and other available demographic data are shown in theFigure 2.36. Projected IMR, crude death rates and crude birth rates, in different
states in 2001-2005 and 2021 – 2025 are given in Figure 2.20, 2.24 and 2.32respectively.
In spite of the fact that there has been substantial reduction in birth rates, populationgrowth rate will continue to be high due to:
the large size of the population in the reproductive age-group (accounting for anestimated 60 % of the total population growth);
higher fertility due to the unmet need for contraception (contributing to around 20% of population growth); and
high wanted fertility due to the prevailing high IMR and other socio-economic
reasons (Estimated contribution of about 20 % to population growth).
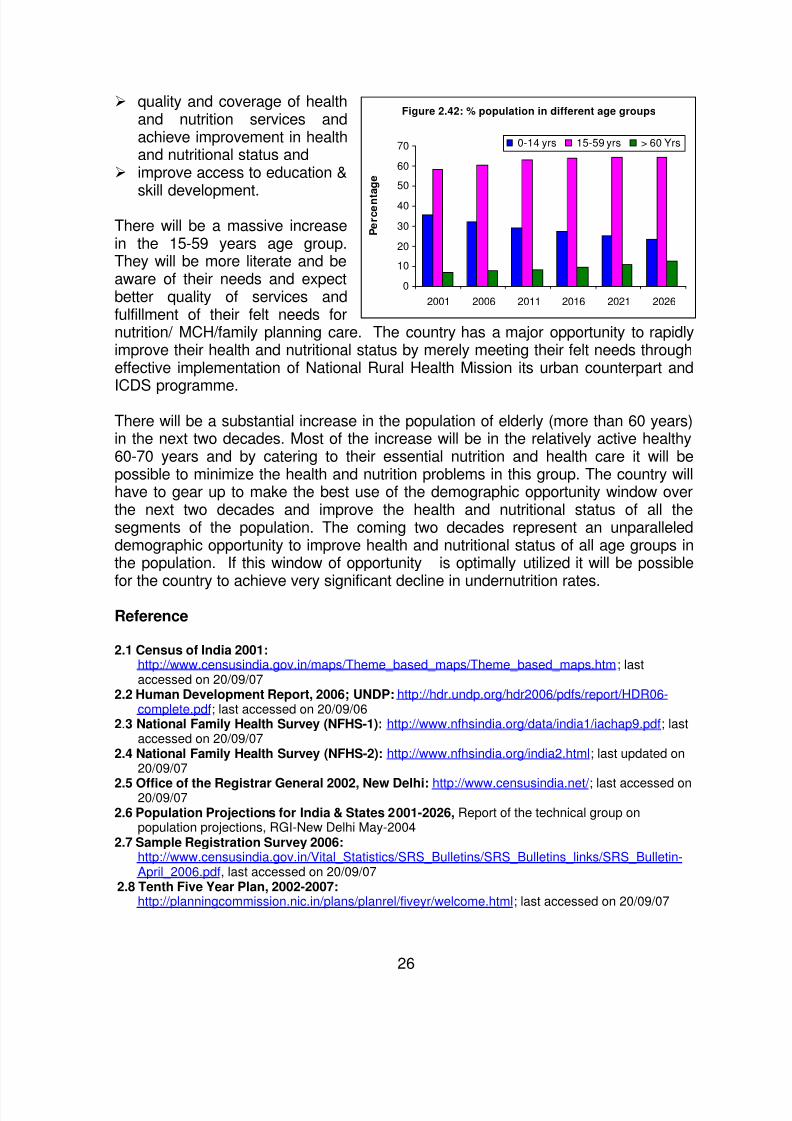
The population pyramids for 2001 and 2021 are shown in Figure 2.37 and 2.38.Characteristics of projected population of India in 2001 to 2026 are given in Annexure2.11. The average age of Indians was 23 in 2001 and is expected to rise to 31 yearsold in 2026.
Figure 2.40: Projected population (Uttar Pradesh2026)
The substantial interstate differences in age structure and consequently populationpyramid will persist even in 2026 because different states have achieved fertility and
mortality transition at different rates (Figure 2.39 and 2.40). These have to be takeninto account while planning nutrition and health interventions in these states.
Changes in age distribution of the population between 1951 and 2021 in three majorage groups are shown in Figure 2.41 and 2.42. Between 2001 and 2026, because ofthe declining fertility, the proportion of population aged under 15 years is projected todecline from 35.4 to 23.4 percent; the proportion of the middle (15-59 years) and theolder ages (60 years and above) are set to increase considerably. With the decliningfertility, along with the increases in life expectancy, the number of older persons inthe population is expected to increase by more than double from 71 million in 2001 to173 million in 2026 an increase in their share to the total population from 6.9 to 12.4
percent. The proportion of population in the working age-group 15-59 years isexpected to rise from 57.7 percent in 2001 to 64.3 percent in 2026.
In the under 15-year age group there will be no increase in numbers. The health andnutrition infrastructure will therefore be not grappling with ever increasing number ofchildren for providing care and they will be able to concentrate on:
Figure: 2.41: % distr ibution of population by age & se x India
0
10
20
30
40
50
60
1951 1961 1971 1981 1991 2001
%
o f p o p u
l a t i o n
0-14 MALE 0-14 FEMALE15-49 MALE 15-49 FEMALE50+ MALE 50+ FEMALESource: Reference 2.5
quality and coverage of healthand nutrition services andachieve improvement in healthand nutritional status and
improve access to education &
skill development.
There will be a massive increasein the 15-59 years age group.They will be more literate and beaware of their needs and expectbetter quality of services andfulfillment of their felt needs fornutrition/ MCH/family planning care. The country has a major opportunity to rapidlyimprove their health and nutritional status by merely meeting their felt needs througheffective implementation of National Rural Health Mission its urban counterpart and
ICDS programme.
There will be a substantial increase in the population of elderly (more than 60 years)in the next two decades. Most of the increase will be in the relatively active healthy60-70 years and by catering to their essential nutrition and health care it will bepossible to minimize the health and nutrition problems in this group. The country willhave to gear up to make the best use of the demographic opportunity window overthe next two decades and improve the health and nutritional status of all thesegments of the population. The coming two decades represent an unparalleleddemographic opportunity to improve health and nutritional status of all age groups inthe population. If this window of opportunity is optimally utilized it will be possiblefor the country to achieve very significant decline in undernutrition rates.
Reference
2.1 Census of India 2001:http://www.censusindia.gov.in/maps/Theme_based_maps/Theme_based_maps.htm; lastaccessed on 20/09/07
2.2 Human Development Report, 2006; UNDP: http://hdr.undp.org/hdr2006/pdfs/report/HDR06-complete.pdf; last accessed on 20/09/06
2.3 National Family Health Survey (NFHS-1): http://www.nfhsindia.org/data/india1/iachap9.pdf; lastaccessed on 20/09/07
2.4 National Family Health Survey (NFHS-2): http://www.nfhsindia.org/india2.html; last updated on20/09/07
2.5 Office of the Registrar General 2002, New Delhi: http://www.censusindia.net/ ; last accessed on20/09/07
2.6 Population Projections for India & States 2001-2026, Report of the technical group onpopulation projections, RGI-New Delhi May-2004
2.7 Sample Registration Survey 2006:http://www.censusindia.gov.in/Vital_Statistics/SRS_Bulletins/SRS_Bulletins_links/SRS_Bulletin-April_2006.pdf, last accessed on 20/09/07
2.8 Tenth Five Year Plan, 2002-2007:http://planningcommission.nic.in/plans/planrel/fiveyr/welcome.html; last accessed on 20/09/07