26
2nd Africa TB Regional Conference on Management of TB Medicines Africa TB Conference 2012, Zanzibar December 5-7, 2012

2nd Africa TB Regional Conference on Management of TB Medicines
Africa TB Conference 2012, Zanzibar December 5-7, 2012

Early Warning Indicators to Prevent Stock-Outs of Anti-Tuberculosis
Medicines: Zimbabwe Experience ZIMBABWE
Background Information
• In 2011 Zimbabwe was ranked 22nd among the 22 high burden TB countries (HBC) in the world. (WHO, Global tuberculosis control 2011)
• Tuberculosis (TB) is among the top 10 diseases of public health importance in Zimbabwe and it is a leading cause of death among people living with HIV and AIDS.
• Zimbabwe Government committed itself to adhere to international and regional TB-related strategies such as Global Plan to Stop TB 2006 to 2015, World Health Organization (WHO) Stop TB Strategy, and Millennium Development Goals.
• TB in Zimbabwe is driven by HIV.
Problem Statement
• A quarterly report designed by the National TB Control Programme (NTP) to provide data on TB medicines consumption and stock levels at sites has had very low reporting rates.
• Reporting on other TB statistics was also not functioning well and there was a low level of confidence in the TB patient and logistics data.
• National morbidity-based quantifications of TB medicines requirements have been carried out by the Ministry of Health and Child Welfare (MoHCW) AIDS and TB Programme Logistics Subunit (LSU) since April 2007 as part of the general quantification of HIV/AIDS commodities and opportunistic infection medicines.
• The major challenge during this exercise has been the lack of stock on hand and inadequate consumption data of TB medicines at service delivery site levels.
• There was also uneven distribution of TB medicines; some grossly overstocked and some stocked out.
• The Ministry redesigned the distribution system from the traditional pull to an informed push system.
Implementing PSM Indicators in Zimbabwe—Process
• Zimbabwe being part of the harmonisation of procurement, supply, and management (PSM) indicators
• Zimbabwe being part of the validation of the PSM indicators (using 2008 data)
• PSM indicators results have been presented to the Ministry and partners at the monthly Procurement and Logistics subcommittee meetings.
• Zimbabwe redefined the PSM indicators to be in line with the local setting • Zimbabwe is implementing the validated indicators 2008 to date • Zimbabwe wrote a case study on the implementation of PSM indicators
which is on the World Health Organization website.
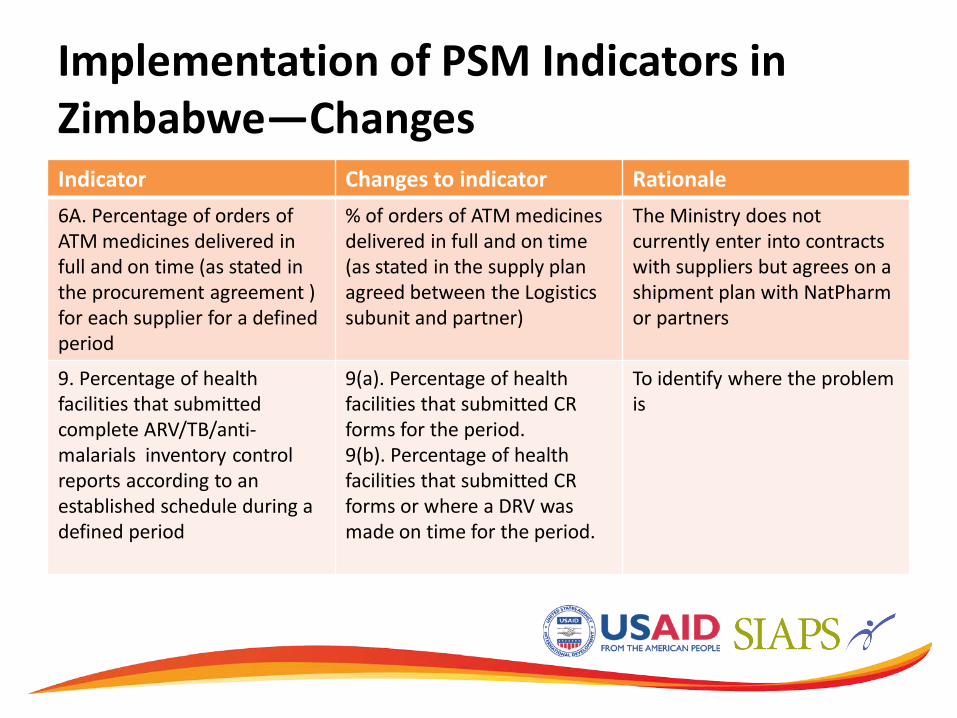
Implementation of PSM Indicators in Zimbabwe—Changes Indicator Changes to indicator Rationale 6A. Percentage of orders of ATM medicines delivered in full and on time (as stated in the procurement agreement ) for each supplier for a defined period
% of orders of ATM medicines delivered in full and on time (as stated in the supply plan agreed between the Logistics subunit and partner)
The Ministry does not currently enter into contracts with suppliers but agrees on a shipment plan with NatPharm or partners
9. Percentage of health facilities that submitted complete ARV/TB/anti-malarials inventory control reports according to an established schedule during a defined period
9(a). Percentage of health facilities that submitted CR forms for the period. 9(b). Percentage of health facilities that submitted CR forms or where a DRV was made on time for the period.
To identify where the problem is
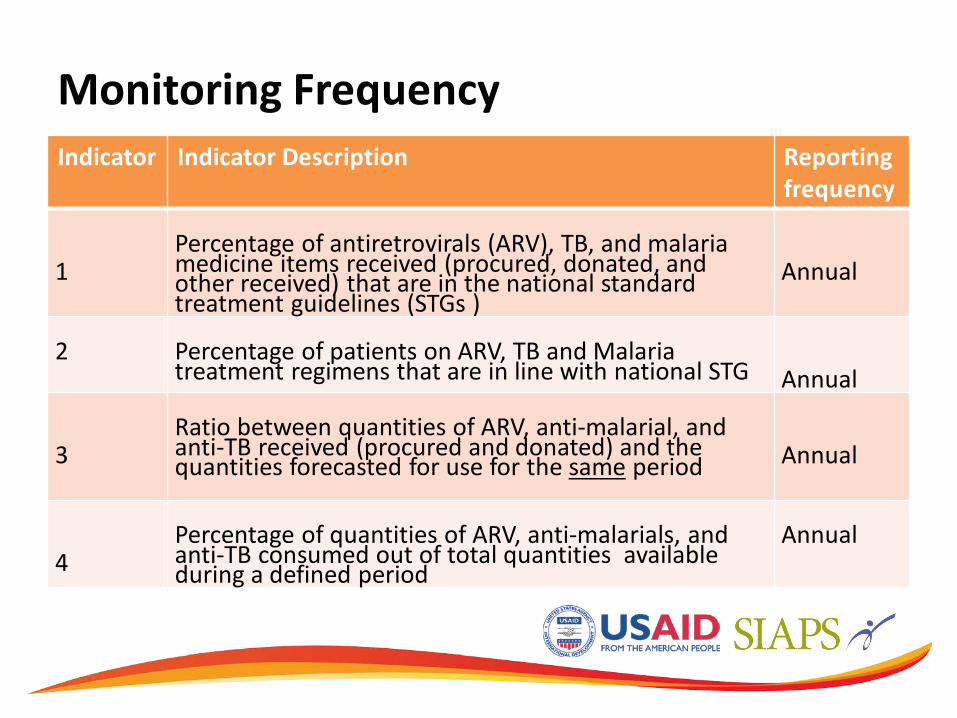
Monitoring Frequency Indicator Indicator Description Reporting
frequency 1
Percentage of antiretrovirals (ARV), TB, and malaria medicine items received (procured, donated, and other received) that are in the national standard treatment guidelines (STGs )
Annual
2
Percentage of patients on ARV, TB and Malaria treatment regimens that are in line with national STG
Annual
3
Ratio between quantities of ARV, anti-malarial, and anti-TB received (procured and donated) and the quantities forecasted for use for the same period
Annual
4
Percentage of quantities of ARV, anti-malarials, and anti-TB consumed out of total quantities available during a defined period
Annual
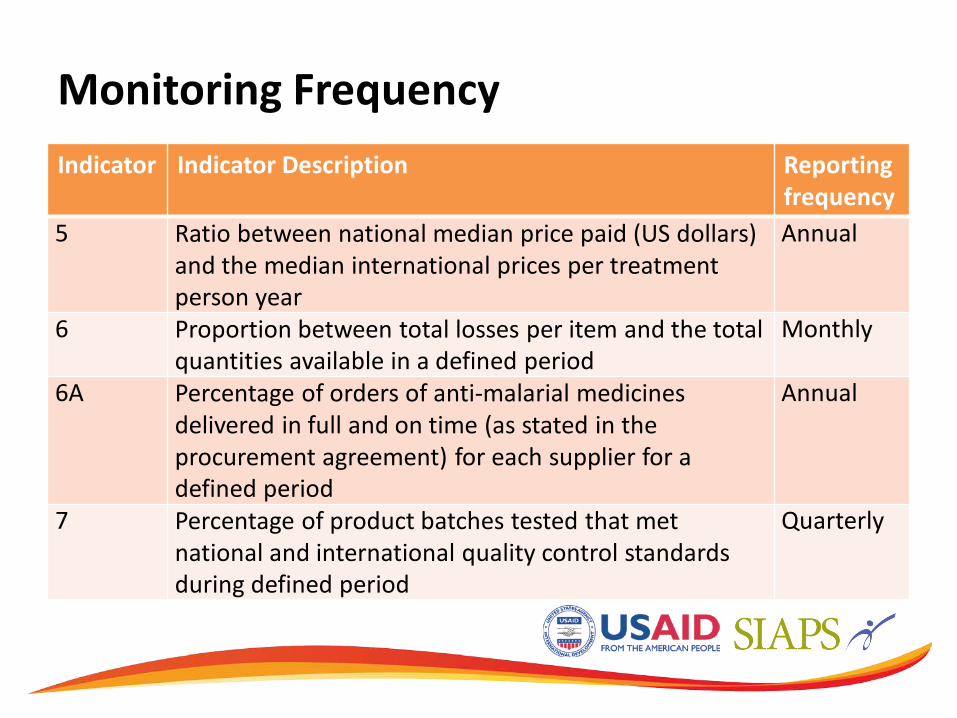
Monitoring Frequency Indicator Indicator Description Reporting
frequency 5 Ratio between national median price paid (US dollars)
and the median international prices per treatment person year
Annual
6 Proportion between total losses per item and the total quantities available in a defined period
Monthly
6A Percentage of orders of anti-malarial medicines delivered in full and on time (as stated in the procurement agreement) for each supplier for a defined period
Annual
7 Percentage of product batches tested that met national and international quality control standards during defined period
Quarterly
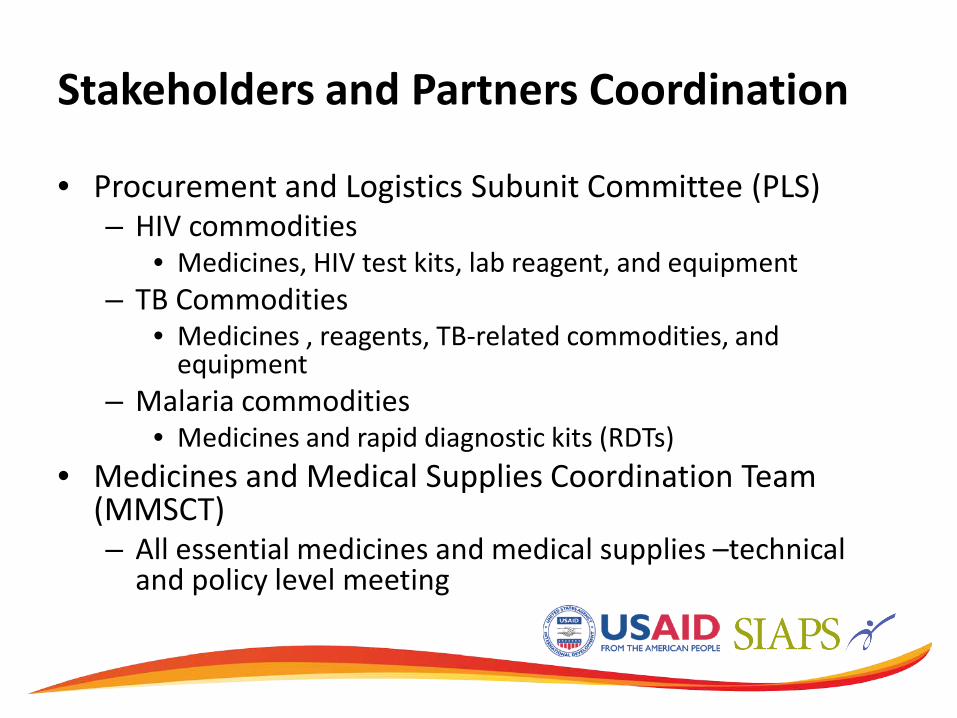
Stakeholders and Partners Coordination
• Procurement and Logistics Subunit Committee (PLS) – HIV commodities
• Medicines, HIV test kits, lab reagent, and equipment – TB Commodities
• Medicines , reagents, TB-related commodities, and equipment
– Malaria commodities • Medicines and rapid diagnostic kits (RDTs)
• Medicines and Medical Supplies Coordination Team (MMSCT) – All essential medicines and medical supplies –technical
and policy level meeting

Supply Chain/Partners TB medicines including Multidrug Resistant TB medicines
GOZ/ Directorate of Pharmacy Services
Funding Source
Implementing Agency
Procurement
Storage and Distribution
GOZ
GOZ/NAC
NatPharm /MOH&CW
MSF x 3*
MSF
MSF
MSF
NAC
TB Medicines Supply Chain 2012
Geographical
Coverage All Districts 3 Districts
GFATM Rd 8
UNICEF
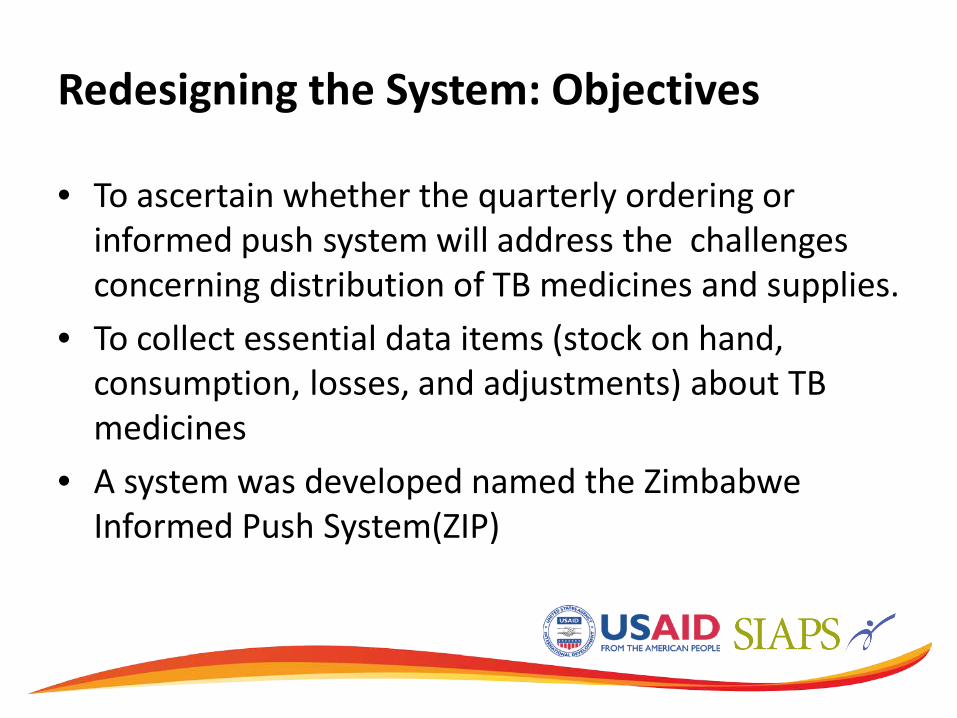
Redesigning the System: Objectives
• To ascertain whether the quarterly ordering or informed push system will address the challenges concerning distribution of TB medicines and supplies.
• To collect essential data items (stock on hand, consumption, losses, and adjustments) about TB medicines
• A system was developed named the Zimbabwe Informed Push System(ZIP)

Evolution of Supply Chain of TB Commodities in Zimbabwe • Standard operating procedures was developed for the system • The system (ZIP) was rolled out nationally by end of 2009 and medicines are
distributed every quarter to every facility. Data is collected or recorded on— – Stock on hand – Consumption – Loses and adjustments – Stock-out rate – Quantity of short dated stock – Excess stock removed – Quantity delivered to top up to maximum stock level of 6 months
• Support and supervision is done at district level, provincial level. and national level every month
• Specific supply chain problems are handled during the SS and soon after the SS • This data was used for decision making in quantification and forecasting of future
needs • Comparing patient notification against consumption level of the medicines
Quantification and Forecasting
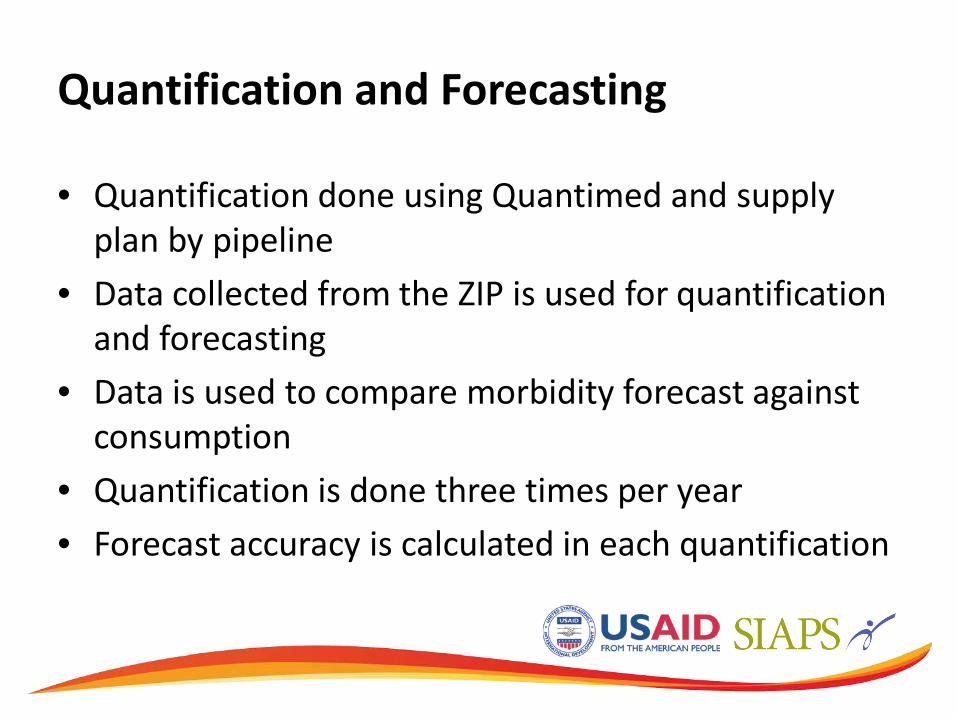
• Quantification done using Quantimed and supply plan by pipeline
• Data collected from the ZIP is used for quantification and forecasting
• Data is used to compare morbidity forecast against consumption
• Quantification is done three times per year • Forecast accuracy is calculated in each quantification
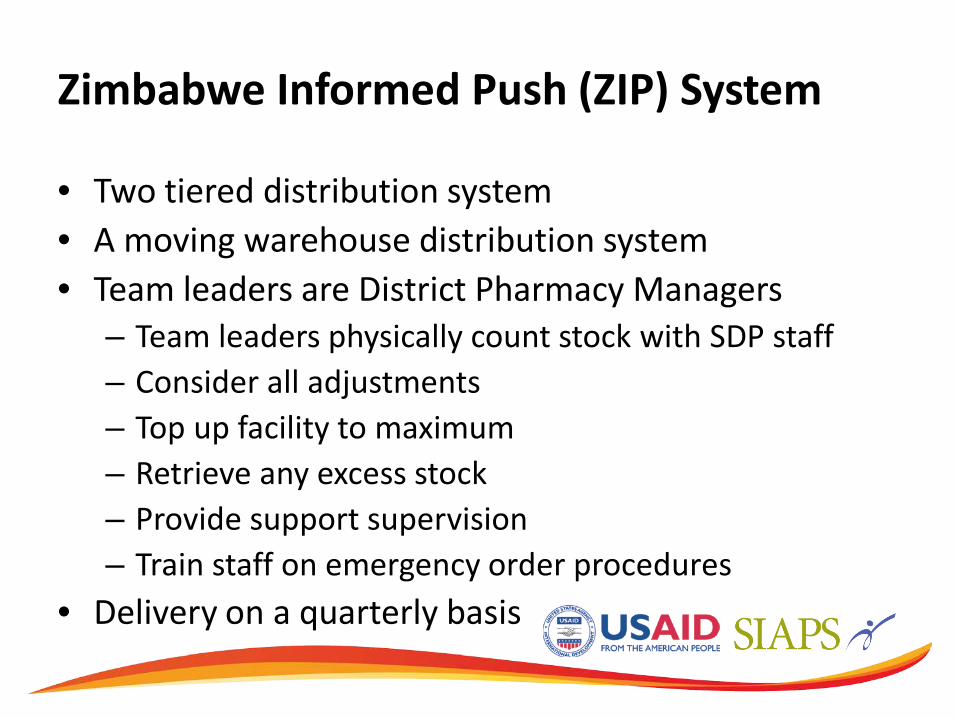
Zimbabwe Informed Push (ZIP) System
• Two tiered distribution system • A moving warehouse distribution system • Team leaders are District Pharmacy Managers
– Team leaders physically count stock with SDP staff – Consider all adjustments – Top up facility to maximum – Retrieve any excess stock – Provide support supervision – Train staff on emergency order procedures
• Delivery on a quarterly basis
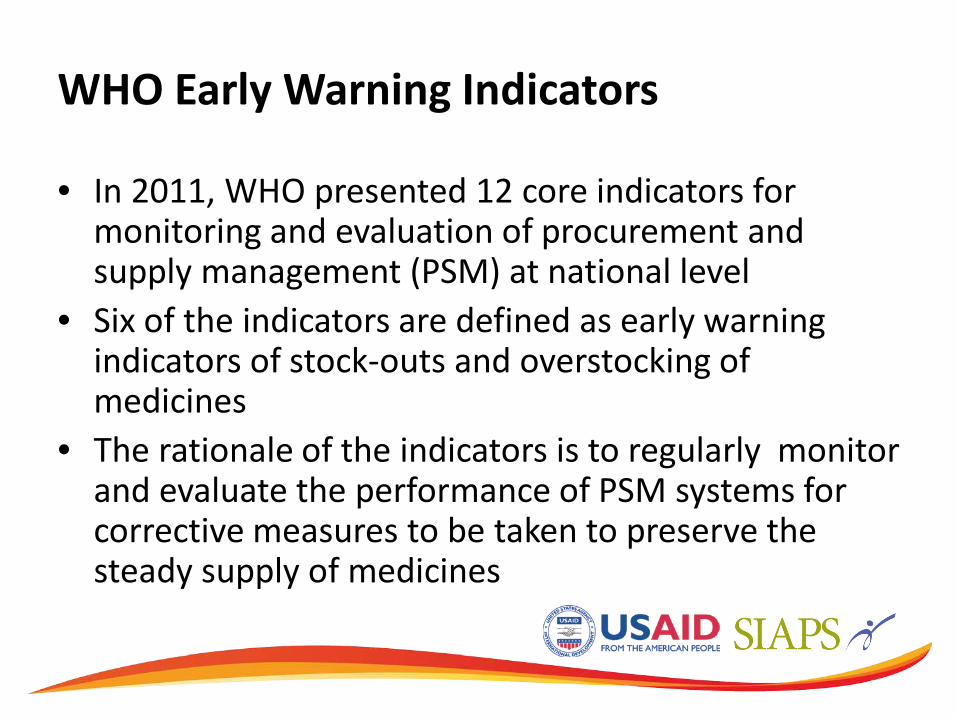
WHO Early Warning Indicators
• In 2011, WHO presented 12 core indicators for monitoring and evaluation of procurement and supply management (PSM) at national level
• Six of the indicators are defined as early warning indicators of stock-outs and overstocking of medicines
• The rationale of the indicators is to regularly monitor and evaluate the performance of PSM systems for corrective measures to be taken to preserve the steady supply of medicines

Early Warning Indicators PSM Stage Core Indictor Use
Forecasting Proportion of quantities of products actually received during a defined period out of total quantities planned for the same period
To measure the extent to which quantities received are consistent with the quantities planned to be received (target 100%)
Consumption % of quantities consumed out of the stock that is available for consumption
To measure how much of the quantity available for consumption is actually consumed (target 100%)
Supplier performance
% of orders delivered in full and on time
To measure supplier’s performance in complying with agreed delivery time and delivering all quantities ordered (target 100%)
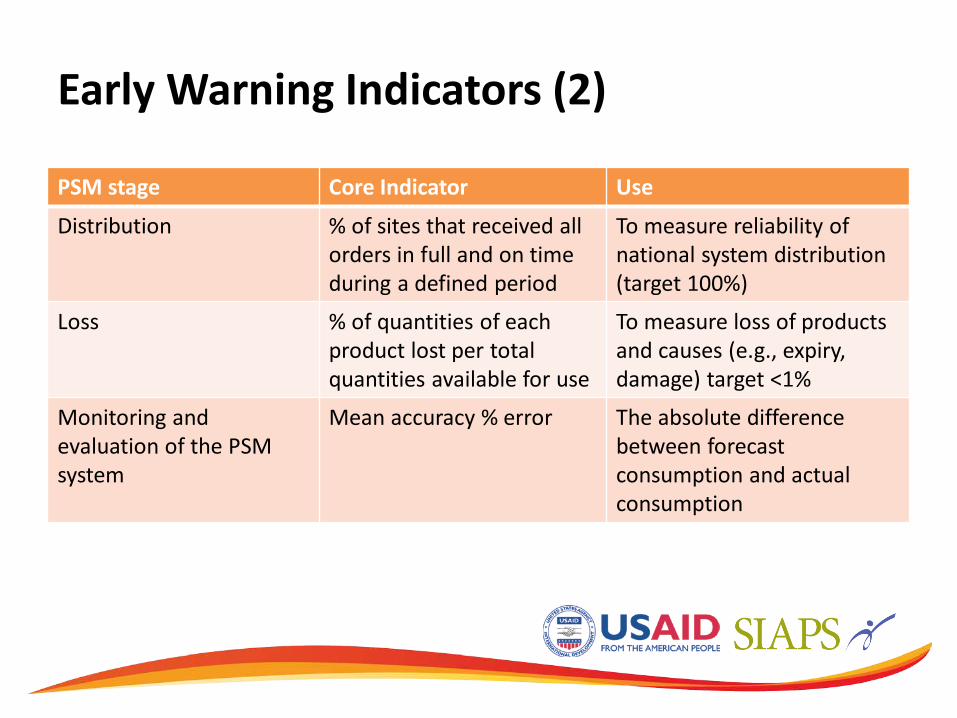
Early Warning Indicators (2)
PSM stage Core Indicator Use
Distribution % of sites that received all orders in full and on time during a defined period
To measure reliability of national system distribution (target 100%)
Loss % of quantities of each product lost per total quantities available for use
To measure loss of products and causes (e.g., expiry, damage) target <1%
Monitoring and evaluation of the PSM system
Mean accuracy % error The absolute difference between forecast consumption and actual consumption

Mean Accuracy Error Forecast Accuracy-Q2 2012
Product Forecast Actual % Variance
RHZE 3,494,355 3,378,177 -3.3 RH 150/75 mg 4,487,976 5,168,970 15.2 RHE 913,464 1,123,560 23.0 RHZ 60/30/150 mg 89,397 385,800 331.6 RH 60/30 mg 183,783 788,361 329.0 Streptomycin 90,000 89,998 0.0 Ethambutol 400mg 34,842 182,187 422.9 Ethambutol 100 mg 92,550 92,781 0.20 Isoniazid 100 mg 322,794 474,747 47.1 Rifampicin 150 mg 103,812 416,685 301.4 Pyrazinamide 500 mg 3,4974 137,646 293.6
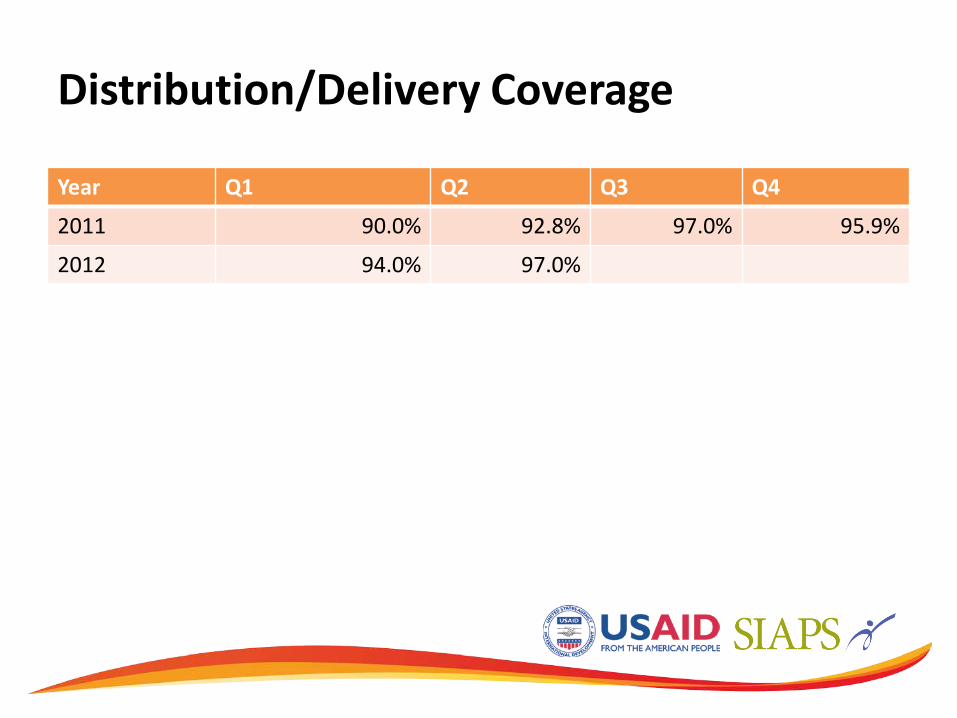
Distribution/Delivery Coverage
Year Q1 Q2 Q3 Q4
2011 90.0% 92.8% 97.0% 95.9%
2012 94.0% 97.0%
Forecast Accuracy/Consumption
• Morbidity based forecast is used to estimate total needs for the upcoming period
• Patient enrollment on treatment below targets leads to a huge variation between forecast and actual consumption leading to significant overstocks and expiries(low case detection is causing expiries of pediatric formulations and multidrug-resistant medicines)
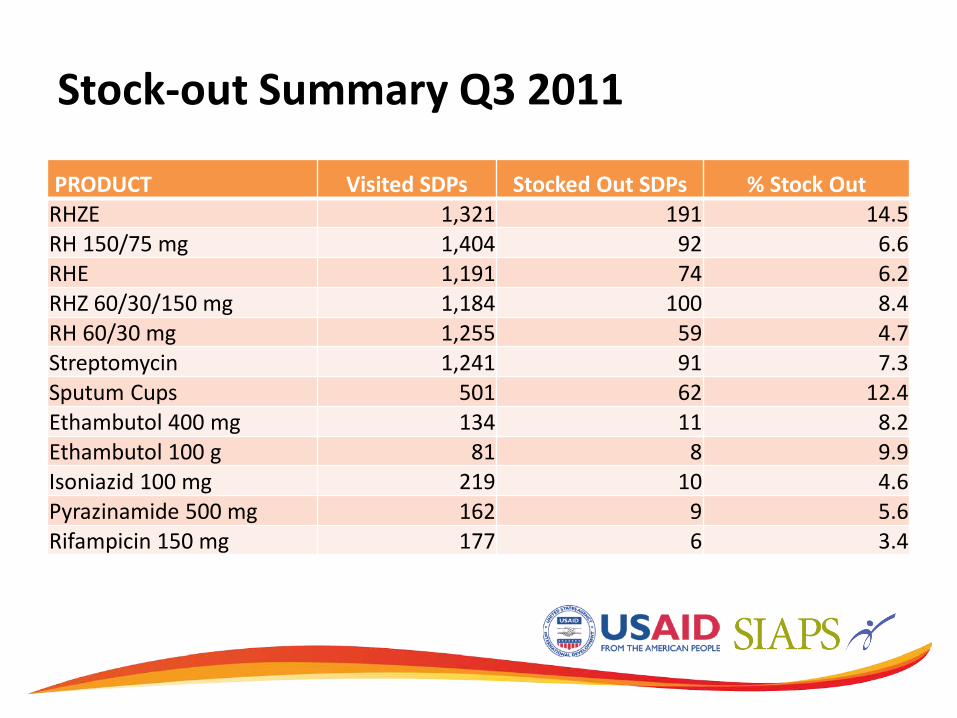
Stock-out Summary Q3 2011
PRODUCT Visited SDPs Stocked Out SDPs % Stock Out RHZE 1,321 191 14.5 RH 150/75 mg 1,404 92 6.6 RHE 1,191 74 6.2 RHZ 60/30/150 mg 1,184 100 8.4 RH 60/30 mg 1,255 59 4.7 Streptomycin 1,241 91 7.3 Sputum Cups 501 62 12.4 Ethambutol 400 mg 134 11 8.2 Ethambutol 100 g 81 8 9.9 Isoniazid 100 mg 219 10 4.6 Pyrazinamide 500 mg 162 9 5.6 Rifampicin 150 mg 177 6 3.4
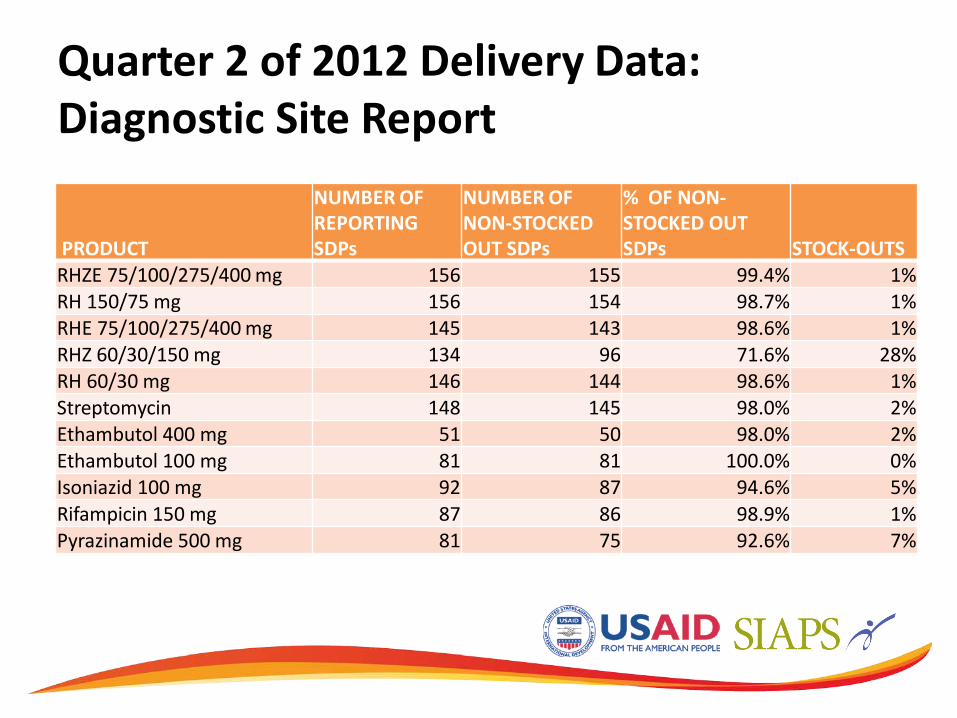
Quarter 2 of 2012 Delivery Data: Diagnostic Site Report
PRODUCT
NUMBER OF REPORTING SDPs
NUMBER OF NON-STOCKED OUT SDPs
% OF NON-STOCKED OUT SDPs STOCK-OUTS
RHZE 75/100/275/400 mg 156 155 99.4% 1% RH 150/75 mg 156 154 98.7% 1% RHE 75/100/275/400 mg 145 143 98.6% 1% RHZ 60/30/150 mg 134 96 71.6% 28% RH 60/30 mg 146 144 98.6% 1% Streptomycin 148 145 98.0% 2% Ethambutol 400 mg 51 50 98.0% 2% Ethambutol 100 mg 81 81 100.0% 0% Isoniazid 100 mg 92 87 94.6% 5% Rifampicin 150 mg 87 86 98.9% 1% Pyrazinamide 500 mg 81 75 92.6% 7%

Logistics Management Information System (LMIS) • Navision (Microsoft Dynamics)—Central warehouse
– Receiving of all commodities – Processing orders and distribution
• Stock transfer form through the ZIP system—used to account for products collected and returned by team to warehouse
• Delivery receipt voucher (DRV)—records stock on hand, consumption, losses and adjustments, quantity delivered/retrieved (Signed by both team leader and facility staff)
• Data captured into TopUp software

Reports Produced by TopUp
• National stocks available (site and central level) • Average monthly consumption (site, district,
province, and nation) • National months of stock • Months of stock by province • Months of stock by district • Months of stock by facility • Losses and adjustments • Short dated stock < 3 months shelf life
Strengths, Challenges, and Lesson Learned
• The average stock out rate of TB medicines decreased from a high rate of 60% to 1 % for some commodities
• Forecasting – Delays in receiving an item leads to non-full supply situation and is an early warning
indicator for stock-outs • Distribution
– Delivery of medicines had been consistent every quarter and this had prevented stock-outs and emergency orders
– Redistribution amongst facilities is key in preventing stock-outs especially if the commodity is in limited quantities centrally
• Sustainability • Need to ensure that the government takes ownership of the program or
revises the distribution system to make sure that the main aim is not lost • Partner/stakeholder coordination
– Government should be the leader in the coordination
Conclusion
• The Zimbabwean experience elucidates an enabling environment for implementation of a monitoring and evaluation system that uses PSM indicators
• Supply chain management is a priority for the NTP program and is always on the agenda.
• Key indicators on stock outs are tracked and fed into the M&E performance framework of the GF every quarter)
• Monitoring of the system through support and supervision is important in any distribution system
• A robust logistics management information system should be implemented in order to track the implementation of the programme
• Staff at the district or peripheral level should follow SOPs for the system to be successful


