83
2 nd LBBW Engineering & Technology Investment Day London – September 02, 2010 Dr. Claus Ehrenbeck, Head of Investor Relations
2nd
LBBW Engineering & Technology Investment Day
London –
September 02, 2010
Dr. Claus Ehrenbeck, Head
of Investor Relations

Developing the future.
2nd LBBW Engineering & Technology Investment DaySeptember 02, 2010
1
Disclaimer ThyssenKrupp AG
“The information set forth and included in this presentation is not provided in connection with an offer or solicitation for the purchase or sale of a security and is intended for informational purposes
only.
This presentation contains forward-looking statements that are subject to risks and uncertainties. Statements contained herein that are not statements of historical fact may be deemed to be forward-looking information. When we use words such as “plan,”
“believe,”
“expect,”
“anticipate,”
“intend,”
“estimate,”
“may”
or similar expressions, we are making forward-looking statements. You should not rely on forward-looking statements because they are subject to a number of assumptions concerning future events, and are subject to a number of uncertainties and other factors, many of which are outside of our control, that could cause actual results to differ
materially from those indicated. These factors include, but are
not limited to, the following:(i) market risks: principally economic price and volume developments, (ii) dependence on performance of major customers and industries, (iii) our level of debt, management of interest rate risk and hedging against commodity price risks;(iv) costs associated with, and regulation relating to, our pension liabilities and healthcare measures, (v) environmental protection and remediation of real estate and associated with rising standards for real estate environmental protection, (vi) volatility of steel prices and dependence on the automotive
industry, (vii) availability of raw materials; (viii) inflation, interest rate levels and fluctuations in exchange rates; (ix) general economic, political and business conditions and existing and future governmental regulation; and (x) the effects of competition. Please note that we disclaim any intention or obligation to update or revise any forward-looking statements whether as a result of new information, future events or otherwise.”

Developing the future.
2nd LBBW Engineering & Technology Investment DaySeptember 02, 2010
2
Premium flat carbon steels
Large-scale, multiple niche approach
Long-term customer relations
Technology leadership in products and processes
Premium flat carbon steels
CSA: slab mill in Brazil, 5 m t capacity,SoP Q3 CY 2010
Steel USA: processing plant (hot / cold rolling and coating), SoP Jul. 31, 2010
Stainless steel flat products & high-performance materials
Operations in Germany, Italy, Mexico, China
Stainless steel plant project in USA
Global materials distribution(carbon & stainless steel, pipes & tubes, nonferrous metals, aluminum, plastics)
Technical and infrastructureservices for production & manufacturing sectors
Elevators
Escalators & moving walks
Passenger boarding bridges
Stair lifts, home elevator
Maintenance, Repair & Modernization
Specialty and large-scale plant construction, e.g.:
Petrochemical complexes
Cement plants
Systems for open-pit mining & materials handling
Components for theautomotive industry(e.g. crankshafts, axlemodules, steering systems)Large-diameter bearings & rings (e.g. for wind energy)Undercarriages for trackedearthmoving machinery
Focus on naval
shipbuilding:
Engineering & Construction of non-nuclear submarines
Engineering of NavalSurface Vessels(fregates & corvettes)
Steel
Europe
Steel
Americas
Stainless
Global
Materials
Services
ElevatorTechnology
Plant Technology
ComponentsTechnology
MarineSystems
9M 2009/10: Sales €31.1 bn
•
EBT €918 m •
TKVA €138 m •
Employees 174,541
ThyssenKrupp*
ThyssenKrupp Group: Now
Higher
Transparency
* The TK Group consists of >800 legally independent companies, organized, existing and operating under the laws of 70 countries, ultimately led by TK AG.
Sales:
€7.8 bnEBT:
€450 m€0 bn
€(98) m
Sales & EBT for
9M 2009/10
€4.4 bn€(112) m
€9.2 bn€316 m
€2.9 bn€230 m
€4.1 bn€164 m
€1.0 bn€(40) m
€3.8 bn€459m

Developing the future.
2nd LBBW Engineering & Technology Investment DaySeptember 02, 2010
3
Group Performance and Financials
Business Area Performance
Group Outlook
Agenda
Developing the future.
2nd LBBW Engineering & Technology Investment DaySeptember 02, 2010
4
Efficiency
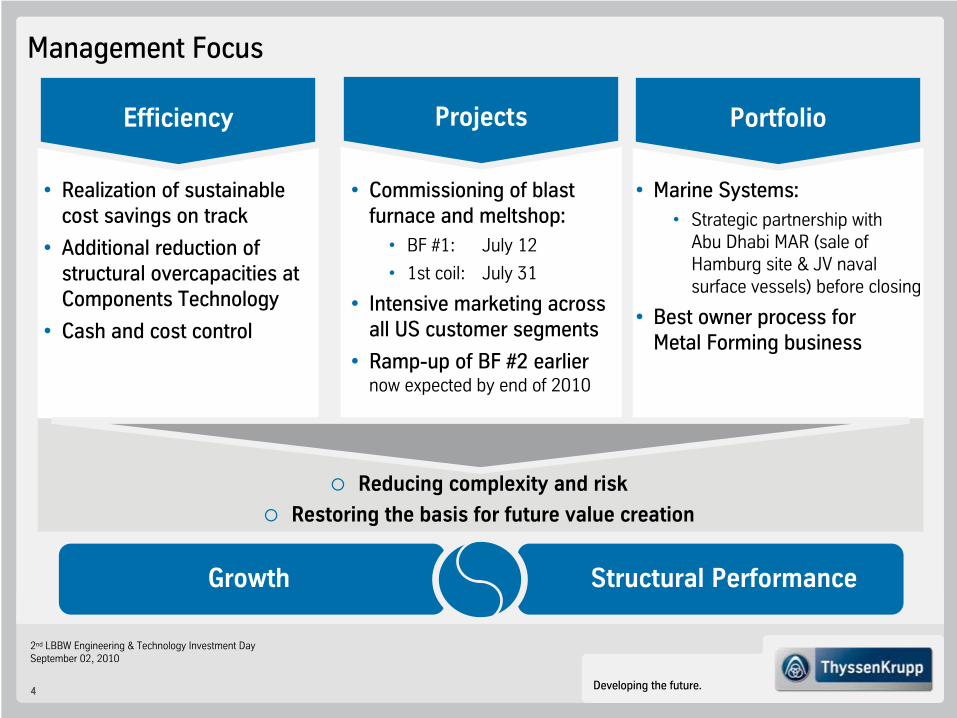
Management Focus
•
Realization of sustainable cost savings on track
•
Additional reduction of structural overcapacities at Components Technology
•
Cash and cost control
Reducing complexity and risk
Restoring the basis for future value creation
Projects
•
Commissioning of blast furnace and meltshop:
•
BF #1: July 12
•
1st coil: July 31
•
Intensive marketing across all US customer segments
•
Ramp-up of BF #2 earlier
now expected by end of 2010
Portfolio
Growth Structural Performance
•
Marine Systems:•
Strategic partnership with Abu Dhabi MAR (sale of Hamburg site & JV naval surface vessels) before closing
•
Best owner process for
Metal Forming business

Developing the future.
2nd LBBW Engineering & Technology Investment DaySeptember 02, 2010
5
Order Intake and Sales
Order intake
million €
Q1 Q2
12,887
7,642* 7,515*7,926*
Q3 Q4
2008/09
9,328
Q1
2009/10
Sales
million €
Q1 Q2
11,5229,859 9,299
Q3 Q4
9,883 9,351
Q1
2008/09 2009/10
* including
cancellations
(container
ships, mega
yachts, submarines Greece)
Q2: ~ €100 m, Q3: ~ €500 m; Q4: ~ €1,000 m
10,373
Q2
10,107
Q2
10,930
Q3
11,679
Q3

Developing the future.
2nd LBBW Engineering & Technology Investment DaySeptember 02, 2010
6
Earnings Before Interest and Taxes and Earnings Before Taxes
Q1Q2
Q3 Q4
2008/09
Q1
2009/10
EBIT adjusted
million €
Q1Q2
407(276)
(1,197)(597)
Q3
Q4
2008/09
477
Q1
2009/10
416 (112)(289) (390)
401
EBIT
million €
EBT adjusted
million €
Q1
Q2
Q3 Q4
2008/09
Q1
2009/10
249
(291) (464) (570)
237
EBT million €
Q1Q2
240(455)
(1,377)(772)
Q3
Q4
2008/09
313
Q1
2009/10
191
Q2 Q2
206
354
Q2 Q2
369587
Q3 Q3
653
414
Q3 Q3
480

Developing the future.
2nd LBBW Engineering & Technology Investment DaySeptember 02, 2010
7
million € Q1 Q2 Q3 Q4 Q1 Q2 Q3
Steel Europe 371 131 (156) (262) 126 179 200
% 13.0 5.6 (7.3) (11.7) 5.5 6.7 6.9
Steel Americas (42) 0 9 (44) 37 7 (26)
% n.a. n.a. n.a. n.a. n.a. n.a. n.a.
Stainless Global (228) (291) (139) (55) (41) (102) 81
% (19.4) (29.5) (13.5) (4.2) (3.4) (7.0) 4.7
Materials Services 54 (88) (106) 1 48 70 157
% 1.4 (2.8) (3.9) 0.0 1.7 2.4 4.4
Elevator Technology 157 149 168 124 154 151 150
% 11.7 11.5 12.7 9.2 12.6 12.4 11.4
Plant Technology 72 62 50 24 82 59 48
% 6.7 5.2 4.5 2.2 8.6 6.3 4.9
Components Technology 66 (7) (60) (85) 57 73 113
% 5.1 (0.6) (5.6) (7.4) 4.6 5.4 7.2
Marine Systems 32 (45) (27) (39) (1) 11 (3)
% 5.9 (12.1) (8.4) (11.0) (0.4) 3.8 (0.7)
Group 416 (112) (289) (390) 401 369 653% 3.6 (1.1) (3.1) (3.9) 4.3 3.7 5.6
2008/09 2009/10
Quarterly EBIT Adjusted and Margin
Developing the future.
2nd LBBW Engineering & Technology Investment DaySeptember 02, 2010
8
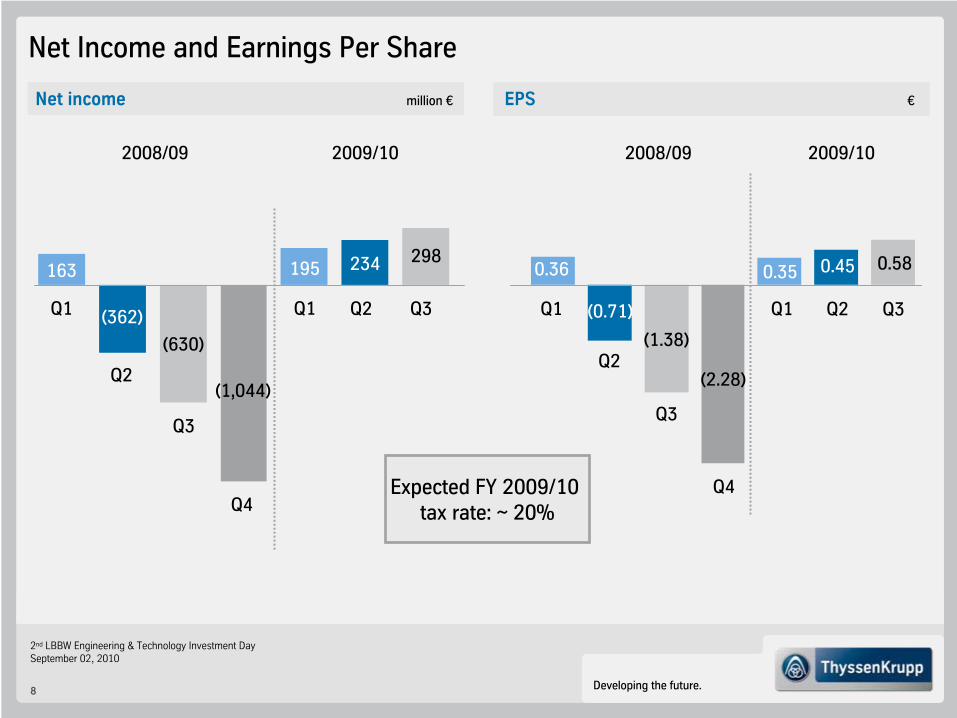
Net Income and Earnings Per Share
Net income
million €
Q1
Q2
163
(362)
(1,044)
(630)
Q3
Q4
2008/09
195
Q1
2009/10
EPS
€
Q1
Q2
0.36
(0.71)
(1.38)
Q3
Q4
(2.28)
0.35
Q1
2008/09 2009/10
234
Q2
0.45
Q2
Expected
FY 2009/10 tax rate: ~ 20%
298
Q3
0.58
Q3
Developing the future.
2nd LBBW Engineering & Technology Investment DaySeptember 02, 2010
9
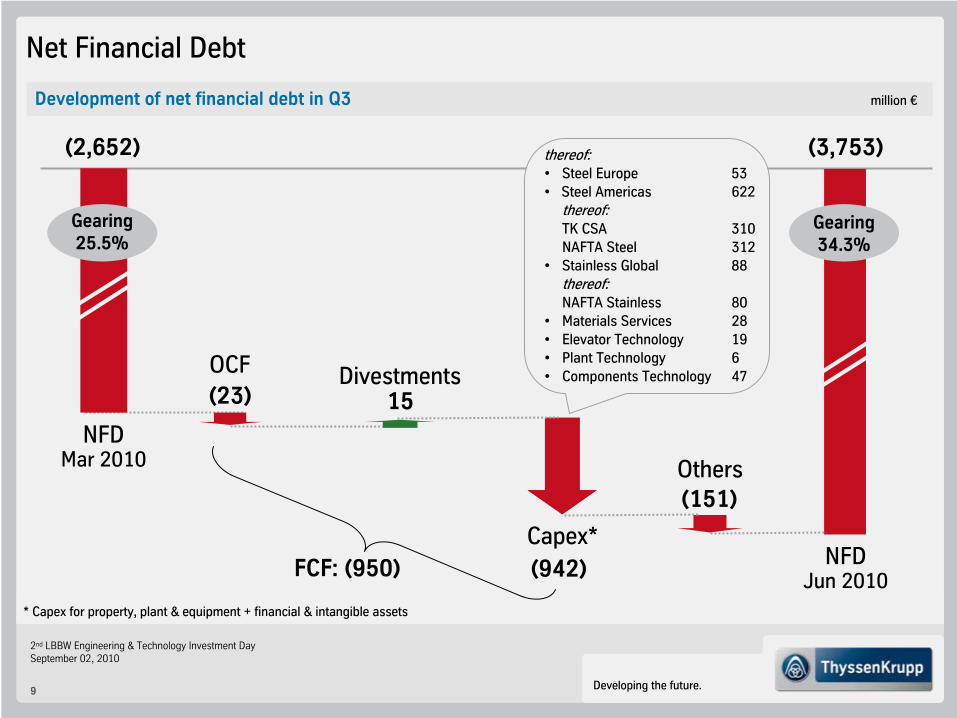
Net Financial Debt
FCF: (950)Capex*
NFDMar 2010
NFDJun 2010
(3,753)
(942)
Gearing34.3%
OCF(23)
(2,652)
Gearing25.5%
15Divestments
thereof:•
Steel Europe 53• Steel Americas
622thereof:
TK CSA 310
NAFTA Steel
312
•
Stainless Global
88 thereof:
NAFTA Stainless
80• Materials Services
28• Elevator Technology 19• Plant Technology 6•
Components Technology
47
Others
Development of net financial debt in Q3
million €
* Capex
for property, plant & equipment + financial & intangible assets
(151)

Developing the future.
2nd LBBW Engineering & Technology Investment DaySeptember 02, 2010
10
Tight Capex
Management Going Forward
2005/06 2007/082006/07 2008/09
Capex
Divestments
2009/10E 2010/11E
3.0-3.5
Americas Projects
2011/12E
4.24.2
3.0
2.0
0.30.7
0.3 0.2
Depreciation
Cash flows from investing activities
billion €
9M 2009/10
2.5
0.5
Focus: Positive FCF

Developing the future.
2nd LBBW Engineering & Technology Investment DaySeptember 02, 2010
11
Group Performance and Financials
Business Area Performance
Group Outlook
Agenda

Developing the future.
2nd LBBW Engineering & Technology Investment DaySeptember 02, 2010
12
109
Steel Europe
Q3 2009/10 Highlights
Comments Q3 (qoq)
EBT in €m
Q1 Q2 Q3 Q4 Q1
2008/09
Order intake in €m
Current trading conditions
2009/102008/09
(312)
345104
2009/10
(339)
354
Q1 Q2
Q3 Q4
Q1
EBT adjustedEBT
112(172) (273) 163
Q2
Q2
Efficiency gains, higher volumes and higher average revenues per ton compensate increasing raw material costs
Further improvement in downstream utilization; upstream capacities fully loaded
High utilization, higher average revenues per ton and significantly increased raw material costs
Robust demand from key customer groups benefiting from improved export business
Best owner process for Metal Forming business
1,866 1,4792,223 2,324 2,500 2,999
183
Q3
Q3
2,706

Developing the future.
2nd LBBW Engineering & Technology Investment DaySeptember 02, 2010
13
Average revenues per ton*, indexed
Q1 2004/2005 = 100
HKM share
724 873 837756
334265
440410
Q2
Steel Europe: Output, Shipments and Revenues per Metric Ton
3,459
Fiscal year
2005/06 2006/07
3,615
Q1
2008/09
3,194
Cold-rolledHot-rolled
122139
120100
125114
133
156
111129 136
116
153
116138
118 118133 134
115 123
150
120
Q12005/06Q2 Q3 Q4Q1
2004/05Q2 Q3 Q4 Q1
2006/07Q2 Q3 Q4
1,953
Q3
1,512
2,566
Q4
2007/08Q1 Q2 Q3 Q4
2007/08
3,553
Q1
2009/10
2,964
Crude steel output (incl. share in HKM)
1,000 t/quarter Shipments*: Hot-rolled and cold-rolled products
1,000 t/quarter
2008/09Q1 Q2 Q3 Q4
2,735 2,742 2,7162,438
1,6191,247
2,1262,554
Fiscal year
2005/06 2006/07
3,483
2007/08
1,001
2,482
3,513
1,048
2,465
3,590
1,093
2,497
Q1
2008/09
Q2 Q3 Q4
2,517
815
1,702
2,088
573
1,515
2,116
533
1,583
2,620
719
1,901
Q1
2009/10
2,533
715
1,818
2009/10Q1
* shipments and average revenues per ton until FY 2007/08 relate
to former Steel segment
3,326
2,601
726
Q2 Q2
3,167
Q2
2,199
968
3,614
2,755
859
Q3
3,216
Q3
Q3
2,165
1,051
Developing the future.
2nd LBBW Engineering & Technology Investment DaySeptember 02, 2010
14
300
400
500
600
700
800
900
1.000
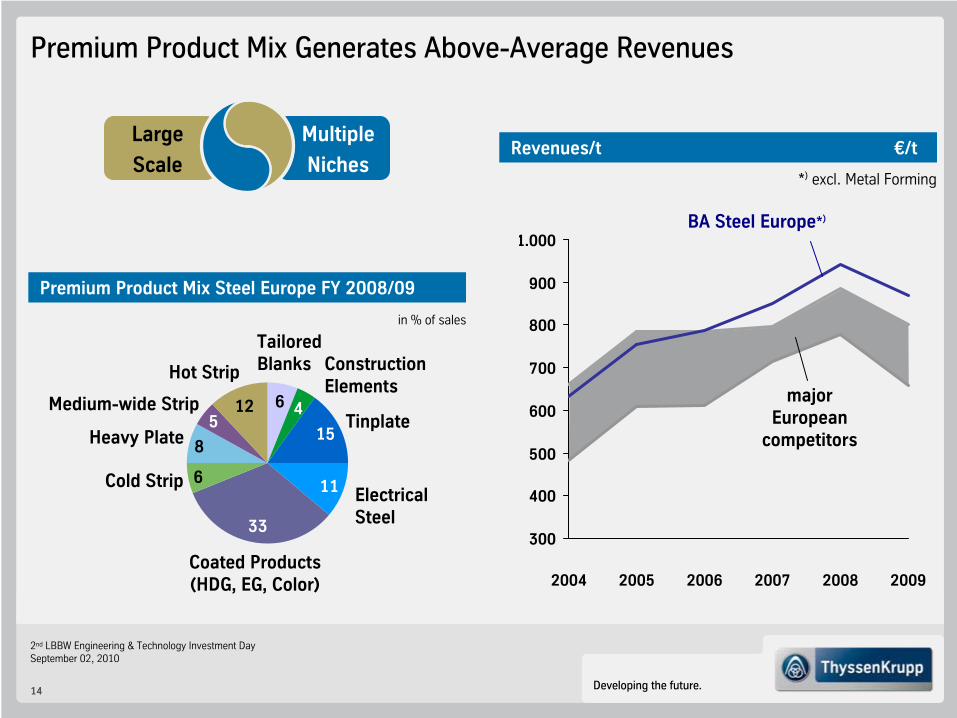
Premium Product Mix Generates Above-Average Revenues
Premium Product Mix Steel Europe FY 2008/09
in % of sales
6
8
12
33
11
45
15
6
TailoredBlanks Construction
Elements
ElectricalSteel
Medium-wide Strip
Hot Strip
Tinplate
Coated Products(HDG, EG, Color)
Cold Strip
Heavy Plate
Revenues/t
€/t
*)
excl. Metal Forming
2004 200820062005 20092007
BA Steel Europe*)
majorEuropean
competitors
Multiple
Niches
Large
Scale

Developing the future.
2nd LBBW Engineering & Technology Investment DaySeptember 02, 2010
15
Demanding
Example
Applications
and Solutions Based
on Premium Flat
Carbon
Steels Made by
ThyssenKrupp
Thickhot strip
Heavy Plate
Bodies
up to 24% lighter
with
same
safety
performance
Involving
>30 innovative solutionsfor
body, chassis
and powertrain
Ratio of load
capacity
tooperating
weight
increased
to 8:1
In sour
gas resistant
gradesfor
pipelines
For extreme demands
on deep
drawing
properties
(0.07 mm)
Up to 99% efficiency
Tinplate
ElectricalSteels

Developing the future.
2nd LBBW Engineering & Technology Investment DaySeptember 02, 2010
16
Project costs in Q3 partially compensated by positive translation effect (Brazilian Real/€)
ThyssenKrupp CSA BF #1 blown in on July 12;
SoP
BF #2 currently planned for end of 2010
ThyssenKrupp Steel USA: 1st HRC on July 31
InCar project – toolbox for optimized weight/cost/safety solutions – rolled out to NAFTA customer base
Steel Americas
Q3 2009/10 Highlights
Comments
2009/102008/09
Q1 Q2 Q3 Q4 Q1
(22)
(76)
(4)
(99)
(19)
EBT in €m ThyssenKrupp CSA
Sepetiba Bay, Santa Cruz, Rio de Janeiro, BrazilCoking plant: 1.9 m t/yr of cokeSinter plant: 5.7 m t/yr of sinter2 blast furnaces: 5.3 m t/yr of hot metal Steel shop: >5 m t/yr of slabsPower plant: 490 MWCapex budget: €5.2 bnTotal cash-out: €5.9 bn1st slab: Q3 CY 2010
ThyssenKrupp Steel USASite on the Tombigbee River, Mobile Cty, AL, USAHot strip mill: >5 m t/yr
up to 74” width / 1” thickness, 7 standsTandem/cold strip line: 2.5 m t/yr4 galvanizing lines: 1.8 m t/yrCapex budget: $3.6 bnTotal cash-out: $3.8 bn1st coil: July 31, 2010
Q2
(32)
Q3
(62)

Developing the future.
2nd LBBW Engineering & Technology Investment DaySeptember 02, 2010
17
TKS USA
Mini-MillBlast Furnace
Auto Customers
Industry (Non-Auto) Customers
1) Size of Industry and Auto bubbles reflect the approximate number of customer locations in the given area.
2) Includes all steelmaking (EAF, BF) locations, excluding West Coast of U.S. and Canada.
Well Positioned in Southeastern United States with Proximity to Mexico Geographic Position of TKS USA, our Home Market and BF & EAF Competitors

Developing the future.
2nd LBBW Engineering & Technology Investment DaySeptember 02, 2010
18
ThyssenKrupp CSA:Blow in BF #1on July 12

Developing the future.
2nd LBBW Engineering & Technology Investment DaySeptember 02, 2010
19
ThyssenKruppSteel USA:
1st Coil on July 31

Developing the future.
2nd LBBW Engineering & Technology Investment DaySeptember 02, 2010
20
Stainless Global
Q3 2009/10 Highlights
Comments Q3 (qoq)
Q1 Q2 Q3 Q4 Q1
2008/09
Order intake in €m
Current trading conditions
2009/10
(367)
EBT in €m
2009/102008/09
(202)(243)
(59)(114)
Q1
Q2
Q3
Q4Q1
(156) (69)(307)
EBT adjustedEBT
(117)
Q2
Q2
Positive earnings due to higher transaction prices, ongoing high capacity utilization and positive nickel hedge effect
Continuing increase in transaction prices throughout the whole quarter
Lower order intake due to cautious ordering by service centers (decreasing nickel price by end of Q3)
Seasonally lower volumes and capacity utilization (mainly Italy), but robust demand from end customersDecreasing base prices and alloy surcharges in July and August, increase in base prices intended from SeptemberSeasonal and nickel price-related de-stocking from normal levels; pick-up in demand from September likely
967 8181,207 1,155 943
1,560
64Q3
Q3
1,317

Developing the future.
2nd LBBW Engineering & Technology Investment DaySeptember 02, 2010
21
Shipments Stainless*: Hot-rolled and cold-rolled productsCrude steel output*
1,000 t/quarter
Stainless Global: Output, Shipments and Average Transaction Price
Q1Fiscal year
2005/06
2008/09
Q2
* including carbon, forging, Ni-Alloys
Q3 Q4 Q1Fiscal year
2005/06
2008/092006/07 Q2
Hot-rolled, including slabsCold-rolled, including precision strip
567510
Q3 Q1Q4
98 9577
95
7089
122
161
118
90
123
161
82100
171
8294
123 125
177
9892
134
2007/08
Q12005/06Q2 Q3 Q4Q1
2004/05
Q2 Q3 Q4 Q1
2006/07
Q2 Q3 Q4 Q1 Q2 Q3 Q4
2006/07
2008/09
Q1 Q2 Q3
375327
450
Q1
Average transaction price per ton, indexed
Q1 2004/2005 = 100
* consolidated
531
Q4 Q1
2007/08
1,000t/quarter
516504
2007/082009/10
690630 624
465
315
525591 603 84 87
126
441 426 429
6054
99135
315 273 351 396
147
357
2009/10
2009/10
657
Q2 Q2
129
447
576
Q2
Q3
665
Q3
534
Q3
412
122

Developing the future.
2nd LBBW Engineering & Technology Investment DaySeptember 02, 2010
22
Materials Services
Q3 2009/10 Highlights
Comments Q3 (qoq)
Q1 Q2 Q3 Q4 Q1
2008/09
Order intake in €m
Current trading conditions
2009/10
EBT in €m
2009/102008/09
30
112
(91)(128)(106)Q1
Q2 Q3 Q4
Q1(19)
31
EBT adjustedEBT
60
Q2
Q2
Improvement in volumes and prices throughout all product groups
Demand strongly supported by German automotive and mechanical engineering customers
All Operating Units with improving earnings
Restructuring efforts bearing fruits
Continuing underlying demand strength and moderate seasonal impact in Europe
Cash-conscious inventory management across all customer groups
4,016
2,719 2,4692,881 2,681
3,059
144
Q3
Q3
3,695
Developing the future.
2nd LBBW Engineering & Technology Investment DaySeptember 02, 2010
23
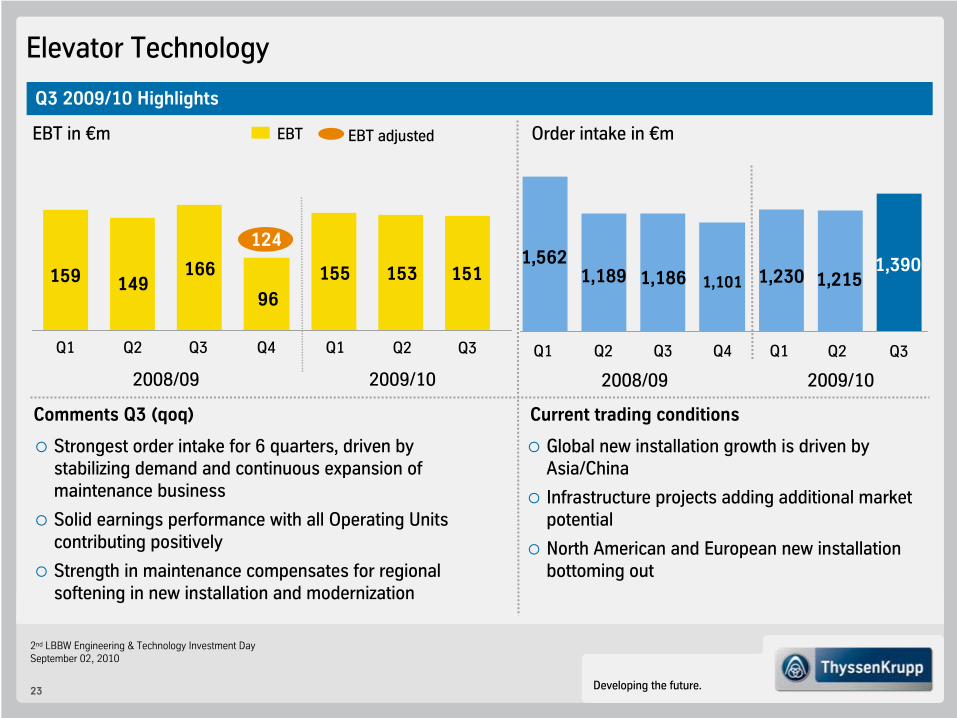
Elevator Technology
Q3 2009/10 Highlights
Comments Q3 (qoq)
Q1 Q2 Q3 Q4 Q1
2008/09
Order intake in €m
Current trading conditions
2009/102008/09
Q1 Q2 Q3 Q4 Q1
149159 15596
166
EBT in €m
2009/10
124
EBT adjustedEBT
Q2
153
Q2
Global new installation growth is driven by Asia/China
Infrastructure projects adding additional market potential
North American and European new installation bottoming out
Strongest order intake for 6 quarters, driven by stabilizing demand and continuous expansion of maintenance business
Solid earnings performance with all Operating Units contributing positively
Strength in maintenance compensates for regional softening in new installation and modernization
1,5621,189 1,186 1,101 1,230 1,215
Q3
151
Q3
1,390

Developing the future.
2nd LBBW Engineering & Technology Investment DaySeptember 02, 2010
24
Elevator Technology: Strategic Direction
Performance Improvement Growth of Service Business
850,000
900,000
950,000
1,000,000
2007/08 2008/09
Units under maintenance
+100,000Units
Efficient and global production network
Harmonized product portfolio based on global platforms
Focus on Service & Modernization
Standardization of processes
Q1 Q2 Q3 Q4 Q1 Q2
2008/09 2009/10
14
EBIT %EBIT adj. €m
250
150
Q1 Q2 Q3 Q4
2007/08
9.1%
11.2%12.2%
50
10
6
2
Q3
Developing the future.
2nd LBBW Engineering & Technology Investment DaySeptember 02, 2010
25
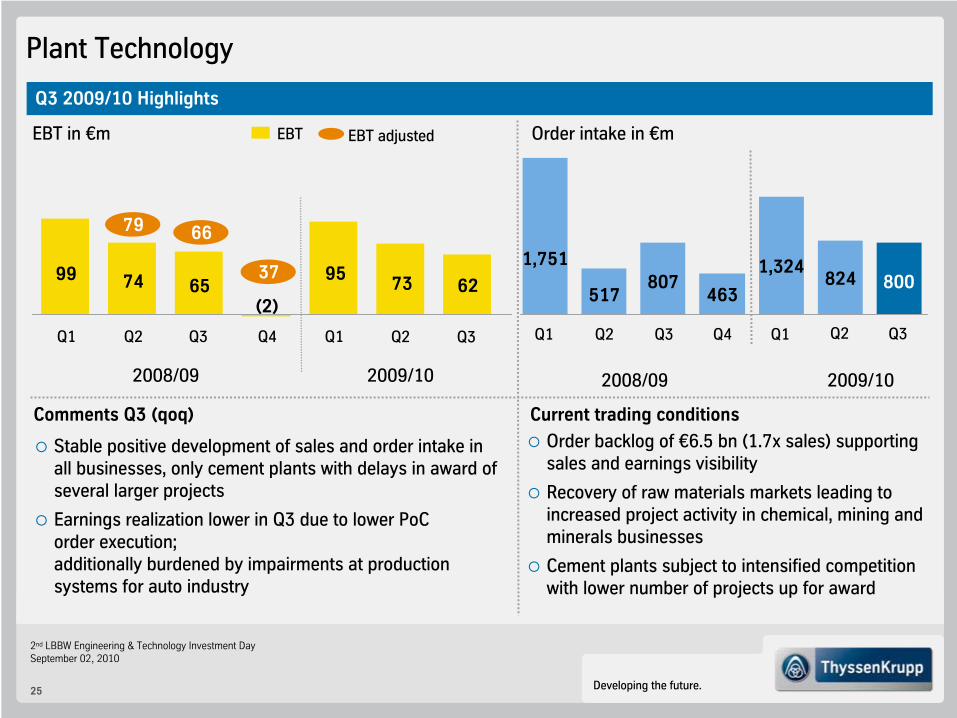
Plant Technology
Q3 2009/10 Highlights
Comments Q3 (qoq)
Q1 Q2 Q3 Q4 Q1
2008/09
Order intake in €m
Current trading conditions
2009/102008/09
Q1 Q2 Q3 Q4 Q1
7499 95
(2)65
EBT in €m
2009/10
79 66
37
EBT adjustedEBT
Q2
73
Q2
1,751
517807
463
1,324824
Q3
62
Q3
800
Stable positive development of sales and order intake in all businesses, only cement plants with delays in award of several larger projects
Earnings realization lower in Q3 due to lower PoCorder execution; additionally burdened by impairments at production systems for auto industry
Order backlog of €6.5 bn (1.7x sales) supporting sales and earnings visibility
Recovery of raw materials markets leading to increased project activity in chemical, mining and minerals businesses
Cement plants subject to intensified competition with lower number of projects up for award
Developing the future.
2nd LBBW Engineering & Technology Investment DaySeptember 02, 2010
26
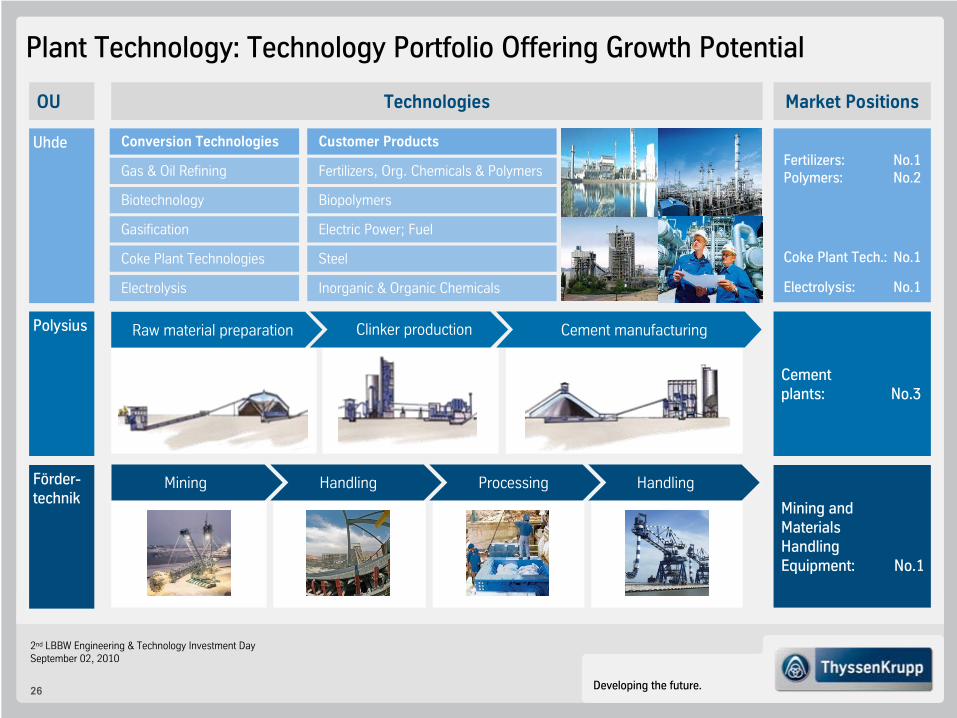
Plant Technology: Technology Portfolio Offering
Growth Potential
OU
Polysius
Förder-
technik
Uhde
Technologies Market Positions
Gas & Oil Refining
Biotechnology
Gasification
Coke
Plant Technologies
Electrolysis
HandlingProcessingHandlingMining
Mining and Materials
Handling
Equipment: No.1
Cement
plants:
No.3
Conversion
Technologies Customer
Products
Fertilizers, Org. Chemicals
& Polymers
Biopolymers
Electric Power; Fuel
Steel
Inorganic
& Organic
Chemicals
Raw
material preparation Clinker
production Cement
manufacturing
Fertilizers: No.1Polymers: No.2
Coke
Plant Tech.: No.1
Electrolysis: No.1

Developing the future.
2nd LBBW Engineering & Technology Investment DaySeptember 02, 2010
27
Plant Technology: Order Q3 09/10 for Oil Sand Mining Equipment Largest Single Order in the History of Fördertechnik
Customer: Imperial Oil
Turn-key order for engineering, procurement, construction & commissioning of oil sand preparation plant, consisting of:
•
New-generation crushing plant
•
3 large conveyor systems
•
Surge bin (storage silo): 10,000 t capacity
•
2 complete slurry preparation plants: capacity 2 x 6,000 t/h
oil sand
Production capacity of Imperial Oil project: 100,000 bbl/day
Order volume: > €300 m
Commissioning: 2012

Developing the future.
2nd LBBW Engineering & Technology Investment DaySeptember 02, 2010
28
Components Technology
Q3 2009/10 Highlights
Comments Q3 (qoq)
Q1 Q2 Q3 Q4 Q1
2008/09
Order intake in €m
Current trading conditions
2009/102008/09
Q1Q2
Q3
Q4
Q1
53 43
EBT in €m
2009/10
(363)
(47) (101)
(21) (76) (104)
EBT adjustedEBT
Q2
63
Q2
1,2901,016 899 972 1,169 1,337
Q3
58
Q3
1,584
105
Further increase in sales and EBT adjusted, mainly driven by demand pick-up in auto supply business and restructuring measures initiated in previous year
Construction equipment and slewing bearings business with increasing order intake for three quarters
Continued restructuring (€47 m in Q3):capacity adjustments at chassis components (Germany) and construction equipment business (Italy)
After strong growth of auto industry (mainly driven by export markets China and USA; recently also positive development also with commercial vehicles) slight slowdown expected
Continued recovery in construction equipment and slewing bearings business

Developing the future.
2nd LBBW Engineering & Technology Investment DaySeptember 02, 2010
29
Heavy
Commercial Vehicles
Automotive Components
Components Technology: Recovery of Order Intake
Passenger Cars/ Light Comm. Vehicles
COMPONENTS TECHNOLOGY
Quarterly
Order Intake
Q4Q3Q2Q1
2008/09
Q3Q2Q1
2009/10
Large-diameter
bearings & rings
Industrial & Construction Machinery
Undercarriages for
tracked/crawler equipm.
Quarterly
Order Intake
Q4Q3
2007/08
Q4Q3Q2Q1
2008/09
Q3Q2Q1
2009/10
Q4Q3
2007/08

Developing the future.
2nd LBBW Engineering & Technology Investment DaySeptember 02, 2010
30
~100
Marine Systems
Q3 2009/10 Highlights
Comments Q3 (qoq)
Q1 Q2
Q3
Q4
Q1
2008/09
Order intake in €m
1,856
193(339)
(840)
Current trading conditions
2009/10
110
2008/09
Q1
Q2 Q3
Q4
Q1
33(10)
EBT in €m
2009/10
(343)
(117) (127)~1,000
~500
Impact of cancellations
(container
ships, mega
yachts,
submarines Greece)
(47) (31) (45) (5)
EBT adjustedEBT
Q2
(7)
8
Q2
139Q3(23)
(4)
Q3
108
Implementation of new target structure (Hamburg site) before closing, corresponding regulatory approval procedures initiated and in part already completed
Negative earnings of Hellenic Shipyards (HSY) adjusted as “special items” due to non-going-concern assumption
Operating losses mainly due to underutilization in shipbuilding, partly compensated by sale of cancelled container ships
Recovery of merchant shipping market leading to pick-up of market for repairs and conversions
Q4 also burdened by underutilization in civil shipbuilding
Developing the future.
2nd LBBW Engineering & Technology Investment DaySeptember 02, 2010
31
Group Performance and Financials
Business Area Performance
Group Outlook
Agenda

Developing the future.
2nd LBBW Engineering & Technology Investment DaySeptember 02, 2010
32
Outlook FY 2009/10 –
Return to Profitability
EBT adjusted
Sales
EBIT adjusted
KPI Updated
Outlook
Mid to higher three-digit
million €
positive,
Slight improvement
> €1 billion,
incl. project costs, startup losses, depreciation and interest expenses of Americas projects (mid-range three-digit million €)
incl. project costs, startup losses and depreciation of Americas
projects
Moderate stabilization
Low three-digit
million €
positive,
High three-digit
million €
positive,
Previous
Outlook
Developing the future.
2nd LBBW Engineering & Technology Investment DaySeptember 02, 2010
33
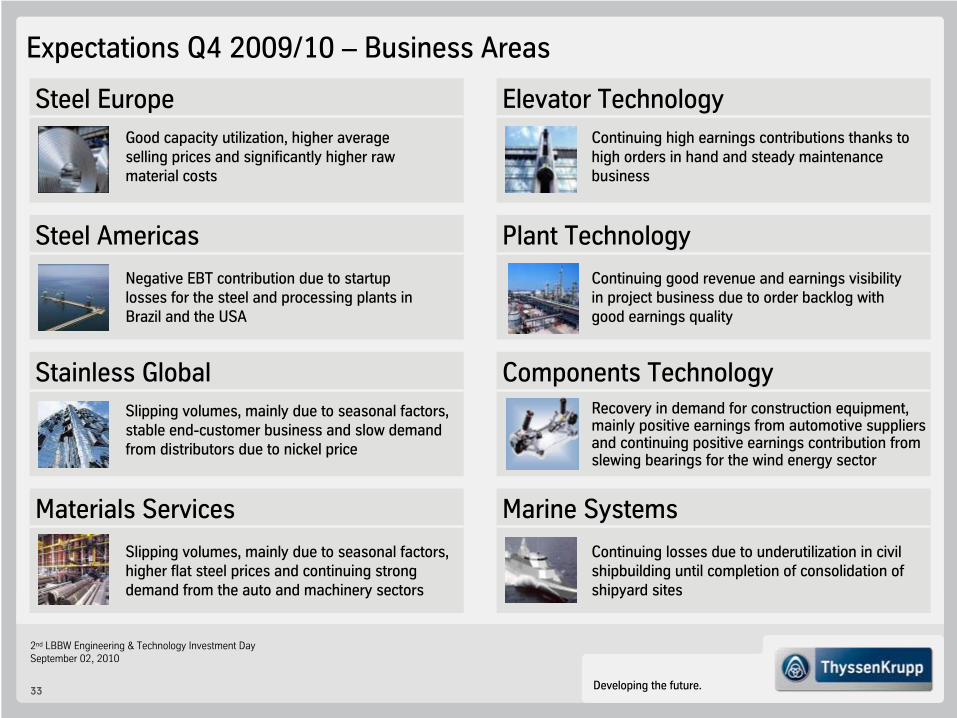
Expectations Q4 2009/10 –
Business Areas
Steel EuropeGood capacity utilization, higher average selling prices and significantly higher raw material costs
Steel Americas
Negative EBT contribution due to startup losses for the steel and processing plants in Brazil and the USA
Stainless GlobalSlipping volumes, mainly due to seasonal factors, stable end-customer business and slow demand from distributors due to nickel price
Materials Services
Elevator TechnologyContinuing high earnings contributions thanks to high orders in hand and steady maintenance business
Plant Technology
Continuing good revenue and earnings visibility in project business due to order backlog with good earnings quality
Components
TechnologyRecovery in demand for construction equipment, mainly positive earnings from automotive suppliers and continuing positive earnings contribution from slewing bearings for the wind energy sector
Marine Systems
Continuing losses due to underutilization in civil shipbuilding until completion of consolidation of shipyard sites
Slipping volumes, mainly due to seasonal factors, higher flat steel prices and continuing strong demand from the auto and machinery sectors

Developing the future.
2nd LBBW Engineering & Technology Investment DaySeptember 02, 2010
34
The
Way Forward to Sustainable
Value Creation
Liquidity ProfitabilityValue
Creation
TKVA and FCF > 0
Operating cash flow: €3.7 bn
Capex reduction:< €4.3 bn spent
€3 bn bonds issued
Increase of Vale stake in CSA to 26.87% (from 10%) for €965 m
Divestments at Industrial Services
Strong cost control
Realization of sustainable cost savings: €1.5 - €2.0 bn targeted in FY 2010/11
Continued reduction of structural overcapacities
Increased external transparency and benchmarking
Strong cost control
Accelerated startup of Steel Americas and startup of Stainless USA with high degree of flexibility
Focus on FCF generation
Portfolio under review
FY 2009/10 FY 2010/11 et seq.FY 2008/09
Growth Structural Performance
Commerzbank
Sector Conference Week
Frankfurt –
August 26, 2010
Dr. Claus Ehrenbeck, Head
of Investor Relations
Developing the future.
2nd LBBW Engineering & Technology Investment DaySeptember 02, 2010
36
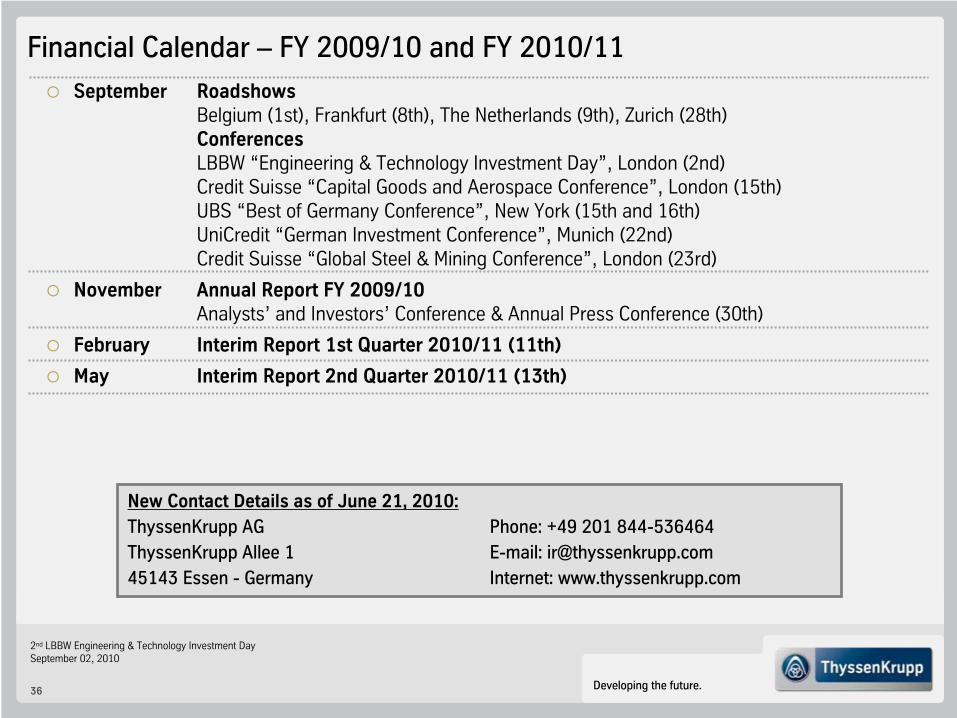
Financial Calendar –
FY 2009/10 and FY 2010/11September Roadshows
Belgium (1st), Frankfurt (8th), The Netherlands (9th), Zurich (28th)ConferencesLBBW “Engineering & Technology Investment Day”, London (2nd)Credit Suisse “Capital Goods and Aerospace Conference”, London (15th)UBS “Best of Germany Conference”, New York (15th and 16th)UniCredit “German Investment Conference”, Munich (22nd)Credit Suisse “Global Steel & Mining Conference”, London (23rd)
November Annual Report FY 2009/10Analysts’ and Investors’ Conference & Annual Press Conference (30th)
February Interim Report 1st Quarter 2010/11 (11th)
May Interim Report 2nd Quarter 2010/11 (13th)
Phone: +49 201 844-536464 E-mail: [email protected]: www.thyssenkrupp.com
New Contact Details as of June 21, 2010:ThyssenKrupp AGThyssenKrupp Allee
145143 Essen -
Germany

Developing the future.
2nd LBBW Engineering & Technology Investment DaySeptember 02, 2010
37
New Contact Details as of June 21, 2010 ThyssenKrupp Corporate Center Investor Relations
NEW phone numbers
+49 201-844-
Dr. Claus Ehrenbeck
-536464
Rainer Hecker
-538830
Head of Investor Relations
Senior IR Manager
Stefanie Bensch
-536480
Christian Schulte
-536966
Assistant
Senior IR Manager
Iris aus
der
Wieschen
-536367
Sabine Berger
-536420
Team assistant
IR Manager
Ute Kaatz
-536466
Klaudia
Kelch
-538371
Event Manager
IR Manager
Tim Lange
-536309
IR Manager
To be added to the IR mailing list, send us a brief e-mail with your details!
E-mail: [email protected]

Developing the future.
2nd LBBW Engineering & Technology Investment DaySeptember 02, 2010
38
Appendix

Developing the future.
2nd LBBW Engineering & Technology Investment DaySeptember 02, 2010
39
ElevatorTechnologies ServicesStainlessSteel
(Sales FY 2008/09; inter-BA
sales
not
consolidated)
Sales: €40.6 bn
ThyssenKrupp*
ThyssenKrupp Group: Higher
Transparency
Steel Europe
Sales €9,570 m
Stainless Global
Sales €4,486 m
Steel Americas
Sales €0 m
Materials Services
Sales €12,815 m
Elevator Technology
Sales €5,308 m
Plant Technology
Sales €4,450 m
Components Technology
Sales €4,603 m
Marine Systems
Sales €1,594 m
effective sinceOctober 1st, 2009
ThyssenKrupp
Reorganization
* The ThyssenKrupp Group consists of more than 800 legally independent companies, organized, existing and operating under the laws of 70 countries, ultimately led by ThyssenKrupp AG.
Developing the future.
2nd LBBW Engineering & Technology Investment DaySeptember 02, 2010
40
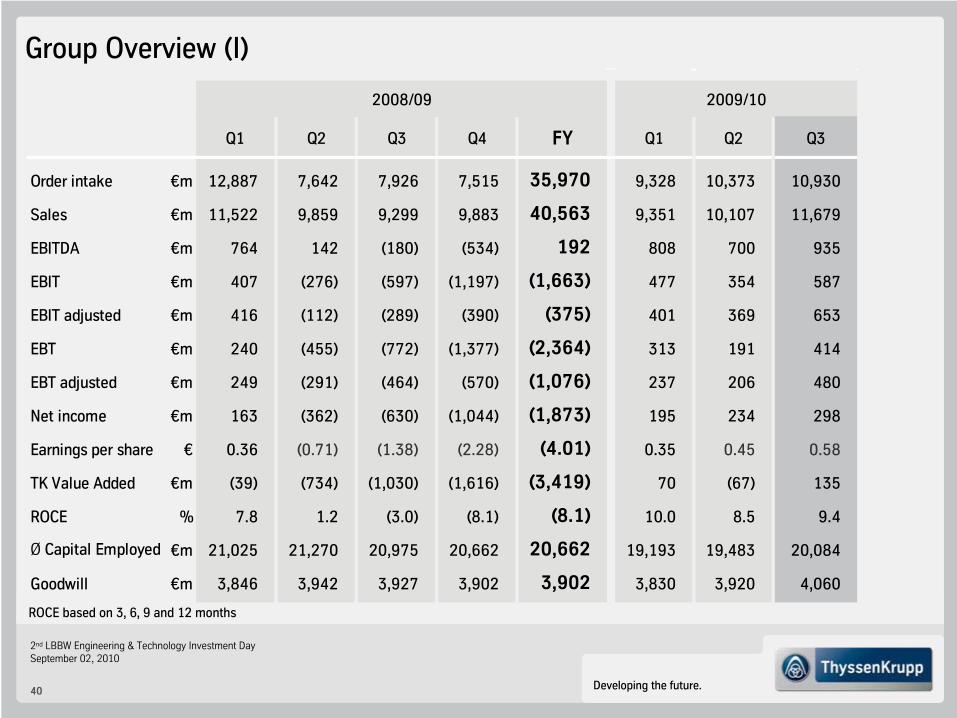
Group Overview (I)
ROCE based
on 3, 6, 9 and 12 months
Q1 Q2 Q3 Q4 FY Q1 Q2 Q3
Order intake €m 12,887 7,642 7,926 7,515 35,970 9,328 10,373 10,930
Sales €m 11,522 9,859 9,299 9,883 40,563 9,351 10,107 11,679
EBITDA €m 764 142 (180) (534) 192 808 700 935
EBIT €m 407 (276) (597) (1,197) (1,663) 477 354 587
EBIT adjusted €m 416 (112) (289) (390) (375) 401 369 653
EBT €m 240 (455) (772) (1,377) (2,364) 313 191 414
EBT adjusted €m 249 (291) (464) (570) (1,076) 237 206 480
Net income €m 163 (362) (630) (1,044) (1,873) 195 234 298
Earnings per share € 0.36 (0.71) (1.38) (2.28) (4.01) 0.35 0.45 0.58
TK Value Added €m (39) (734) (1,030) (1,616) (3,419) 70 (67) 135
ROCE % 7.8 1.2 (3.0) (8.1) (8.1) 10.0 8.5 9.4
Ø Capital Employed €m 21,025 21,270 20,975 20,662 20,662 19,193 19,483 20,084
Goodwill €m 3,846 3,942 3,927 3,902 3,902 3,830 3,920 4,060
2008/09 2009/10
Developing the future.
2nd LBBW Engineering & Technology Investment DaySeptember 02, 2010
41
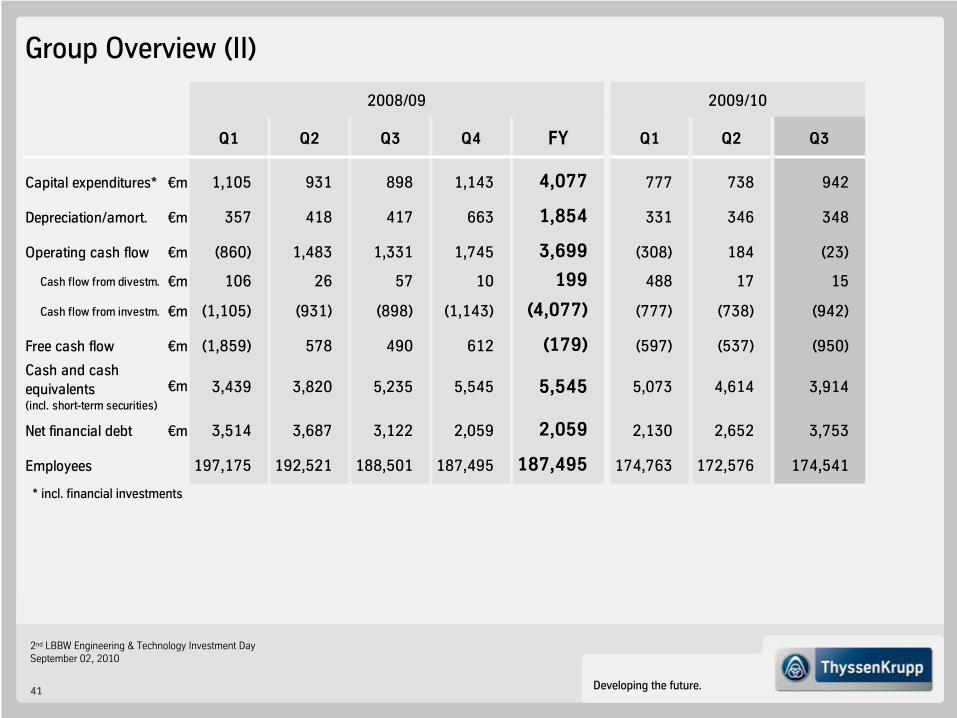
Group Overview (II)
* incl. financial investments
Q1 Q2 Q3 Q4 FY Q1 Q2 Q3
Capital expenditures* €m 1,105 931 898 1,143 4,077 777 738 942
Depreciation/amort. €m 357 418 417 663 1,854 331 346 348
Operating cash flow €m (860) 1,483 1,331 1,745 3,699 (308) 184 (23)
Cash flow from divestm. €m 106 26 57 10 199 488 17 15
Cash flow from investm. €m (1,105) (931) (898) (1,143) (4,077) (777) (738) (942)
Free cash flow €m (1,859) 578 490 612 (179) (597) (537) (950)
Cash and cash equivalents (incl. short-term securities)
€m 3,439 3,820 5,235 5,545 5,545 5,073 4,614 3,914
Net financial debt €m 3,514 3,687 3,122 2,059 2,059 2,130 2,652 3,753
Employees 197,175 192,521 188,501 187,495 187,495 174,763 172,576 174,541
2008/09 2009/10

Developing the future.
2nd LBBW Engineering & Technology Investment DaySeptember 02, 2010
42
~ 1.8
~ 1.0
~ 0.8
1.5 –
2.0
~ 1.3
Efficiency Improvement –
Targeted Sustainable Cost Savings
Targeted sustainable cost savings
billion €
Based on existingrestructuring measures/initiatives
Excluding effects fromportfolio optimization
Additional restructuringmeasures at ComponentsTechnology deliveringadditional savings
FY
2008/09
FY
2010/11E
Q2
2009/10
Realized management gains
billion €
Q1
2009/10
Q3
2009/10
sustain-
able
~ 1.2
~ 1.4

Developing the future.
2nd LBBW Engineering & Technology Investment DaySeptember 02, 2010
43
Development of operating cash flow in 9M 2009/10
million €
Operating Cash Flow
Operating
cash flow
1,025D/A
Net
income
Deferred taxes
727(170)
(128)
(147)
Change in
accruedpensions
(150)Others
Inventories
(1,099)
Trade accounts receivable
(1,193)
Trade accounts payable
728 (298)
Other provisions
411
Other assets/
liabilities*
* not related to investing or financing activities
1)
1) Other assets/liabilities & operating cash flow in Q1 restated by
€170 m
to €(242) m & €(308) m related to disposal of TKIN and Safway
1)

Developing the future.
2nd LBBW Engineering & Technology Investment DaySeptember 02, 2010
44
Net Financial Debt
Free cash flow: (2,084)
Capex*
Net financialdebt
Sep 2009
Net financialdebt
Jun 2010
(3,753)
(2,457)
Gearing34.3%
Operatingcash flow
(147)
(2,059)
Gearing21.2%
520
Divestments
thereof:•
Steel Europe 160• Steel Americas
1,524thereof:
TK CSA 735
NAFTA Steel
789
•
Stainless Global
243 thereof:
NAFTA Stainless
184• Materials Services
138• Elevator Technology 42• Plant Technology
17•
Components Technology
162• Marine Systems
3
Others
Development of net financial debt in 9M 2009/10
million €
* Capex
for property, plant & equipment + financial & intangible assets
529
Dividend(139)
1) Divestments & operating cash flow in Q1 restated by €170 m
to €488 m & €(308) m related to disposal of TKIN and Safway
1)
1)

Developing the future.
2nd LBBW Engineering & Technology Investment DaySeptember 02, 2010
45
55.2%
7,671
177
8,327
4,235
2,833
34.0% 2.2%
Balance Sheet Structure
Equity
Net financial
position
(8.4)%
Sep 2006Sep 2005Sep 2004Sep 2003
8,927
(747)*
7,944
10,447
(223)*
Sep 2008
(2.1)%
Sep 2007
11,489
1,584
13.8%
25.4% 26.7% 22.1% 24.5% 27.4% 27.6% Equity ratio
Gearing
* Net financial receivablesSep 2009
21.2%
23.4%
9,696
2,059
Net financial position, equity and ratios
million €
Jun 2010
10,941
3,753
34.3%
24.2%

Developing the future.
2nd LBBW Engineering & Technology Investment DaySeptember 02, 2010
46
Solid Financial Situation –
No Short-Term Refinancing Needs
4th quarter2009/10
2010/11 2011/12 2012/13 2013/14 after
2013/14
Available committed credit facilities
Cash and cash equivalents
250
1,140
308
1,712
2,428
4,563
1,8293,914*
* incl. securities of €6 million
8,477
Total: 7,667
Liquidity analysis and maturity profile of gross financial debt as of June 30, 2010
million €

Developing the future.
2nd LBBW Engineering & Technology Investment DaySeptember 02, 2010
47
Pension Obligations: TK with Mature Pension Schemes
Number of plan participants steadily decreasing
>70% of obligations owed to retired employees, average age >75 years
Declining pension obligations over time(short-term variation possible, mainly due to change in discount rate)
Declining cash-out from pension benefit payments(2008/09: €578 m; 2010/11e: €555 m)
Expected Normalized* Development of Accrued Pension and Similar Obligations (in €
m)
“Patient” long-term debt, no immediate redemption in one go
Interest cost independent of ratings, covenants etc.
Mainly funded by TK’s operating assets
Vital part of compensation system
Accrued
pension
liability
Accrued
postretirement
oblig. other
than
pensions
Other
accrued
pension-related
obligations
6,498
1,346
349
8,193
Accrued Pension and Similar Obligations
(Jun 30, 2010; in €
m)
7,537
08/09 09/10 10/11 11/12 12/13 13/14 …
- 100-
200 p.a.
* Assumption: unchanged discount rate

Developing the future.
2nd LBBW Engineering & Technology Investment DaySeptember 02, 2010
48
Long term-
Short term-
Outlookrating
rating
Standard & Poor’s
BB+
B
stable
Moody’s
Baa3
Prime-3 negative
Fitch
BBB-
F3
stable
Restoring / maintaining investment grade statuswith all three rating agencies is key!
ThyssenKrupp Rating
Upgrade
Outlook
(July 2010)

Developing the future.
2nd LBBW Engineering & Technology Investment DaySeptember 02, 2010
49
Steel Europe
Key figures
ROCE based
on 3, 6, 9 and 12 months
Q1 Q2 Q3 Q4 FY Q1 Q2 Q3
Order intake €m 1,866 1,479 2,223 2,324 7,892 2,500 2,999 2,706
Sales €m 2,848 2,326 2,151 2,245 9,570 2,281 2,667 2,887
EBITDA €m 518 277 (147) (161) 487 275 327 342
EBIT €m 362 128 (296) (328) (134) 126 179 200
EBIT adjusted €m 371 131 (156) (262) 84 126 179 200
EBT €m 345 109 (312) (339) (197) 104 163 183
EBT adjusted €m 354 112 (172) (273) 21 104 163 183
TK Value Added €m 231 (13) (431) (449) (662) 14 62 79
ROCE % 24.9 16.3 4.3 (2.3) (2.3) 10.1 12.0 13.0
Ø Capital Employed €m 5,816 6,023 6,039 5,864 5,864 4,989 5,089 5,183
OCF €m (790) 279 576 588 653 (123) 235 152
CF from divestm. €m 1 14 (9) 180 184 3 (1) 3
CF for investm. €m (102) (125) (103) (106) (436) (39) (68) (53)
FCF €m (893) 168 465 661 401 (159) 166 102
38,048 37,380 36,607 36,416 36,416 35,582 34,872 34,434Employees
2008/09 2009/10

Developing the future.
2nd LBBW Engineering & Technology Investment DaySeptember 02, 2010
50
InventoriesChina
Inventories and Months of Supply -
EuropeInventories and Months of Supply -
USA
0
1
2
3
4
5
6
7
8
9
A 0
7J
07
O 0
7J
08
A 0
8J
08
O 0
8J
09
A 0
9J
09
O 0
9J
10
A 1
0J
10
0.0
0.5
1.0
1.5
2.0
2.5
3.0
J'0
5
J'0
6
J'0
7
J'0
8
J'0
9
J'1
0
1
2
3
4
5
6
7
0
1
2
3
4
5
6
7
8
9
J'0
5
J'0
6
J'0
7
J'0
8
J'0
9
J'1
0
1.5
2.0
2.5
3.0
3.5
4.0
4.5
Steel: Inventories and Months of Supply
Source(s): TKS, EASSC, Credit Suisse, MSCI, UBS, MySteel
Europe: European SSC: Inventories
at month
end / flat
carbon
steel
w/o quarto
Inventories[m t]
MOS[months]
USA: June
MSCI inventories, carbon
flat-rolled
Inventories[m st]
MOS[months]
China: flat
steel inventory in 23 major cities (HR, CR and Plate)
Inventories[m t]

Developing the future.
2nd LBBW Engineering & Technology Investment DaySeptember 02, 2010
51
Construction
Sales by Maturity FY 2008/09
in %
Sales by Industry FY 2008/09
in %
33
4
2216
9
11
5
Quarterly
Half-yearAnnual &>1 year
Spot
6510
15
10
Long Term Customer Relations Establish Lower Volatility
Others Automotive industry (incl. suppliers)
Packaging
Trade
Mechanical Engineering
Steel and steel-
related processing
Price index
hot rolled
Index (Q3 1997 = 100)
60
80
100
120
140
160
180
200
220
240
260
All data incl. Q2 2010Sources: CRU and own calculations based on CRU, TKSE
CRU
ThyssenKruppSteel Europe
ThyssenKrupp Steel Europe (external
sales)
German market
(CRU)
98 00 02 04 06 08 10
Developing the future.
2nd LBBW Engineering & Technology Investment DaySeptember 02, 2010
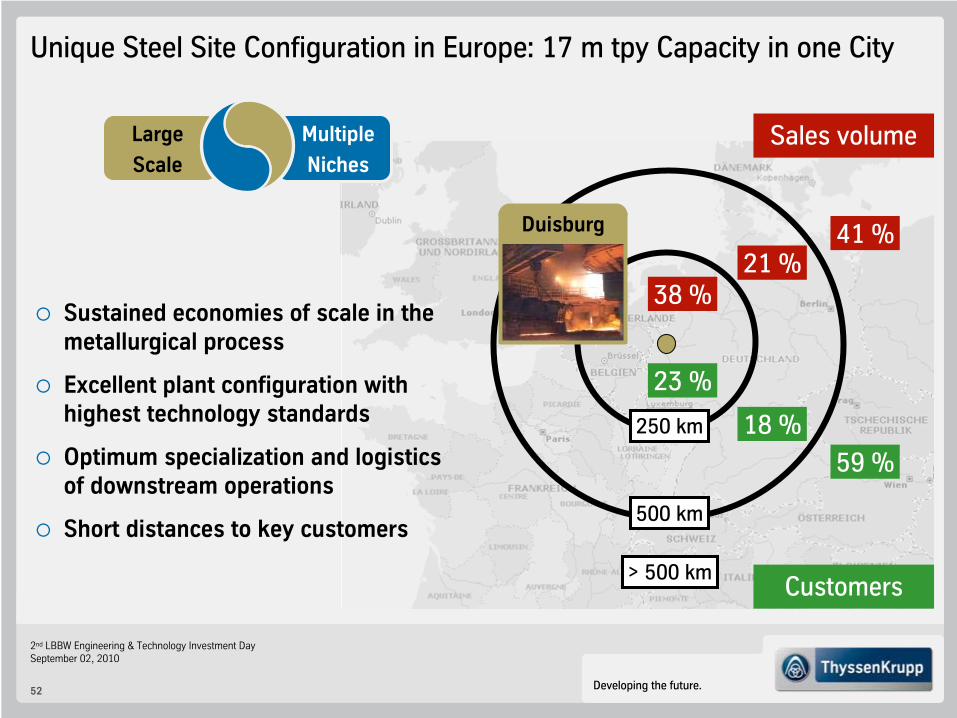
52
Sustained economies of scale in the metallurgical process
Excellent plant configuration with highest technology standards
Optimum specialization and logistics of downstream operations
Short distances to key customers
Unique Steel Site Configuration in Europe: 17 m tpy
Capacity in one City
21
%41
%
38
%
59
%
18
%
23
%
250 km
500 km
> 500 km
Sales volume
Customers
Duisburg
Multiple
Niches
Large
Scale

Developing the future.
2nd LBBW Engineering & Technology Investment DaySeptember 02, 2010
53
Steel Americas
ROCE based
on 3, 6, 9 and 12 months
Key figures
Q1 Q2 Q3 Q4 FY Q1 Q2 Q3
Order intake €m 0 0 0 0 0 0 23 24
Sales €m 0 0 0 0 0 0 23 24
EBITDA €m (40) 0 10 (43) (73) 38 8 (14)
EBIT €m (42) 0 9 (44) (77) 37 7 (26)
EBIT adjusted €m (42) 0 9 (44) (77) 37 7 (26)
EBT €m (76) (22) (19) (99) (216) (4) (32) (62)
EBT adjusted €m (76) (22) (19) (99) (216) (4) (32) (62)
TK Value Added €m (102) (73) (73) (141) (389) (80) (125) (174)
ROCE % (6.2) (2.8) (1.4) (2.2) (2.2) 2.8 1.6 0.4
Ø Capital Employed €m 2,698 2,960 3,184 3,475 3,475 5,219 5,527 5,891
OCF €m (39) (55) 15 69 (10) (171) (93) (221)
CF from divestm. €m 0 0 19 (1) 19 2 1 5
CF for investm. €m (610) (435) (483) (608) (2,135) (455) (448) (622)
FCF €m (649) (490) (448) (540) (2,126) (624) (539) (839)
1,263 1,529 1,590 1,659 1,659 1,794 2,256 2,876Employees
2008/09 2009/10
Developing the future.
2nd LBBW Engineering & Technology Investment DaySeptember 02, 2010
54
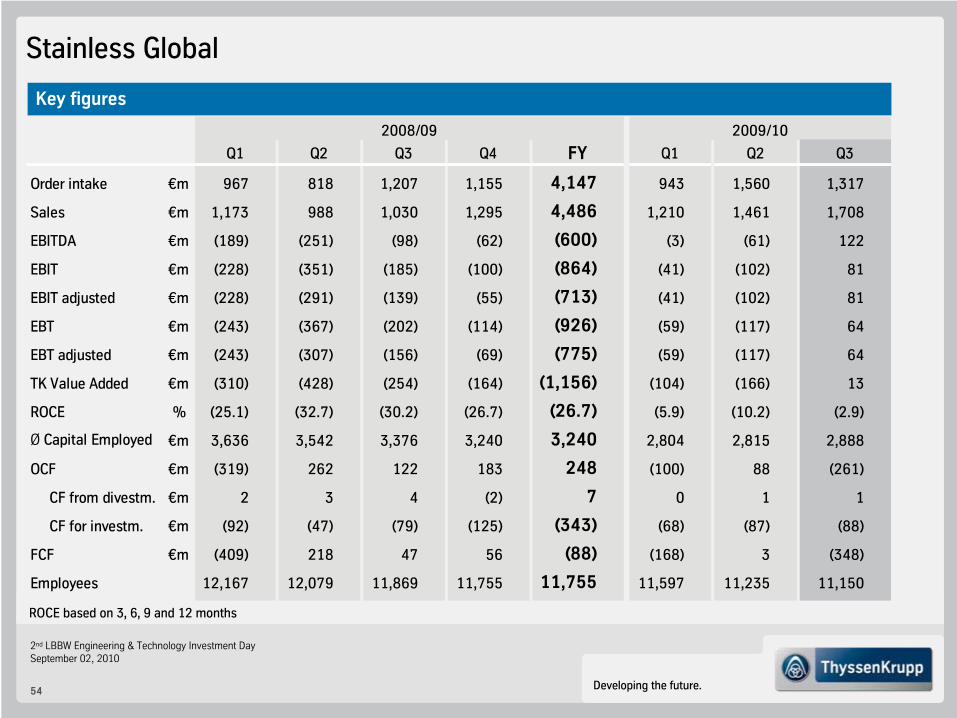
Stainless Global
ROCE based
on 3, 6, 9 and 12 months
Key figures
Q1 Q2 Q3 Q4 FY Q1 Q2 Q3
Order intake €m 967 818 1,207 1,155 4,147 943 1,560 1,317
Sales €m 1,173 988 1,030 1,295 4,486 1,210 1,461 1,708
EBITDA €m (189) (251) (98) (62) (600) (3) (61) 122
EBIT €m (228) (351) (185) (100) (864) (41) (102) 81
EBIT adjusted €m (228) (291) (139) (55) (713) (41) (102) 81
EBT €m (243) (367) (202) (114) (926) (59) (117) 64
EBT adjusted €m (243) (307) (156) (69) (775) (59) (117) 64
TK Value Added €m (310) (428) (254) (164) (1,156) (104) (166) 13
ROCE % (25.1) (32.7) (30.2) (26.7) (26.7) (5.9) (10.2) (2.9)
Ø Capital Employed €m 3,636 3,542 3,376 3,240 3,240 2,804 2,815 2,888
OCF €m (319) 262 122 183 248 (100) 88 (261)
CF from divestm. €m 2 3 4 (2) 7 0 1 1
CF for investm. €m (92) (47) (79) (125) (343) (68) (87) (88)
FCF €m (409) 218 47 56 (88) (168) 3 (348)
12,167 12,079 11,869 11,755 11,755 11,597 11,235 11,150Employees
2008/09 2009/10

Developing the future.
2nd LBBW Engineering & Technology Investment DaySeptember 02, 2010
55
Stainless Global: Price Development
and Import Situation
25.3
42.145.542.344.644.5
25.4
41.539.338.8
22.219.9
36.0
51.9
41.9
21.5
20
05
20
06
20
07
20
08
20
09
Jul
Aug
Sep Oct
Nov Dec
Jan
Feb
Mar
Apr
May
Asia Americas Others
Price development: recovery gaining sustainability Cold-rolled
imports
from
third
countries
[000t/Month]
Regional price
development*
0
2,000
4,000
6,000
8,000
Jan-05 Jan-06 Jan-07 Jan-08 Jan-09 Jan-10
China
USA
Europe
* AISI 304 (1.4301) CR Flat, 2 mmSource: CRU August 2010 (EU+USA), SL-SKS August 2010 (Wuxi Market prices CHINA)
0
500
1,000
1,500
2,000
2,500
3,000
3,500
4,000
4,500
5,000
Jan-06
Jul Jan-07
Jul Jan-08
Jul Jan-09
Jul Jan-10
July0
5,000
10,000
15,000
20,000
25,000
30,000
35,000
40,000
45,000
50,000
55,000
* Base
Price Germany, Traders/SSC, 304, 2mm sheet
Source: CRU August 2010 (August preliminary), Metalprices (NICKEL) August 2010
EUR/t US$/tBase Price EU*
Alloy Surcharge EU
Nickel
Source: Eurofer
July 2010, SL-NR VV-BDG
Aug-10

Developing the future.
2nd LBBW Engineering & Technology Investment DaySeptember 02, 2010
56
Stainless: Inventories
and Stock Reach
0
20
40
60
80
100
120
140
160
Jan-06 Jul Jan-07 Jul Jan-08 Jul Jan-09 Jul Jan-10
Stock Level
Stock Reach
0
20
40
60
80
100
120
140
160
Jan-06 Jul Jan-07 Jul Jan-08 Jul Jan-09 Jul Jan-10
Stock Level
Stock Reach
Germany (cold-rolled
products)
USA (hot-
and cold-rolled
products
all shapes)
Stock level: INDEX Jan 2005 = 100Stock Reach: Calendar
Days
Source: MSCI July 2010
Stock level: INDEX Jan 2005 = 100Stock Reach: Calendar
Days
Average Stock Reach
Source: EHV July 2010
Average Stock Reach
Jun Jun

Developing the future.
2nd LBBW Engineering & Technology Investment DaySeptember 02, 2010
57
Stainless Steel Contract Structure
0% 10% 20% 30% 40% 50%
Short Term Contracts
(<0.5 year)
Medium Term Contracts
(0.5 –
1 year)
Long Term Contracts
(> 1 year) 30%
30%
40%
based on ThyssenKrupp Nirosta Shipments 2008/09
Nickel Alloy Sales by Customer Group
Increasing
Non-Volatile
Customer
Bases Sales structure
within
ThyssenKrupp Stainless
based on shipments, FY 2008/09
Others
SSC/Trading
Tubes
Automotive
Household Applications
Metal Processing 53
107411
7
White Goods8
Distribution
Oil/ Gas
Aerospace/Turbines
Electronics
Chemical/Energy
Automotive
based on net sales, FY 2008/09
8 6
22
2018
26
Stainless Steel Sales by Customer Group

Developing the future.
2nd LBBW Engineering & Technology Investment DaySeptember 02, 2010
58
Materials Services
Key figures
ROCE based
on 3, 6, 9 and 12 months
Q1 Q2 Q3 Q4 FY Q1 Q2 Q3
Order intake €m 4,016 2,719 2,469 2,881 12,085 2,681 3,059 3,695
Sales €m 3,995 3,109 2,751 2,960 12,815 2,760 2,881 3,598
EBITDA €m 100 (46) (64) (28) (38) 168 103 190
EBIT €m 54 (88) (106) (71) (211) 129 70 157
EBIT adjusted €m 54 (88) (106) 1 (139) 48 70 157
EBT €m 30 (106) (128) (91) (295) 112 60 144
EBT adjusted €m 30 (106) (128) (19) (223) 31 60 144
TK Value Added €m (37) (178) (189) (142) (546) 64 7 90
ROCE % 5.0 (1.6) (4.5) (5.3) (5.3) 16.7 13.2 15.5
Ø Capital Employed €m 4,290 4,257 4,133 3,943 3,943 3,081 3,006 3,052
OCF €m (202) 197 390 569 953 (82) (102) (25)
CF from divestm. €m 38 10 11 3 62 308 3 1
CF for investm. €m (70) (59) (50) (100) (279) (90) (20) (28)
FCF €m (234) 147 352 470 735 136 (118) (53)
46,367 45,674 44,744 44,316 44,316 31,972 31,482 32,096Employees
2008/09 2009/10

Developing the future.
2nd LBBW Engineering & Technology Investment DaySeptember 02, 2010
59
Elevator Technology
Key figures
ROCE based
on 3, 6, 9 and 12 months
Q1 Q2 Q3 Q4 FY Q1 Q2 Q3
Order intake €m 1,562 1,189 1,186 1,101 5,038 1,230 1,215 1,390
Sales €m 1,343 1,293 1,328 1,344 5,308 1,226 1,221 1,313
EBITDA €m 174 165 183 118 640 171 168 168
EBIT €m 157 149 168 96 570 154 151 150
EBIT adjusted €m 157 149 168 124 598 154 151 150
EBT €m 159 149 166 96 570 155 153 151
EBT adjusted €m 159 149 166 124 598 155 153 151
TK Value Added €m 125 116 137 68 446 127 123 123
ROCE % 38.3 37.4 39.6 36.7 36.7 45.0 44.7 44.6
Ø Capital Employed €m 1,646 1,639 1,596 1,554 1,554 1,371 1,364 1,360
OCF €m 75 289 170 220 754 87 238 74
CF from divestm. €m 10 4 2 3 19 3 (1) 1
CF for investm. €m (33) (37) (17) (48) (135) (15) (8) (19)
FCF €m 52 256 155 175 638 75 229 56
43,599 43,306 42,761 42,698 42,698 42,926 42,787 43,066Employees
2008/09 2009/10

Developing the future.
2nd LBBW Engineering & Technology Investment DaySeptember 02, 2010
60
Fundamental Trends for Demand in the Elevator Industry
Urbanization Aging Safety/
Energy efficiency
Population
Growth
More people demand for safe transportation within a building
1 2 3 4
1950 1980 2010 20501950 1980 2010 2050 1950 1980 2010 2050
Source: United Nations
People People People 60+
2.5 bn 9.1 bn 0.7 bn 6.3 bn 0.2 bn 2.0 bn SNEL Regulation *
* Safety
Norm of Existing
Lifts

Developing the future.
2nd LBBW Engineering & Technology Investment DaySeptember 02, 2010
61
Infrastructure
Projects Provide
Growth Opportunities
BJ
CSWH
CQCD
QDJN
SY
DL
HF
XMKM
HN
ZS Plant
NB
GY
NC
Urumqi
ZS Escalator Plant
SH SJ Plant
HRB
TJ
YT
GZDG
FZ
ZS SZ
SH
NN
HZ
NJ SZX’A
ZZHQ -SH
Projects in China Projects in India
Guwahati
Jamshedp
ur
Bhubaneswar
Patn
a
Luckno
w
Chandigar
h
Jaipu
r
Madhya
Pradesh Chhatisga
rh
Ranch
i
GoaHyderabad
Madura
i
Coimbatore Pondicherr
y
Gujrat
Mangalo
reMysore
Hubli
Cochi
n
Calicut
Trivandrum
Gurgao
n
AirportsRailwayStations
SubwaySystems
Number
of projects ~100 >100 ~100
AirportsRailwayStations
SubwaySystems
Number
of projects ~100 >400 ~200
Developing the future.
2nd LBBW Engineering & Technology Investment DaySeptember 02, 2010
62
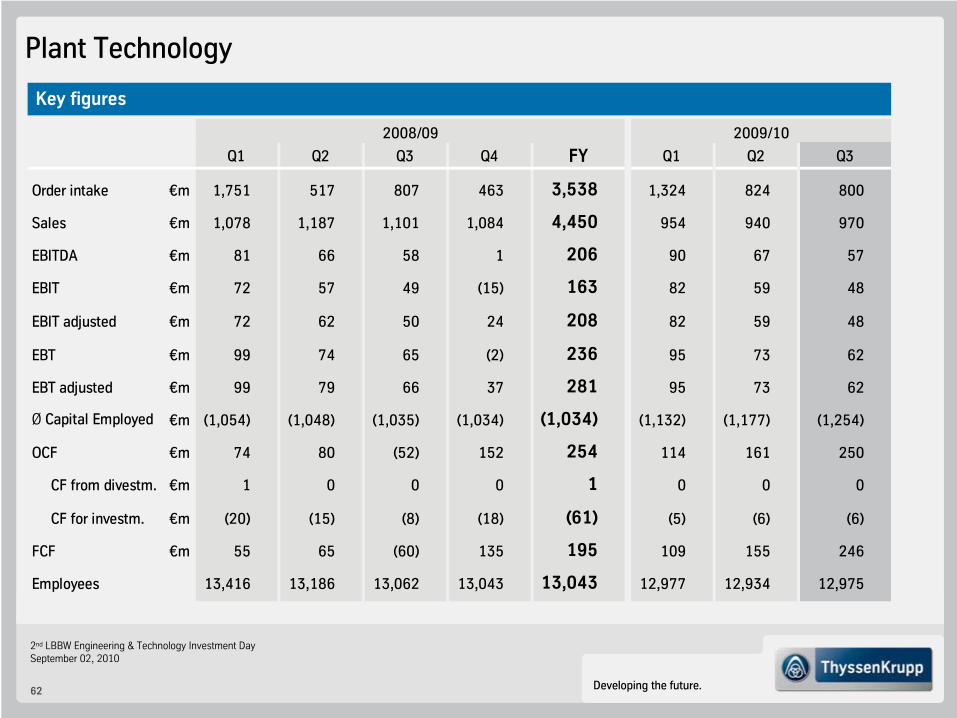
Plant Technology
Key figures
Q1 Q2 Q3 Q4 FY Q1 Q2 Q3
Order intake €m 1,751 517 807 463 3,538 1,324 824 800
Sales €m 1,078 1,187 1,101 1,084 4,450 954 940 970
EBITDA €m 81 66 58 1 206 90 67 57
EBIT €m 72 57 49 (15) 163 82 59 48
EBIT adjusted €m 72 62 50 24 208 82 59 48
EBT €m 99 74 65 (2) 236 95 73 62
EBT adjusted €m 99 79 66 37 281 95 73 62
Ø Capital Employed €m (1,054) (1,048) (1,035) (1,034) (1,034) (1,132) (1,177) (1,254)
OCF €m 74 80 (52) 152 254 114 161 250
CF from divestm. €m 1 0 0 0 1 0 0 0
CF for investm. €m (20) (15) (8) (18) (61) (5) (6) (6)
FCF €m 55 65 (60) 135 195 109 155 246
13,416 13,186 13,062 13,043 13,043 12,977 12,934 12,975Employees
2008/09 2009/10
Developing the future.
2nd LBBW Engineering & Technology Investment DaySeptember 02, 2010
63
0
50
100
150
200
250
300
350
400Coal Copper Gold Iron Ore Spot
0
100
200
300
400
500
600
700
800
900Ammonia Urea
0
200
400
600
800
1,000
1,200
1,400Caustic Soda PVC Ethylene
0
20
40
60
80
100
120
140
160
2003 2004 2007 2008 2009E 2010E 2011E 2012E 2015E
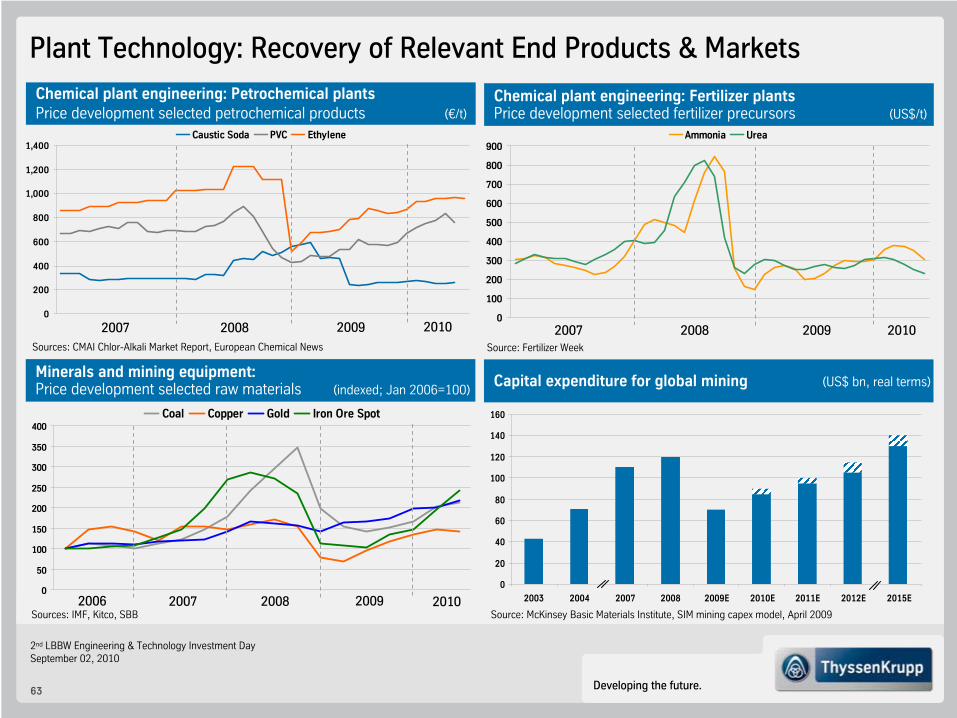
Plant Technology: Recovery of Relevant End Products & Markets
Chemical plant engineering: Petrochemical plants Price development selected petrochemical products
(€/t)Chemical plant engineering: Fertilizer plants Price development selected fertilizer precursors
(US$/t)
Minerals and mining equipment:Price development selected raw materials (indexed; Jan 2006=100)
Capital expenditure for global mining (US$ bn, real terms)
Source: McKinsey Basic Materials Institute, SIM mining capex
model, April 2009
Sources: CMAI Chlor-Alkali Market Report, European Chemical News Source: Fertilizer
Week
2007 2008 2009 2007 2008 2009
2007 2008 20092006Sources: IMF, Kitco, SBB
20102010
2010
Developing the future.
2nd LBBW Engineering & Technology Investment DaySeptember 02, 2010
64
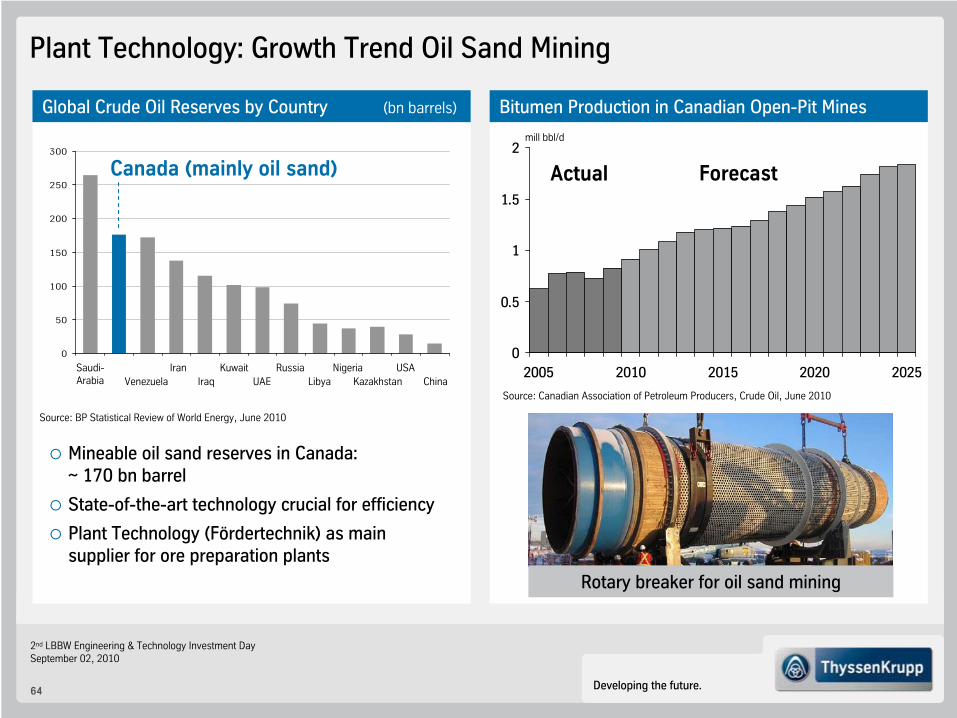
Global Crude
Oil Reserves
by
Country
(bn
barrels) Bitumen Production
in Canadian Open-Pit
Mines
Plant Technology: Growth Trend Oil Sand Mining
0
50
100
150
200
250
300
Source: BP Statistical Review of World Energy, June 2010
0
0.5
1
1.5
2
2005 2010 2015 2020 2025
Actual Forecast
Source: Canadian Association of Petroleum Producers, Crude Oil, June 2010
mill
bbl/d
Mineable oil sand reserves in Canada:~ 170 bn barrel
State-of-the-art technology crucial for efficiency
Plant Technology (Fördertechnik) as mainsupplier for ore preparation plants
Saudi-
Arabia VenezuelaIran
IraqKuwait
UAE Libya KazakhstanRussia Nigeria
ChinaUSA
Canada (mainly
oil
sand)
Rotary breaker
for
oil
sand
mining

Developing the future.
2nd LBBW Engineering & Technology Investment DaySeptember 02, 2010
65
Components Technology
Key figures
ROCE based
on 3, 6, 9 and 12 months; calculation
with
the
higher
of average
equity
and average
capital
employed
Q1 Q2 Q3 Q4 FY Q1 Q2 Q3
Order intake €m 1,290 1,016 899 972 4,177 1,169 1,337 1,584
Sales €m 1,299 1,100 1,063 1,141 4,603 1,237 1,344 1,568
EBITDA €m 137 37 (6) (133) 35 124 143 145
EBIT €m 66 (33) (85) (344) (396) 57 73 66
EBIT adjusted €m 66 (7) (60) (85) (86) 57 73 113
EBT €m 53 (47) (101) (363) (458) 43 63 58
EBT adjusted €m 53 (21) (76) (104) (148) 43 63 105
TK Value Added €m (1) (105) (155) (406) (667) (1) 13 6
ROCE % 8.9 2.1 (2.3) (13.7) (13.7) 8.9 9.9 9.9
Ø Capital Employed €m 2,996 3,086 3,089 3,011 3,011 2,584 2,614 2,641
OCF €m (70) 48 176 228 382 70 80 211
CF from divestm. €m 10 33 15 225 283 2 9 (3)
CF for investm. €m (141) (155) (125) (119) (540) (64) (51) (47)
FCF €m (201) (74) 67 332 124 8 38 161
31,418 29,223 27,963 27,973 27,973 27,997 27,894 28,860Employees
2008/09 2009/10

Developing the future.
2nd LBBW Engineering & Technology Investment DaySeptember 02, 2010
66
Components Technology: Quarterly
Production
of Passenger
Vehicles
[million]
USA (LCV; quarterly
production)
China (quarterly
production)
Source: Polk
(Forecast
2010-2012: ProCar
April 2010;
linear breakdown
of annual
estimates
on quarterly
basis)
Brazil
(quarterly
production)
Q4Q3Q2Q1
World (annual
production)
2015
85.8
2014
84.0
2013
81.1
2012
76.7
2011
70.7
2010
65.4
2009
57.3
2008
65.0
2007
68.2
2008
Q4Q3Q2Q1
2009
Q2Q1
2010 2012
2011
2010
1.7
1.9
2.32.5
1.8
1.6
1.11.1
1.91.8
1.7
2.3
2.0
Global Automotive production recovering from the crisis more rapidly than expected:
Germany and Brazil already back on pre-crisis levels
USA with strong rebound
China virtually unaffected
Q4Q3Q2Q1
2008
Q4Q3Q2Q1
2009
Q2Q1
2010 2012
2011
2010
0.45
0.740.73
0.64
0.680.70
0.66
0.54
0.72
0.650.71
0.80
0.74
Q4Q3Q2Q1
2008
Q4Q3Q2Q1
2009
Q2Q1
2010 2012
2011
2010
1.31.3
1.61.5
2.6
2.3
2.0
1.5
2.72.8 2.8
3.02.9
Germany (quarterly
production)
Q4Q3Q2Q1
2008
Q4Q3Q2Q1
2009
Q2Q1
2010 2012
2011
2010
1.2
1.3
1.51.5
1.41.31.3
1.0
1.5
1.4
1.2
1.4
1.3
Actual Forecast Actual Forecast
Actual Forecast Actual Forecast

Developing the future.
2nd LBBW Engineering & Technology Investment DaySeptember 02, 2010
67
Components Technology: Participating in Pioneering Project for Offshore Wind Technology
OFFSHORE WIND FARM „ALPHA VENTUS“ PARTICIPATION COMPONENTS TECHNOLOGY
Germany’s first offshore wind farm
45km away from coast in waters 30 m deep
Comprises 12 wind turbines of 5 MW class
Expected energy yield p.a.: ca. 220 GWh(= energy consumption of ~ 50,000 households)
Technical data wind turbine “Multibrid
M5000”
Rotor diameter: 116 m
Total height above seabed: 178 m
Blade tip speed: 90 m/s (= 300 km/h)
Weight of steel in tripod, tower, nacelle: 1,000 t
Single-source supplier for6 “Multibrid M5000” wind turbines:
6 yaw bearingsEach 4.0 t weight,
4.2 m diameter
6 pitch bearingsEach 4.5 t weight,
3.6 m diameter
Strong growth potential for offshore wind energy in Germany: Capacity expected to grow from 12 MW in 2008 to 30,000 MW in 2030

Developing the future.
2nd LBBW Engineering & Technology Investment DaySeptember 02, 2010
68
Marine Systems
Key figures
Q1 Q2 Q3 Q4 FY Q1 Q2 Q3
Order intake €m 1,856 193 (339) (840) 870 110 139 108
Sales €m 546 371 321 356 1,594 254 287 423
EBITDA €m 42 (90) (93) (178) (319) (1) 11 (11)
EBIT €m 32 (115) (123) (337) (543) (6) (4) (22)
EBIT adjusted €m 32 (45) (27) (39) (79) (1) 11 (3)
EBT €m 33 (117) (127) (343) (554) (10) (7) (23)
EBT adjusted €m 33 (47) (31) (45) (90) (5) 8 (4)
Ø Capital Employed €m 430 449 420 379 379 245 232 208
OCF €m (168) 169 (50) (179) (228) (124) 145 (83)
CF from divestm. €m 2 8 21 1 32 0 3 0
CF for investm. €m (12) (165) (19) 0 (196) (1) (2) 0
FCF €m (179) 12 (47) (178) (392) (126) 147 (84)
8,319 8,305 8,057 7,770 7,770 7,593 6,669 6,588Employees
2008/09 2009/10

Developing the future.
2nd LBBW Engineering & Technology Investment DaySeptember 02, 2010
69
80%SIAG
50%
ThyssenKrupp
(Engineering)
20% ThyssenKrupp
80%
Abu Dhabi MAR
20%
ThyssenKrupp
50%
Abu Dhabi MAR
Mega
Yachts(B + V
Shipyards)
Naval
Submarines
Naval
Surface
Mega
Yachts Container
Kockums HSY
100%
ThyssenKrupp
(Engineering & Construction)
Submarines
Container
Blohm + Voss Shipyards
& Services
(BVSS)
Blohm + Voss Nordseewerke
(BVN)
Howaldtswerke
Deutsche Werft
(HDW)
HamburgHamburg Kiel Emden
Marine Systems: Target Structure Exit from civil shipbuilding; focus on naval engineering and submarines
SIAG
Service
(B + V Repair)
Components
(B + V
Industries)
100%
Abu Dhabi
MAR
Abu Dhabi MAR to acquire civil shipbuilding assets of former HDW Gaarden
Targeted
workforce
reduction
of 60% to ~ 3,500 (from
~ 8,300 as of Sep 30, 2008)
Closed (Mar ‘10) Signed (Apr ‘10)
Signed (Apr ‘10)
Framework Agrm’tSigned (Mar ‘10)

Developing the future.
2nd LBBW Engineering & Technology Investment DaySeptember 02, 2010
70
Corporate/Consolidation
Key figures
Q1 Q2 Q3 Q4 FY Q1 Q2 Q3
Order intake €m (421) (289) (526) (541) (1,777) (629) (783) (694)
Sales €m (760) (515) (446) (542) (2,263) (571) (717) (812)
EBITDA €m (59) (16) (23) (48) (146) (54) (66) (64)
EBIT €m (66) (23) (28) (54) (171) (61) (79) (67)
EBT €m (160) (128) (114) (122) (524) (123) (165) (163)
OCF €m 579 214 (16) (85) 693 21 (568) (122)
2,578 1,839 1,848 1,865 1,865 2,325 2,447 2,496Employees (Corp.)
2008/09 2009/10
Developing the future.
2nd LBBW Engineering & Technology Investment DaySeptember 02, 2010
71
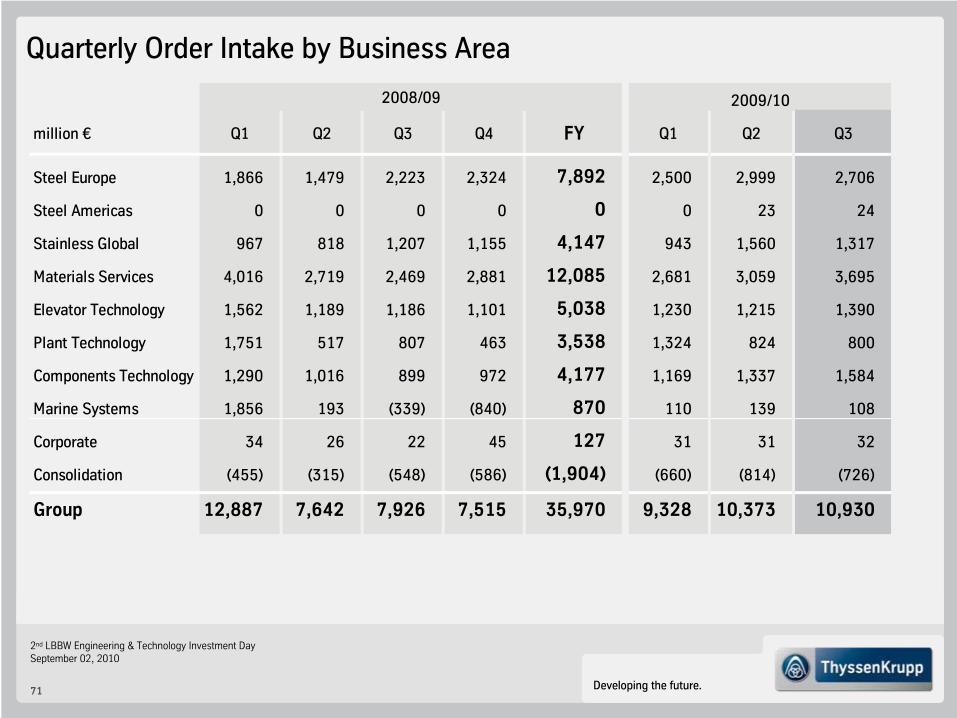
Quarterly Order Intake by Business Area
million € Q1 Q2 Q3 Q4 FY Q1 Q2 Q3
Steel Europe 1,866 1,479 2,223 2,324 7,892 2,500 2,999 2,706
Steel Americas 0 0 0 0 0 0 23 24
Stainless Global 967 818 1,207 1,155 4,147 943 1,560 1,317
Materials Services 4,016 2,719 2,469 2,881 12,085 2,681 3,059 3,695
Elevator Technology 1,562 1,189 1,186 1,101 5,038 1,230 1,215 1,390
Plant Technology 1,751 517 807 463 3,538 1,324 824 800
Components Technology 1,290 1,016 899 972 4,177 1,169 1,337 1,584
Marine Systems 1,856 193 (339) (840) 870 110 139 108
Corporate 34 26 22 45 127 31 31 32
Consolidation (455) (315) (548) (586) (1,904) (660) (814) (726)
Group 12,887 7,642 7,926 7,515 35,970 9,328 10,373 10,930
2008/09 2009/10

Developing the future.
2nd LBBW Engineering & Technology Investment DaySeptember 02, 2010
72
Quarterly Sales by Business Area
million € Q1 Q2 Q3 Q4 FY Q1 Q2 Q3
Steel Europe 2,848 2,326 2,151 2,245 9,570 2,281 2,667 2,887
Steel Americas 0 0 0 0 0 0 23 24
Stainless Global 1,173 988 1,030 1,295 4,486 1,210 1,461 1,708
Materials Services 3,995 3,109 2,751 2,960 12,815 2,760 2,881 3,598
Elevator Technology 1,343 1,293 1,328 1,344 5,308 1,226 1,221 1,313
Plant Technology 1,078 1,187 1,101 1,084 4,450 954 940 970
Components Technology 1,299 1,100 1,063 1,141 4,603 1,237 1,344 1,568
Marine Systems 546 371 321 356 1,594 254 287 423
Corporate 34 26 22 45 127 31 31 32
Consolidation (794) (541) (468) (587) (2,390) (602) (748) (844)
Group 11,522 9,859 9,299 9,883 40,563 9,351 10,107 11,679
2008/09 2009/10
Developing the future.
2nd LBBW Engineering & Technology Investment DaySeptember 02, 2010
73
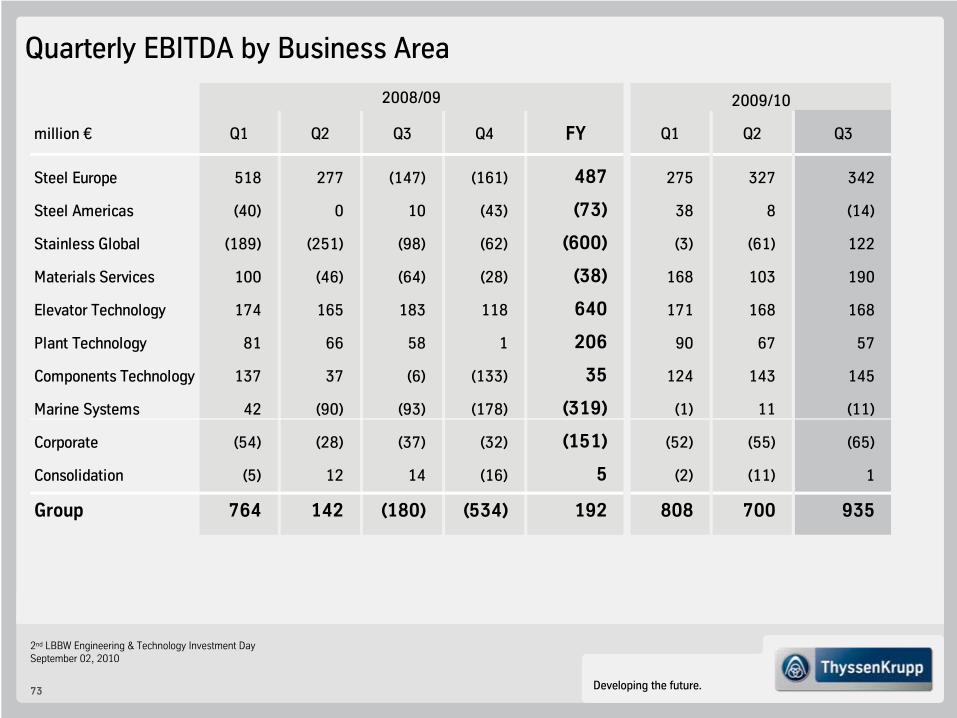
Quarterly EBITDA by Business Area
million € Q1 Q2 Q3 Q4 FY Q1 Q2 Q3
Steel Europe 518 277 (147) (161) 487 275 327 342
Steel Americas (40) 0 10 (43) (73) 38 8 (14)
Stainless Global (189) (251) (98) (62) (600) (3) (61) 122
Materials Services 100 (46) (64) (28) (38) 168 103 190
Elevator Technology 174 165 183 118 640 171 168 168
Plant Technology 81 66 58 1 206 90 67 57
Components Technology 137 37 (6) (133) 35 124 143 145
Marine Systems 42 (90) (93) (178) (319) (1) 11 (11)
Corporate (54) (28) (37) (32) (151) (52) (55) (65)
Consolidation (5) 12 14 (16) 5 (2) (11) 1
Group 764 142 (180) (534) 192 808 700 935
2008/09 2009/10
Developing the future.
2nd LBBW Engineering & Technology Investment DaySeptember 02, 2010
74
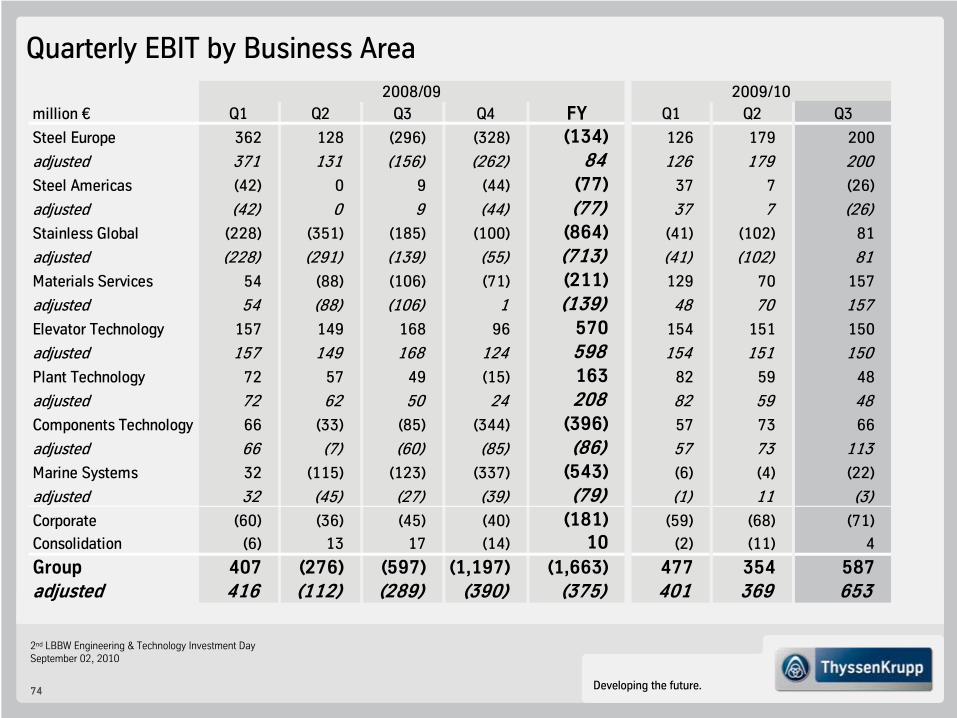
Quarterly EBIT by Business Area
million € Q1 Q2 Q3 Q4 FY Q1 Q2 Q3
Steel Europe 362 128 (296) (328) (134) 126 179 200
adjusted 371 131 (156) (262) 84 126 179 200
Steel Americas (42) 0 9 (44) (77) 37 7 (26)
adjusted (42) 0 9 (44) (77) 37 7 (26)
Stainless Global (228) (351) (185) (100) (864) (41) (102) 81
adjusted (228) (291) (139) (55) (713) (41) (102) 81
Materials Services 54 (88) (106) (71) (211) 129 70 157
adjusted 54 (88) (106) 1 (139) 48 70 157
Elevator Technology 157 149 168 96 570 154 151 150
adjusted 157 149 168 124 598 154 151 150
Plant Technology 72 57 49 (15) 163 82 59 48
adjusted 72 62 50 24 208 82 59 48
Components Technology 66 (33) (85) (344) (396) 57 73 66
adjusted 66 (7) (60) (85) (86) 57 73 113
Marine Systems 32 (115) (123) (337) (543) (6) (4) (22)
adjusted 32 (45) (27) (39) (79) (1) 11 (3)
Corporate (60) (36) (45) (40) (181) (59) (68) (71)
Consolidation (6) 13 17 (14) 10 (2) (11) 4
Group 407 (276) (597) (1,197) (1,663) 477 354 587adjusted 416 (112) (289) (390) (375) 401 369 653
2008/09 2009/10
Developing the future.
2nd LBBW Engineering & Technology Investment DaySeptember 02, 2010
75
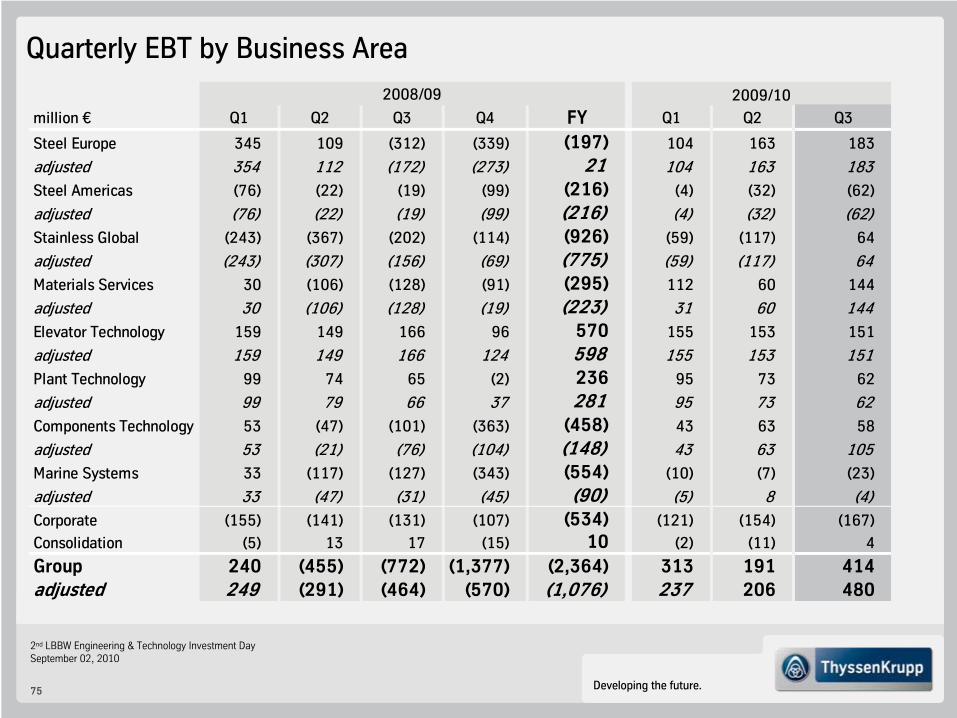
Quarterly EBT by Business Area
million € Q1 Q2 Q3 Q4 FY Q1 Q2 Q3
Steel Europe 345 109 (312) (339) (197) 104 163 183
adjusted 354 112 (172) (273) 21 104 163 183
Steel Americas (76) (22) (19) (99) (216) (4) (32) (62)
adjusted (76) (22) (19) (99) (216) (4) (32) (62)
Stainless Global (243) (367) (202) (114) (926) (59) (117) 64
adjusted (243) (307) (156) (69) (775) (59) (117) 64
Materials Services 30 (106) (128) (91) (295) 112 60 144
adjusted 30 (106) (128) (19) (223) 31 60 144
Elevator Technology 159 149 166 96 570 155 153 151
adjusted 159 149 166 124 598 155 153 151
Plant Technology 99 74 65 (2) 236 95 73 62
adjusted 99 79 66 37 281 95 73 62
Components Technology 53 (47) (101) (363) (458) 43 63 58
adjusted 53 (21) (76) (104) (148) 43 63 105
Marine Systems 33 (117) (127) (343) (554) (10) (7) (23)
adjusted 33 (47) (31) (45) (90) (5) 8 (4)
Corporate (155) (141) (131) (107) (534) (121) (154) (167)
Consolidation (5) 13 17 (15) 10 (2) (11) 4
Group 240 (455) (772) (1,377) (2,364) 313 191 414adjusted 249 (291) (464) (570) (1,076) 237 206 480
2008/09 2009/10

Developing the future.
2nd LBBW Engineering & Technology Investment DaySeptember 02, 2010
76
Quarterly Operating Cash Flow by Business Area
million € Q1 Q2 Q3 Q4 FY Q1 Q2 Q3
Steel Europe (790) 279 576 588 653 (123) 235 152
Steel Americas (39) (55) 15 69 (10) (171) (93) (221)
Stainless Global (319) 262 122 183 248 (100) 88 (261)
Materials Services (202) 197 390 569 953 (82) (102) (25)
Elevator Technology 75 289 170 220 754 87 238 74
Plant Technology 74 80 (52) 152 254 114 161 250
Components Technology (70) 48 176 228 382 70 80 211
Marine Systems (168) 169 (50) (179) (228) (124) 145 (83)
Corp./Cons. 579 214 (16) (85) 693 21 (568) (122)
Group 860 1,483 1,331 1,745 3,699 (308) 184 (23)
2008/09 2009/10

Developing the future.
2nd LBBW Engineering & Technology Investment DaySeptember 02, 2010
77
Special Items by Business Area (I)
Business Area
(million €) Q1 Q2 Q3 Q4 FY Q1 Q2 Q3
Steel Europe:
Restructuring Metal Forming (9) (3) (10) (38) (60)Restructuring TK Steel (125) (1) (126)Restructuring Color/Construction (5) (18) (23)Impairment Metal Forming (6) (6)Impairment Color/Construction (3) (3)
Stainless Global:
Restructuring Nirosta (46) (46)Impairment SKS (60) 1 (59)Impairment Nirosta (46) (46)
Materials Services:
Restructuring Metals Germany (57) (57)Restructuring Western Europe (6) (6)Restructuring Plastics Services (9) (9)Disposal Gain TKIN and Safway 81
Elevator Technology:Restructuring Fahrtreppen Hamburg (25) (25)Impairment Fahrtreppen Hamburg (3) (3)
2008/09 2009/10

Developing the future.
2nd LBBW Engineering & Technology Investment DaySeptember 02, 2010
78
Special Items by Business Area (II)Business Area(million €) Q1 Q2 Q3 Q4 FY Q1 Q2 Q3
Plant Technology:
Restructuring System Engineering (1) (22) (23)Restructuring Transrapid (5) (10) (15)Impairment Transrapid (7) (7)
Components Technology:
Restructuring Forging Group (19) (12) (97) (128)Restructuring Bilstein (2) (5) (12) (19) (26)
Restructuring Presta Steering (2) (2) (9) (13)Restructuring Waupaca (3) (3)Restructuring Berco (17)
Impairment Forging Group (2) (35) (37)Impairment Bilstein (22) (22) (3)
Impairment Presta Steering (1) (8) (5) (14)Impairment Waupaca (76) (76)Impairment Berco (1)
Divestment Bilstein 2 2Marine Systems:
Restructuring Marine Systems (25) (78) (124) (227)Impairment Marine Systems (14) (19) (174) (207)Divestment Nobiskrug (31) 1 (30)Hellenic Shipyards (5) (15) (19)
2008/09 2009/10

Developing the future.
2nd LBBW Engineering & Technology Investment DaySeptember 02, 2010
79
Business Area Overview Accumulated (I)
9M 2008/09
9M 2009/10
9M 2008/09
9M 2009/10
Jun 30, 2009
Jun 30, 2010
Steel Europe 5,568 8,205 7,325 7,835 36,607 34,434
Steel Americas 0 47 0 47 1,590 2,876
Stainless Global 2,992 3,820 3,191 4,379 11,869 11,150
Materials Services 9,204 9,435 9,855 9,239 44,744 32,096
Elevator Technology 3,937 3,835 3,964 3,760 42,761 43,066
Plant Technology 3,075 2,948 3,366 2,864 13,062 12,975
Components Technology 3,205 4,090 3,462 4,149 27,963 28,860
Marine Systems 1,710 357 1,238 964 8,057 6,588
Corporate 82 94 82 94 1,848 2,496
Consolidation (1,318) (2,200) (1,803) (2,194) - -
Group 28,455 30,631 30,680 31,137 188,501 174,541
Order Intake (€m) Sales (€m) Employees

Developing the future.
2nd LBBW Engineering & Technology Investment DaySeptember 02, 2010
80
Business Area Overview Accumulated (II)
9M 2008/09
9M 2009/10
9M 2008/09
9M 2009/10
9M 2008/09
9M 2009/10
Steel Europe 648 944 194 505 142 450
Steel Americas (30) 32 (33) 18 (117) (98)
Stainless Global (538) 58 (764) (62) (812) (112)
Materials Services (10) 461 (140) 356 (204) 316
Elevator Technology 522 507 474 455 474 459
Plant Technology 205 214 178 189 238 230
Components Technology 168 412 (52) 196 (95) 164
Marine Systems (141) (1) (206) (32) (211) (40)
Corporate (119) (172) (141) (198) (427) (442)
Consolidation 21 (12) 24 (9) 25 (9)
Group 726 2,443 (466) 1,418 (987) 918
EBITDA (€m) EBIT (€m) EBT (€m)
Developing the future.
2nd LBBW Engineering & Technology Investment DaySeptember 02, 2010
81
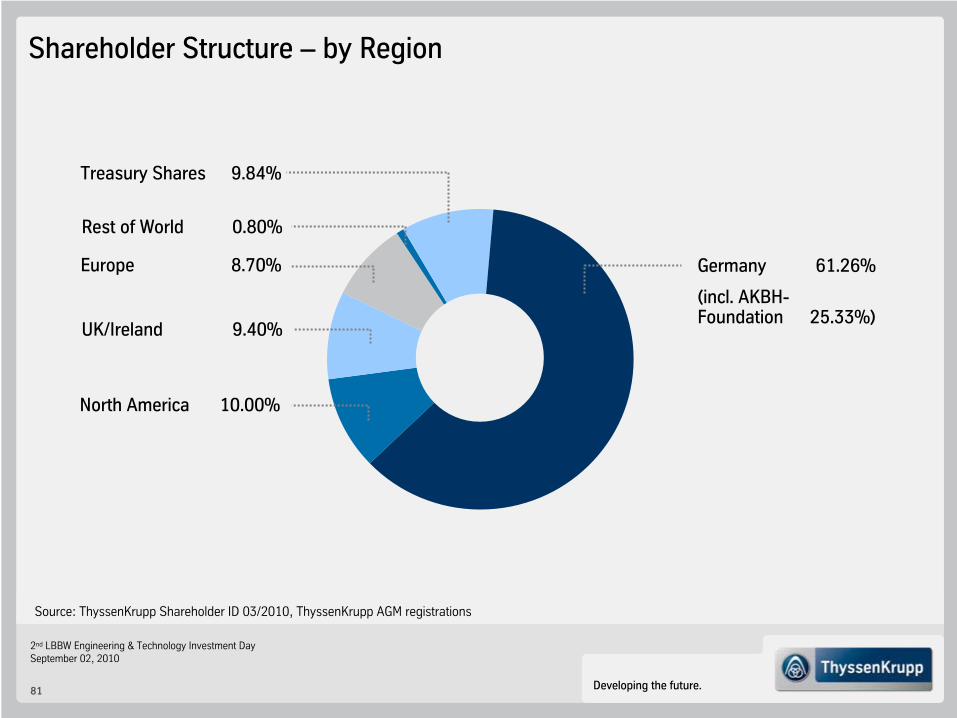
Source: ThyssenKrupp Shareholder ID 03/2010, ThyssenKrupp AGM registrations
Shareholder Structure
–
by
Region
Germany 61.26%
(incl. AKBH-
Foundation
25.33%)
Treasury Shares
9.84%
Rest of World
0.80%
Europe
8.70%
UK/Ireland
9.40%
North America
10.00%
Developing the future.
2nd LBBW Engineering & Technology Investment DaySeptember 02, 2010
82
Disclaimer ThyssenKrupp AG
“The information set forth and included in this presentation is not provided in connection with an offer or solicitation for the purchase or sale of a security and is intended for informational purposes
only.
This presentation contains forward-looking statements that are subject to risks and uncertainties. Statements contained herein that are not statements of historical fact may be deemed to be forward-looking information. When we use words such as “plan,”
“believe,”
“expect,”
“anticipate,”
“intend,”
“estimate,”
“may”
or similar expressions, we are making forward-looking statements. You should not rely on forward-looking statements because they are subject to a number of assumptions concerning future events, and are subject to a number of uncertainties and other factors, many of which are outside of our control, that could cause actual results to differ
materially from those indicated. These factors include, but are
not limited to, the following:(i) market risks: principally economic price and volume developments, (ii) dependence on performance of major customers and industries, (iii) our level of debt, management of interest rate risk and hedging against commodity price risks;(iv) costs associated with, and regulation relating to, our pension liabilities and healthcare measures, (v) environmental protection and remediation of real estate and associated with rising standards for real estate environmental protection, (vi) volatility of steel prices and dependence on the automotive
industry, (vii) availability of raw materials; (viii) inflation, interest rate levels and fluctuations in exchange rates; (ix) general economic, political and business conditions and existing and future governmental regulation; and (x) the effects of competition. Please note that we disclaim any intention or obligation to update or revise any forward-looking statements whether as a result of new information, future events or otherwise.”


