Page 1
2PFCTM (Two Pixels, Full Color): Image Sensor Demosaicing and
Characterization
Daniel Tamburrino∗
School of Computer and Communication Sciences
Ecole Polytechnique Federale de Lausanne (EPFL)
CH-1015 Lausanne, Switzerland
Jon M. Speigle, Douglas J. Tweet,† and Jong-Jan Lee
Sharp Laboratories of America
5750 NW Pacific Rim Blvd.,
Camas, WA, USA 98607-9489
Abstract
We propose a modification to the standard Bayer CFA and photodiode structure for CMOS
image sensors, which we call 2PFCTM (Two Pixels, Full Color). The blue and red filters of the
Bayer pattern are replaced by a magenta filter. Under each magenta filter are two stacked, pinned
photodiodes; the diode nearest the surface absorbs mostly blue light and the deeper diode absorbs
mostly red light. The magenta filter absorbs green light, improving color separation between
the blue and red diodes. We first present a frequency-based demosaicing method, which takes
advantage of the new 2PFCTM geometry. Due to the spatial arrangement of red, green, and
blue pixels, luminance and chrominance are very well separated in the Fourier space, allowing
for computationally inexpensive linear filtering. In comparison with state-of-the-art demosaicing
methods for the Bayer CFA, we show that our sensor and demosaicing method outperform the
others in terms of color aliasing, PSNR, and zipper effect. As demosaicing alone does not determine
image quality, we also analyze the whole system performance in terms of resolution and noise.
∗Electronic address: [email protected] †Electronic address: [email protected]
1
Page 2
I. INTRODUCTION
To improve color accuracy and spatial resolution, as well as reduce aliasing and de-
mosaicing artifacts, a number of color filter array (CFA) patterns have been proposed as
alternatives to the Bayer RGB pattern [1], a few of which are illustrated in Fig. 1. Stacked
pixel structures, which make use of variation of the absorption depth with wavelength have
also been proposed, both in silicon (Si) [2–12] and a-Si alloy [13] systems. Most notable
among these is the Foveon triple junction CMOS image sensor [5–7], in which R, G, and B
information is collected at each pixel without the need for color filters, thus eliminating the
demosaicing algorithms and accompanying image artifacts. However, to achieve acceptable
color separation, the total Si absorbing region has to be quite deep, requiring expensive
epitaxial Si processes.
A particularly interesting structure was investigated by Findlater et al.[8]. They pro-
posed a two-pixel stacked structure, using the Si depth to separate colors, but with the
addition of color filters. Using a fairly complex 6T readout architecture, they fabricated a
prototype sensor with cyan and yellow filters. A system with magenta and green filters over
alternate pixels was also briefly discussed, but they did not develop it further. A similar
device structure and readout circuit is described by Henker et al. for multi-channel CMOS
sensors [11, 12]. Another architecture with blue and red stacked sensors in one pixel and
green in a separate pixel has also been proposed [9]. The device structure and depth of the
blue and red diodes is similar to Foveon’s; but the middle, green-absorbing region is pulled
out and placed in an adjacent pixel. No color filters are employed, relying on the absorption
depth to separate the colors.
Recently [14], we proposed a modification to the standard Bayer CFA and photodiode
structure for CMOS image sensors, which we call 2PFCTM, for “Two Pixels, Full Color”.
It uses stacked blue and red sensors in one pixel and a single sensor in the adjacent green
pixels. The difference from previous work [8–10] is that the device structure is completely
compatible with standard CMOS processes, so fabrication costs, leakage, etc. should be low.
In the 2PFCTM pattern, the blue and red filters of the Bayer pattern are replaced by
magenta filters (Fig. 1(e)), under which are two stacked, pinned photodiodes; the diode
nearest the surface absorbs mostly blue light and the deeper diode absorbs mostly red light.
Figure 2 is a schematic of a cross-section of the device. The overlying magenta filter absorbs
2
Page 3
green light, improving color separation between the stacked diodes. A number of benefits
naturally occur from these modifications. Higher well capacity, due to the thinner stacked
diodes, leads to better dynamic range and signal-to-noise ratio. The reduction of color
filters from three to two, while maintaining standard CMOS processing, keeps the overall
cost similar to or less than one-color sensors.
Another advantage is that since the spatial resolution of green, red, and blue are identical,
color aliasing is greatly reduced and luminance resolution is improved, at least for simple
demosaicing schemes. Nyquist maps for Bayer and 2PFCTM are compared in Figure 3.
Bayer has higher Nyquist frequency in the horizontal and vertical directions than along the
diagonal for green, while red and blue are the converse. In comparison, the green, red, and
blue Nyquist frequencies are all identical for 2PFCTM and are highest along the horizontal
and vertical directions. This is highly desirable, since the resolution differences for Bayer
increase color aliasing. Also, the human visual system has higher spatial resolution in the
horizontal and vertical directions than along the diagonal direction. The Bayer CFA green
matches the human eye 2D contrast sensitivity function (CSF), but red and blue do not.
For the 2PFCTM pattern, all three colors match the eye’s CSF.
With the 2PFCTM sensor, most of the digital processing steps are similar to those of a
standard sensor. This includes white balancing, tone mapping, and color correction. How-
ever, demosaicing has to be adapted to the new CFA design. It should exploit the additional
color information available per pixel location to produce better, less-aliased, and sharper full
color images. In the next section, we review some state of the art demosaicing algorithms. In
Section III, we describe adaptations of spatial and frequency-based demosaicing algorithms
for 2PFCTM. In Section IV, we compare the results from the best demosaicing methods
for the Bayer CFA with our implementations for 2PFCTM. Finally, a system performance
analysis, including resolution and noise, is discussed in Section V.
II. REVIEW OF DEMOSAICING
In 2008, Li et al.[18] reviewed more than 70 papers on demosaicing techniques. They
state that most methods follow a sequential approach. These start by interpolating the
green channel, which has twice as many samples as the red and blue channels in a Bayer
CFA. As the algorithms are sequential, errors in the green estimation propagate to the next
3
Page 4
steps of reconstruction. Most of the effort is therefore put into green channel reconstruction.
Next, the red and blue channels are interpolated, often using a less expensive algorithm.
Finally, refinement steps are applied in order to improve the high frequency content of the
image and remove artifacts. The state of the art demosaicing algorithms can be separated
into two main classes: spatial domain approaches and frequency domain approaches.
A. Spatial Domain Approaches
In the spatial domain, the green channel is first reconstructed using an edge-directed
technique [19–22]. Some algorithms first interpolate the green channel in several directions
and then decide which direction to retain for each pixel [23–27]. Most use the assumption
that color differences vary slowly in smooth regions [18] and interpolate the color difference
instead of using only the green channel information.
Once the green channel is interpolated, red and blue are reconstructed using a simpler
technique, such as bilinear interpolation of color differences [19, 22, 28–30]. The interpolation
direction found in the previous step can also be used to improve the accuracy of the red and
blue reconstruction [23, 31].
Most demosaicing algorithms include a refinement step, often exploiting correlation be-
tween high frequency captured information across color channels. As the color filter array
spectral sensitivities usually overlap (Fig. 9), R, G, and B values are correlated. Since the
visual system’s chromatic contrast sensitivity function has a lower spatial frequency cutoff
than the luminance contrast sensitivity function, high frequency captured information at
green pixel locations is used to improve the reconstructed red and blue pixels to avoid color
fringing [32].
B. Frequency Domain Approaches
Alleysson et al.[33] proposed a demosaicing method which directly exploits the multi-
plexing of color and luminance information by the sensor array. They showed that for a
Bayer pattern, the CFA signal can be decomposed into full resolution luminance and mod-
ulated chrominance components. Fig. 5(a) shows for a Bayer CFA how the luminance and
chrominance information are separated in a frequency domain representation. The lumi-
4
Page 5
nance information is mostly located at lower frequencies (center), whereas the chrominance
information is located at higher frequencies (borders and corners). This separation suggested
demosaicing by first separating luminance from chrominance using linear filtering followed
by reconstructing chrominance information via interpolation. The results of this method
highly depend on the filter used to extract luminance and chrominance from the CFA. As
there usually is non-negligible cross-talk between luminance and chrominance information,
this method can result in reconstructed images exhibiting color aliasing and other artifacts.
Alleysson et al.[33] described the four main types of artifacts as blurring, color aliasing, grid
effect, and watercolor effect. Subsequently, Dubois [34] and Lian et al.[35] proposed enhance-
ments that improved the results by adaptively filtering the luminance component. Recent
research to improve these frequency-based methods has explored the design of non-Bayer
CFA patterns to maximize the separation between luminance and chrominance information
in the frequency domain, thus reducing cross-talk [17, 36, 37]. The CFA patterns considered
all use single color (single-junction) photodetectors.
III. ADAPTATIONS OF DEMOSAICING METHODS TO 2PFCTM
A. Adaptation of Spatial Demosaicing to 2PFCTM
Existing spatial demosaicing algorithms can easily be adapted for 2PFCTM, as the latter
contains the same signal as Bayer plus additional red and blue data. Beyond applying the
same demosaicing technique, the extra data can be used to improve both the directional
interpolation and high-frequency refinement.
We adapted Menon et al.’s demosaicing with directional filtering and a posteriori decision
[32] method to 2PFCTM. This method was chosen as it provides good results for relatively
low computational complexity. Our approach is illustrated in Figure 4(a). First, we perform
a directional interpolation of the green channel along vertical and horizontal directions.
We then compute a decision map to determine the best interpolation direction for each
pixel. In a third step, we interpolate the red and blue channels by bilinear interpolation
of color differences. Next, we perform a refinement step that improves the high frequency
content of reconstructed pixels, as described in Section IIA. Finally, median filtering of
color differences can be applied to the output image to further reduce remaining artifacts
5
Page 6
(see Section III B 3).
This method, adapted for 2PFCTM, provides very good results (see Section IV). How-
ever, the method was not designed with 2PFCTM in mind and therefore does not take full
advantage of the new sensor geometry. Therefore, we will not provide more details on the
method and will concentrate on our frequency-based demosaicing algorithm developed in
Section III B.
B. Frequency Analysis of 2PFCTM [G R/B] Pattern
Using Dubois’ notations [34], we can analyze the frequency representation of the 2PFCTM
CFA pattern. Since red and blue pixels are overlapping within 2PFCTM, we consider two
mosaiced patterns: one [G R] and one [G B] pattern (pattern of Fig. 1(e) but replacing
magenta by red and blue, respectively). The derivation will be done only for [G R] as it is
identical for [G B].
Let fG[n,m] and fR[n,m] represent the green and red channels of the original image and
fCFA[n,m] the output of our 2PFCTM sensor at pixel location [n,m]. fCFA[n,m] is obtained
by sub-sampling the fG[n,m] and fR[n,m] functions to match the [G R] CFA pattern. The
sub-sampling can be represented as a multiplication by the functions mi[n,m], i ∈ {G,R}that take value 1 or zero:
mG[n,m] =1
2(1 + (−1)n+m),
mR[n,m] =1
2(1 + (−1)n+m+1).
(1)
With these modulation functions, the CFA signal fCFA[n,m] can be written as
fCFA[n,m] =1
2fG[n,m](1 + (−1)n+m) +
1
2fR[n,m](1 + (−1)n+m+1). (2)
Equation 2 can be rewritten as
fCFA[n,m] =1
2[fG[n,m] + fR[n,m]] +
1
2(−1)n+m [fG[n,m]− fR[n,m]]
: = fL[n,m] + fC [n,m](−1)n+m,
(3)
where fL is a fully sampled signal associated with luminance and fC is a modulated signal
defined as chrominance.
6
Page 7
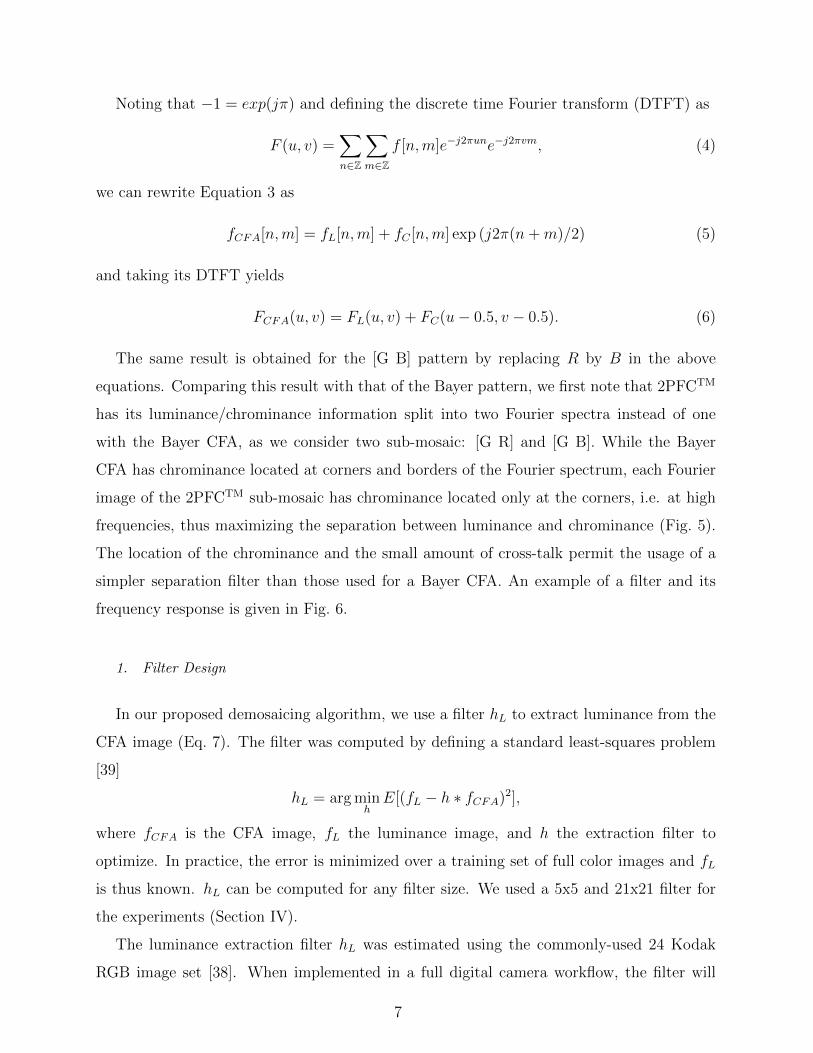
Noting that −1 = exp(jπ) and defining the discrete time Fourier transform (DTFT) as
F (u, v) =∑
n∈Z
∑
m∈Zf [n,m]e−j2πune−j2πvm, (4)
we can rewrite Equation 3 as
fCFA[n,m] = fL[n,m] + fC [n,m] exp (j2π(n+m)/2) (5)
and taking its DTFT yields
FCFA(u, v) = FL(u, v) + FC(u− 0.5, v − 0.5). (6)
The same result is obtained for the [G B] pattern by replacing R by B in the above
equations. Comparing this result with that of the Bayer pattern, we first note that 2PFCTM
has its luminance/chrominance information split into two Fourier spectra instead of one
with the Bayer CFA, as we consider two sub-mosaic: [G R] and [G B]. While the Bayer
CFA has chrominance located at corners and borders of the Fourier spectrum, each Fourier
image of the 2PFCTM sub-mosaic has chrominance located only at the corners, i.e. at high
frequencies, thus maximizing the separation between luminance and chrominance (Fig. 5).
The location of the chrominance and the small amount of cross-talk permit the usage of a
simpler separation filter than those used for a Bayer CFA. An example of a filter and its
frequency response is given in Fig. 6.
1. Filter Design
In our proposed demosaicing algorithm, we use a filter hL to extract luminance from the
CFA image (Eq. 7). The filter was computed by defining a standard least-squares problem
[39]
hL = argminh
E[(fL − h ∗ fCFA)2],
where fCFA is the CFA image, fL the luminance image, and h the extraction filter to
optimize. In practice, the error is minimized over a training set of full color images and fL
is thus known. hL can be computed for any filter size. We used a 5x5 and 21x21 filter for
the experiments (Section IV).
The luminance extraction filter hL was estimated using the commonly-used 24 Kodak
RGB image set [38]. When implemented in a full digital camera workflow, the filter will
7
Page 8
need to be re-computed based on sensor data to account for the effect of the color filter
spectral sensitivities [40].
2. Proposed Demosaicing Algorithm
A block diagram of our approach is shown in Figure 4(b). With the 2PFCTM CFA, the
red and blue color samples have the same spatial location. The single channel CFA image is
separated into two channels ([G R] and [G B]) that are processed in parallel and recombined
at the end of the process to form a single RGB color image.
Let fGRCFA and fGB
CFA be the two above-mentioned mosaiced channels and hL the luminance
extraction filter described in Section III B 1. In a first step, hL is applied to fGRCFA and fGB
CFA,
respectively. The extracted luminances can be written as
fGRL = hL ∗ fGR
CFA,
fGBL = hL ∗ fGB
CFA.(7)
Note that we have two “luminance” components, fGRL and fGB
L . They differ from the
real luminance, which is unique. Both fGRL and fGB
L are extracted from a channel ([G R] or
[G B]) where a part of the spectrum is missing (blue or red). These extracted luminances
thus correspond only to a partial luminance signal and will be combined later to recover the
full luminance.
The chrominance part is retrieved by subtracting the above luminances from the CFA
signals:
fGRC = fGR
CFA − fGRL ,
fGBC = fGB
CFA − fGBL .
(8)
The green channel is handled differently as it is present in both fGRCFA and fGB
CFA. The
luminance and chrominance are defined as the average of the values extracted from the two
channels, such as
fGML = (fGR
L + fGBL )/2,
fGMC = (fGR
C + fGBC )/2.
(9)
Taking the average is equivalent to considering a [G M] channel and applying Eq. 7 and 8,
where M is magenta, i.e. the combination of red and blue.
8
Page 9
Let L = {fGRL ; fGM
L ; fGBL } be the 3-channel extracted luminance and C =
{fGRC ; fGM
C ; fGBC } be the 3-channel multiplexed chrominances. Each chrominance channel in
C is de-multiplexed according to the CFA pattern and the missing values are reconstructed
using bilinear interpolation to form C. A more sophisticated interpolation algorithm would
not produce much better results due to the human visual system’s lower sensitivity to high
chrominance frequency content.
Finally, the full RGB color image f is reconstructed by adding the chrominance channels
to their respective luminance channels:
f = L+ C. (10)
3. Median Filtering
The reconstructed image might still contain artifacts, as small amounts of cross-talk
often exist between luminance and chrominance in the Fourier space. To reduce artifact
visibility, we perform a median filtering on color differences. Using the assumption that
color differences vary slowly, small variations in color are suppressed by median filtering.
Our median filtering is computed using a 3×3 kernel and is applied only on the reconstructed
pixels, whereas it is applied on all pixels in other approaches [27]. The R channel is computed
first, followed by the B and finally the G channel:
1. R = G+median(R−G)
2. B = G+median(B −G)
3. G = 12[R +median(R−G) + B +median(B −G)]
Median filtering can be applied more than once, but we found that the benefit of a second
median filtering is generally not worth the computational cost.
IV. EXPERIMENTS
In this section, we present experimental results from several demosaicing algorithms ap-
plied to the Bayer CFA and the 2PFCTM CFA. The Bayer CFA algorithms were chosen
based on performance and on availability of a reference implementation, and are: Bilinear
9
Page 10
interpolation, Lian et al.’s adaptive filtering (AF) [35], Zhang and Wu’s DLMMSE (DL) [25],
Gunturk et al.’s alternating projections (POCS) [41], Menon and Calvagno’s wavelet based
method (DBW) [42], and Menon et al.’s directional filtering (DFPD) [32]. The 2PFCTM CFA
algorithms are: Bilinear interpolation, the directional-spatial interpolation (S) described in
Section IIIA, and frequency-based filtering with 5 × 5 (F5) and 21 × 21 (F21) filters as
described in Section III B 1 and III B 2. In Table I, some algorithms’ names are followed by
a + sign, which indicates that median filtering, as described in Section III B 3, was employed
as a post-processing step.
The algorithms were applied to the 24 Kodak PhotoCD images [38] after sub-sampling
according to the CFAs. Sample results can be seen in Fig. 7. The metrics reported in
Table I are computed after removing a 5-pixel border from each image in order to discount
errors, since not all implementations take care of proper border reconstruction. The metrics
used are color PSNR, S-CIELab ∆E color difference [43], and Lu and Tan’s zipper artifact
metric [23]. Zipper-like artifacts usually appear as alternating patterns in smooth regions
near edges. The zipper effect is an increase in color difference with respect to its most
similar neighboring pixel. The computation of zipper artifacts uses this observation. When
the computed absolute color difference is bigger than a threshold, the pixel is considered to
have a noticeable artifact. The threshold was set to 2.3 based on [23]. The zipper effect is
expressed as a percentage of the total pixel number.
The metrics are computed not only on the full demosaiced image, but also separately for
the smooth and edge regions of the reconstructed image, using Lu and Tan’s [23] procedure
to separate the image content using a low-pass filter. As high-frequency regions are the most
difficult parts to reconstruct, the difference between algorithms should be noticeable in the
edge image.
The metrics in Table I first show that demosaicing algorithms for 2PFCTM CFA outper-
form those for Bayer CFA. Our frequency-based demosaicing method also performs very well
compared to more complex spatial methods. PSNR is more than 4dB higher for 2PFCTM
than for Bayer CFA, whereas the difference is usually less than 1dB when comparing among
state-of-the-art demosaicing algorithms. The spatial color difference is almost half, and the
zipper effect is up to three time smaller for 2PFCTM than Bayer CFA. These results are
valid for both edge and smooth image regions. As expected, smooth regions are better re-
constructed than edge regions for all algorithms, and methods for the 2PFCTM CFA perform
10
Page 11
Full Image Smooth Image Edge Image
PSNR ∆E Zip PSNR ∆E Zip PSNR ∆E Zip
[B] Bilinear 30.22 1.70 35.43 34.48 1.38 29.04 22.92 8.58 77.64
[B] AF 39.60 0.82 3.43 41.53 0.80 2.14 34.29 3.15 9.99
[B] DL 40.03 0.79 2.96 41.96 0.76 1.86 34.71 3.09 8.99
[B] POCS 39.26 0.90 2.76 41.14 0.87 1.73 34.00 3.44 8.60
[B] DBW 39.68 0.84 3.33 41.68 0.82 1.95 34.32 3.22 10.85
[B] DFPD 39.28 0.88 5.01 41.26 0.84 3.42 33.91 3.34 13.51
[B] DFPD+ 39.62 0.86 2.85 41.56 0.82 1.77 34.30 3.36 8.79
[2] Bilinear 33.21 1.08 35.38 37.28 0.93 30.02 26.00 4.90 73.07
[2] S 43.25 0.57 3.98 45.06 0.56 2.57 38.09 2.17 11.91
[2] S+ 44.11 0.55 1.20 45.80 0.53 0.62 39.10 2.15 4.67
[2] F5 43.88 0.51 2.07 45.79 0.50 1.14 38.56 2.04 7.31
[2] F21 44.25 0.49 1.34 46.05 0.47 0.70 39.08 1.96 5.10
[2] F5+ 44.33 0.52 1.10 46.08 0.50 0.56 39.22 2.09 4.31
[2] F21+ 44.46 0.50 1.01 46.20 0.48 0.52 39.38 2.04 3.98
TABLE I: PSNR(dB), S-CIELab ∆E, and zipper effect (%) metrics of different demosaicing algo-
rithms for [B] Bayer and [2] 2PFCTM CFA on the Kodak PhotoCD image set [38]. Each metric is
computed for the full image, smooth regions, and edge regions.
better than methods for the Bayer CFA. Additionally, median filtering of color differences
greatly reduces zipper artifacts for any demosaicing method.
In our frequency-based algorithm, we use a filter to extract luminance from the 2PFCTM
CFA signal. We tested a wide range of filter sizes. Table I shows the results when using a 5x5
(F5) and a 21x21 (F21) filter. Using a 5x5 filter does not penalize results much compared to
a larger 21x21 filter. A small filter is sufficient as the luminance and chrominance are well
separated in the Fourier space and, unlike with a Bayer CFA, chrominance is located only
at the corners of the Fourier spectrum.
The advantages of using a 2PFCTM CFA as opposed to a Bayer CFA are illustrated in
Fig. 7. The reduction of color aliasing and zipper artifacts are clearly visible on all test
images.
11
Page 12
Kriss proposed a method for evaluating the potential for aliasing based on the system
MTF [44]. As an additional evaluation criterion, we propose an alternative method to
estimate the potential for color artifacts. A random grayscale image is generated, then sub-
sampled according to the CFA pattern and finally demosaiced (Fig. 8). The use of a random
image breaks the spatial correlation between neighboring pixels. Demosaicing methods,
which extensively use those correlations, have a worst case scenario to process. The color
aliasing that is produced is therefore a potential for aliasing (PA) [44]. It is measured
by computing the S-CIELab color difference [43] between the original and the demosaiced
image. Table II shows that 2PFCTM has less potential for color aliasing. It should also be
noted that median filtering of color differences helps to reduce aliasing.
Method PA (mean ∆E)
[B] Bilinear 20.25
[2] Bilinear 17.34
[B] DFPD+ 11.77
[2] S+ 8.61
[2] F21 10.18
[2] F21+ 8.60
TABLE II: Potential for color aliasing computed with several demosaicing methods for Bayer and
2PFCTM CFAs.
This method for estimating the potential for aliasing of a demosaicing algorithm coupled
with a CFA pattern, however, is far from perfect: the use of a grayscale image does not take
into account color aliasing occurring at color edges or in color textured regions.
V. SYSTEM PERFORMANCE ANALYSIS
Images produced with a 2PFCTM CFA are less prone to demosaicing artifacts than images
produced with a Bayer CFA. However, the quality of 2PFCTM-based images must be esti-
mated on a full digital camera pipeline and not only on the demosaicing process. We used
the Image Systems Evaluation Tools (ISET [45]) to simulate a full digital camera workflow
and compare the performance of Bayer-based versus 2PFCTM sensors.
12
Page 13
ISET is composed of several Matlab modules that control the different stages of image
acquisition and processing. These stages comprise the scene, optics, the sensor, and the post-
processing. The scene can be a multispectral image, a RGB image, or a generated test target.
Default optics were used. The sensor and pixel parameters are set with appropriate values,
including noise parameters. Post-processing includes demosaicing, white-balancing, and
color-matrixing. The goal being to compare Bayer and 2PFCTM, most of the parameters are
kept the same for the two sensors, including optics, pixel characteristics, noise parameters,
and color post-processing. The main difference, besides the CFA pattern, is the color filter
set used and its effect on the post-processing steps. For the Bayer-based sensor, we used
generic RGB filters provided by ISET (ISET RGB) and color filters from a professional
digital camera (C-RGB). For 2PFCTM, we used two filter sets obtained by optical simulation,
called 2PFC-A and 2PFC-B, respectively [14]. These explore a range of possible relative
RGB sensitivities. Due to the nature of the stacked blue and red diodes, there is some color
mixing between these channels, the extent of which depends on the optical and electrical
design of the sensor. The two filter sets are intended to test the effect of spectra variation.
The four filter sets’ spectral sensitivity responses are plotted in Figure 9.
A. Resolution
In terms of spatial resolution, a 2PFCTM stacked sensor can be expected to have slightly
better performance than a Bayer array at the same pixel pitch. But the expected difference
may not be large and also strongly depends on the demosaicing method. To evaluate the
Bayer and 2PFCTM resolution performance, we analyzed simulated images of the ISO12233
slanted bar target [46] and report MTF50 values, i.e. the frequency at which the modulated
transfer function value is half of its DC value. Fig. 10 presents the derived MTF curves
for the R, G, and B channels. The black curve represents the luminance MTF response.
For bilinear demosaicing (Fig. 10(a) and (b)), 2PFCTM performs better than Bayer in terms
of MTF50 values and the R, G, and B MTF curves are coincident. However, when using
state-of-the-art demosaicing algorithms, the resolution difference as measured by the MTF
becomes much smaller. Fig. 10 compares Menon et al.’s method [32] with our frequency-
based 2PFCTM demosaicing. Both give similar, much higher MTF50 values than the bilinear
cases. Also, the Menon et al. method does quite well for this black-and-white edge at
13
Page 14
equating the MTF responses of the R, G, and B channels (mainly due to how it equates
the high frequency content between R, G, and B channels), while 2PFCTM exhibits some
spread. Thus, using a more-sophisticated Bayer demosaicing method leads to a much sharper
resulting image and with resolution comparable to that of a 2PFCTM image. 2PFCTM can,
therefore, be considered to have higher resolution only when using low-complexity Bayer
demosaicing. This slanted-bar resolution measure, however, does not necessarily indicate
which demosaicing method is of better quality as Bayer tends to have more color artifacts
than 2PFCTM (e.g. see Fig. 7).
We also evaluated resolution using a method stipulated by the Camera & Imaging Prod-
ucts Association (CIPA) [47]. With ISET, we simulated images of the J1 region of the
ISO12233 test chart as if the chart were 100cm from the camera (Fig. 11). These images
were then input into the “HYRes” software downloaded from the CIPA website. This soft-
ware analyzes the images and determines the point at which the 5 lines in the J1 test pattern
become unresolved, indicated by the red line in each image. Fig. 11 shows Bayer images for
bilinear, and Menon et al. demosaicing, and 2PFCTM with bilinear, spatial, and frequency-
based demosaicing. The calculated resolution is 135 lines/picture-height (l/ph) for Bayer
with bilinear demosaicing, but improves dramatically to 175 l/ph for all the rest, including
2PFCTM with bilinear demosaicing.
B. Noise
ISET simulates several noise sources, including dark current, read noise, dark signal
non-uniformity (DSNU), and photo response non-uniformity (PRNU). Noise parameters are
held constant for Bayer-based and 2PFCTM sensors simulations as we do not yet have an
accurate noise model of the 2PFCTM sensor, nor a prototype to measure it. The main
source of noise level difference in the simulated results comes from the different color filters
spectral sensitivity response and from the color matrixing to transform camera RGB values
to a standard color space. The spectral sensitivity curves of 2PFCTM filters (Fig. 9) are
more correlated as the wavelength separation for the stacked pixel is not perfect and some
reddish (respectively bluish) light is captured in the blue (respectively red) sensitive area of
the pixel. The two 2PFCTM spectral sensitivity curves shown in Figure 9 represent a range
of possible curves [14] to explore the effect of this variation.
14
Page 15
Let M be the transformation matrix from camera RGB (cRGB) to sRGB values. M can
be written as M = Ms ·Mc, where Mc is the transformation matrix from cRGB to XYZ and
Ms is the transformation matrix from XYZ to sRGB. The values of Mc depend on the overall
sensor spectral sensitivities and on the method used to compute it. Ms is fixed and defined
by the sRGB standard [48]. Let κ be the condition number of M . In the case of the linear
color transform M , κ is computed as the ratio of maximum to minimum singular value and
indicates how much the transformation is sensitive to noise [49]. A perfect value of κ is unity
and indicates an identity operation. Larger values of κ indicate larger noise amplification in
general. We computed κ for the four different filter sets of Figure 9 (Tab. III): two used with
the Bayer CFA (ISET RGB and C-RGB) and two used with the 2PFCTM CFA (2PFC-A
and 2PFC-B). Mc was computed using the white point preserving least square method [50].
ISET RGB C-RGB 2PFC-A 2PFC-B
κ 1.65 1.89 2.07 1.90
M
0.602 0.250 0.148
0.284 0.649 0.067
0.067 −0.018 0.952
0.632 0.186 0.182
0.311 0.723 −0.034
0.062 −0.123 1.061
0.665 0.241 0.094
0.376 0.625 −0.001
−0.260 0.018 1.242
0.629 0.211 0.160
0.258 0.734 0.008
−0.089 0.054 1.035
TABLE III: Condition number κ of the linear transformationM from cRGB to sRGB for 4 different
filter sets.
The condition number when using filters for 2PFCTM is slightly higher than for Bayer-
based sensor filters. The ISET RGB filter set is, however, an ideal case. Comparing real
filters (C-RGB) to 2PFCTM filter sets, the difference becomes much smaller.
If we consider the worst case scenario, the color noise should be more amplified with
2PFCTM than with Bayer-based sensors when converting from cRGB to sRGB and using
the same method to compute Mc. To verify our hypothesis, signal to noise ratio (SNR) was
measured on the 18% gray level patch from a simulated Macbeth color checker under D65
rendered with ISET to sRGB (Fig. 12). The SNR is computed for both luma Y and chroma
CbCr of the YCbCr color space. Figure 13 shows the variation of SNR with exposure time
for all four filter sets. At low exposures, luma noise is lower for 2PFCTM than for Bayer.
A justification can be found in the higher quantum efficiency of the 2PFCTM color filters
spectral sensitivities response. As expected, chroma noise is slightly higher for 2PFCTM.
Sensitivity to noise can vary by modifying how Mc is computed. Vora and Herley [49]
15
Page 16
showed that there is a trade-off between color saturation and noise sensitivity. With 2PFCTM
sensors having more correlated filters than Bayer-based sensors, the colors tend to be less
saturated. In order to achieve the desired noise behavior, Mc can be modified at the expense
of color saturation.
VI. CONCLUSION
We have presented a modification to the standard single color CFA and photodiode
structure for CMOS image sensors called 2PFCTM (Two Pixels, Full Color). This new
stacked sensor has only two color filters (green and magenta) to capture three colors (red,
green, and blue). Green is captured with a standard diode overlaid by a green filter, while
red and blue are captured by stacked diodes overlaid by a magenta filter. Thus, the sampling
frequency for the three channels (R, G, and B) is identical.
The new 2PFCTM geometry requires a new demosaicing method to reconstruct the full
color image. We developed a frequency-based demosaicing algorithm adapted for the new
CFA design. Our approach uses the separation of luminance and chrominance in the Fourier
domain of the CFA to reconstruct missing color pixels. Unlike methods for single color CFA
sensors, luminance and chrominance are well separated in the Fourier domain, which enables
the use of computationally inexpensive linear filters.
The demosaicing algorithm shows excellent performance compared to methods for the
Bayer CFA in terms of color PSNR, spatial color difference S-CIELab ∆E, and zipper arti-
facts. Color aliasing is also greatly reduced, both visually and also according to our proposed
method that can estimate the potential for aliasing of demosaicing algorithms.
When integrated in a full system simulation, 2PFCTM visually still performs better than
Bayer. We evaluated resolving power using two methods: MTF50 computed on a slanted
edge and the CIPA method. Resolution is the same for computationally expensive Bayer de-
mosaicing algorithms and less expensive 2PFCTM methods. When analyzing noise, however,
we noticed that the chroma noise is slightly higher with 2PFCTM as the color filters’ spectral
sensitivities are more correlated than with Bayer. A better noise model of 2PFCTM is, how-
ever, necessary to get a more precise understanding of the difference between Bayer-based
and 2PFCTM sensor noise.
The device structure of the 2PFCTM is compatible with standard CMOS processes. We
16
Page 17
therefore believe that it is possible, at equivalent cost, to use the same production methods to
fabricate a sensor that is better than existing ones in term of image quality or, alternatively,
produce a sensor with an equivalent image quality but with computationally less expensive
algorithms for use in smaller devices such as cell phones.
More information on the 2PFCTM imager is available at
http://www.sharplabs.com/2pfc.php.
Acknowledgments
The authors would like to thank S. Susstrunk and M.A. Kriss for their helpful comments,
and D. Menon and B.K. Gunturk for providing the code to their algorithms. This work was
supported in part by the Swiss National Science Foundation under grant number 200021-
113829.
[1] B. E. Bayer, “Color imaging array.” U.S. Patent 3 971 065, 1976.
[2] W. N. Carr, “Multi-spectrum photodiode devices.” US Patent 4 238 760, 1980.
[3] N. Harada and O. Yoshida, “Visible/infrared imaging device with stacked cell structure.” US
Patent 4 651 001, 1987.
[4] P. Seitz, D. Leipold, J. Kramer, and J. M. Raynor, “Smart optical and image sensors fabricated
with industrial cmos/ccd semiconductor processes,” in Proc. SPIE, 1900, 1993.
[5] R. B. Merrill, “Color separation in an active pixel cell imaging array using a triple-well-
structure.” US Patent 5 965 875, 1999.
[6] D. L. Gilblom, S. K. Yoo, and P. Ventura, “Operation and performance of a color image sensor
with layered photodiodes,” in Proc. of SPIE, 5074, pp. 318–331, 2003.
[7] P. M. Hubel, J. Liu, and R. J. Guttosch, “Spatial frequency response of color image sensors:
Bayer color filters and foveon x3,” in Proc. of SPIE, 5301, pp. 402–407, 2004.
[8] K. M. Findlater, D. Renshaw, J. E. D. Hurwitz, R. K. Henderson, M. D. Purcell, S. G.
Smith, and T. E. R. Bailey, “A cmos image sensor with a double-junction active pixel,” IEEE
Transaction on Electron Devices 50, pp. 32–42, January 2003.
[9] S. C. Hong, “CMOS image sensor and method of fabrication.” U.S. Patent 6 946 715, 2005.
17
Page 18
[10] T. Saito and T. Komatsu, “Image recovery for a direct color imaging approach using a color
filter array,” in IS&T/SPIE Electronic Imaging: Digital Photography II, 6069, 2006.
[11] S. Henker, J.-U. Schlußler, and R. Schuffny, “Concept of color correction on multi-channel
cmos sensors,” in Digital Image Computing: Techniques and Applications, 7th Biennial Aus-
tralian Pattern Recognition Society Conference - DICTA, 2, pp. 771–780, 2003.
[12] S. Henker, C. Mayr, J.-U. Schlußler, R. Schuffny, U. Ramacher, and A. Heittmann, “Active
pixel sensor arrays in 90/65nm cmos-technologies with vertically stacked photodiodes,” in
International Image Sensor Workshop, 2007.
[13] H. Steibig, R. A. Street, D. Knipp, M. Krause, and J. Ho, “Vertically integrated thin-film
color sensor arrays for advanced sensing applications,” Appl. Phys. Lett. 88, 2006.
[14] D. J. Tweet, J. J. Lee, J. M. Speigle, and D. Tamburrino, “2PFC image sensors: better image
quality at lower cost,” in IS&T/SPIE Electronic Imaging: Digital Photography V, 7250, 2009.
[15] R. Lukac and K. N. Plataniotis, “Color filter arrays: Design and performance analysis,” IEEE
Trans. Consumer Electron. 51, pp. 1260–1267, 2005.
[16] T. Kijima, H. Nakamura, J. T. Compton, and J. F. Hamilton Jr., “Image sensor with improved
light sensitivity.” U.S. Patent Application 20 070 177 236, 2007.
[17] K. Hirakawa and P. J. Wolfe, “Second-generation color filter array and demosaicking designs,”
in Proc. SPIE, 6822, p. 68221P, 2008.
[18] X. Li, B. Gunturk, and L. Zhang, “Image demosaicing: A systematic survey,” in IS&T/SPIE
Electronic Imaging: Visual Communications and Image Processing, 6822, 2008.
[19] J. E. Adams and J. F. Hamilton Jr., “Adaptive color plane interpolation in single color
electronic camera.” U.S. Patent 5 506 619, 1996.
[20] R. H. Hibbard, “Apparatus and method for adaptively interpolating a full color image utilizing
luminance gradients.” U.S. Patent 5 382 976, 1995.
[21] J. F. Hamilton Jr. and J. E. Adams, “Adaptive color plane interpolation in single color
electronic camera.” U.S. Patent 5 629 734, 1997.
[22] C. Laroche and M. Prescott, “Apparatus and method for adaptively interpolating a full color
image utilizing chrominance gradients.” U.S. Patent 5 373 322, 1994.
[23] W. Lu and Y.-P. Tan, “Color filter array demosaicking: new method and performance mea-
sures.,” IEEE Transactions on Image Processing 12(10), pp. 1194–1210, 2003.
[24] X. Wu and N. Zhang, “Primary-consistent soft-decision color demosaicking for digital cameras
18
Page 19
(patent pending),” IEEE Transactions on Image Processing 13, pp. 2163–1274, September
2004.
[25] L. Zhang and X. Wu, “Color demosaicking via directional linear minimum mean square-error
estimation,” IEEE Trans. Image Processing 14, pp. 2167–2178, December 2005.
[26] C.-Y. Tsai and K.-T. Song, “Heterogeneity-projection hard-decision color interpolation using
spectral-spatial correlation,” IEEE Transactions on Image Processing 16(1), pp. 78–91, 2007.
[27] K. Hirakawa and T. W. Parks, “Adaptive homogeneity-directed demosaicing algorithm,” IEEE
Trans. Image Processing 14(3), pp. 360–369, 2005.
[28] D. Cok, “Signal processing method and apparatus for producing interpolated chrominance
values in a sampled color image signal.” U.S. Patent 4 642 678, 1987.
[29] W. T. Freeman, “Method and apparatus for reconstructing missing color samples.” U.S. Patent
4 774 565, September 1988.
[30] S. Pei and I. Tam, “Effective color interpolation in ccd color filter array using signal correla-
tion,” CirSys Video 13(6), pp. 503–513, 2003.
[31] C. Yuk, O. Au, R. Li, and S.-Y. Lam, “Color demosaicking using direction similarity in color
difference spaces,” in International Symposium on Circuits and Systems, pp. 1281–1284, 2007.
[32] D. Menon, S. Andriani, and G. Calvagno, “Demosaicing with directional filtering and a pos-
teriori decision,” IEEE Transactions on Image Processing 16(1), pp. 132–141, 2007.
[33] D. Alleysson, S. Susstrunk, and J. Herault, “Linear demosaicing inspired by the human visual
system,” IEEE Transactions on Image Processing 14(4), pp. 439–449, 2005. Supplementary
material available at: http://ivrg.epfl.ch/supplementary material/index.html.
[34] E. Dubois, “Frequency-domain methods for demosaicking of bayer-sampled color images,”
IEEE Signal Processing Letters 12, pp. 847–850, December 2005.
[35] N. Lian, L. Chang, and Y.-P. Tan, “Improved color filter array demosaicking by accurate
luminance estimation.,” in Proc. IEEE International Conference on Image Processing ICIP
2005, pp. 41–44, 2005.
[36] D. Alleysson and B. Chaix de Lavarene, “Frequency selection demosaicking: A review and a
look ahead,” in IS&T/SPIE Electronic Imaging: Visual Communications and Image Process-
ing, 6822, 2008.
[37] Y. M. Lu and M. Vetterli, “Optimal color filter array design: Quantitative conditions and an
efficient search procedure,” in Proc. SPIE Conference on Digital Photography V, 7250, 2009.
19
Page 20
[38] “Kodak photocd image database.” http://r0k.us/graphics/kodak/.
[39] E. Dubois, “Filter design for adaptive frequency-domain bayer demosaicking,” in Proc. IEEE
International Conference on Image Processing ICIP 2006, 2006.
[40] D. Alleysson, S. Susstrunk, and J. Marguier, “Influence of Spectral Sensitivity Functions on
color demosaicing,” in IS&T/SID 11th Color Imaging Conference, 11, pp. 351–357, 2003.
[41] B. K. Gunturk, Y. Altunbasak, and R. M. Mersereau, “Color plane interpolation using alter-
nating projections.,” IEEE Transactions on Image Processing 11, pp. 997–1013, September
2002.
[42] D. Menon and G. Calvagno, “Demosaicing based on wavelet analysis of the luminance compo-
nent,” in Proc. IEEE International Conference on Image Processing ICIP 2007, pp. 181–184,
IEEE, 2007.
[43] X. Zhang and B. A. Wandell, “A spatial extension of cielab for digital color image reproduc-
tion,” in Proceedings of the SID Symposiums, pp. 731–734, 1996.
[44] M. A. Kriss, “Tradeoff between aliasing artifacts and sharpness in assessing image quality,”
in Image Processing, Image Quality, Image Capture, Systems Conference PICS, pp. 247–256,
1998.
[45] J. E. Farrell, F. Xiao, P. B. Catrysse, and B. A. Wandell, “A simulation tool for evaluating
digital camera image quality,” in IS&T/SPIE Electronic Imaging, 2003.
[46] “Photography – Electronic still-picture cameras – Resolution measurements.” ISO12233, 2000.
[47] “CIPA DC-003-Translation-2003, resolution measurement methods for digital cameras.” Cam-
era and Imaging Products Association (CIPA), 2003.
[48] “IEC 61966 2-1:1999. multimedia systems and equipment - colour measurment and manage-
ment - part 2-1: colour management-default RGB colour space - sRGB,” 1999.
[49] P. Vora and C. Herley, “Trade-offs between color saturation and noise sensitivity in image
sensors,” in Proc. IEEE Int. Conf. Image Processing, 1, pp. 196–200, 1998.
[50] G. D. Finlayson and M. S. Drew, “Constrained least-squares regression in color spaces,”
Journal of Electronic Imaging 6, pp. 484–493, October 1997.
20
Page 21
Daniel Tamburrino has received his MS in physics from the Ecole Polytechnique
Federale de Lausanne (EPFL) in 2003. He worked two years on an e-learning project
about scientific and forensic photography. Since 2006, he has been a Research Assistant in
the Image and Visual Representation Group at EPFL. In 2008, he visited Sharp Labs of
America, Camas, WA, as an intern.
Jon Speigle is a researcher at the Sharp Laboratories of America, where he has worked
on color science, image enhancement algorithms, and image quality evaluation for print,
scan, and display applications. He received his BS degree in aeronautical engineering from
the Massachusetts Institute of Technology with a specialization in avionics. In 1997 he
received his PhD in Psychology from the University of California, Santa Barbara, focusing
on visual perception and psychophysics. His current interests are in color imaging, image
quality modeling, and the application of spatiotemporal visual models to video enhancement
algorithms.
Doug Tweet is a Principal Engineer at Sharp Labs of America, where he has worked
on CMOS image sensors and germanium IR detectors, as well as strained silicon and SiGe
CMOS transistors. He received his Ph.D. in Physics from the University of Washington in
1990. Before joining Sharp in 1997 he worked in Japan for NEC and the Electrotechnical
laboratory.
Jong-Jan Lee is a Principal Research Scientist at the Sharp Laboratories of America.
He received his PhD from Arizona State University in 1994 and worked for Sharp Micro-
electronics Technology, WaferTech and Motorola before joined SLA in 2001. His has broad
experience in the IC industry, including ESD protection device design, 1T FRAM device,
strained silicon on insulator devices, and CMOS and CCD imagers. He has more than 20
journal publications and 77 patents.
21
Page 22
FIG. 1: CFA patterns: (a) Bayer [1], (b) Lukac [15], (c) Kodak [16], (d) Hirakawa’s “Pattern A”
[17] and (e) 2PFCTM[14].
FIG. 2: Device structure of 2PFCTM.
FIG. 3: Nyquist spatial frequency limits for (a) Bayer and (b) 2PFCTM in the horizontal and
vertical directions. fh and fv are the spatial frequencies in the horizontal and vertical direction,
respectively.
FIG. 4: Block diagrams of (a) spatial-based demosaicing (Section IIIA) and (b) frequency-based
demosaicing (Section III B 2).
FIG. 5: Mean representation of the log magnitude of the Fourier transform for the 24 kodak images
[38] with (a) Bayer CFA: chrominance is located at borders and corners, (b) 2PFCTM [G R] CFA:
chrominance is located at corners only.
FIG. 6: (a) 5 × 5 filter used to extract luminance from the 2PFCTM CFA and (b) its frequency
response.
FIG. 7: Zoom-in of a cropped part of the Kodak Lighthouse image after demosaicing: (a) Original
image, (b) [Bayer] bilinear, (c) [Bayer] adaptive filtering (AF) [35], (d) [Bayer] DLMMSE (DL)
[25], (e) [Bayer] POCS [41], (f) [Bayer] DBW [42], (g) [Bayer] DFPD [32], (h) [2PFC] bilinear,
(i) [2PFC] Spatial method, (j) [2PFC] Spatial method w/ median filtering, (k) [2PFC] Frequency-
based method with 5x5 filter, and (l) [2PFC] Frequency-based method with 5x5 filter and median
filtering.
FIG. 8: Potential for aliasing metric. (a) Random grayscale image, (b) Bayer CFA demosaicing
showing multi-colored arifacts, and (c) 2PFCTM CFA demsaicing showing green-magenta color
artifacts.
FIG. 9: Sensor spectral sensitivity response and quantum efficiency for (a) generic ISET RGB
filters, (b) C-RGB filters (c) 2PFCTM 2PFC-A filters, and (d) 2PFCTM 2PFC-B filters.
22
Page 23
FIG. 10: R, G, B, and luminance modulation transfer function (MTF) curves of simulated sys-
tem after demosaicing for (a) Bayer with bilinear demosaicing: 50% contrast reduction (MTF50)
at 152 cy/mm, (b) 2PFCTM with bilinear demosaicing: MTF50 at 167 cy/mm, (c) Bayer with
state-of-the-art demosaicing: MTF50 at 258 cy/mm, and (d) 2PFCTM with our frequency-based
demosaicing: MTF50 at 254 cy/mm. All used 1.40µm pixel pitch. The ISET RGB spectra was
used for Bayer and the 2PFC-A spectra was used for 2PFCTM.
FIG. 11: ISET simulations of the J1 region of the ISO12233 chart, with resolution analyzed by
“HYRes” according to the CIPA standard and indicated by the red lines. (a) Bayer, Bilinear,
135 l/ph, (b) Bayer, Menon et al.[32], 176 l/ph, (c) 2PFCTM, Bilinear, 174 l/ph, (d) 2PFCTM,
spatial demosaic, 177 l/ph, (e) 2PFCTM, Frequency-based demosaic, 177 l/ph. All simulations
used 1.55µm pixel pitch. The ISET RGB spectra was used for Bayer and the 2PFC-A spectra was
used for 2PFCTM.
FIG. 12: Simulated Macbeth color checker under D65 rendered with ISET at low exposure for (a)
Bayer-based sensor with ISET RGB filters and (b) 2PFCTM sensor with 2PFC-B filters.
FIG. 13: (a) Luma and (b) chroma SNR of a simulated 1.4µm-pixels sensor at varying exposure
time for two filters sets used with the Bayer CFA (ISET RGB and C-RGB) and two filter sets used
with the 2PFCTM CFA (2PFC-A and 2PFC-B).
23