32
1 2Q 2019 Earnings Call 17 May 2019

1
2Q 2019 Earnings Call17 May 2019
2
Safe Harbor Statement & Disclosures
The earnings call and accompanying material include forward-looking comments and information concerning the company’s plans and projections for the future, including estimates and assumptions with respect to economic, political, technological, weather, market acceptance, acquisitions and divestitures of businesses, anticipated transaction costs, the integration of new businesses, anticipated benefits of acquisitions, and other factors that impact our businesses and customers. They also may include financial measures that are not in conformance with accounting principles generally accepted in the United States of America (GAAP). Words such as “forecast,” “projection,” “outlook,” “prospects,” “expected,” “estimated,” “will,” “plan,” “anticipate,” “intend,” “believe,” or other similar words or phrases often identify forward-looking statements. Actual results may differ materially from those projected in these forward-looking statements based on a number of factors and uncertainties. Additional information concerning factors that could cause actual results to differ materially is contained in the company’s most recent Form 8-K and periodic report filed with the U.S. Securities and Exchange Commission, and is incorporated by reference herein. Investors should refer to and consider the incorporated information on risks and uncertainties in addition to the information presented here. The company, except as required by law, undertakes no obligation to update or revise its forward-looking statements whether as a result of new developments or otherwise. The call and accompanying materials are not an offer to sell or a solicitation of offers to buy any of the company’s securities.
Non-GAAP Financial MeasuresThis presentation includes the following non-GAAP financial measures on an historical basis: adjusted net income and adjusted diluted EPS. Please refer to the supplemental information located at the end of this presentation for a reconciliation of these historical non-GAAP financial measures to the most directly comparable historical and forecasted GAAP financial measures and other important information.
3
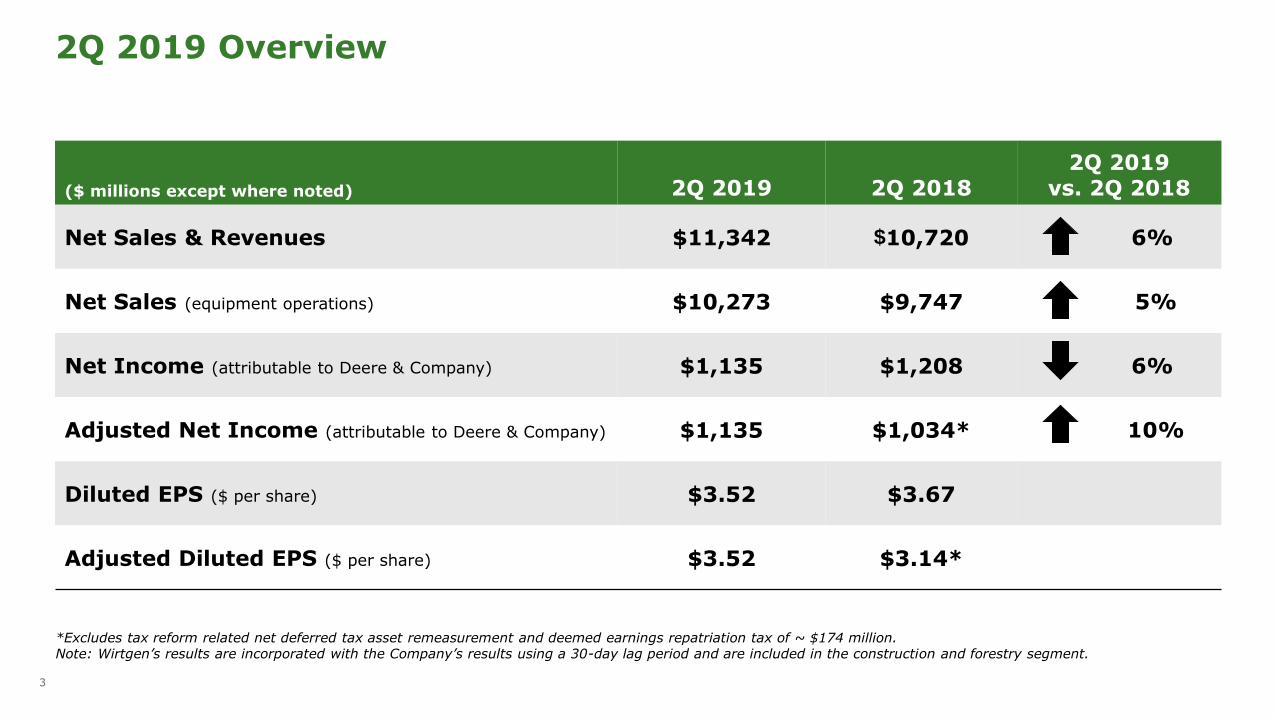
2Q 2019 Overview
($ millions except where noted) 2Q 2019 2Q 20182Q 2019
vs. 2Q 2018
Net Sales & Revenues $11,342 $10,720 6%
Net Sales (equipment operations) $10,273 $9,747 5%
Net Income (attributable to Deere & Company) $1,135 $1,208 6%
Adjusted Net Income (attributable to Deere & Company) $1,135 $1,034* 10%
Diluted EPS ($ per share) $3.52 $3.67
Adjusted Diluted EPS ($ per share) $3.52 $3.14*
*Excludes tax reform related net deferred tax asset remeasurement and deemed earnings repatriation tax of ~ $174 million.Note: Wirtgen’s results are incorporated with the Company’s results using a 30-day lag period and are included in the construction and forestry segment.
4
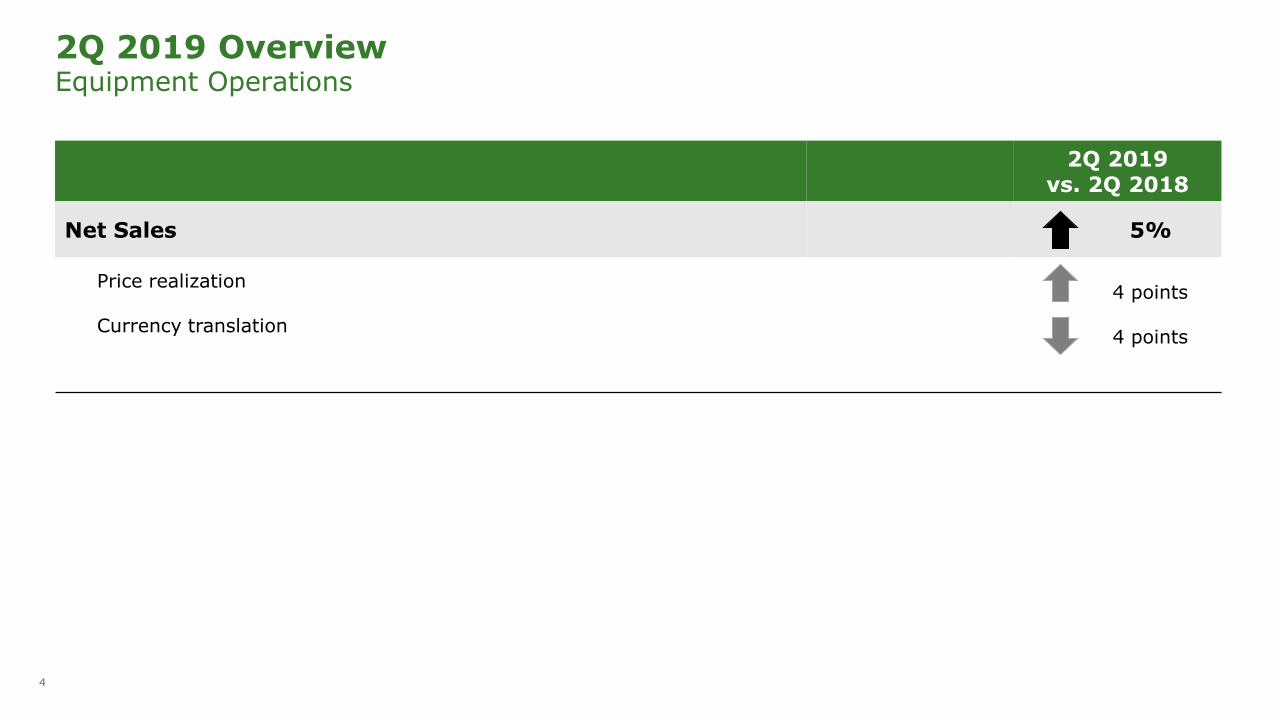
2Q 2019 OverviewEquipment Operations
2Q 2019 vs. 2Q 2018
Net Sales 5%
Price realization
Currency translation
4 points
4 points
5
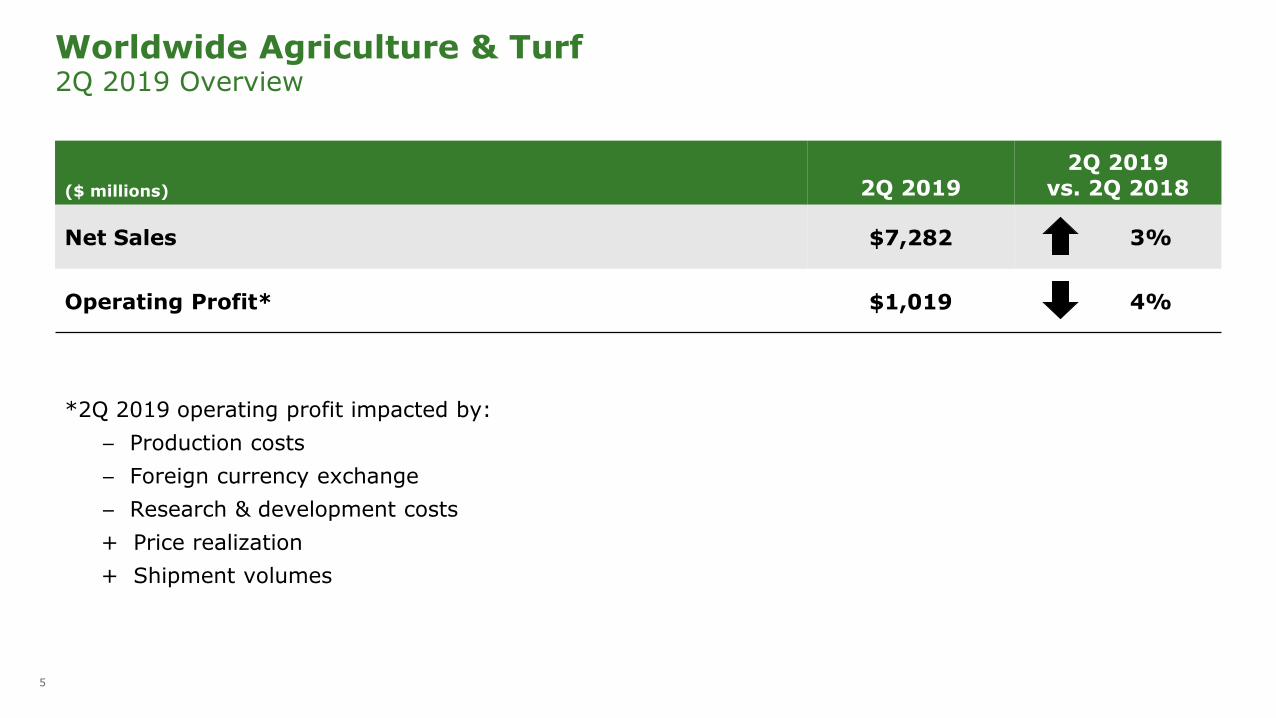
Worldwide Agriculture & Turf2Q 2019 Overview
($ millions) 2Q 20192Q 2019
vs. 2Q 2018
Net Sales $7,282 3%
Operating Profit* $1,019 4%
*2Q 2019 operating profit impacted by:
− Production costs
− Foreign currency exchange
− Research & development costs
+ Price realization
+ Shipment volumes
6
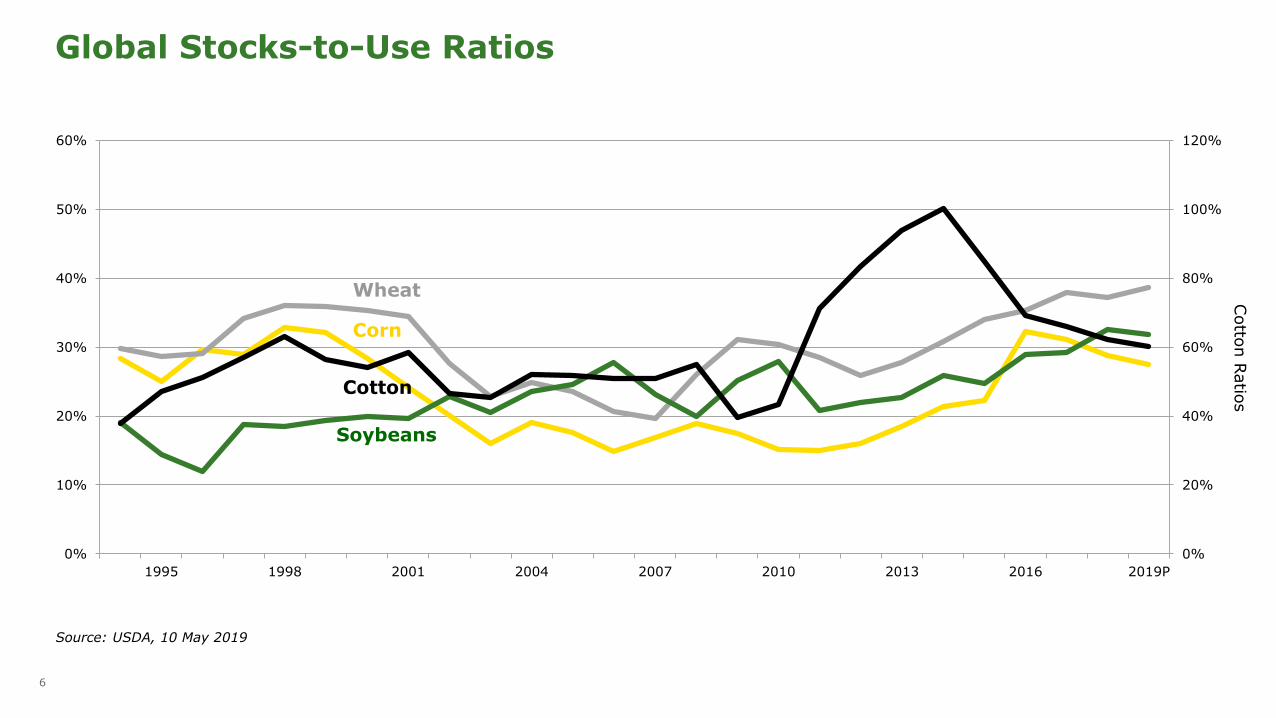
Global Stocks-to-Use Ratios
Source: USDA, 10 May 2019
0%
20%
40%
60%
80%
100%
120%
0%
10%
20%
30%
40%
50%
60%
1995 1998 2001 2004 2007 2010 2013 2016 2019P
Cotto
n R
atio
s
Cotton
Wheat
Corn
Soybeans
7
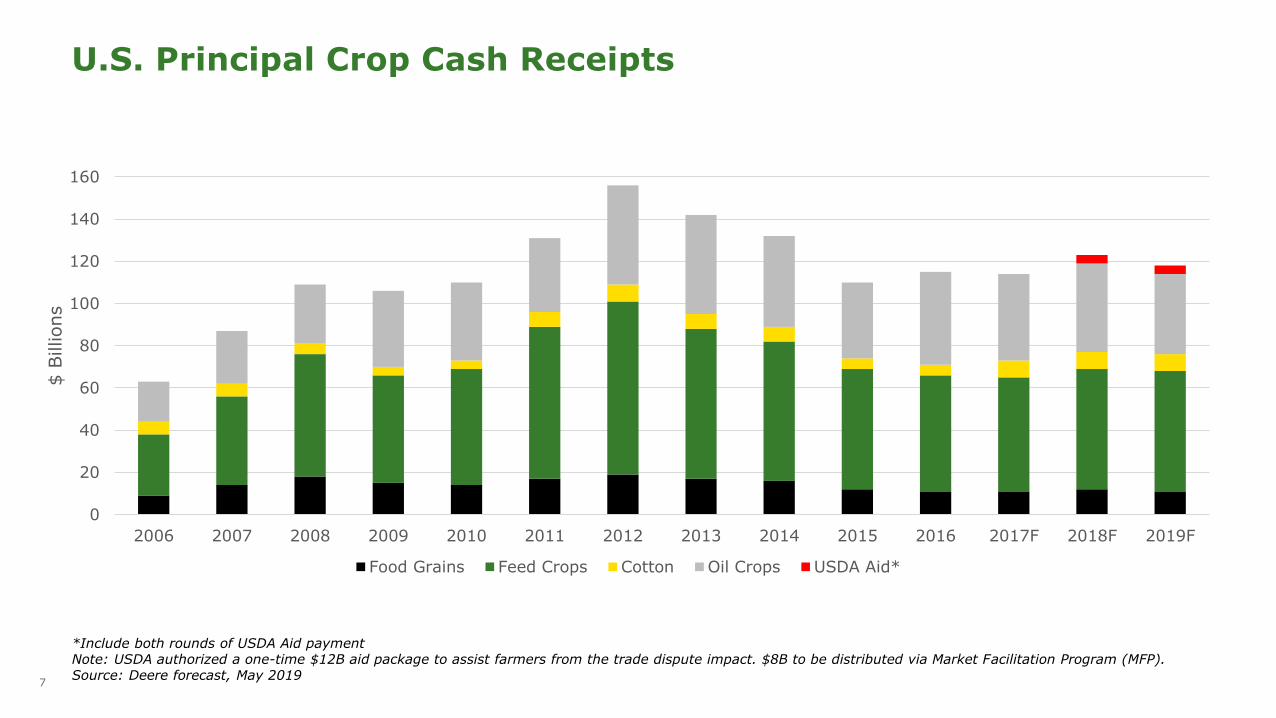
U.S. Principal Crop Cash Receipts
*Include both rounds of USDA Aid paymentNote: USDA authorized a one-time $12B aid package to assist farmers from the trade dispute impact. $8B to be distributed via Market Facilitation Program (MFP).Source: Deere forecast, May 2019
0
20
40
60
80
100
120
140
160
2006 2007 2008 2009 2010 2011 2012 2013 2014 2015 2016 2017F 2018F 2019F
$ B
illions
Food Grains Feed Crops Cotton Oil Crops USDA Aid*
8
Fiscal 2019Forecast
PreviousForecast
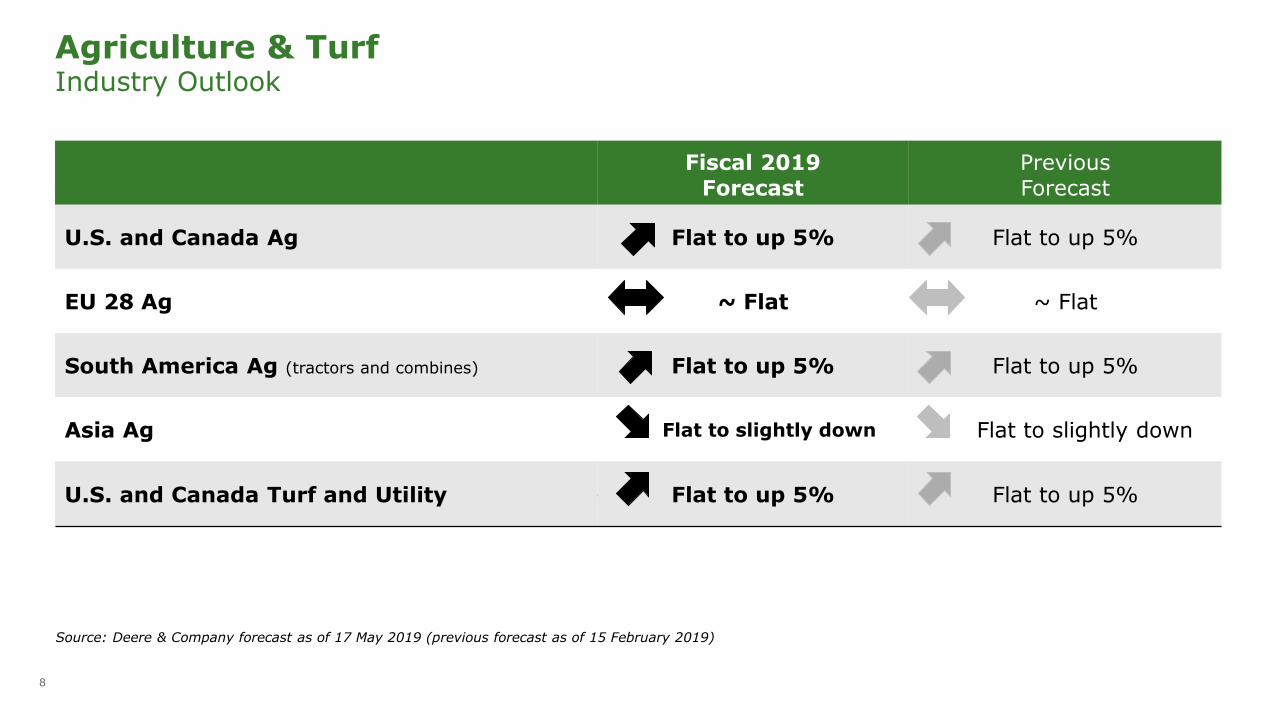
U.S. and Canada Ag Flat to up 5% Flat to up 5%
EU 28 Ag ~ Flat ~ Flat
South America Ag (tractors and combines) Flat to up 5% Flat to up 5%
Asia Ag Flat to slightly down Flat to slightly down
U.S. and Canada Turf and Utility Flat to up 5% Flat to up 5%
Agriculture & TurfIndustry Outlook
Source: Deere & Company forecast as of 17 May 2019 (previous forecast as of 15 February 2019)
9
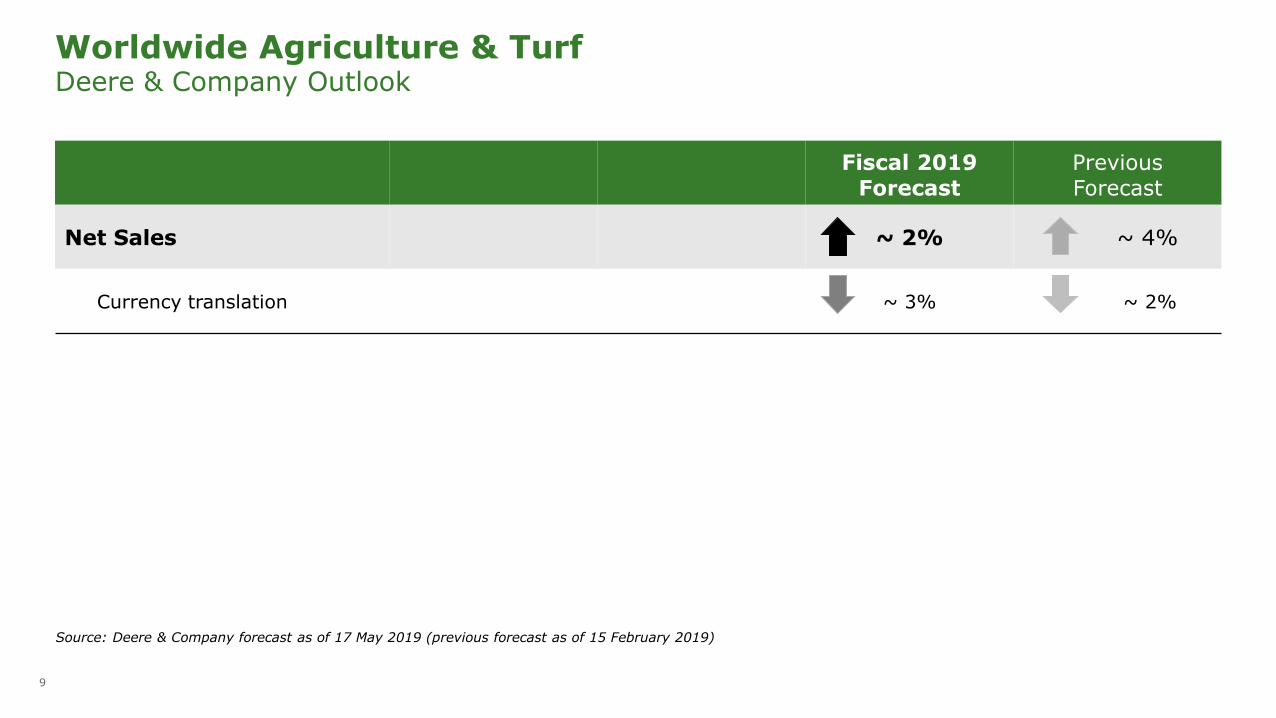
Worldwide Agriculture & TurfDeere & Company Outlook
Fiscal 2019Forecast
PreviousForecast
Net Sales ~ 2% ~ 4%
Currency translation ~ 3% ~ 2%
Source: Deere & Company forecast as of 17 May 2019 (previous forecast as of 15 February 2019)
10
001001
1101110
10101
010010
011100
101101
1011000
0100010
0011
010110
001001
001110
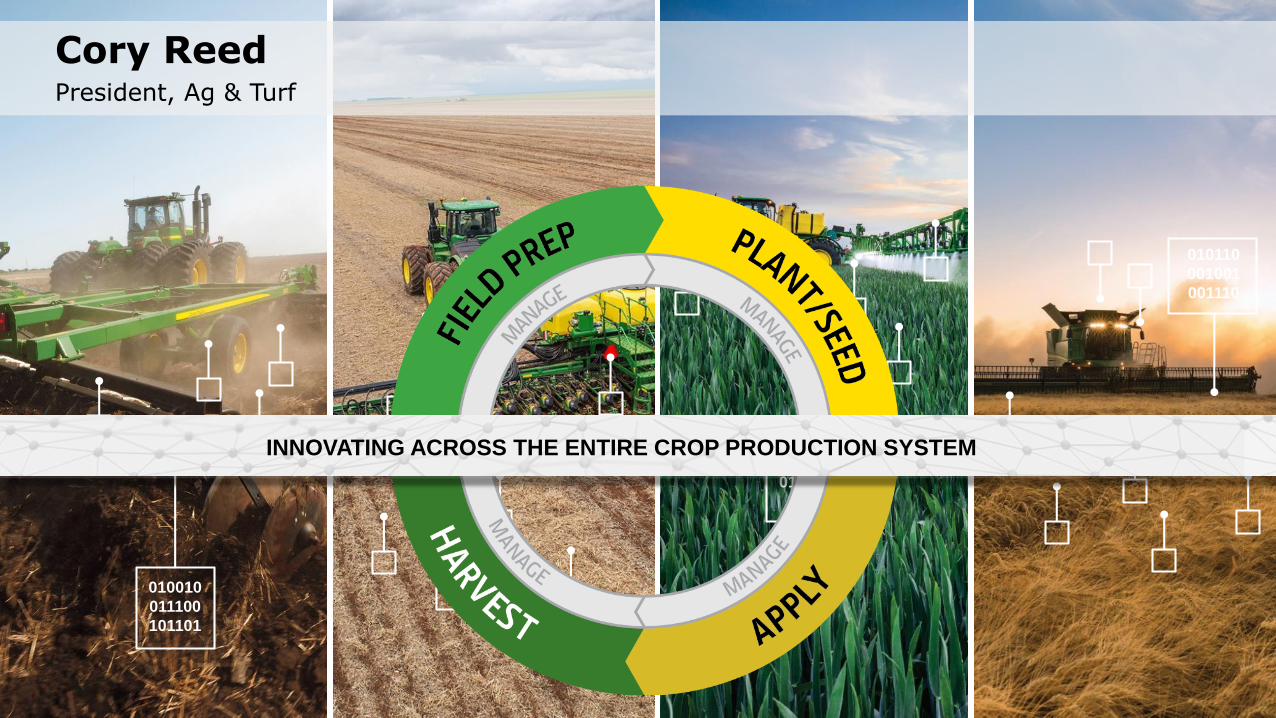
INNOVATING ACROSS THE ENTIRE CROP PRODUCTION SYSTEM
Cory ReedPresident, Ag & Turf
11
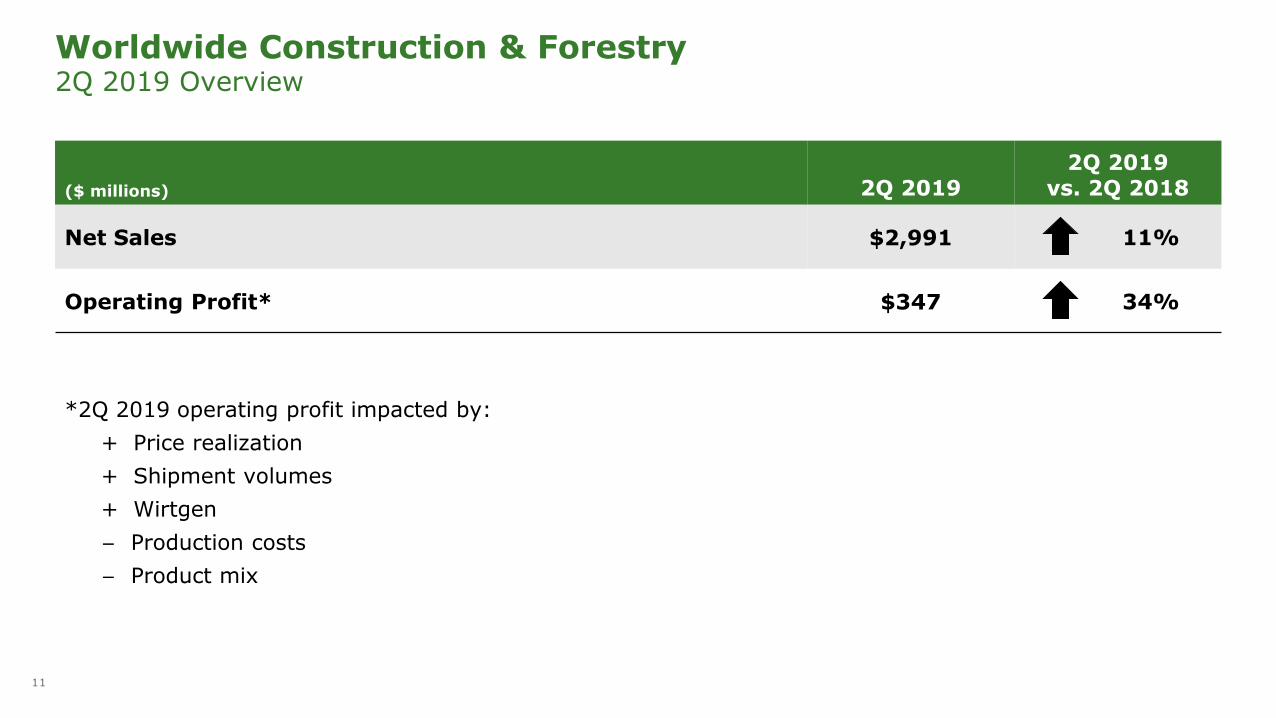
($ millions) 2Q 20192Q 2019
vs. 2Q 2018
Net Sales $2,991 11%
Operating Profit* $347 34%
Worldwide Construction & Forestry2Q 2019 Overview
*2Q 2019 operating profit impacted by:
+ Price realization
+ Shipment volumes
+ Wirtgen
− Production costs
− Product mix
12
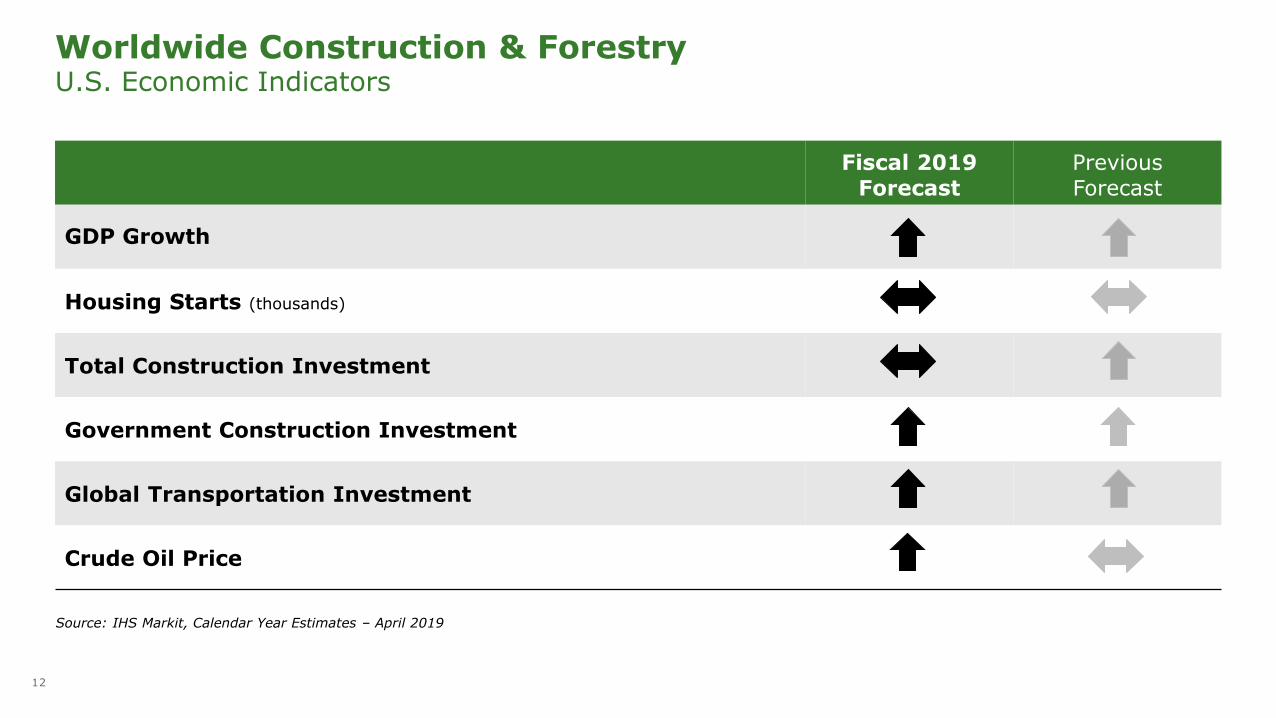
Fiscal 2019Forecast
PreviousForecast
GDP Growth
Housing Starts (thousands)
Total Construction Investment
Government Construction Investment
Global Transportation Investment
Crude Oil Price
Worldwide Construction & ForestryU.S. Economic Indicators
Source: IHS Markit, Calendar Year Estimates – April 2019
13
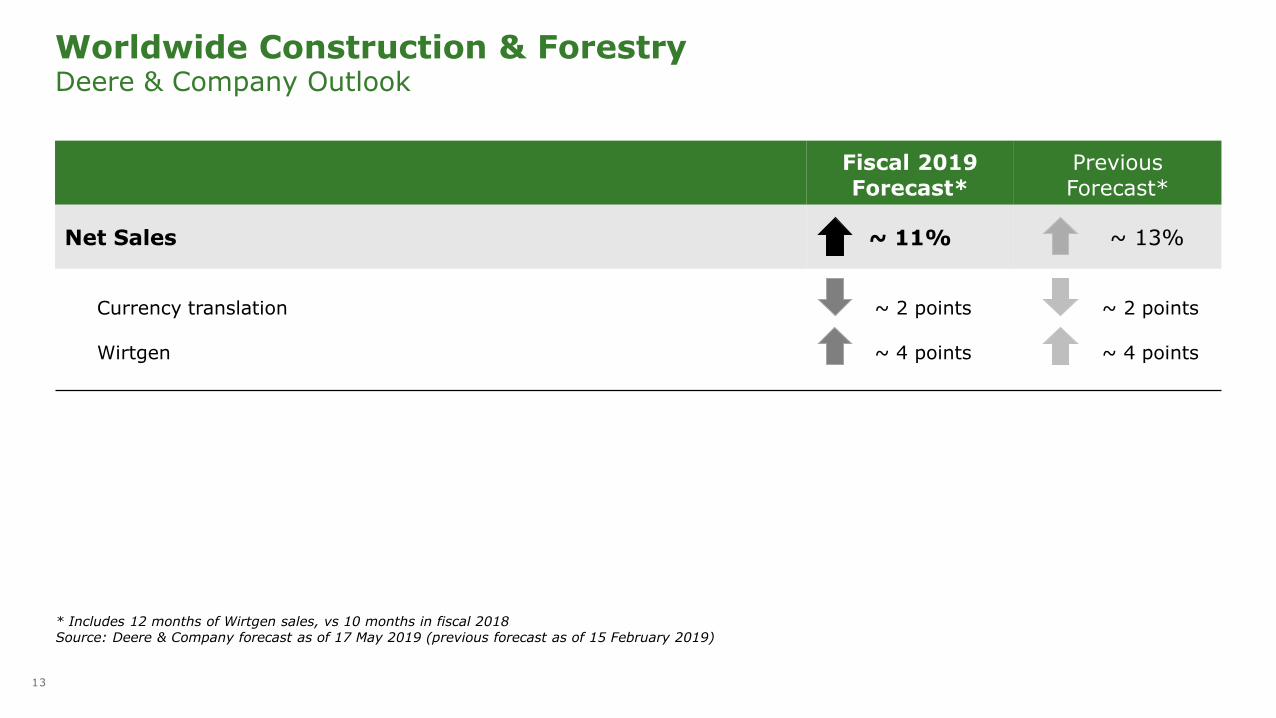
Fiscal 2019 Forecast*
Previous Forecast*
Net Sales ~ 11% ~ 13%
Currency translation
Wirtgen
~ 2 points
~ 4 points
~ 2 points
~ 4 points
Worldwide Construction & ForestryDeere & Company Outlook
* Includes 12 months of Wirtgen sales, vs 10 months in fiscal 2018Source: Deere & Company forecast as of 17 May 2019 (previous forecast as of 15 February 2019)
14
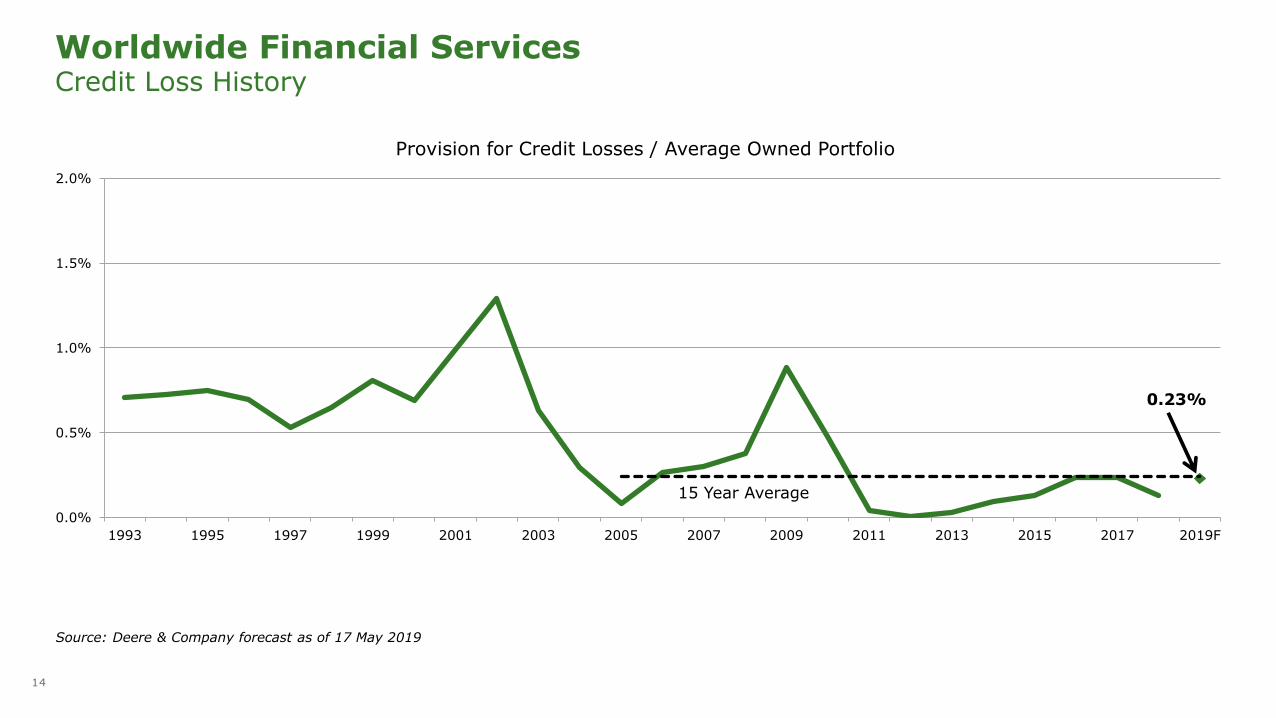
0.0%
0.5%
1.0%
1.5%
2.0%
1993 1995 1997 1999 2001 2003 2005 2007 2009 2011 2013 2015 2017 2019F
Worldwide Financial ServicesCredit Loss History
Provision for Credit Losses / Average Owned Portfolio
0.23%
15 Year Average
Source: Deere & Company forecast as of 17 May 2019
15
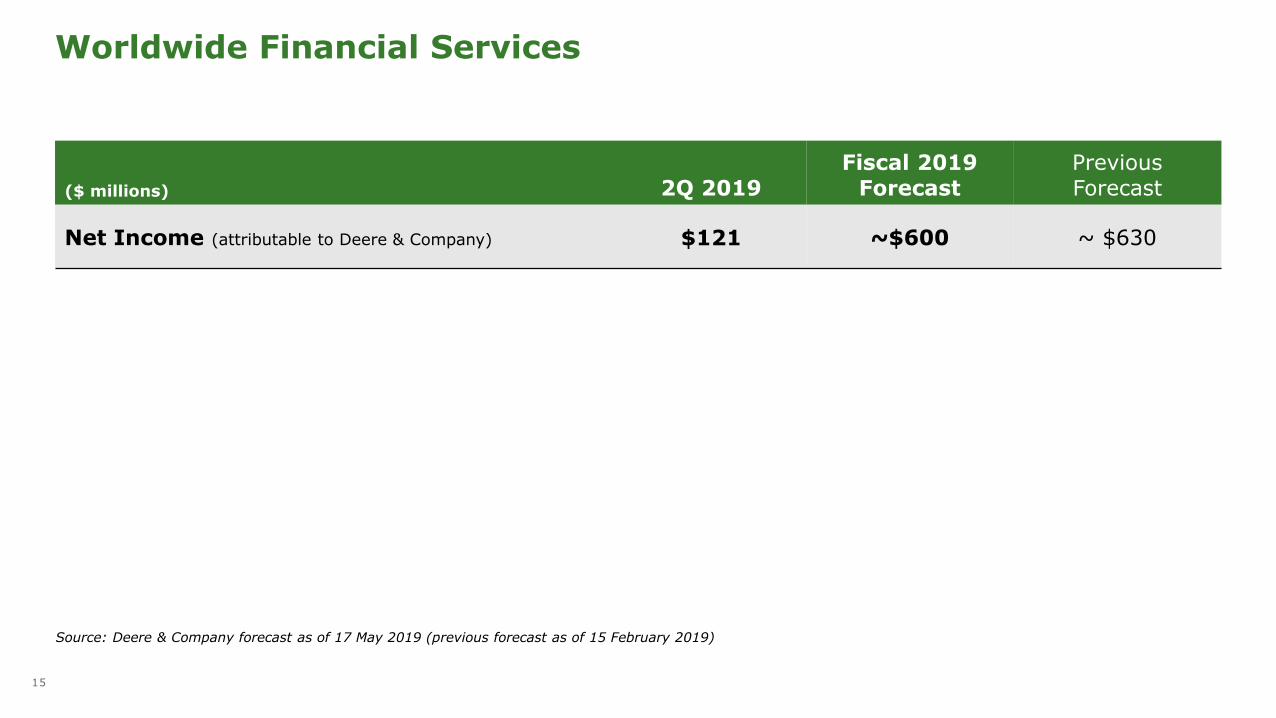
Worldwide Financial Services
($ millions) 2Q 2019Fiscal 2019
ForecastPreviousForecast
Net Income (attributable to Deere & Company) $121 ~$600 ~ $630
Source: Deere & Company forecast as of 17 May 2019 (previous forecast as of 15 February 2019)
16
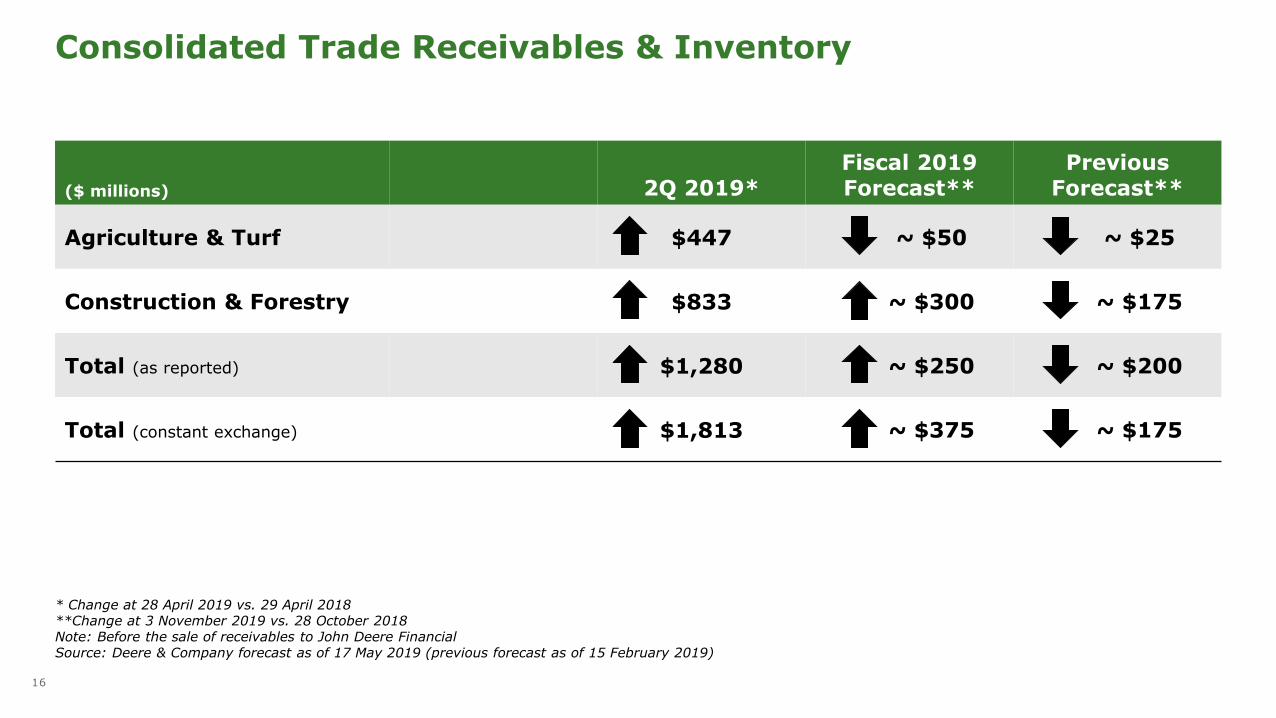
Consolidated Trade Receivables & Inventory
($ millions) 2Q 2019*Fiscal 2019 Forecast**
Previous Forecast**
Agriculture & Turf $447 ~ $50 ~ $25
Construction & Forestry $833 ~ $300 ~ $175
Total (as reported) $1,280 ~ $250 ~ $200
Total (constant exchange) $1,813 ~ $375 ~ $175
* Change at 28 April 2019 vs. 29 April 2018**Change at 3 November 2019 vs. 28 October 2018Note: Before the sale of receivables to John Deere FinancialSource: Deere & Company forecast as of 17 May 2019 (previous forecast as of 15 February 2019)
17
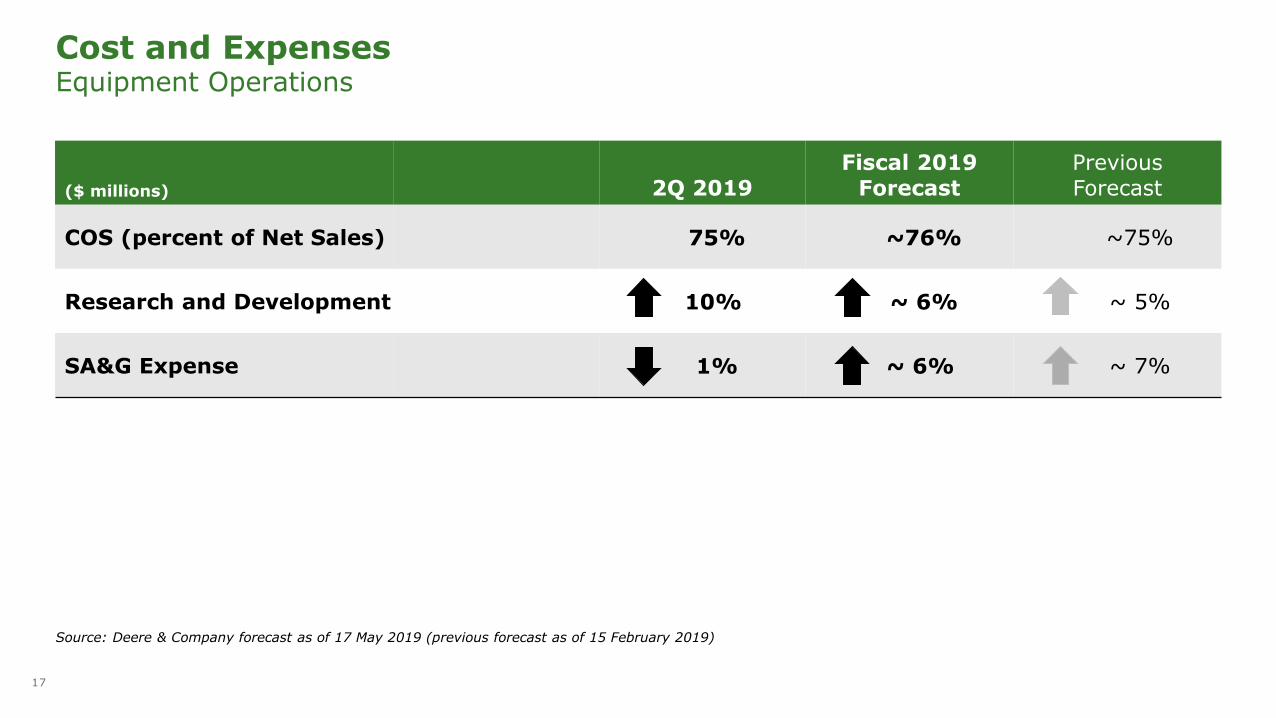
($ millions) 2Q 2019Fiscal 2019
ForecastPreviousForecast
COS (percent of Net Sales) 75% ~76% ~75%
Research and Development 10% ~ 6% ~ 5%
SA&G Expense 1% ~ 6% ~ 7%
Source: Deere & Company forecast as of 17 May 2019 (previous forecast as of 15 February 2019)
Cost and ExpensesEquipment Operations
18
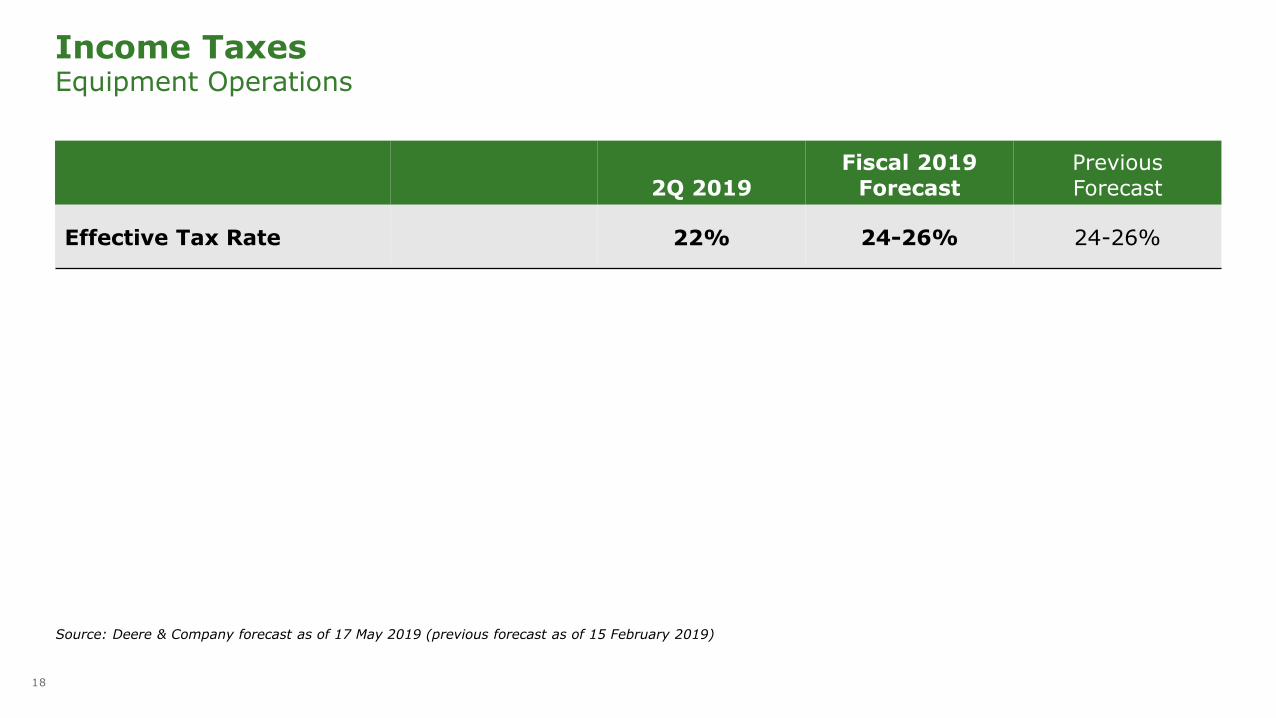
2Q 2019Fiscal 2019
ForecastPreviousForecast
Effective Tax Rate 22% 24-26% 24-26%
Income TaxesEquipment Operations
Source: Deere & Company forecast as of 17 May 2019 (previous forecast as of 15 February 2019)
19
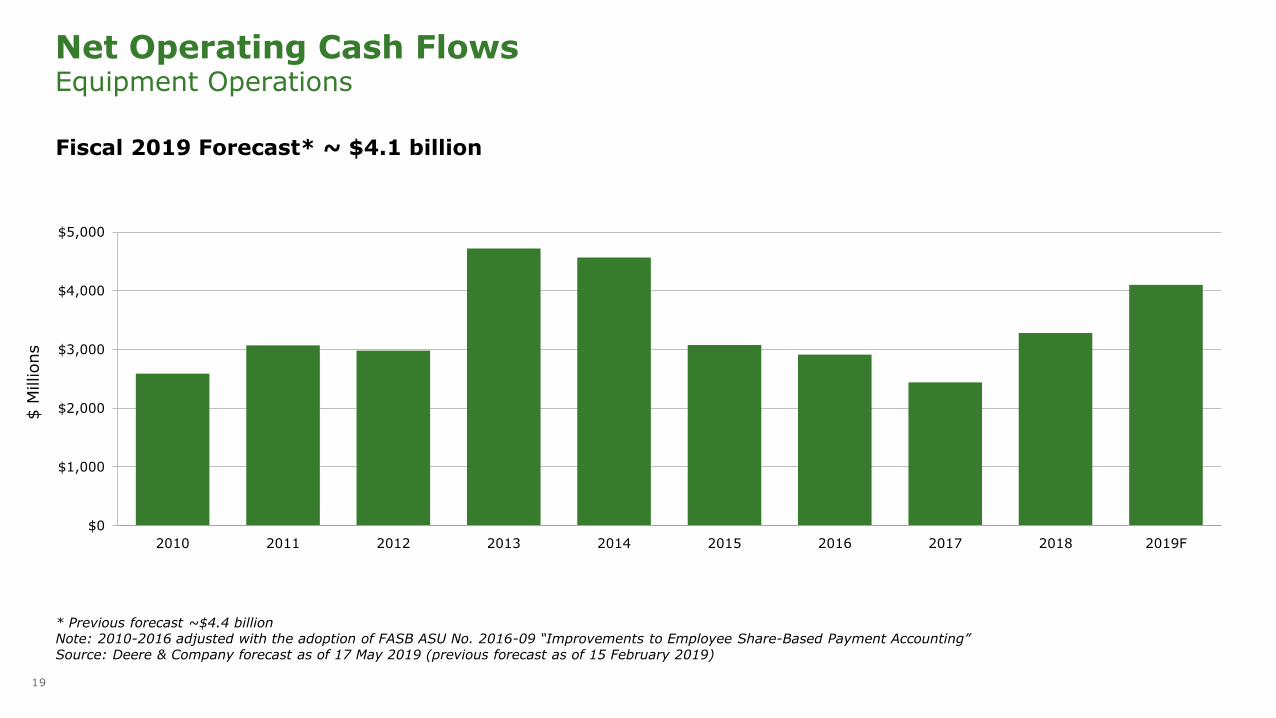
Net Operating Cash FlowsEquipment Operations
Fiscal 2019 Forecast* ~ $4.1 billion
$0
$1,000
$2,000
$3,000
$4,000
$5,000
2010 2011 2012 2013 2014 2015 2016 2017 2018 2019F
$ M
illions
* Previous forecast ~$4.4 billionNote: 2010-2016 adjusted with the adoption of FASB ASU No. 2016-09 “Improvements to Employee Share-Based Payment Accounting”Source: Deere & Company forecast as of 17 May 2019 (previous forecast as of 15 February 2019)
20
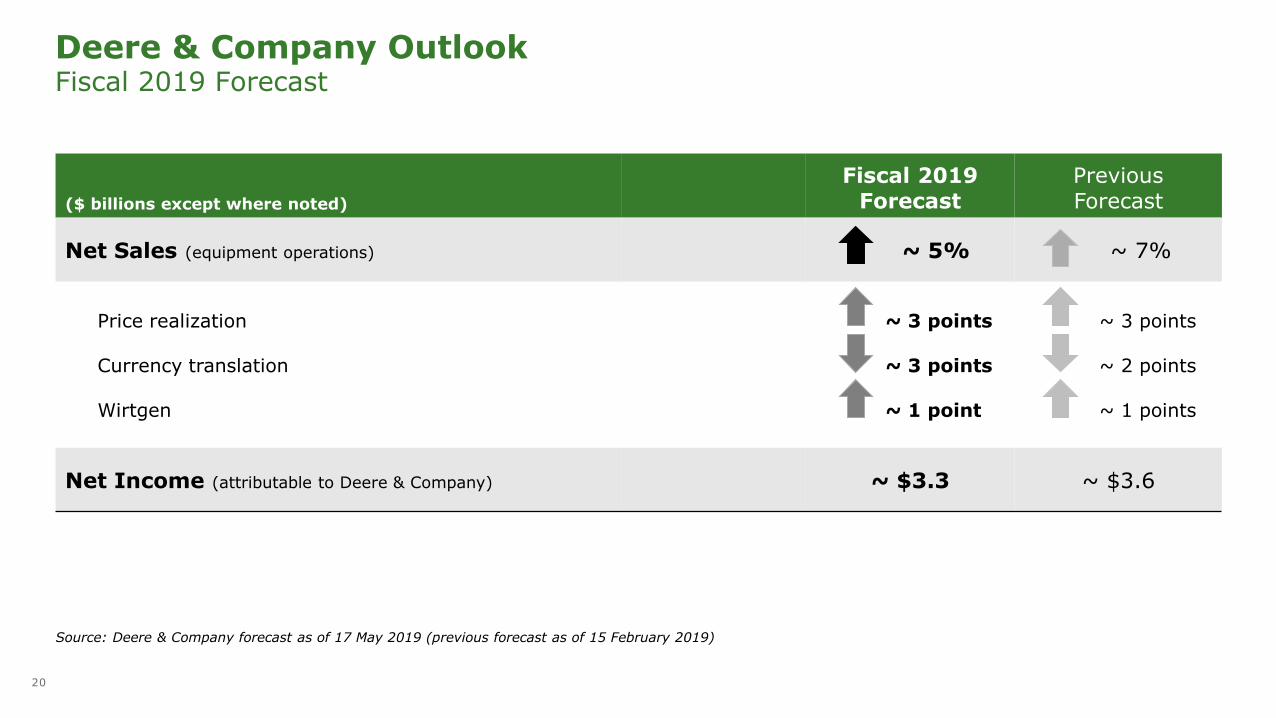
Source: Deere & Company forecast as of 17 May 2019 (previous forecast as of 15 February 2019)
($ billions except where noted)
Fiscal 2019Forecast
PreviousForecast
Net Sales (equipment operations) ~ 5% ~ 7%
Price realization
Currency translation
Wirtgen
~ 3 points
~ 3 points
~ 1 point
~ 3 points
~ 2 points
~ 1 points
Net Income (attributable to Deere & Company) ~ $3.3 ~ $3.6
Deere & Company OutlookFiscal 2019 Forecast

21
Appendix
22
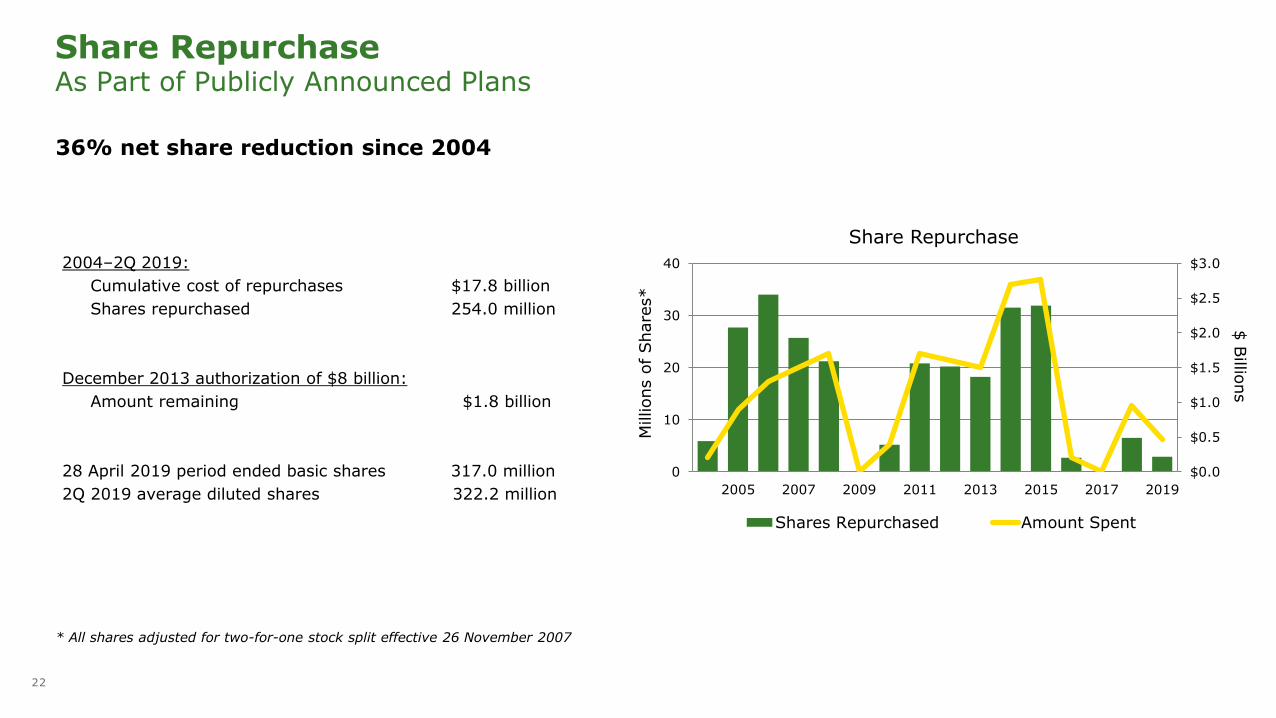
Share RepurchaseAs Part of Publicly Announced Plans
* All shares adjusted for two-for-one stock split effective 26 November 2007
2004–2Q 2019:
Cumulative cost of repurchases $17.8 billion
Shares repurchased 254.0 million
December 2013 authorization of $8 billion:
Amount remaining $1.8 billion
28 April 2019 period ended basic shares 317.0 million
2Q 2019 average diluted shares 322.2 million
$0.0
$0.5
$1.0
$1.5
$2.0
$2.5
$3.0
0
10
20
30
40
2005 2007 2009 2011 2013 2015 2017 2019
$ B
illions
Millions o
f Share
s*
Shares Repurchased Amount Spent
Share Repurchase
36% net share reduction since 2004
23
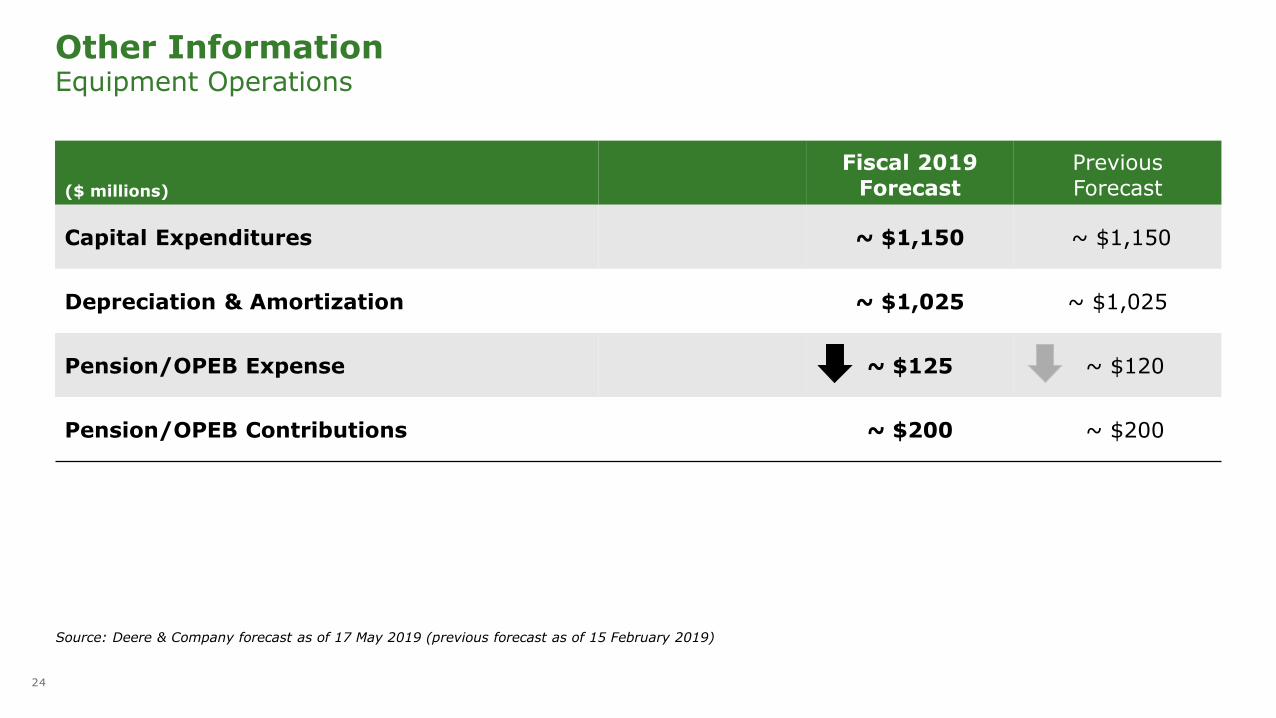
24
($ millions)
Fiscal 2019 Forecast
PreviousForecast
Capital Expenditures ~ $1,150 ~ $1,150
Depreciation & Amortization ~ $1,025 ~ $1,025
Pension/OPEB Expense ~ $125 ~ $120
Pension/OPEB Contributions ~ $200 ~ $200
Other InformationEquipment Operations
Source: Deere & Company forecast as of 17 May 2019 (previous forecast as of 15 February 2019)
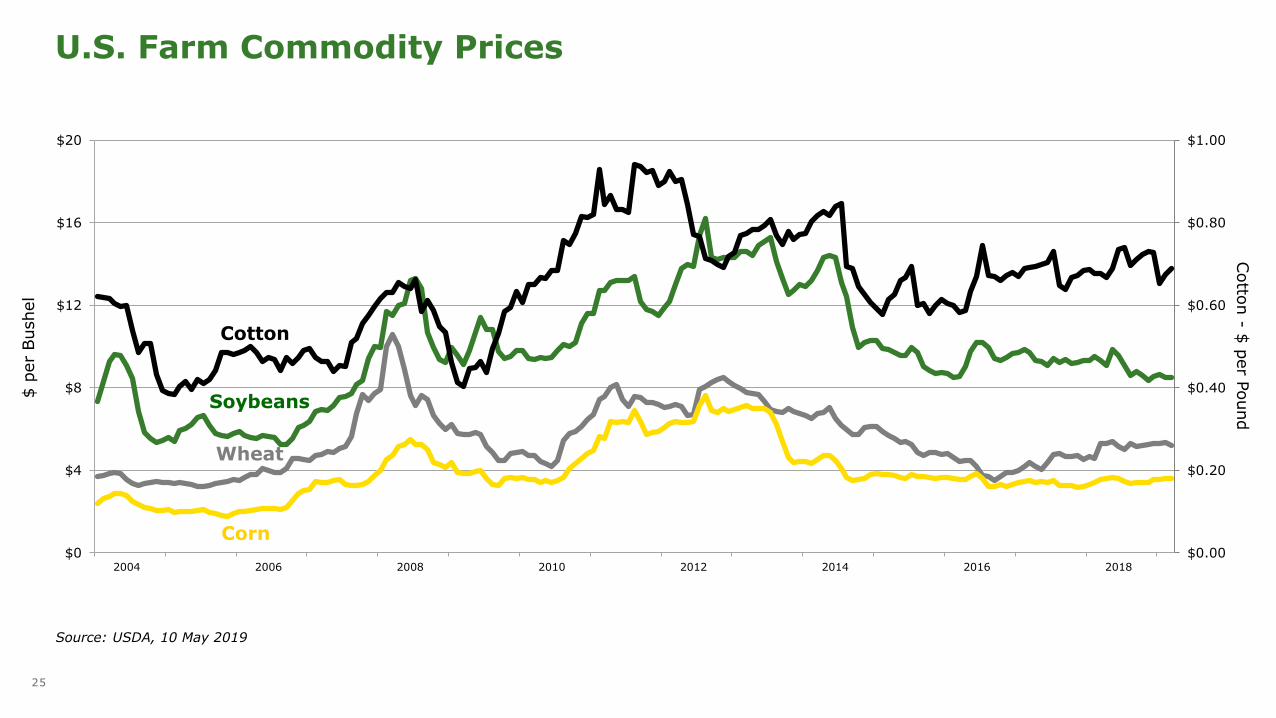
25
$0.00
$0.20
$0.40
$0.60
$0.80
$1.00
$0
$4
$8
$12
$16
$20
2004 2006 2008 2010 2012 2014 2016 2018
Cotto
n -
$ p
er P
ound
$ p
er
Bushel
Cotton
Wheat
Corn
Soybeans
Source: USDA, 10 May 2019
U.S. Farm Commodity Prices
26
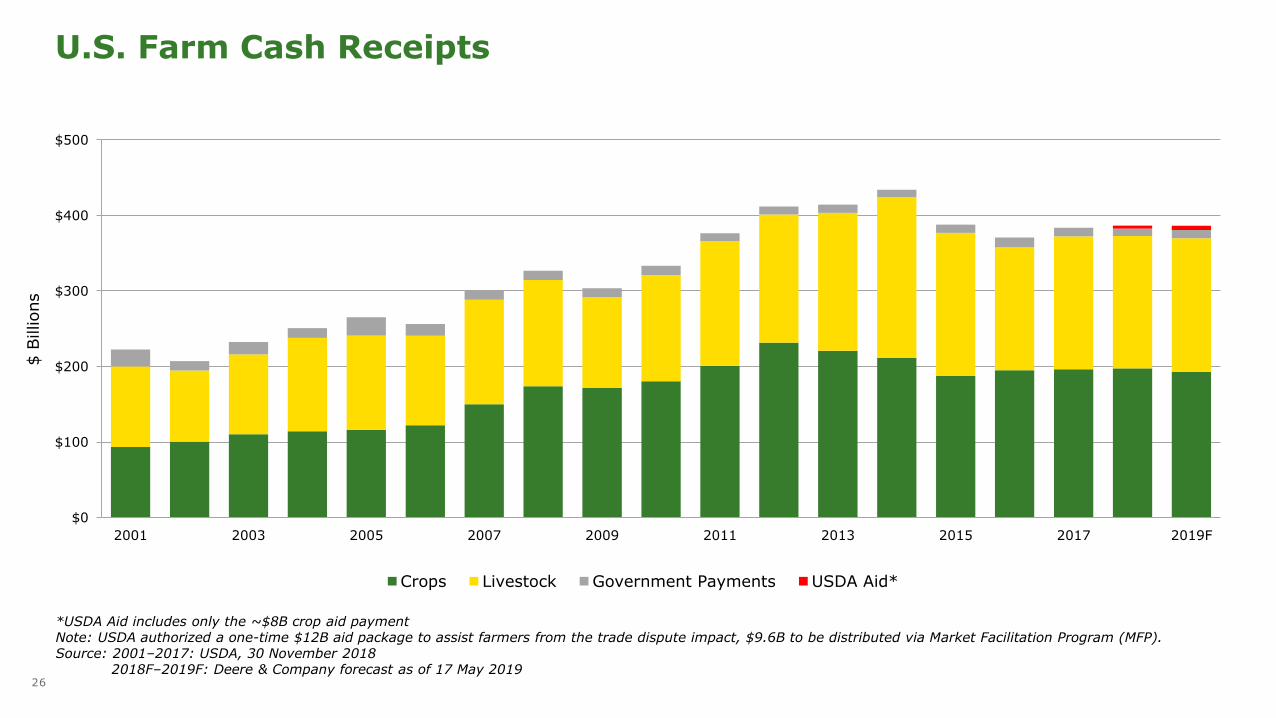
U.S. Farm Cash Receipts
$0
$100
$200
$300
$400
$500
2001 2003 2005 2007 2009 2011 2013 2015 2017 2019F
$ B
illions
Crops Livestock Government Payments USDA Aid*
*USDA Aid includes only the ~$8B crop aid paymentNote: USDA authorized a one-time $12B aid package to assist farmers from the trade dispute impact, $9.6B to be distributed via Market Facilitation Program (MFP).Source: 2001–2017: USDA, 30 November 2018
2018F–2019F: Deere & Company forecast as of 17 May 2019
27
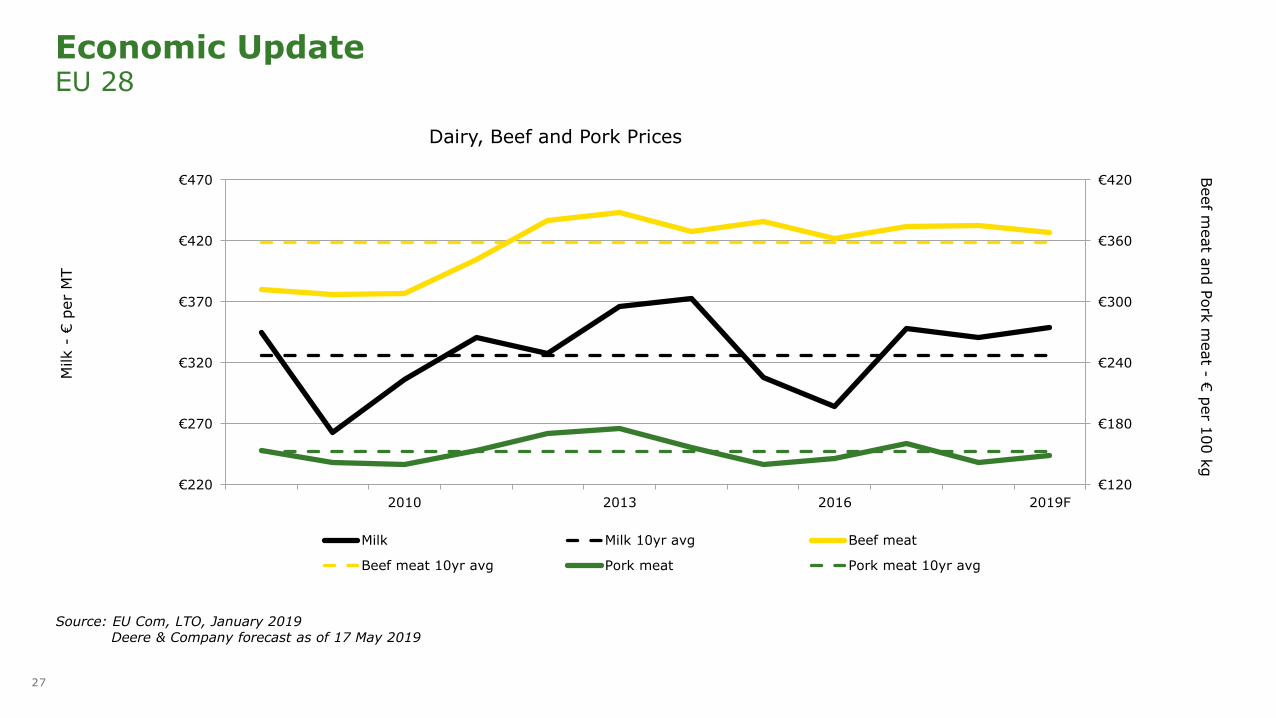
Economic UpdateEU 28
€120
€180
€240
€300
€360
€420
€220
€270
€320
€370
€420
€470
2010 2013 2016 2019F
Beef m
eat a
nd P
ork
meat -
€ p
er 1
00 k
gM
ilk -
€ p
er
MT
Dairy, Beef and Pork Prices
Milk Milk 10yr avg Beef meat
Beef meat 10yr avg Pork meat Pork meat 10yr avg
Source: EU Com, LTO, January 2019Deere & Company forecast as of 17 May 2019
28
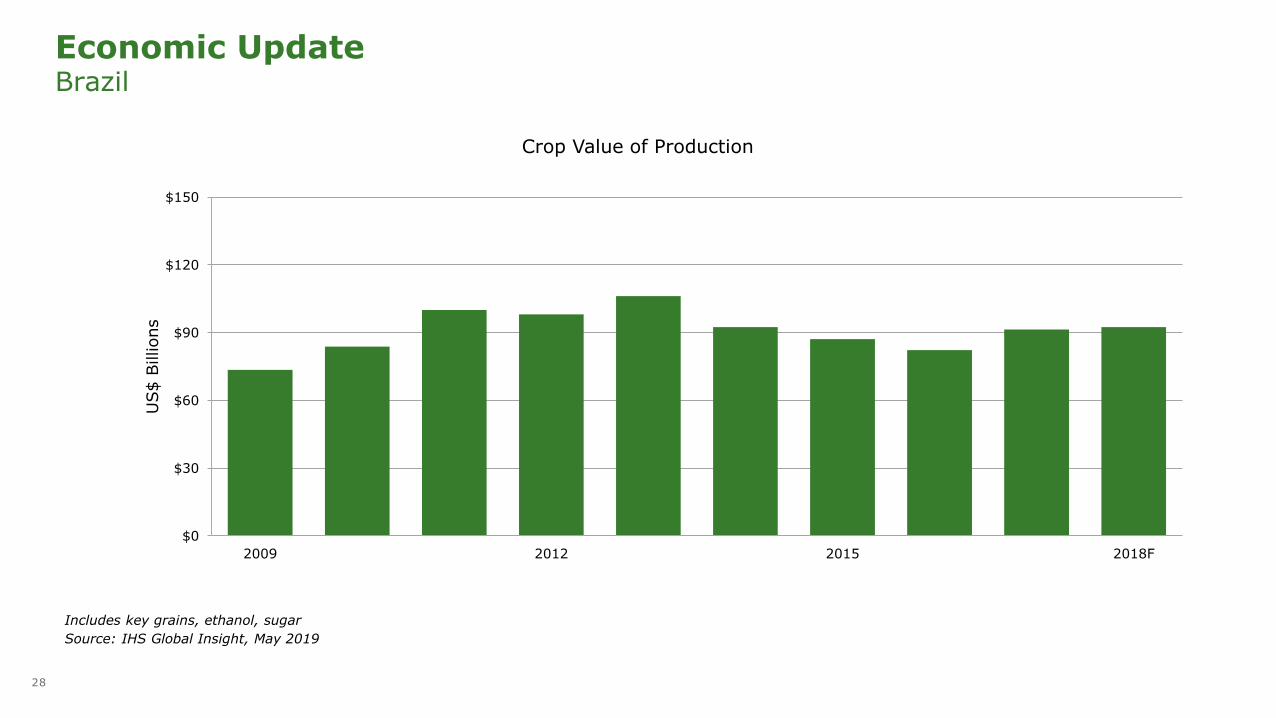
Economic UpdateBrazil
$0
$30
$60
$90
$120
$150
2009 2012 2015 2018F
US$ B
illions
Crop Value of Production
Includes key grains, ethanol, sugar
Source: IHS Global Insight, May 2019
29
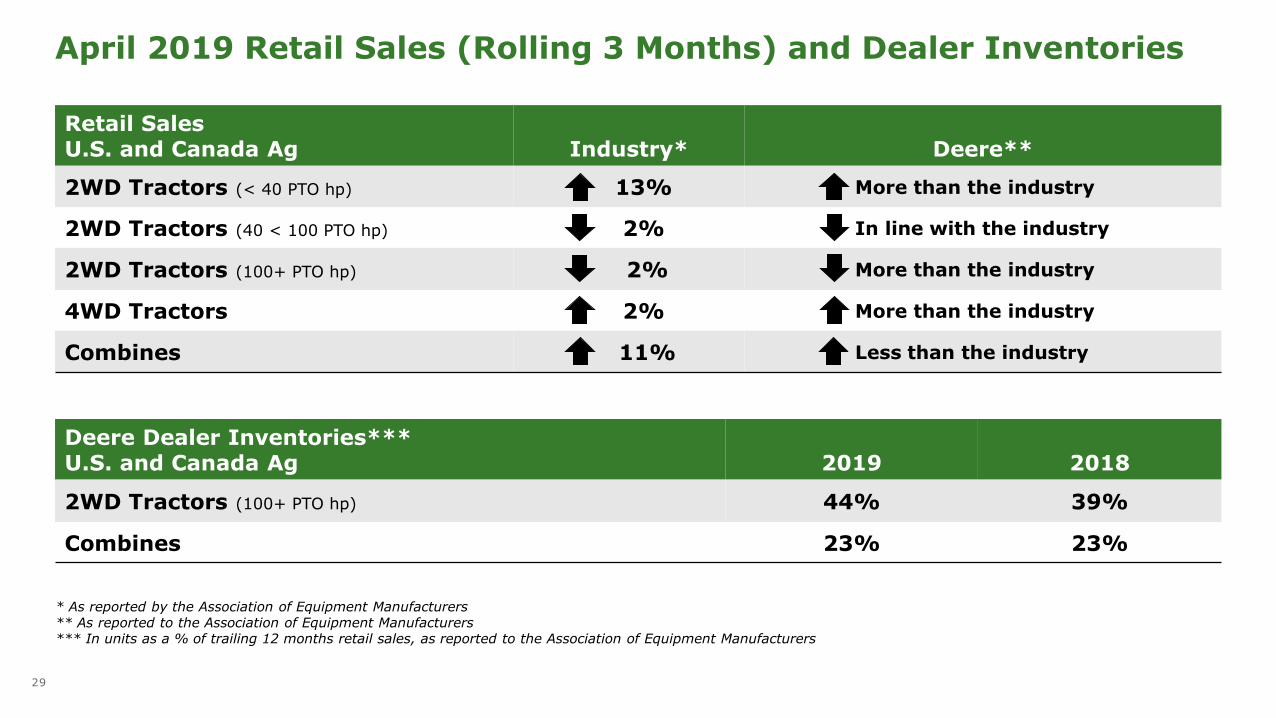
April 2019 Retail Sales (Rolling 3 Months) and Dealer Inventories
Retail SalesU.S. and Canada Ag Industry* Deere**
2WD Tractors (< 40 PTO hp) 13% More than the industry
2WD Tractors (40 < 100 PTO hp) 2% In line with the industry
2WD Tractors (100+ PTO hp) 2% More than the industry
4WD Tractors 2% More than the industry
Combines 11% Less than the industry
Deere Dealer Inventories***U.S. and Canada Ag 2019 2018
2WD Tractors (100+ PTO hp) 44% 39%
Combines 23% 23%
* As reported by the Association of Equipment Manufacturers** As reported to the Association of Equipment Manufacturers*** In units as a % of trailing 12 months retail sales, as reported to the Association of Equipment Manufacturers
30
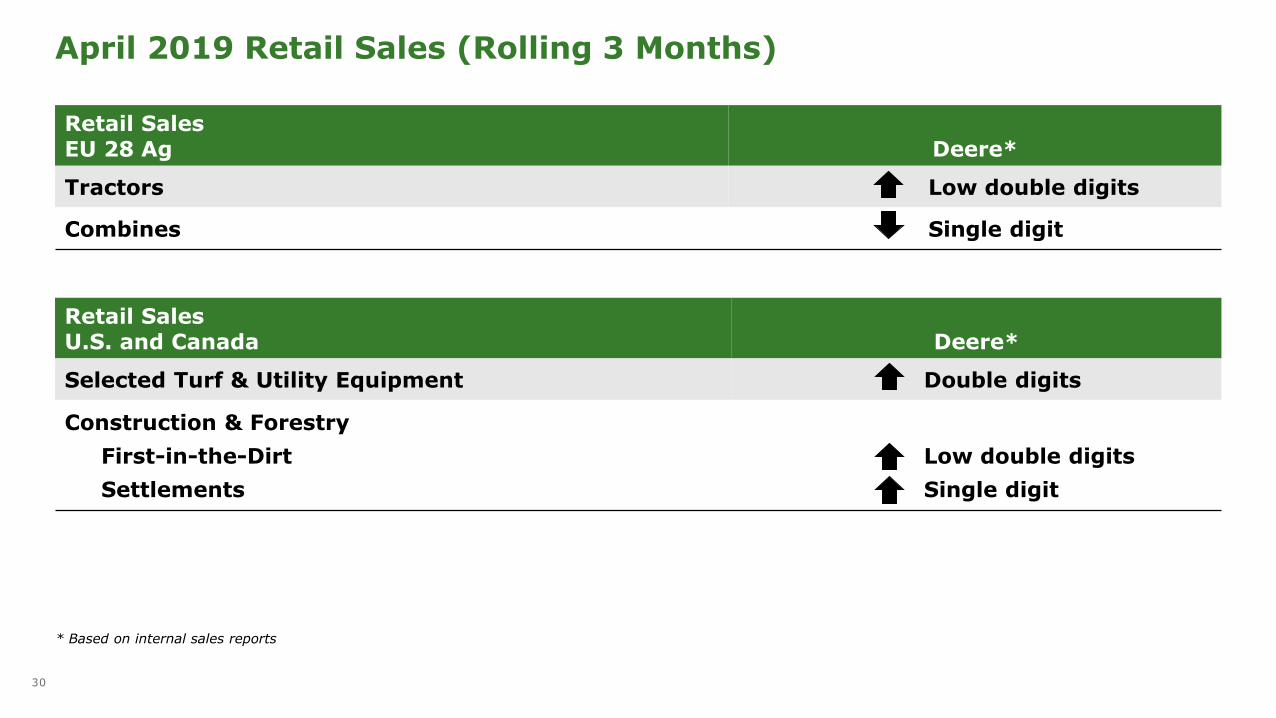
Retail SalesU.S. and Canada Deere*
Selected Turf & Utility Equipment Double digits
Construction & Forestry
First-in-the-Dirt
Settlements
Low double digits
Single digit
April 2019 Retail Sales (Rolling 3 Months)
Retail SalesEU 28 Ag Deere*
Tractors Low double digits
Combines Single digit
* Based on internal sales reports
31
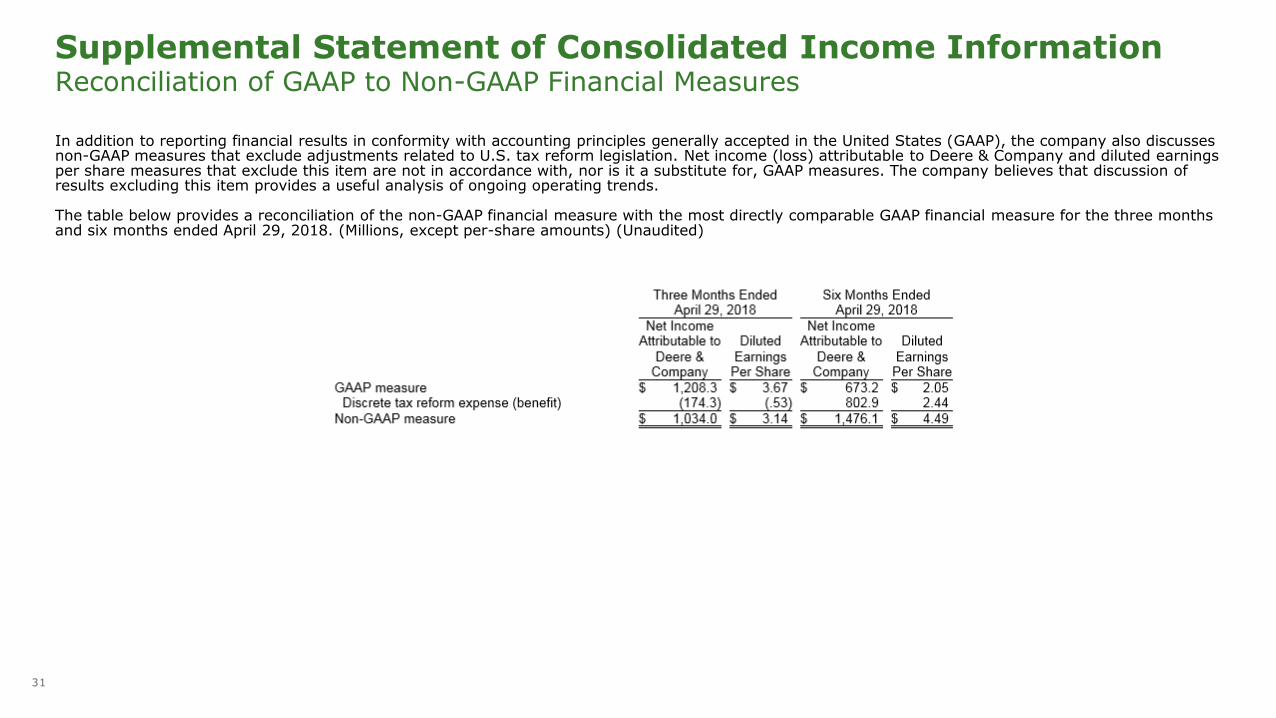
Supplemental Statement of Consolidated Income Information Reconciliation of GAAP to Non-GAAP Financial Measures
In addition to reporting financial results in conformity with accounting principles generally accepted in the United States (GAAP), the company also discusses non-GAAP measures that exclude adjustments related to U.S. tax reform legislation. Net income (loss) attributable to Deere & Company and diluted earnings per share measures that exclude this item are not in accordance with, nor is it a substitute for, GAAP measures. The company believes that discussion of results excluding this item provides a useful analysis of ongoing operating trends.
The table below provides a reconciliation of the non-GAAP financial measure with the most directly comparable GAAP financial measure for the three months and six months ended April 29, 2018. (Millions, except per-share amounts) (Unaudited)

Deere & Company’s 3Q 2019 earnings call is scheduled for 9:00 a.m. central time on Friday, 16 August 2019


