18
2Q'17 Earnings Release LG Electronics July 27, 2017

2Q'17 Earnings Release
LG Electronics
July 27, 2017

All information regarding management performance and financial results of LG Electronics (the “Company”) during
the 2nd quarter of 2017 as contained herein has been prepared on a consolidated basis in accordance with International Financial Reporting
Standards (“IFRS”).
The information regarding results of 2nd quarter of 2017 has been prepared in advance, prior to being reviewed by outside auditors, solely for the
convenience of investors of the Company, and is subject to change in the process of final review by external auditors.
The information contained herein includes forward-looking statements in respect to future plans, prospects, and performances of the Company
as well as the Company’s projected sales plan for the 3rd quarter of 2017.
These forward-looking statements also refer to the Company’s performance on consolidated base, as indicated.
The aforementioned forward-looking statements are influenced by changes in the management environment and relative events, and by their nature,
these statements refer to uncertain circumstances. Consequently, due to these uncertainties, the Company’s actual future results may differ
materially from those expressed or implied by such statements.
Please note that as the forward-looking statements contained herein are based on the current market situation and the Company’s management
direction, they are subject to change according to the changes in future market environment
and business strategy.
The information contained herein should not be utilized for any legal purposes in regards to investors’ investment results. The Company hereby
expressly disclaims any and all liability for any loss or damage resulting from the investors’ reliance on the information contained herein.

Table of Contents
Consolidated Earnings and Outlook Ⅰ
Performance and Outlook by Division Ⅱ

Ⅰ Consolidated Earnings and Outlook

Consolidated Earnings and Outlook
1
Operating
Income
(%)
Sales / Profits
(Unit : KRW tn)
Performance by Division
(Unit : KRW bn)
*1) Including LG Innotek
1Q’17 QoQ 2Q’17 YoY 2Q’16
Consolidated*1)
Sales 14,657.2 -0.7% 14,551.4 3.9% 14,002.9
O.I 921.5 -257.4 664.1 79.5 584.6
(%) 6.3% -1.7%p 4.6% 0.4%p 4.2%
H&A
Home Appliance
& Air Solution
Sales 4,638.7 13.2% 5,251.8 11.7% 4,700.2
O.I 520.8 -55.1 465.7 32.0 433.7
(%) 11.2% -2.3%p 8.9% -0.3%p 9.2%
HE
Home Entertainment
Sales 4,326.1 -2.1% 4,234.9 1.9% 4,157.2
O.I 382.2 -39.2 343.0 -13.7 356.7
(%) 8.8% -0.7%p 8.1% -0.5%p 8.6%
MC*2)
Mobile Communications
Sales 3,091.7 -12.6% 2,701.4 -21.0% 3,421.2
O.I 3.7 -136.1 -132.4 7.1 -139.5
(%) 0.1% -5.0%p -4.9% -0.8%p -4.1%
VC
Vehicle Components
Sales 876.4 0.7% 882.6 38.0% 639.6
O.I -14.5 -1.9 -16.4 0.4 -16.8
(%) -1.7% -0.2%p -1.9% 0.7%p -2.6%
Sales / Profits
6.3% 4.6%
4.2%
Sales
QoQ
-0.7%↓ YoY
3.9%↑ 14.66 14.55
14.00
1Q’17 2Q’17 2Q’16 *2) The companion device department(Innovative Personal Device)
has been restated to MC division from others
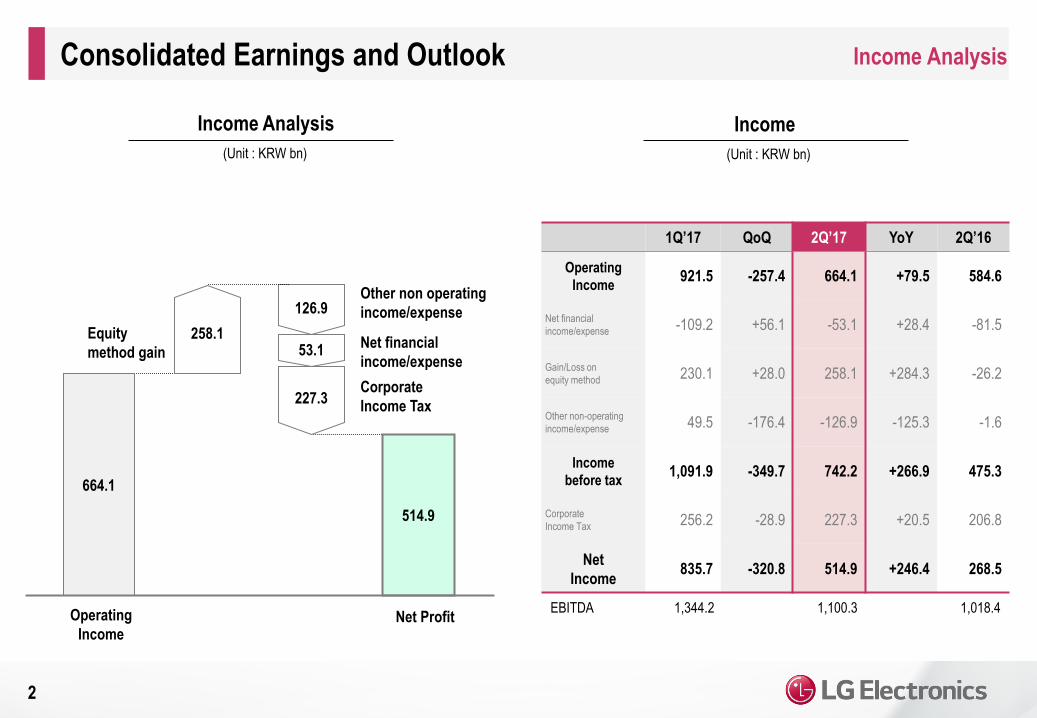
1Q’17 QoQ 2Q’17 YoY 2Q’16
Operating
Income 921.5 -257.4 664.1 +79.5 584.6
Net financial
income/expense -109.2 +56.1 -53.1 +28.4 -81.5
Gain/Loss on
equity method 230.1 +28.0 258.1 +284.3 -26.2
Other non-operating
income/expense 49.5 -176.4 -126.9 -125.3 -1.6
Income
before tax 1,091.9 -349.7 742.2 +266.9 475.3
Corporate
Income Tax 256.2 -28.9 227.3 +20.5 206.8
Net
Income 835.7 -320.8 514.9 +246.4 268.5
Income Analysis Consolidated Earnings and Outlook
EBITDA
2
(Unit : KRW bn) (Unit : KRW bn)
Income Income Analysis
514.9
664.1
Net financial
income/expense
Operating
Income Net Profit
126.9
Corporate
Income Tax 227.3
258.1 Equity
method gain
Other non operating
income/expense
53.1
1,100.3 1,018.4 1,344.2

1Q’16 2Q’17
Cash at the beginning of period 3,015.1 3,031.9
• Cash flow from operating activities 795.0 936.3
Net income/loss 835.7 514.9
Depreciation 422.7 436.2
Gain/Loss on equity method investment -230.1 -258.1
Changes in working capital 64.8 -598.4
Others -298.1 841.7
• Cash flow from investing activities -750.8 -597.5
Increase in tangible assets -609.8 -427.9
Increase in intangible assets -138.0 -168.1
• Cash flow from financing activities 74.3 163.0
Dividend paid, etc -0.2 -90.4
Increase/Decrease in debt 74.5 253.4
• Effects of exchange rate changes
on cash and cash equivalents -101.7 70.7
Net changes in cash 16.8 572.5
Cash at the end of period 3,031.9 3,604.4
Cash Flow Consolidated Earnings and Outlook
Cash Flow
3
*1) Net Cash Flow: Excluding Cash flow from financing activities
*2) Others: Increase/decrease of Deferred Income Tax Asset/Liabilities and other Asset/Liabilities
(Unit : KRW bn)
Net Cash Flow*1)
(Unit : KRW bn)
Net C/F
Cash Out Cash In
Net Profit
436.2 Depreciation
Working capital
70.7 Effects of exchange
rate changes
409.5
514.9
598.4
258.1 Equity
method gain
841.7 Others *2)
597.5 Cash flow from
investing activities

4Q’16 1Q’17 2Q’17
Assets 37.86 38.12 39.34
Current Assets 16.99 17.47 18.28
Cash 3.02 3.03 3.60
Inventory 5.17 5.39 5.62
Non-Current Assets 20.87 20.65 21.06
Liabilities 24.50 24.43 24.93
Current Liabilities 15.74 16.15 15.97
Non-Current Liabilities 8.76 8.28 8.96
Equity 13.36 13.69 14.41
Financial Position Leverage Ratio
Leverage Ratio / Financial Position
4
Consolidated Earnings and Outlook
Debt
Net Debt
8.66
5.64
8.63
5.60
2Q’17
8.96
5.36
(Unit: %)
4Q’16 1Q’17
Liabilities
to Equity
Debt to
Equity
Net Debt to
Equity
(Unit : KRW tn)
183 178
173
65
63 62
42 41
37

5
3Q’17 Outlook
Business
Environment
Sales & Profits
Outlook
Key
Strategies
Consolidated Earnings and Outlook
3Q’17 sales increase by high-single digit YoY, operating income increase YoY
LGE : Raise premium brand power by global launching best products and run profitable business
by speeding up B2B business
H&A : Strengthen sales growth through expansion of new product sales and keep stable profitability
HE : Improve premium TV sales through proactive marketing activities
MC : Increase sales of premium models and continue to reduce cost through fundamental enhancement
VC : Expand electric vehicle component business based on successful launch of GM BOLT
Trade conflict risk caused by U.S. trade protectionism
Concern on interest rate increase and exchange rate volatility

Performance and Outlook by Division Ⅱ

Performance
6
Performance and Outlook by Division
(Unit: %, KRW tn)
Key Products
H&A (Home Appliance and Air Solution)
Dryer InstaView DID Stand Type A/C
Op. Margin
Sales
2Q’17 Performance
3Q’17 Outlook
9.2% 8.0%
3.7%
11.2%
8.9%
2Q’17 2Q’16 3Q’16 4Q’16 1Q’17
4.70 4.27 4.04
4.64
5.25
KRW 5.3 trillion, up 12% YoY based on strong sales in Korea mainly on
air conditioner & washing machine and solid earnings in North America
- Domestic :
Continued strong margin by better mix from new model launches and
solid sales while raw material price and marketing expense increased
- Overseas :
Up 43% YoY from air conditioner sales growth by strong demand due to
hot weather, technology improvement and strong sales of air purifier and dryer
Up 4% YoY from continuous growth in main markets (North America and Europe),
while developing markets (Middle East and Asia) recorded slight down YoY
from low oil price and weak currency
Strong demand in North America, Europe and Asia from recovering global economy
Maintain strong margin by improving cost management and focusing on premium
product sales such as InstaView refrigerator and TWINWash washing machine
despite of weak seasonality
Sales :
Profitability :
LGE :
Market :
- Domestic :
- Overseas :
Continuous increase in air purifier and dryer demand
Currency fluctuation risk

7
HE (Home Entertainment)
LG All-day Gram PC LG SIGNATURE OLED TV W
Performance and Outlook by Division
Key Products
Performance
Op. Margin
Sales
(Unit: %, KRW tn) 2Q’17 Performance
3Q’17 Outlook
2Q’16 3Q’16 4Q’16 1Q’17
4.16 4.14
4.79
4.33
Sales :
Profitability :
LGE :
Market :
8.6% 9.2%
3.4%
8.8% 8.1%
4.23
2Q’17
Even with continuous decline in TV market demand,
up YoY from strong sales of OLED TV and premium product sales
- Sales to grow QoQ and YoY from peak season & premium TV marketing
- Keep solid margin by focusing on premium sales
Despite weak market development risk from interest rate increase and oil price drop,
premium market is expected to grow continuously
Although margin recorded down QoQ and YoY from rising
panel price and marketing activities from new product launch,
margin stayed strong by solid premium TV sales and cost management

8
MC (Mobile Communications)
2Q’17 Performance
Performance and Outlook by Division
Key Products
Performance
Op. Margin
Sales
(Unit: %, KRW tn)
2Q’16 3Q’16 4Q’16 1Q’17
3.42
2.60 2.98 3.09
3Q’17 Outlook
Sales :
LGE :
Market :
Profitability :
-4.1%
-16.4% -15.4%
0.1%
-4.9%
2.70
2Q’17
G6+ X500 Q6
Down 13% QoQ and 21% YoY from weak sales of premium models and
raw material price increase
- Smartphone shipment recorded 13.3mn units (-10% QoQ, -4% YoY)
- North America market recorded down 12% QoQ from weak sales of premium models
but up 13% YoY from strong sales of low end models
- Europe and Asia markets recorded up 10%, 8% QoQ from better line up and business structure
Continued intense market share competition from new product launches
by competitors and price competition in low end markets
Down QoQ from marketing expense increase from
global launching of G6 and rise in raw material cost
- Expand sales by successfully launching the successor model of V20
and Q6 which inherits the design and function of G6.
Also enhance G6 model lineup such as “+”
- Improve profitability by managing costs and pursuing platform/modular design
*1) The companion device department(Innovative Personal Device)
has been restated to MC division from others
*1)

9
VC (Vehicle Components) Performance and Outlook by Division
Key Products
Performance
Op. Margin
Sales
(Unit: %, KRW tn) 2Q’17 Performance
3Q’17 Outlook
2Q’16 3Q’16 4Q’16 1Q’17
0.64 0.67
0.87 0.88
Sales :
Profitability :
LGE :
Market :
-2.6% -2.4%
-1.7% -1.7% -1.9%
0.88
2Q’17
• AV/AVN
• Telematics
• CID
• Traction motor
• Inverter
• Battery Pack
• ADAS Camera
• LCD Cluster
• Automotive lamp
Infotainment EV Solution Security & Safety
Up 38% YoY from infotainment business including AV/AVN, telematics
and solid sales of electric vehicle components for GM BOLT
- Preoccupy the infotainment market demand by securing future technology
- Expand electric vehicle component business by leveraging
GM BOLT project as a reference
- Electric vehicle components market will grow in 2H 2017 as competitive
electric vehicles are expected to be launched mainly in U.S and Europe
- Smart vehicle component market is expanding driven by
the application of autonomous and connectivity technology
Continued loss from ongoing investments in new business area
such as ADAS camera, LCD cluster and automotive lamps
- Infotainment: Sales increase from main customers involving future products and new customers
- Electric vehicle components: Strong sales of parts from GM BOLT sales increase

http://www.lg.com/global

Appendix
10
Summarized Financial Statements (Consolidated)
Income Statement
*) Since these statements have not yet been reviewed by an independent auditor, the contents can be changed if the auditor raises an issue during the review process
(Unit: KRW bn, %)
Update 예정
2016 2017
1Q 2Q 3Q 4Q Total 1Q 2Q
Sales 13,362.1 100.0% 14,002.9 100.0% 13,224.3 100.0% 14,777.7 100.0% 55,367.0 100.0% 14,657.2 100.0% 14,551.4 100.0%
Cost of goods sold 10,038.4 75.1% 10,236.4 73.1% 9,915.4 75.0% 11,440.1 77.4% 41,630.3 75.2% 10,963.0 74.8% 10,830.0 74.4%
Gross profit 3,323.7 24.9% 3,766.5 26.9% 3,308.9 25.0% 3,337.6 22.6% 13,736.7 24.8% 3,694.2 25.2% 3,721.4 25.6%
Selling & admin expense 2,818.5 21.1% 3,181.9 22.7% 3,025.7 22.9% 3,372.8 22.8% 12,398.9 22.4% 2,772.7 18.9% 3,057.3 21.0%
Operating income (Loss) 505.2 3.8% 584.6 4.2% 283.2 2.1% -35.2 -0.2% 1,337.8 2.4% 921.5 6.3% 664.1 4.6%
Financial income (Expense) -120.9 -0.9% -81.5 -0.6% -106.8 -0.8% -84.3 -0.6% -393.5 -0.7% -109.2 -0.7% -53.1 -0.4%
Gains (loss) on equity method investment -22.3 -0.2% -26.2 -0.2% 19.9 0.2% 297.3 2.0% 268.7 0.5% 230.1 1.6% 258.1 1.8%
Other non operating income (Loss) -80.4 -0.6% -1.6 0.0% -148.4 -1.1% -260.9 -1.8% -491.3 -0.9% 49.5 0.3% -126.9 -0.9%
Net income before tax 281.6 2.1% 475.3 3.4% 47.9 0.4% -83.1 -0.6% 721.7 1.3% 1,091.9 7.4% 742.2 5.1%
Corporate Income Tax 83.5 0.6% 206.8 1.5% 129.4 1.0% 175.7 1.2% 595.4 1.1% 256.2 1.7% 227.3 1.6%
Net income 198.1 1.5% 268.5 1.9% -81.5 -0.6% -258.8 -1.8% 126.3 0.2% 835.7 5.7% 514.9 3.5%
Controlled shares 190.6 271.0 -62.0 -322.7 76.9 795.3 497.5
Noncontrolled shares 7.5 -2.5 -19.5 63.9 49.4 40.4 17.4
Appendix
11
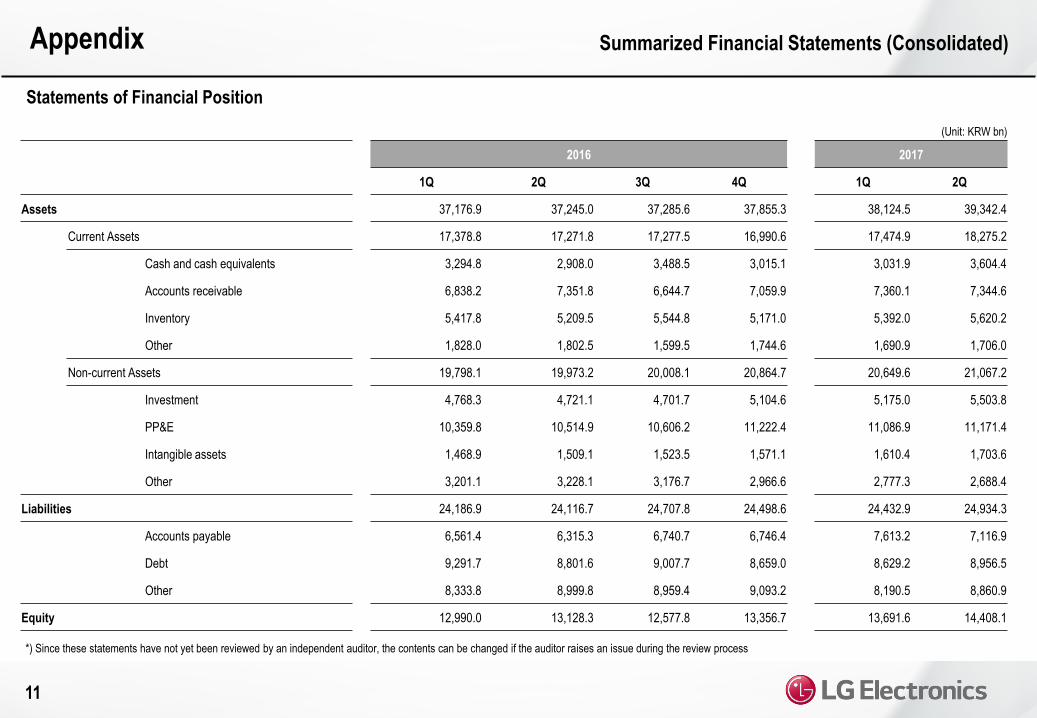
Summarized Financial Statements (Consolidated)
Statements of Financial Position
(Unit: KRW bn)
2016 2017
1Q 2Q 3Q 4Q 1Q 2Q
Assets 37,176.9 37,245.0 37,285.6 37,855.3 38,124.5 39,342.4
Current Assets 17,378.8 17,271.8 17,277.5 16,990.6 17,474.9 18,275.2
Cash and cash equivalents 3,294.8 2,908.0 3,488.5 3,015.1 3,031.9 3,604.4
Accounts receivable 6,838.2 7,351.8 6,644.7 7,059.9 7,360.1 7,344.6
Inventory 5,417.8 5,209.5 5,544.8 5,171.0 5,392.0 5,620.2
Other 1,828.0 1,802.5 1,599.5 1,744.6 1,690.9 1,706.0
Non-current Assets 19,798.1 19,973.2 20,008.1 20,864.7 20,649.6 21,067.2
Investment 4,768.3 4,721.1 4,701.7 5,104.6 5,175.0 5,503.8
PP&E 10,359.8 10,514.9 10,606.2 11,222.4 11,086.9 11,171.4
Intangible assets 1,468.9 1,509.1 1,523.5 1,571.1 1,610.4 1,703.6
Other 3,201.1 3,228.1 3,176.7 2,966.6 2,777.3 2,688.4
Liabilities 24,186.9 24,116.7 24,707.8 24,498.6 24,432.9 24,934.3
Accounts payable 6,561.4 6,315.3 6,740.7 6,746.4 7,613.2 7,116.9
Debt 9,291.7 8,801.6 9,007.7 8,659.0 8,629.2 8,956.5
Other 8,333.8 8,999.8 8,959.4 9,093.2 8,190.5 8,860.9
Equity 12,990.0 13,128.3 12,577.8 13,356.7 13,691.6 14,408.1
*) Since these statements have not yet been reviewed by an independent auditor, the contents can be changed if the auditor raises an issue during the review process

Appendix
12
Sales / Profits by Division (Consolidated)
*) The companion device department(Innovative Personal Device) has been restated to MC division from others
*) Since these statements have not yet been reviewed by an independent auditor, the contents can be changed if the auditor raises an issue during the review process
(Unit: KRW bn)
1Q'16 2Q'16 3Q'16 4Q'16 '16 Total 1Q'17 2Q'17
QoQ YoY
H&A Sales 4,219.5 4,700.2 4,271.2 4,043.3 17,234.2 4,638.7 5,251.8 13% 12%
(Home Appliance & Air Solution) Op. Income 407.8 433.7 342.8 150.1 1,334.4 520.8 465.7
(%) 9.7% 9.2% 8.0% 3.7% 7.7% 11.2% 8.9%
HE Sales 4,333.4 4,157.2 4,141.5 4,793.4 17,425.5 4,326.1 4,234.9 -2% 2%
(Home Entertainment) Op. Income 335.2 356.7 381.5 164.0 1,237.4 382.2 343.0
(%) 7.7% 8.6% 9.2% 3.4% 7.1% 8.8% 8.1%
MC Sales 3,020.6 3,421.2 2,601.4 2,980.7 12,023.9 3,091.7 2,701.4 -13% -21%
(Mobile Communications) Op. Income -193.7 -139.5 -425.6 -459.3 -1,218.1 3.7 -132.4
(%) -6.4% -4.1% -16.4% -15.4% -10.1% 0.1% -4.9%
VC Sales 592.9 639.6 674.9 865.6 2,773.0 876.4 882.6 1% 38%
(Vehicle Components) Op. Income -15.8 -16.8 -16.2 -14.4 -63.2 -14.5 -16.4
(%) -2.7% -2.6% -2.4% -1.7% -2.3% -1.7% -1.9%
Others Sales 336.3 266.8 448.4 337.6 1,389.1 349.0 416.5 19% 56%
Op. Income -28.2 -14.6 -10.5 8.1 -45.2 -35.8 -17.1
LGE Consolidated
Excluding
LG Innotek(①)
Sales 12,502.7 13,185.0 12,137.4 13,020.6 50,845.7 13,281.9 13,487.2 2% 2%
Op. Income 505.3 619.5 272.0 -151.5 1,245.3 856.4 642.8
(%) 4.0% 4.7% 2.2% -1.2% 2.4% 6.4% 4.8%
LG Innotek(②) Sales 1,195.0 1,120.5 1,384.5 2,054.6 5,754.6 1,644.7 1,339.6 -19% 20%
Op. Income 0.4 -34.0 20.6 117.8 104.8 66.8 32.6
LGE-LG Innotek
Inter-company Transaction (③)
Sales 335.6 302.6 297.6 297.5 1,233.3 269.4 275.4 2% -9%
Op. Income 0.5 0.9 9.4 1.5 12.3 1.7 11.3
LGE Consolidated (①+②-③)
Sales 13,362.1 14,002.9 13,224.3 14,777.7 55,367.0 14,657.2 14,551.4 -1% 4%
Op. Income 505.2 584.6 283.2 -35.2 1,337.8 921.5 664.1
(%) 3.8% 4.2% 2.1% -0.2% 2.4% 6.3% 4.6%


