37 Investigating Graphs of Polynomial Functions period 1.notebook 1 November 03, 2014 Bellwork 11-3-14 Identify all the real roots of each equation. 1. x 3 – 7x 2 + 8x + 16 = 0 2. 2x 3 – 14x – 12 = 0
Transcript
37 Investigating Graphs of Polynomial Functions period 1.notebook
1
November 03, 2014
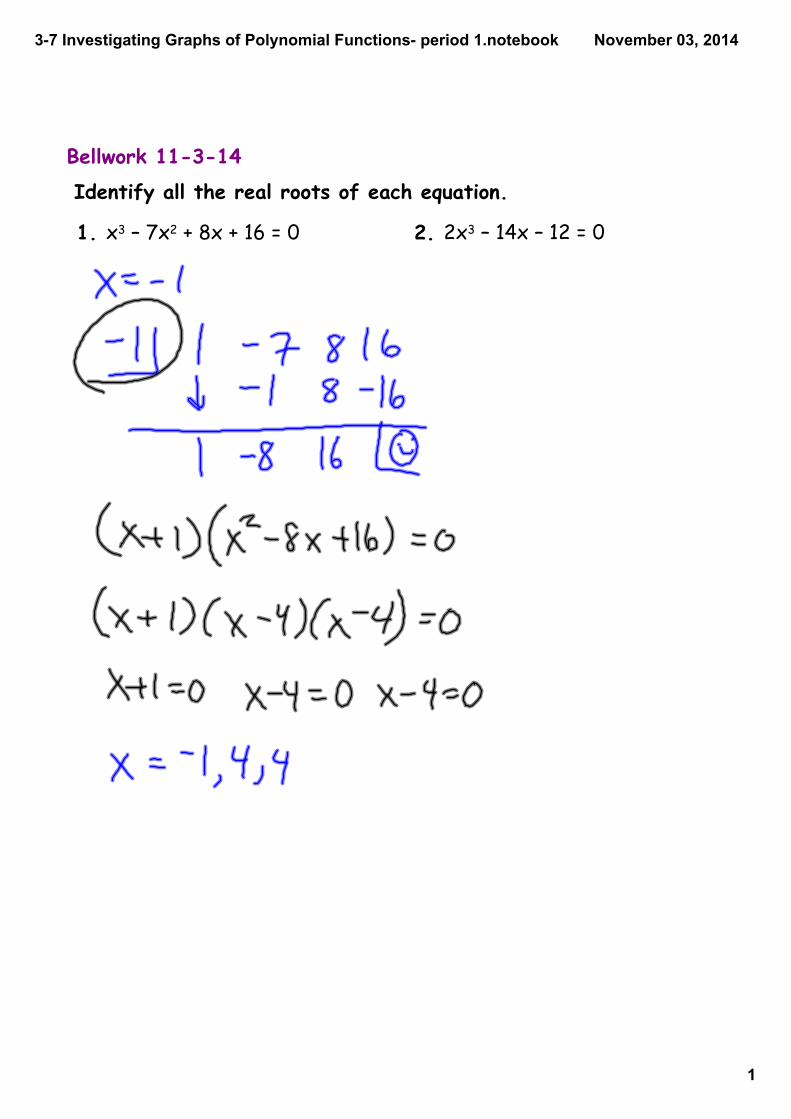
Bellwork 11-3-14
Identify all the real roots of each equation.
1. x3 – 7x2 + 8x + 16 = 0 2. 2x3 – 14x – 12 = 0
37 Investigating Graphs of Polynomial Functions period 1.notebook
2
November 03, 2014
Use properties of end behavior to analyze, describe, and graph polynomial functions.
Identify and use maxima and minima of polynomial functions to solve problems.
Objectives
37 Investigating Graphs of Polynomial Functions period 1.notebook
3
November 03, 2014
end behaviorturning pointlocal maximumlocal minimum
Vocabulary
37 Investigating Graphs of Polynomial Functions period 1.notebook
4
November 03, 2014
Polynomial functions are classified by their degree. The graphs of polynomial functions are classified by the degree of the polynomial. Each graph, based on the degree, has a distinctive shape and characteristics.
37 Investigating Graphs of Polynomial Functions period 1.notebook
5
November 03, 2014
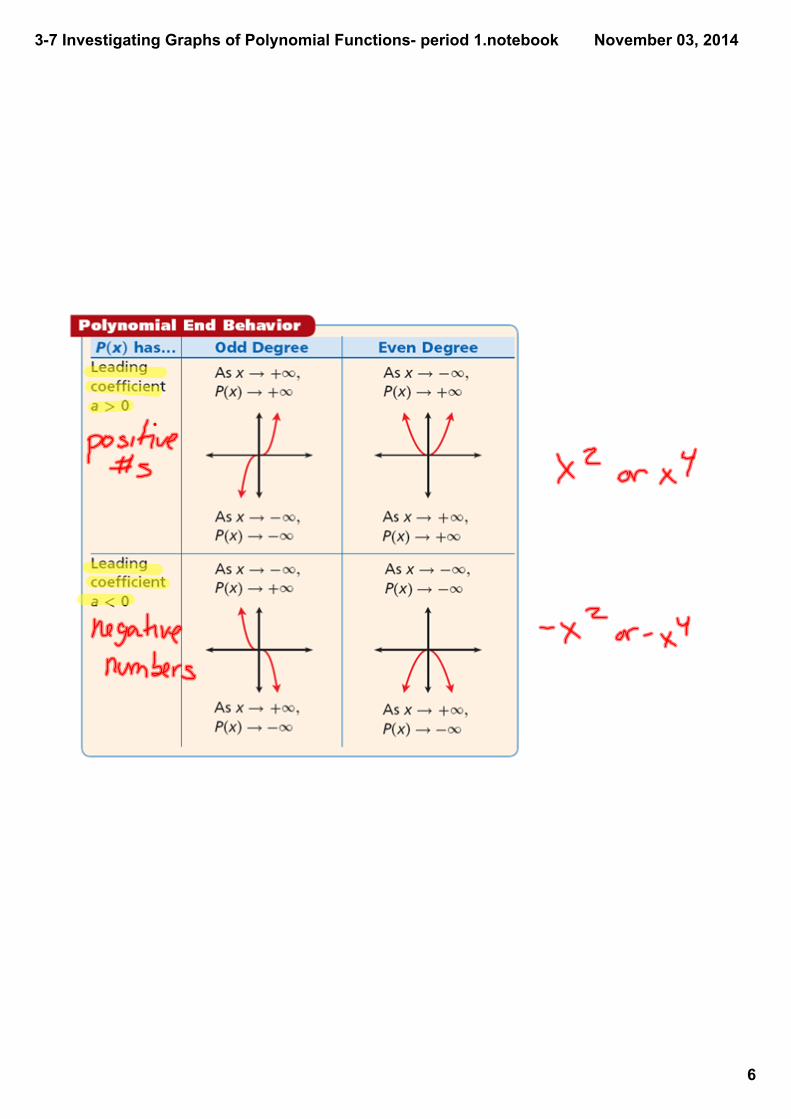
End behavior is a description of the values of the function as x approaches infinity or negative infinity . The degree and leading coefficient of a polynomial function determine its end behavior. It is helpful when you are graphing a polynomial function to know about the end behavior of the function.
37 Investigating Graphs of Polynomial Functions period 1.notebook
6
November 03, 2014
37 Investigating Graphs of Polynomial Functions period 1.notebook
7
November 03, 2014
Identify the leading coefficient, degree, and end behavior.
Example 1: Determining End Behavior of Polynomial Functions
A. Q(x) = –x4 + 6x3 – x + 9 B. P(x) = 2x5 + 6x4 – x + 4
37 Investigating Graphs of Polynomial Functions period 1.notebook
8
November 03, 2014
Check It Out! Example 1 Identify the leading coefficient, degree, and end behavior.
a. P(x) = 2x5 + 3x2 – 4x – 1 b. S(x) = –3x2 + x + 1
37 Investigating Graphs of Polynomial Functions period 1.notebook
9
November 03, 2014
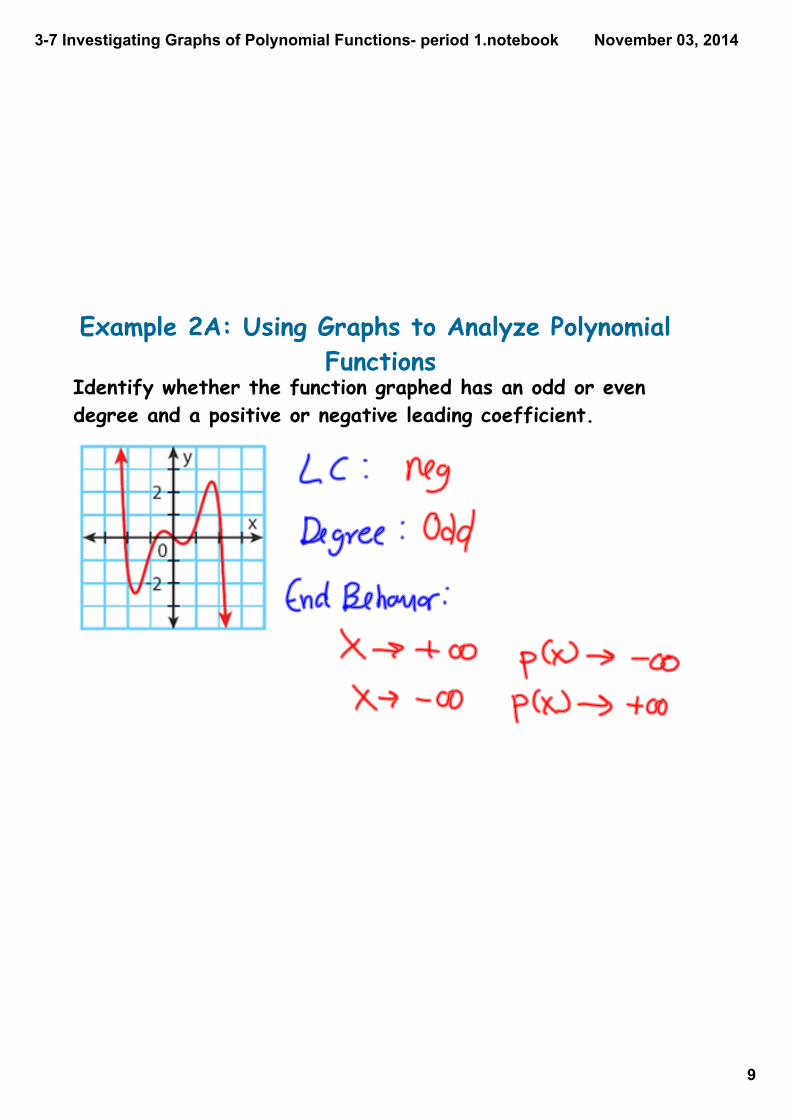
Example 2A: Using Graphs to Analyze Polynomial Functions
Identify whether the function graphed has an odd or even degree and a positive or negative leading coefficient.
37 Investigating Graphs of Polynomial Functions period 1.notebook
10
November 03, 2014
Example 2B: Using Graphs to Analyze Polynomial Functions
Identify whether the function graphed has an odd or even degree and a positive or negative leading coefficient.
37 Investigating Graphs of Polynomial Functions period 1.notebook
11
November 03, 2014
Check It Out! Example 2a Identify whether the function graphed has an odd or even degree and a positive or negative leading coefficient.
37 Investigating Graphs of Polynomial Functions period 1.notebook
12
November 03, 2014
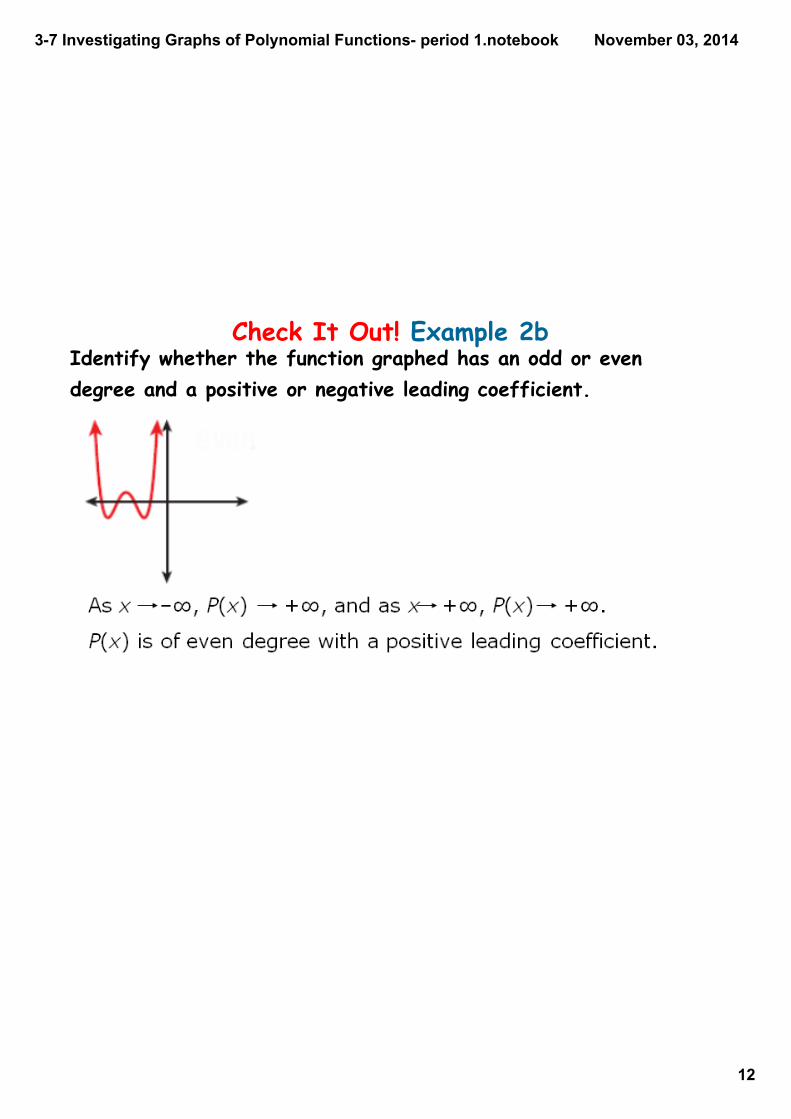
Check It Out! Example 2b Identify whether the function graphed has an odd or even degree and a positive or negative leading coefficient.
37 Investigating Graphs of Polynomial Functions period 1.notebook