Countryside Survey: Scotland Results from 2007 CHAPTER 3 • Enclosed Farmland: Arable and Horticulture and Improved Grassland Broad Habitats 22
Summary
• The area of Arable and Horticulture decreased by 14% across Scotland and by 11% in the Lowlands (EZ4) and 25% in the Intermediate Uplands and Islands (EZ5) between 1998 and 2007.
• The area of Improved Grassland increased by 9% across Scotland between 1998 and 2007.
• Plant species richness in the Arable and Horticulture Broad Habitat remained stable between 1990 and 2007. Plant species richness and plant cover were higher in crop edges than in arable fi elds or managed arable margins in 2007.
• Plant species richness in Improved Grassland decreased by 8% in Scotland between 1998 and 2007.
• pH in soil (0-15cm) increased in the Arable and Horticulture Broad Habitat in Scotland between 1998 and 2007 and in Improved Grassland across the period 1978 to 2007.
• Carbon concentration in soil (0-15cm) decreased between 1998 and 2007 in Arable and Horticulture Broad Habitats but there was no change in Improved Grasslands.
3. Enclosed Farmland: Arable and Horticulture and Improved Grassland Broad Habitats
Countryside Survey: Scotland Results from 2007 CHAPTER 3 • Enclosed Farmland: Arable and Horticulture and Improved Grassland Broad Habitats23
3.1 Introduction1
Enclosed farmland covers 20% of the land area of Scotland, which in Countryside Survey (CS) is comprised of two Broad Habitats, Arable and Horticulture, and Improved Grassland. These Broad Habitats are typically intensively farmed and managed land, with over 72% of their combined extent concentrated on the most nutrient-rich soils in the Lowlands (EZ4) in the east of the country. In these areas farming is as intensive as in comparable areas of England, with the focus on maximum production of crops and animal products. Intensive management of cultivated land generally results in environments with relatively few plant species, in which the less intensively managed (or unmanaged) areas provide an important refuge for plant species. Arable Field Margins, which are a Priority Habitat, and other areas of fallow or set-aside land are important sources of diversity within the Arable and Horticulture Broad Habitat (henceforth Arable Broad Habitat). The presence of linear features (Chapter 5), small patches of other habitat types such as woodland (Chapter 6) and water features (Chapter 8) also contributes to biodiversity in these areas.
The two Broad Habitats covered in this Chapter are among those most susceptible to change in both area and condition over time, because their management is so responsive to the economics of farming, the introduction of new technologies and changes in agricultural policy.
Condition of these habitats is assessed using a range of plot types which has been added to over time largely as a result of the importance of these habitats in England. Main Plots sample the main extent of all Broad Habitats; in enclosed farmland this usually consists of managed fi elds. Targeted Plots sample those fragments of uncultivated or unmanaged land which can provide important wildlife refuges for a range of species that would not otherwise persist in Arable and Improved Grassland Broad Habitats.
Cereal fi eld margins in Arable Broad Habitat were sampled using Crop Edge Plots of 100m x 1m which were recorded within the fi rst metre of crop from the edge of the fi eld in both 1998 and 2007. Additional plots of 2m x 2m were recorded in Arable Broad Habitat for the fi rst time in 2007, to improve understanding of the impacts of incentives for managing fi eld margins through agri-environment schemes. Managed Margin Plots were recorded where a fi eld margin of a minimum width of 6m was present, in those arable fi elds where a Main Plot was located.
3.2 Description of Broad Habitats
The two Broad Habitats covered in this chapter are:
Arable and Horticultural: Vegetation consisting of crops including commercial orchards. The description of this Broad Habitat also encompasses the vegetation types ‘annual/early successional with open ground’ and ‘set-aside’.
Improved Grassland: An extensive Broad Habitat consisting of low botanical quality grassland, with high grazing value. Also includes amenity grassland.
1 Note: For further information on the Broad Habitat classifi cation, sampling plots and other Countryside Survey terminology see Chapter 1, UK Report (Methodology).
� Figure 3.1: Movements of land into and out of Arable and Horticulture between 1998 and 2007.
3.3 Area of Broad Habitats of enclosed farmland
• The area of Arable and Horticulture decreased by 14% across Scotland and by 11% in the Lowlands (EZ4) and 25% in the Intermediate Uplands and Islands (EZ5) between 1998 and 2007.
• The area of Improved Grassland increased by 9% across Scotland between 1998 and 2007.
3.3.1 Change in Area
The Arable Broad Habitat covered approximately 0.5 million hectares (ha) of Scotland in 2007 compared to around 0.6 million ha in 1998 (Table 3.1). There was a 14% decrease across Scotland as a whole and decreases of 11% and 25% respectively in the Lowlands (EZ4) and the Intermediate Uplands and Islands (EZ5). The decline contrasted with relative stability in the extent of this Broad Habitat between 1990 and 1998 across Scotland.
Eighty four percent of land in the Arable Broad Habitat in 2007 was in the same Broad Habitat in 1998 (Figure 3.1).
A signifi cant increase in the extent of Improved Grassland between 1998 and 2007 was detected at the country level. In 2007, Improved Grassland Broad Habitat in Scotland covered an area of approximately 0.9 million ha, a signifi cant increase of 9% from 1998. This increase followed relative stability in extent between
1990 and 1998 (Table 3.2), although increases between 1990 and 2007 are signifi cant both across Scotland as a whole and in the Intermediate Uplands and Islands (EZ5).
A large part (78%) of the Improved Grassland Broad Habitat in 2007 was recorded as the same Broad Habitat in 1998 (Figure 3.2).
� Table 3.1: The estimated area (‘000s ha) and percentage of land area of Arable and Horticulture Broad Habitat in Scotland and in each Environmental Zone in Scotland from 1990 to 2007 are shown. Arrows denote signifi cant change (p<0.05) in the direction shown.
Countryside Survey: Scotland Results from 2007 CHAPTER 3 • Enclosed Farmland: Arable and Horticulture and Improved Grassland Broad Habitats25
3.4 The condition of the Broad Habitats of enclosed farmland
3.4.1 Arable and Horticulture Broad Habitat
• Plant species richness in Arable and Horticulture Broad Habitat has remained stable between 1990 and 2007.
• Plant species richness and plant cover were higher in crop edges than in arable fi elds or managed arable margins in 2007.
Main Plots: The number of plant species found in Main Plots within Arable Broad Habitat has changed little since 1990 (Table 3.3). Similarly, there was little change in the Farmland Bird Food Plants and Butterfl y larvae Food Plants counts in this period. Competitive species increased at the expense of more ruderal species both across Scotland and in the Intermediate Uplands and Islands (EZ5), which contains a relatively small percentage of this Broad Habitat. The Fertility Score decreased slightly both across Scotland and in EZ5. Decreases in species associated with fertile conditions are generally aligned with a loss of competitive species, so it is likely that these changes (whilst statistically signifi cant) are not of ecological importance. The number of stress tolerant species has increased in the Intermediate Uplands and Islands (EZ5) since 1990.
Targeted Plots: No changes were detected in the condition of the Targeted Plots in the Arable Broad Habitat in Scotland either between 1998 and 2007 or across the period 1990 to 2007.
� Table 3.2: The estimated area (‘000s ha) and percentage of land area of Improved Grassland Broad Habitat in Scotland and in each Environmental Zone in Scotland from 1990 to 2007 are shown. Where present, arrows denote signifi cant change (p<0.05) in the direction shown.
Countryside Survey: Scotland Results from 2007 CHAPTER 3 • Enclosed Farmland: Arable and Horticulture and Improved Grassland Broad Habitats 26
Arable fi eld margins: An average of 15 species per 1m x 100m plot was recorded and no change was detected in plots in Scotland between 1998 and 2007.
Managed Margins: A total of 12 such plots were recorded in Scotland, all of which were in the Lowlands (EZ4) except one in the Intermediate Uplands and Islands (EZ5). On average nine plant species were found in each Managed Margin Plot.
The Managed Margin Plots, Main Plots and Crop Edge Plots are of diff erent sizes but all have a central 2m x 2m core that can be compared (Table 3.4). This comparison shows that the Crop Edge Plots had the highest plant Species Richness Score whereas Main Plots had the lowest plant Species Richness Score and the highest percentage cover.
3.4.2 Improved Grassland Broad Habitat
• Plant species richness in Improved Grassland decreased by 8% in Scotland between 1998 and 2007.
Main plots: The plant Species Richness Score in the Improved Grassland Broad Habitat decreased from 14.4 to 13.2 in Scotland between 1998 and 2007 (Table 3.5). This 8% decrease is not signifi cant across the period 1990 to 2007 due to a marginal increase between 1990 and 1998. The Species Richness Score
decreased in this Broad Habitat in the Intermediate Uplands and Islands (EZ5) between 1998 and 2007. The Species Richness Score of plots in the Lowlands (12.0) was markedly diff erent to that of those in the Intermediate Uplands and Islands (16.0).
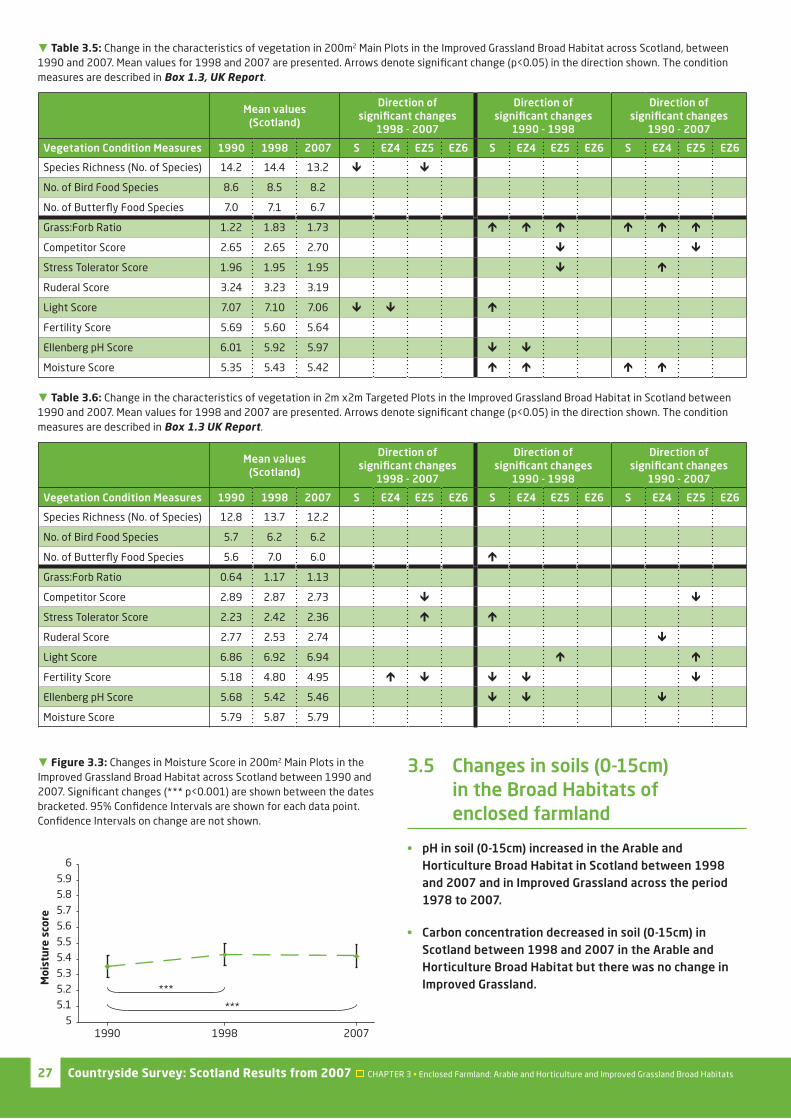
Other changes in this plot type included a signifi cant but very marginal decrease in the proportion of species associated with non-shaded conditions between 1998 and 2007. Changes in vegetation across the period 1990 to 2007 were more consistent with the period 1990 to 1998 than that from 1998 to 2007 (Table 3.5). Increases in the Grass:Forb ratio and the proportion of species associated with wetter conditions were signifi cant both for Scotland and the Lowlands (EZ4) (Fig. 3.3).
Targeted plots: Little change in vegetation condition in Targeted Plots in Improved Grassland was detected for Scotland either between 1998 and 2007 or across the period 1990 to 2007 (Table 3.6). A number of changes in condition in the Environmental Zones were evident both between 1998 and 2007 and across the period 1990 to 2007. These included a decrease in competitive species and species associated with fertile conditions in the Intermediate Uplands and Islands.
� Table 3.4: A comparison of the 2m x 2m core of Main Plots, the core of Crop Edge Plots, and Managed Margin Plots in the Arable and Horticulture Broad Habitat. The mean cover of plants includes crops.
2007 2m x 2m core of Main Plots
2007 Crop Edge
Plots
2007 Managed
Margin Plots
Species Richness 4.9 8.9 8.6
Mean Cover (%) 25.7 18 19.5
� Table 3.3: Change in the characteristics of vegetation in 200m2 Main Plots in the Arable and Horticulture Broad Habitat across Scotland between 1990 and 2007. Mean values for condition measures in 1998 and 2007 are presented. Arrows denote signifi cant change (p<0.05) in the direction shown. The condition measures are described in Box 1.3, UK Report.
Mean values (Scotland)
Direction of signifi cant changes
1998 - 2007
Direction of signifi cant changes
1990 - 1998
Direction of signifi cant changes
1990 - 2007
Vegetation Condition Measures 1990 1998 2007 S EZ4 EZ5 EZ6 S EZ4 EZ5 EZ6 S EZ4 EZ5 EZ6
Species Richness (No. of Species) 10.3 9.2 9.6
No. of Bird Food Species 6.1 5.4 5.2
No. of Butterfl y Food Species 3.5 2.8 3.1 ! !Grass:Forb Ratio 1.03 1.27 1.41
Countryside Survey: Scotland Results from 2007 CHAPTER 3 • Enclosed Farmland: Arable and Horticulture and Improved Grassland Broad Habitats27
3.5 Changes in soils (0-15cm) in the Broad Habitats of enclosed farmland
• pH in soil (0-15cm) increased in the Arable and Horticulture Broad Habitat in Scotland between 1998 and 2007 and in Improved Grassland across the period 1978 to 2007.
• Carbon concentration decreased in soil (0-15cm) in Scotland between 1998 and 2007 in the Arable and Horticulture Broad Habitat but there was no change in Improved Grassland.
� Table 3.5: Change in the characteristics of vegetation in 200m2 Main Plots in the Improved Grassland Broad Habitat across Scotland, between 1990 and 2007. Mean values for 1998 and 2007 are presented. Arrows denote signifi cant change (p<0.05) in the direction shown. The condition measures are described in Box 1.3, UK Report.
Mean values (Scotland)
Direction of signifi cant changes
1998 - 2007
Direction of signifi cant changes
1990 - 1998
Direction of signifi cant changes
1990 - 2007
Vegetation Condition Measures 1990 1998 2007 S EZ4 EZ5 EZ6 S EZ4 EZ5 EZ6 S EZ4 EZ5 EZ6
Species Richness (No. of Species) 14.2 14.4 13.2 ! !No. of Bird Food Species 8.6 8.5 8.2
� Table 3.6: Change in the characteristics of vegetation in 2m x2m Targeted Plots in the Improved Grassland Broad Habitat in Scotland between 1990 and 2007. Mean values for 1998 and 2007 are presented. Arrows denote signifi cant change (p<0.05) in the direction shown. The condition measures are described in Box 1.3 UK Report.
Mean values (Scotland)
Direction of signifi cant changes
1998 - 2007
Direction of signifi cant changes
1990 - 1998
Direction of signifi cant changes
1990 - 2007
Vegetation Condition Measures 1990 1998 2007 S EZ4 EZ5 EZ6 S EZ4 EZ5 EZ6 S EZ4 EZ5 EZ6
Species Richness (No. of Species) 12.8 13.7 12.2
No. of Bird Food Species 5.7 6.2 6.2
No. of Butterfl y Food Species 5.6 7.0 6.0 ~Grass:Forb Ratio 0.64 1.17 1.13
� Figure 3.3: Changes in Moisture Score in 200m2 Main Plots in the Improved Grassland Broad Habitat across Scotland between 1990 and 2007. Signifi cant changes (*** p<0.001) are shown between the dates bracketed. 95% Confi dence Intervals are shown for each data point. Confi dence Intervals on change are not shown.
55.15.25.35.45.55.65.75.85.9
6
Moi
stu
re s
core
***
***
1990 1998 2007
Countryside Survey: Scotland Results from 2007 CHAPTER 3 • Enclosed Farmland: Arable and Horticulture and Improved Grassland Broad Habitats 28
3.6 Summary and discussion
3.6.1 Changes in Enclosed Farmland
The Lowlands are particularly important for arable production but also support the majority of intensive livestock production in Scotland. The Intermediate Uplands and Islands support a smaller percentage (13%) of arable production (Arable Broad Habitat) and around 30% of intensive livestock production (Improved Grassland Broad Habitat). Between 1998 and 2007 a decrease in Arable was countered by an increase in the extent of Improved Grassland. Analysis of changes between Broad Habitat types revealed that, as well as conversions between Arable and Improved Grassland, land in these Broad Habitats also converted to and from Neutral Grassland. Results for the Neutral Grassland Broad Habitat are covered in Chapter 4.
Plant Species Richness Scores in Scotland showed little change within any of the three plot types sampling in Arable land between 1990 and 2007. In Main Plots in Improved Grassland, Plant Species Richness Score varied across Environmental Zones in Scotland with plots in the Intermediate Uplands and Islands containing 30% more species than those in the Lowlands. Between 1998 and 2007 there was a small decrease in the Plant Species Richness Score in Main Plots in Improved Grassland Broad Habitat. Changes in Improved Grassland between 1990 and 2007 included a shift towards more grass species and species associated with wetter conditions.
Soils (0-15cm) became less acid in Arable Broad Habitat between 1998 and 2007 and in Improved Grassland across the period 1978 to 2007. No corresponding shift in the composition of vegetation was refl ected in the Ellenberg pH Score except in Targeted Plots in Improved Grassland in the Lowlands (EZ4) between 1990 and 2007. The Carbon concentration of soils (0-15cm) in Arable Broad Habitat decreased across the period 1998 to 2007 after remaining relatively stable between 1978 and 1998. Further analysis of soils is ongoing to enable estimation of nutrient status, contaminant levels, soil biotic diversity and soil function and will be reported in November 2009.
Soil (0-15cm) pH: The mean pH of soils (0-15cm) increased signifi cantly in Arable Broad Habitat in Scotland between 1998 and 2007 (from 5.99 to 6.29). However, between 1978 (mean pH of 6.15) and 2007, there was little overall change. The pH of soils in Improved Grassland did not change between 1998 and 2007 (5.83, 5.94), but there was a signifi cant increase across the period 1978 (5.44) to 2007.
Soil (0-15cm) carbon concentration: Across Scotland, the carbon concentration of soil (0-15cm) decreased in the Arable Broad Habitat between 1998 and 2007 (from 32.3-29.4). No signifi cant change in carbon concentration in Improved Grassland occurred between 1998 and 2007 (58.4, 59.0) or across the period 1978 (58.8) to 2007.
Bulk density and soil (0-15cm) carbon content: The bulk density of soils (0-15cm) in Arable Broad Habitat in Scotland was 1.1 g/cm3, which when combined with soil carbon concentration in the same horizon indicated a soil (0-15cm) carbon content of 47 t/ha. This was the lowest of all Broad Habitats (Table 2.8).
3.5.2 Improved Grassland
Soil (0-15cm) pH: The pH of soils in Improved Grassland did not change between 1998 and 2007 (5.84, 5.95), but there was a signifi cant increase across the period 1978 (5.44) to 2007.
Soil (0-15cm) carbon concentration: No signifi cant change in carbon concentration in Improved Grassland occurred between 1998 and 2007 (11.68g/kg, 11.80g/kg) or across the period 1978 (11.75) to 2007.
Bulk density and soil (0-15cm) carbon content: For Improved Grassland, the bulk density of soil (0-15cm) was 0.9 g/cm3 indicating a soil (0-15cm) carbon content of 64 t/ha, similar to many of the other Broad Habitats (Table 2.8).
Countryside Survey: Scotland Results from 2007 CHAPTER 3 • Enclosed Farmland: Arable and Horticulture and Improved Grassland Broad Habitats29
3.6.2 Discussion
CS gives a broad indication of changes in Arable and Improved Grassland Broad Habitats in Scotland in recent decades. Conversions between Arable and Improved Grassland between 1998 and 2007 can at least in part be explained by rotational land use. Annual Scottish Agricultural Census returns are consistent with the patterns revealed in CS, and show that there have been marked changes in land use within enclosed farmland over the past few decades. The area of land under arable reached a peak in the 1980s at just over a million ha, mainly at the expense of improved grassland. By 2007, there had been a steady decline in arable by around 16%, whilst the area of improved grassland increased accordingly.
These changes can largely be attributed to the economic infl uences of the European Economic Community, following UK entry in 1973. With increased food production a priority, farming intensifi ed, exerting a major infl uence on the agricultural landscape.
Agriculture has a key role to play in maintaining and enhancing biodiversity. Agri-environment schemes were introduced in Scotland in 1987, and have already made substantial contributions to the achievement of UK Biodiversity Action Plan (BAP) targets for certain bird species such as the corncrake. Such schemes aim to encourage farmers to adopt environmentally friendly management practices, and provide support for maintaining and enhancing particular habitats and landscape features. The more outcome-focused approach of the Scotland Rural Development Programme 2007-13 (SRDP; see Chapter 2) off ers fl exibility for achieving environmental benefi ts in the future.
Although there has been little change in plant species richness in Arable since the last survey, the end of compulsory set-aside in 2009 is likely to change this, particularly in more intensively farmed lowlands. Land under set-aside is often similar in plant species richness to arable margins, and more diverse than the area of the main crop. Loss of set-aside may lead to loss of plant diversity in the future, but options to support the creation and maintenance of arable margins and beetle banks are available under the SRDP.
Whilst farming in Scotland is predominantly extensive, enclosed farmland occurs in areas where soils are more fertile and the climate more favourable. The rising global demand for food and importance of national food security may mean that the decrease in Arable seen between 1998 and 2007 is reversed in the future. As well as agricultural productivity, requirements for other land-based ecosystem services such as biodiversity and fl ood management will need to be considered.
As Scotland’s climate changes, the capability of land to support agriculture will also change. Increases in temperature and changes in precipitation patterns are likely to be major infl uences on future arable land use patterns, with the area of prime agricultural land in the south and east likely to increase. If land at higher altitudes becomes more suitable for intensive agriculture, this may exert increased pressure on habitats which are currently under less intensive management. Further analysis of the role of factors such as economics, set-aside and agri-environment schemes are likely to be incorporated into future work on CS including the integrated assessment, due in 2010.
Countryside Survey: Scotland Results from 2007 CHAPTER 3 • Enclosed Farmland: Arable and Horticulture and Improved Grassland Broad Habitats
This document has been design and optimised to be printed as portrait A4 double-sided pages.
When printing from the software application Adobe® Reader®, please use the ‘Fit to paper’ or ‘Shrink to
Printable Area’ options found in the ‘Page Scaling’ drop down menu of the ‘Print’ dialogue box.
Designed by Countryscape.
Further information
More details of the methodology, analyses and results from Countryside Survey can be found in other companion reports and data resources available for the Countryside Survey website [www.countrysidesurvey.org.uk] including:
Reports:
• UK Headline Messages – published November 2008
• UK Results from 2007 – published November 2008
• Detailed Northern Ireland Countryside Survey results – published April 2009
• England Results from 2007 – due to be published August 2009
• Scotland Results from 2007 – due to be published June 2009
• Wales Results from 2007 – due to be published July 2009
• Ponds – due to be published July 2009
• Streams – October 2009
• Soils – November 2009
• Integrated Assessment – 2010
Data resources:
• Web access to summary data – a systematic summary of the results used to inform the UK and country level reports – launched in November 2008 and updated in January 2009
• Web access to the actual data – data from individual survey squares used to generate all the results presented in Countryside Survey reports from the 2007 survey – licensed access available from June 2009
• The UK Land Cover Map for 2007 – September 2009
The data generated by Countryside Survey will continue to be investigated in conjunction with other information such as climate, pollution and agricultural statistics. It is anticipated that future analysis of Countryside Survey data will lead to many scientifi c journal articles over the coming years. These investigations will improve understanding about the possible causes of the changes detected in the countryside and, for example, provide an opportunity to explore the results for Priority Habitats in more detail.
Contacts
For further information on Countryside Survey see www.countrysidesurvey.org.uk or contact: Countryside Survey Project Offi ce, Centre for Ecology and Hydrology, Lancaster Environment Centre, Library Avenue, Bailrigg, Lancaster LA1 4AP
COPYRIGHT: This publication is the Copyright of the Natural Environment Research Council, June 2008
Copyright: of all graphs, diagrams and charts is owned by the Natural Environment Research Council
Copyright of photographs: Copyright of photographs is as acknowledged in individual captions
Copyright enquiries should be addressed to: Knowledge Transfer Team, Centre for Ecology and Hydrology, Maclean Building, Benson Lane, Wallingford OX10 8BB
This publication, excluding logos, may be reproduced free of charge in any format or medium for research, private study or the purposes of internal use within an organisation. This is subject to it being reproduced accurately and not being subject to any treatment that could be considered derogatory. The reproduced material must be acknowledged as NERC Copyright (except where otherwise stated) and the publication named in full.
Disclaimer
Any decisions or actions informed by these results are taken entirely at your own risk. In no event shall NERC be liable for any damages, including loss of business, loss of opportunity, loss of data, loss of profi ts or for any other indirect or consequential loss or damage whatsoever arising out of the use of or inability to use the results presented in this report.
The Countryside Survey partnership has endeavoured to ensure that the results presented in this report are quality assured and accurate. Data has been collected to estimate the stock, change, extent and/or quality of the reported parameters. However, the complex nature of the experimental design means that results can not necessarily be extrapolated and/or interpolated beyond their intended use without reference to the original data.