MARCH 2009 MONROE CONNECTOR/BYPASS DEIS 3-1 3. HUMAN ENVIRONMENT 3.1 SOCIO-ECONOMIC CHARACTERISTICS The following sections provide an overview of the project study area’s social and economic characteristics summarized from the Community Impact Assessment (PBS&J, February 2009), incorporated by reference and available on the North Carolina Turnpike Authority (NCTA) Web site (www.ncturnpike.org/projects/monroe ). Comparisons were made with state and county demographic data to identify trends and draw conclusions about the project study area. 3.1.1 DEMOGRAPHIC STUDY AREA Consistent with the North Carolina Department of Transportation (NCDOT) method for community impact assessment, a Demographic Study Area (Figure 3-1) was defined in order to describe the existing baseline conditions. This broad area was established to identify and analyze population growth, household, and other demographic characteristics. This information was used as a foundation for determining potential project-related impacts to the human environment. The Demographic Study Area consists of 33 Union County Block Groups and six Mecklenburg County Block Groups. A community characteristics profile was then developed to describe the basic population and demographic characteristics of this area. The Demographic Study Area includes block groups traversed by the Detailed Study Alternatives (DSAs), as well as additional block groups that are wholly or partially within the project study area used to develop the DSAs. Since this project is regional in scale, a broad, inclusive Demographic Study Area was selected to describe the baseline conditions of the community, neighborhoods, and resources present in the area. Furthermore, the inclusive Demographic Study Area includes block groups outside of the immediate US 74 corridor in order to describe the population that may be affected by the proposed project (i.e., direct impacts, travel pattern changes, mobility, and accessibility) The Demographic Study Area encompasses block groups within the following areas of Union County: Town of Stallings, Town of Hemby Bridge, Village of Lake Park, Town of Indian Trail, City of Monroe, Town of Wingate, and Town of Marshville, as well as the unincorporated areas that include communities such as Unionville. The Demographic Study Area also contains block groups within Mecklenburg County that include the Town of Matthews and the Town of Mint Hill. Demographic information from the US Census Bureau, NC Economic Security Commission (NCESC), and other resources were combined to provide a general overview of the community characteristics of Mecklenburg and Union counties, as well as the municipalities in the project study area. Demographic characteristics such as age, race, and median income, which are quantitative and easily measured, are compared and displayed in tables and figures. Qualitative information gathered through field visits and one-on-one interviews is also discussed. Section 3 summarizes the potential effects to the human environment, including socio‐economic resources, neighborhoods and community resources, and land use and transportation planning. Project impacts addressed in this section are based on the functional engineering designs for the Detailed Study Alternatives.
Transcript
MARCH 2009 MONROE CONNECTOR/BYPASS DEIS 3-1
3. HUMAN ENVIRONMENT
3.1 SOCIO-ECONOMIC CHARACTERISTICS
The following sections provide an overview of the project study area’s social and economic characteristics summarized from the Community Impact Assessment (PBS&J, February 2009), incorporated by reference and available on the North Carolina Turnpike Authority (NCTA) Web site (www.ncturnpike.org/projects/monroe). Comparisons were made with state and county demographic data to identify trends and draw conclusions about the project study area.
3.1.1 DEMOGRAPHIC STUDY AREA
Consistent with the North Carolina Department of Transportation (NCDOT) method for community impact assessment, a Demographic Study Area (Figure 3-1) was defined in order to describe the existing baseline conditions. This broad area was established to identify and analyze population growth, household, and other demographic characteristics. This information was used as a foundation for determining potential project-related impacts to the human environment. The Demographic Study Area consists of 33 Union County Block Groups and six Mecklenburg County Block Groups. A community characteristics profile was then developed to describe the basic population and demographic characteristics of this area.
The Demographic Study Area includes block groups traversed by the Detailed Study Alternatives (DSAs), as well as additional block groups that are wholly or partially within the project study area used to develop the DSAs. Since this project is regional in scale, a broad, inclusive Demographic Study Area was selected to describe the baseline conditions of the community, neighborhoods, and resources present in the area. Furthermore, the inclusive Demographic Study Area includes block groups outside of the immediate US 74 corridor in order to describe the population that may be affected by the proposed project (i.e., direct impacts, travel pattern changes, mobility, and accessibility)
The Demographic Study Area encompasses block groups within the following areas of Union County: Town of Stallings, Town of Hemby Bridge, Village of Lake Park, Town of Indian Trail, City of Monroe, Town of Wingate, and Town of Marshville, as well as the unincorporated areas that include communities such as Unionville. The Demographic Study Area also contains block groups within Mecklenburg County that include the Town of Matthews and the Town of Mint Hill.
Demographic information from the US Census Bureau, NC Economic Security Commission (NCESC), and other resources were combined to provide a general overview of the community characteristics of Mecklenburg and Union counties, as well as the municipalities in the project study area. Demographic characteristics such as age, race, and median income, which are quantitative and easily measured, are compared and displayed in tables and figures. Qualitative information gathered through field visits and one-on-one interviews is also discussed.
Section 3 summarizes the potential effects to the human environment, including socio‐economic resources, neighborhoods and community resources, and land use and transportation planning. Project impacts addressed in this section are based on the functional engineering designs for the Detailed Study Alternatives.
HUMAN ENVIRONMENT CHAPTER 5 Section 3
MARCH 2009 MONROE CONNECTOR/BYPASS DEIS 3-2
3.1.2 POPULATION CHARACTERISTICS
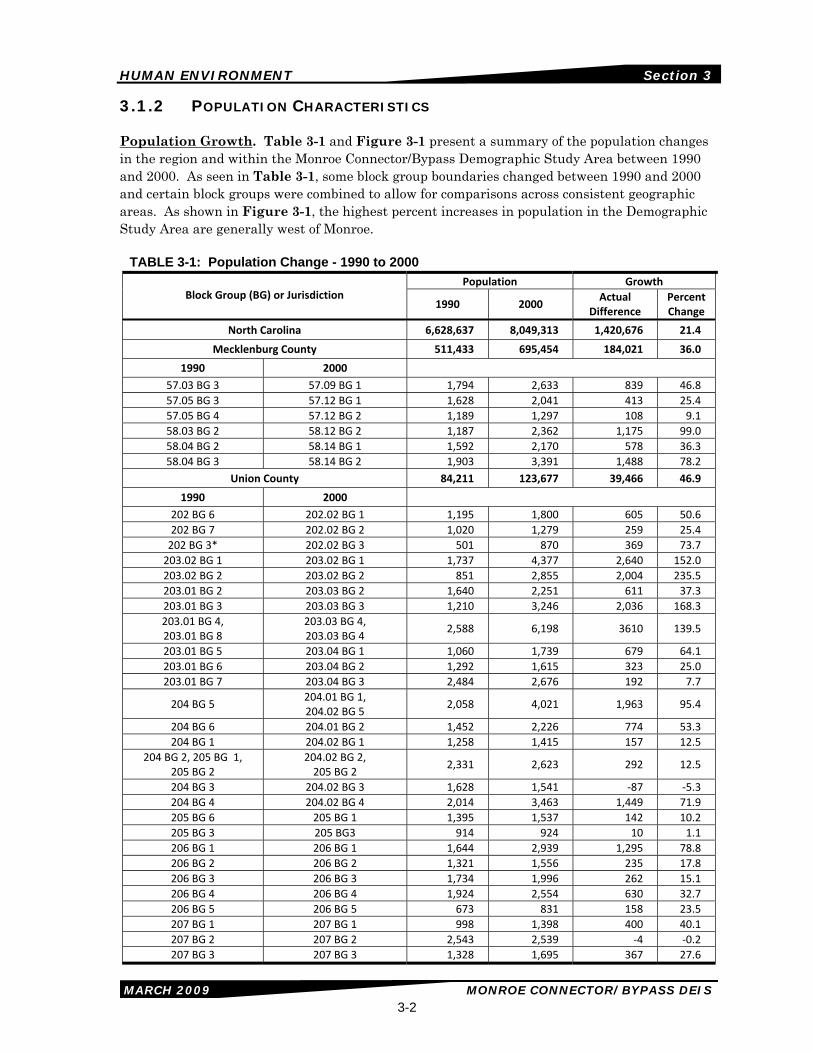
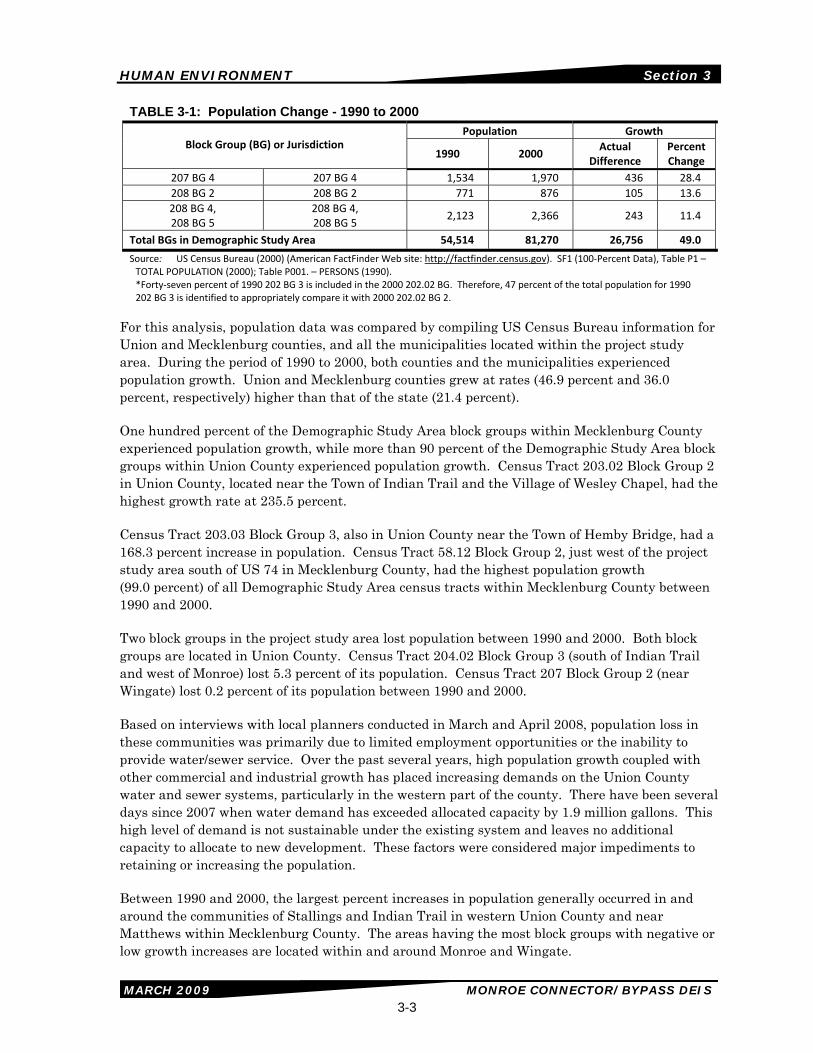
Population Growth. Table 3-1 and Figure 3-1 present a summary of the population changes in the region and within the Monroe Connector/Bypass Demographic Study Area between 1990 and 2000. As seen in Table 3-1, some block group boundaries changed between 1990 and 2000 and certain block groups were combined to allow for comparisons across consistent geographic areas. As shown in Figure 3-1, the highest percent increases in population in the Demographic Study Area are generally west of Monroe.
TABLE 3-1: Population Change - 1990 to 2000 Population Growth
Total BGs in Demographic Study Area 54,514 81,270 26,756 49.0
Source: US Census Bureau (2000) (American FactFinder Web site: http://factfinder.census.gov). SF1 (100‐Percent Data), Table P1 – TOTAL POPULATION (2000); Table P001. – PERSONS (1990). *Forty‐seven percent of 1990 202 BG 3 is included in the 2000 202.02 BG. Therefore, 47 percent of the total population for 1990 202 BG 3 is identified to appropriately compare it with 2000 202.02 BG 2.
For this analysis, population data was compared by compiling US Census Bureau information for Union and Mecklenburg counties, and all the municipalities located within the project study area. During the period of 1990 to 2000, both counties and the municipalities experienced population growth. Union and Mecklenburg counties grew at rates (46.9 percent and 36.0 percent, respectively) higher than that of the state (21.4 percent).
One hundred percent of the Demographic Study Area block groups within Mecklenburg County experienced population growth, while more than 90 percent of the Demographic Study Area block groups within Union County experienced population growth. Census Tract 203.02 Block Group 2 in Union County, located near the Town of Indian Trail and the Village of Wesley Chapel, had the highest growth rate at 235.5 percent.
Census Tract 203.03 Block Group 3, also in Union County near the Town of Hemby Bridge, had a 168.3 percent increase in population. Census Tract 58.12 Block Group 2, just west of the project study area south of US 74 in Mecklenburg County, had the highest population growth (99.0 percent) of all Demographic Study Area census tracts within Mecklenburg County between 1990 and 2000.
Two block groups in the project study area lost population between 1990 and 2000. Both block groups are located in Union County. Census Tract 204.02 Block Group 3 (south of Indian Trail and west of Monroe) lost 5.3 percent of its population. Census Tract 207 Block Group 2 (near Wingate) lost 0.2 percent of its population between 1990 and 2000.
Based on interviews with local planners conducted in March and April 2008, population loss in these communities was primarily due to limited employment opportunities or the inability to provide water/sewer service. Over the past several years, high population growth coupled with other commercial and industrial growth has placed increasing demands on the Union County water and sewer systems, particularly in the western part of the county. There have been several days since 2007 when water demand has exceeded allocated capacity by 1.9 million gallons. This high level of demand is not sustainable under the existing system and leaves no additional capacity to allocate to new development. These factors were considered major impediments to retaining or increasing the population.
Between 1990 and 2000, the largest percent increases in population generally occurred in and around the communities of Stallings and Indian Trail in western Union County and near Matthews within Mecklenburg County. The areas having the most block groups with negative or low growth increases are located within and around Monroe and Wingate.
HUMAN ENVIRONMENT CHAPTER 5 Section 3
MARCH 2009 MONROE CONNECTOR/BYPASS DEIS 3-4
Race and Ethnicity. Whites, blacks, and Hispanics are the three largest racial/ethnic groups within the project study area. Mecklenburg County is about 64 percent white, 28 percent black, six percent Hispanic, three percent Asian, and less than one percent other. Union County is about 83 percent white, 13 percent black, six percent Hispanic, one percent Asian, and less than one percent other. Please note that some Hispanics (which is an ethnic category as opposed to a racial group) may also be counted in the black or white racial groups, so the percentages may add up to be greater than 100 percent.
Figures 3-4 and 3-5 show the percentages of African-American (black) population and Hispanic population, respectively, by block group in the Demographic Study Area based upon the 2000 Census. Block groups with black populations that are high in comparison to county and state percentages are generally located in Monroe and west of Wingate. The highest concentrations of black population in the Demographic Study Area occur in Census Tract 204.02 Block Group 1 (71.0 percent), adjacent Census Tract 207 Block Group 3 (46.0 percent), Census Tract 208 Block Group 4 (45.8 percent) and Census Tract 208 Block Group 2 (45.3 percent).
The highest concentrations of Hispanic population occur in Monroe. Census Tract 204.02 Block Group 2 (46.5 percent), located within Monroe near US 601 and south of US 74, has the highest Hispanic/Latino population. Two nearby block groups also have high Hispanic populations - Census Tract 206 Block Group 2 (41.2 percent) and Census Tract 205 Block Group 2 (35.5 percent).
Age. The median age for the state is 35.3 years. The median ages for Mecklenburg County (33.1) and Union County (34.0) are slightly lower than that of the state. The median age within the Demographic Study Area ranges between 22.5 (Census Tract 207 Block Group 2), which is substantially younger than the median ages elsewhere in the region, and 39.9 (Census Tract 206 Block Group 4), which is moderately older.
When looking at percentages of population within various age groups, Mecklenburg County has about 28 percent of its population aged 19 years or less, about 44 percent aged 20-44 years, about 20 percent aged 45-64, and about 9 percent aged 65+ years. Union County has a similar age distribution, with approximately 31 percent 19 years old or less, 39 percent aged 20-44 years, 22 percent aged 45-64, and 9 percent aged 65+ years.
3.1.3 ECONOMIC CHARACTERISTICS
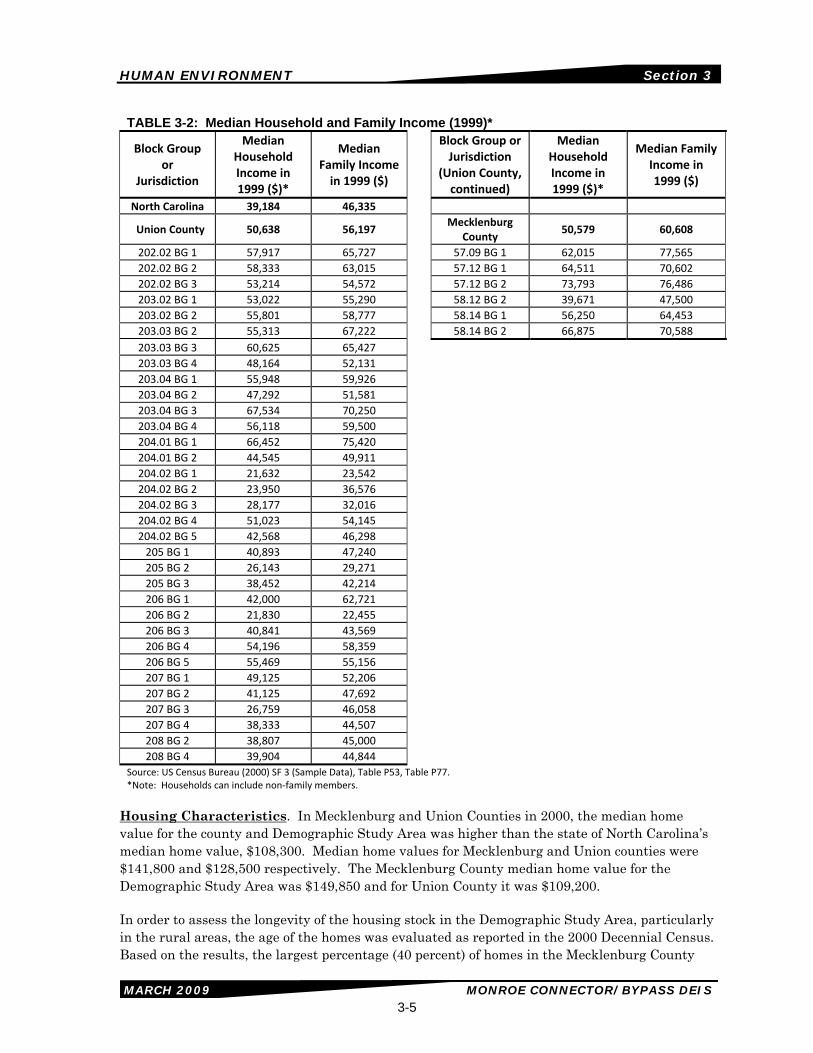
Income. Data on median family income and median household incomes within the project study area is shown in Table 3-2. As shown, the median family incomes for Mecklenburg County ($60,608) and Union County ($56,197) were substantially higher than the state average ($46,335). Figure 3-6 shows the percentages of population in poverty by block group within the Demographic Study Area, based upon the 2000 Census.
Within Mecklenburg County, all the block groups in the Demographic Study Area, except for Census Tract 58.12 Block Group 2, have median family incomes higher than Mecklenburg County’s ($60,608), ranging from about $65,000 to $78,000. Census Tract 58.12 Block Group 2, near Matthews, has the lowest median family income at $47,500. Within Union County, the lowest incomes are reported in Census Tract 206 Block Group 2, with a median family income of $22,455 and a median household income of $21,830. This block group is located in Monroe, west of Wingate.
HUMAN ENVIRONMENT CHAPTER 5 Section 3
MARCH 2009 MONROE CONNECTOR/BYPASS DEIS 3-5
TABLE 3-2: Median Household and Family Income (1999)*
Source: US Census Bureau (2000) SF 3 (Sample Data), Table P53, Table P77. *Note: Households can include non‐family members.
Housing Characteristics. In Mecklenburg and Union Counties in 2000, the median home value for the county and Demographic Study Area was higher than the state of North Carolina’s median home value, $108,300. Median home values for Mecklenburg and Union counties were $141,800 and $128,500 respectively. The Mecklenburg County median home value for the Demographic Study Area was $149,850 and for Union County it was $109,200.
In order to assess the longevity of the housing stock in the Demographic Study Area, particularly in the rural areas, the age of the homes was evaluated as reported in the 2000 Decennial Census. Based on the results, the largest percentage (40 percent) of homes in the Mecklenburg County
HUMAN ENVIRONMENT CHAPTER 5 Section 3
MARCH 2009 MONROE CONNECTOR/BYPASS DEIS 3-6
portion of the Demographic Study Area was built in the 1990s, with a total of 2,293 homes. The Union County portion of the Demographic Study Area had similar results, with 9,629 homes (39 percent) built in the 1990s.
Employment. According to the Mecklenburg-Union Metropolitan Planning Organization’s (MUMPO) 2030 Long Range Transportation Plan (2030 LRTP), the economy of the region is very robust and continues to grow. The University of North Carolina (UNC)-Charlotte Urban Institute estimated that in 2000 there were 920,000 jobs in the Piedmont region, of which approximately 63 percent (569,000) were located in the MUMPO planning area.
According to the Monroe Connector/Bypass Qualitative Indirect and Cumulative Effects Assessment (HNTB, January 2009), in 2000 total employment in Mecklenburg County was 515,600 in 2000 and 45,465 in Union County. In 2006, total employment was 539,677 and 54,137 for Mecklenburg County and Union County, respectively.
The following information was obtained from the NCESC. In 1990 and 2006, the sector that provided the highest number of jobs in Mecklenburg County was Trade/Transportation/Utilities, although the percentage of jobs in that sector declined from 27.8 percent to 22.7 percent from 1990 to 2006. The Professional/Business sector provided the second highest number of jobs in both 1990 and 2006, with 14.1 percent and 18.5 percent of total employment, respectively.
In 1990, the Manufacturing sector by far provided the highest percentage of jobs in Union County at 40.7 percent, followed by Trade/Transportation/Utilities at 17.5 percent. In 2006, the Manufacturing sector still provided the highest percentage of jobs in Union County, but the percentage fell by nearly half to 21.3 percent. Education/Health moved to the second highest percentage with 17.5 percent, followed closely by Trade/Transportation/Utilities with 17.4 percent.
3.1.4 SOCIO-ECONOMIC IMPACTS
The Monroe Connector/Bypass project study area is characterized by both suburban and rural landscapes. Industrial and commercial uses are predominant along existing US 74 just west of I-485, along with some residential uses. The land surrounding the western end of the DSAs (west of US 601) is largely suburban and contains mostly residential uses and neighborhoods in and around the towns of Stallings, Indian Trail, Lake Park, Hemby Bridge, and Monroe.
The land surrounding the DSAs east of US 601 is more rural and includes farms, pastures, wooded areas, and scattered low-density residential development. The project study area is experiencing growth, especially in the western portion, including new residential development and a shift toward a more suburban landscape.
There are no unique manmade or natural features with significant aesthetic value that exist in the vicinity of the DSAs. Aesthetic and topographic features such as open agricultural fields, pastures, rolling hills, forest-lined streams and woodland areas are present in the project study area. All of the DSAs have the potential to offer visually pleasing views of these topographic features from the proposed roadway. Conversely, the DSAs have the potential to detract from existing views of rural and natural areas enjoyed by residents adjacent to the proposed roadway, such as users of adjacent property (residents, employees, recreational users, etc.).
HUMAN ENVIRONMENT CHAPTER 5 Section 3
MARCH 2009 MONROE CONNECTOR/BYPASS DEIS 3-7
The proposed project is likely to bring with it additional opportunities for economic growth. The Monroe Connector/Bypass project would not serve a specific economic development purpose, but local planners believe that the project is vital to the economic well-being of Union County. Business relocations are discussed in detail in Section 3.4.2 of this DEIS. Business relocations include those that are within the right-of-way limits or are denied access according to the functional engineering designs for the DSAs. The DSAs would relocate between 14 and 49 businesses. None of the businesses that would be displaced by the DSAs represent a unique type of business in the area. Accordingly, temporary disruption in their services during relocation is not anticipated to create any severe hardships to patrons in the area or impacts to the local economy.
3.2 COMMUNITY CHARACTERISTICS AND RESOURCES
3.2.1 COMMUNITY CHARACTERISTICS
The project study area contains a number of named neighborhoods and other communities within six municipalities and unincorporated areas of Union County and Mecklenburg County. Based on GIS data and field reviews, there are approximately 20 named neighborhoods within the DSAs, varying from small to large, and recent construction to older subdivisions. Figure 3-2a-c shows the general location of existing named neighborhoods in relation to the DSAs.
There are very few established older neighborhoods within the project study area; as most are less than 20 years old. Newer subdivisions within the DSAs include Fairhaven, Lake Park, Bonterra Village, Arbor Glen, Silverthorne, and Glencroft (Figure 3-2a-c).
3.2.2 NEIGHBORHOOD IMPACTS
The environmental planning process has given high priority to the avoidance and minimization of neighborhood disruption during the definition, evaluation, and selection of the DSAs and functional engineering designs within these DSA corridors. The initial land suitability mapping developed for the Monroe Connector/Bypass project study area identified residential areas as well as natural and historic resources. Alternative alignments were developed to achieve a balance between impacts to residential developments and sensitive natural and cultural features such as wetlands, floodplains, schools, and historic resources.
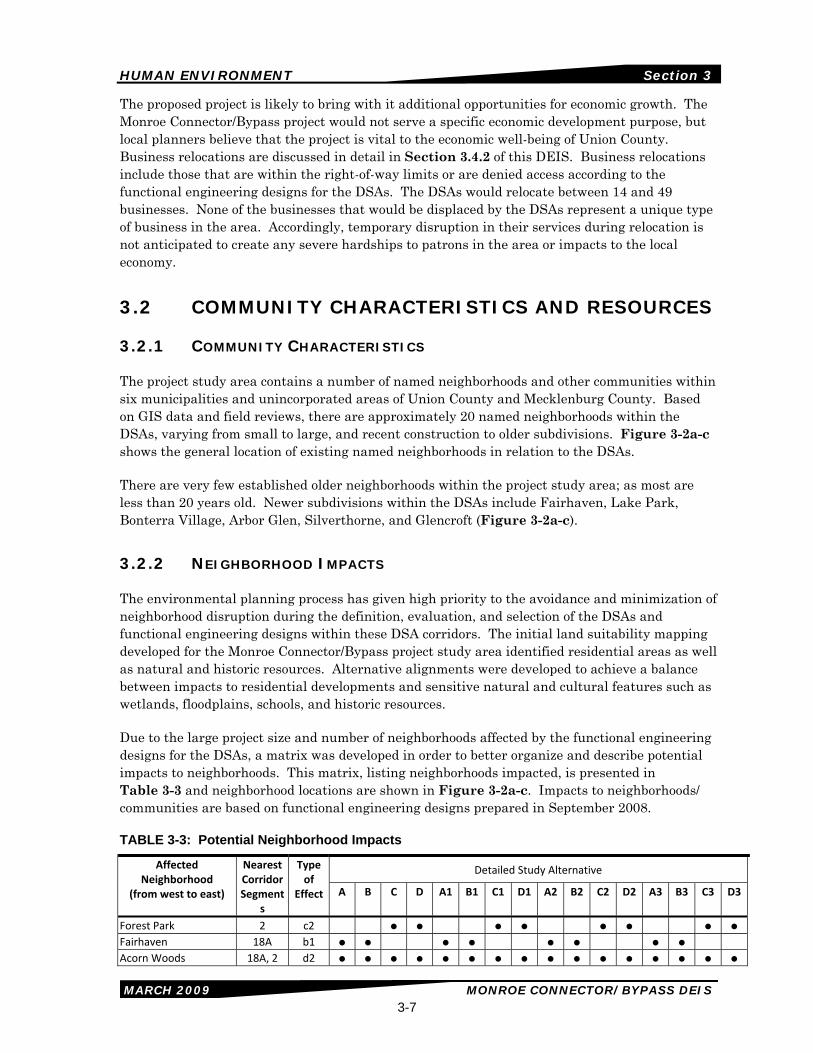
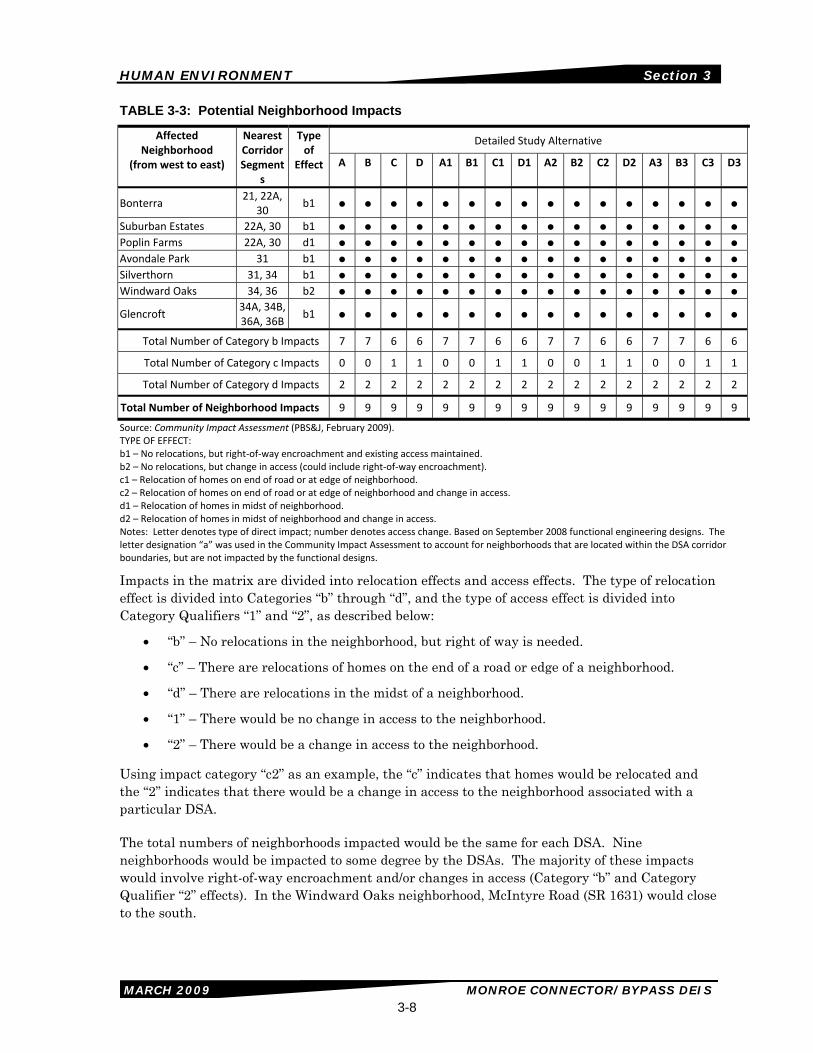
Due to the large project size and number of neighborhoods affected by the functional engineering designs for the DSAs, a matrix was developed in order to better organize and describe potential impacts to neighborhoods. This matrix, listing neighborhoods impacted, is presented in Table 3-3 and neighborhood locations are shown in Figure 3-2a-c. Impacts to neighborhoods/ communities are based on functional engineering designs prepared in September 2008.
TABLE 3-3: Potential Neighborhood Impacts
Detailed Study Alternative Affected Neighborhood
(from west to east)
Nearest Corridor Segment
s
Type of
Effect A B C D A1 B1 C1 D1 A2 B2 C2 D2 A3 B3 C3 D3
Total Number of Category b Impacts 7 7 6 6 7 7 6 6 7 7 6 6 7 7 6 6
Total Number of Category c Impacts 0 0 1 1 0 0 1 1 0 0 1 1 0 0 1 1
Total Number of Category d Impacts 2 2 2 2 2 2 2 2 2 2 2 2 2 2 2 2
Total Number of Neighborhood Impacts 9 9 9 9 9 9 9 9 9 9 9 9 9 9 9 9
Source: Community Impact Assessment (PBS&J, February 2009). TYPE OF EFFECT: b1 – No relocations, but right‐of‐way encroachment and existing access maintained. b2 – No relocations, but change in access (could include right‐of‐way encroachment). c1 – Relocation of homes on end of road or at edge of neighborhood. c2 – Relocation of homes on end of road or at edge of neighborhood and change in access. d1 – Relocation of homes in midst of neighborhood. d2 – Relocation of homes in midst of neighborhood and change in access. Notes: Letter denotes type of direct impact; number denotes access change. Based on September 2008 functional engineering designs. The letter designation “a” was used in the Community Impact Assessment to account for neighborhoods that are located within the DSA corridor boundaries, but are not impacted by the functional designs.
Impacts in the matrix are divided into relocation effects and access effects. The type of relocation effect is divided into Categories “b” through “d”, and the type of access effect is divided into Category Qualifiers “1” and “2”, as described below:
• “b” – No relocations in the neighborhood, but right of way is needed.
• “c” – There are relocations of homes on the end of a road or edge of a neighborhood.
• “d” – There are relocations in the midst of a neighborhood.
• “1” – There would be no change in access to the neighborhood.
• “2” – There would be a change in access to the neighborhood.
Using impact category “c2” as an example, the “c” indicates that homes would be relocated and the “2” indicates that there would be a change in access to the neighborhood associated with a particular DSA.
The total numbers of neighborhoods impacted would be the same for each DSA. Nine neighborhoods would be impacted to some degree by the DSAs. The majority of these impacts would involve right-of-way encroachment and/or changes in access (Category “b” and Category Qualifier “2” effects). In the Windward Oaks neighborhood, McIntyre Road (SR 1631) would close to the south.
HUMAN ENVIRONMENT CHAPTER 5 Section 3
MARCH 2009 MONROE CONNECTOR/BYPASS DEIS 3-9
For all DSAs, two neighborhoods (Acorn Woods and Poplin Farms) would experience relocation of homes in the midst of their neighborhoods (Category “d” effects). DSAs C, D, C1, D1, C2, D2, C3, and D3 would involve relocations in three neighborhoods, while the remaining DSAs would require relocations in only two neighborhoods. The Forest Park neighborhood would lose its access to US 74. In the Acorn Woods neighborhood, the northern access would be closed. Oak Springs Road would become a cul-de-sac if Segment 18A is used, requiring a new route to the local school. None of the DSAs would result in total displacement of a neighborhood.
Generally, more impacts to neighborhoods would occur in the western portion of the DSAs between Stallings and Indian Trail. This area is generally more densely developed and suburban in nature. Community cohesion impacts may occur and could include the effects of neighborhood division, social isolation, changes in community character, increased/decreased neighborhood or community access, and shortened travel times. The majority of the neighborhoods in the project study area have a suburban and agrarian visual character. The character of neighborhoods in the DSAs could be altered by the presence of a major roadway toll facility.
3.2.3 COMMUNITY RESOURCES
Community resources located in the Monroe Connector/Bypass project study area and discussed in this section are shown in Figure 3-3a-c. These resources provide basic needs and services to communities and neighborhoods in the area. Community resources in the project study area are concentrated generally in the urban areas. As expected, the number of community facilities decreases outward from the city and town centers.
Community resources information was obtained in part from the North Carolina Center for Geographic Information and Analysis, Union and Mecklenburg Counties’ Geographic Information System (GIS) Departments, ADC Map Books, and field reviews conducted in April and May 2008. A detailed analysis of community facilities is provided in the Community Impact Assessment (PBS&J, February 2009).
Community facilities that were identified in the project study area and discussed below include schools and colleges; churches and cemeteries; medical facilities/health centers; parks and recreational facilities; post offices; community centers/libraries; and public safety facilities.
Schools and Colleges. There are a number of educational facilities located within the project study area. However, as shown on Figure 3-3a-c, only four schools are located within or immediately adjacent to the DSA corridors: Central Piedmont Community College (CPCC), Stallings Elementary School, Sardis Elementary School, and Forest Hills High School.
Churches and Cemeteries. As shown in Figure 3-3a-c, there are eight churches and one known cemetery located within or adjacent to the DSAs.
Medical Facilities/Health Centers. The main regional hospital in the area is Carolinas Medical Center-Union (CMC-Union), located south of US 74 in Monroe. It has provided medical care for people in Union County and the surrounding area for more than 50 years. This hospital is the largest healthcare provider in the county, with 247 beds and acute and long-term care services. In addition, the hospital is one of the largest employers in Union County.
HUMAN ENVIRONMENT CHAPTER 5 Section 3
MARCH 2009 MONROE CONNECTOR/BYPASS DEIS 3-10
Union West Medical Plaza opened in Indian Trail in September 2005 at 6030 West Highway 74. The 24,000 square-foot facility offers a broad array of outpatient services. Both Union West Medical Plaza and CMC-Union are located well outside of the DSAs.
Parks and Recreational Facilities. As shown in Figure 3-3a-c, there is only one park facility located within the DSAs. The proposed Matthews Sportsplex is planned to be located on a 160-acre property owned by Mecklenburg County in the southwest quadrant of the existing I-485/US 74 interchange.
Post Offices. There are no post offices located within or adjacent to the DSAs. The Monroe United States Post Office is located well south of the DSAs at 407 North Main Street.
Community Centers/Libraries. There are no libraries or community centers located within or adjacent to the DSAs.
Public Safety Facilities. There are no public safety facilities located within or adjacent to the DSAs. Police departments in the vicinity of the project are located in Marshville, Monroe, Wingate, and Stallings. Fire stations and emergency medical services (EMS) are typically co-located. There are several fire stations with EMS services in the vicinity of the project.
3.2.4 IMPACTS TO COMMUNITY RESOURCES
Some community resources may be impacted by the proposed DSAs. Potential impacts to these resources are discussed in the following sections.
Schools and Colleges. Implementation of DSAs A, B, A1, B1, A2, B2, A3, or B3 would result in a minimal direct impact to the CPCC property in the southeast quadrant of the existing I-485/US 74 interchange to accommodate improvements to that interchange. There would not be any impacts to any school facilities, including sports fields and recreational areas. Additionally, for all DSAs, CPCC Lane, which provides access to the campus from US 74, would be closed to allow for control of access in the vicinity of the I-485 interchange. New access would be provided from US 74 via the proposed McKee Road.
The newly constructed Stallings Elementary School is located at 3501 Stallings Road. Union County Public Schools and the Town of Stallings had knowledge of the Monroe Connector/Bypass project and potential routes prior to purchasing this site. Coordination and communication with Union County Public Schools has been ongoing throughout the project development process. Stallings Elementary School is just north of the functional design alignment in DSA Segment 18A (DSAs A, B, A1, B1, A2, B2, A3, and B3). While there would be no direct impacts to the school property, including its sports fields and recreational areas, citizens have expressed concerns related to student safety and potential air quality impacts (Section 4.2) to students. Potential construction impacts would occur due to having to temporarily close Stallings Road during the construction of this segment.
On September 9, 2008, NCTA representative members met with Mr. Don Hughes, Director of Facilities, Planning and Construction for Union County Schools to review the functional design plans. Following his review of DSA Segment 18A, no concerns were expressed regarding possible direct or operational impacts to the newly constructed Stallings Elementary School. The NCTA will continue to coordinate with the Union County Public School system and the Town of
HUMAN ENVIRONMENT CHAPTER 5 Section 3
MARCH 2009 MONROE CONNECTOR/BYPASS DEIS 3-11
Stallings to determine the safest and most efficient traffic patterns for the Stallings Elementary School campus if a DSA including DSA Segment 18A is selected as the Preferred Alternative.
Sardis Elementary School is located just south of DSA Segments 22A and 30 (all DSAs). Implementation of the project would not result in any impacts to this facility, including its sports fields and recreational areas.
Forest Hills High School is located just south of DSA Segment 40. Implementation of the project would not result in direct impacts to Forest Hills High School, although traffic patterns on US 74 and Forest Hills School Road in the vicinity of the high school could be altered by implementation of any of the DSAs. There would be no impacts to the school’s facilities, including its sports fields and recreational areas.
It is anticipated that the project, no matter which DSA is selected as the Preferred Alternative, would temporarily impact school bus routes during construction, as well as result in modifications of existing routes and/or promote new bus routes. Once a Preferred Alternative is identified, the NCTA will coordinate/initiate discussions with Mecklenburg County Public Schools and Union County Public Schools regarding minimizing impacts to school bus routes.
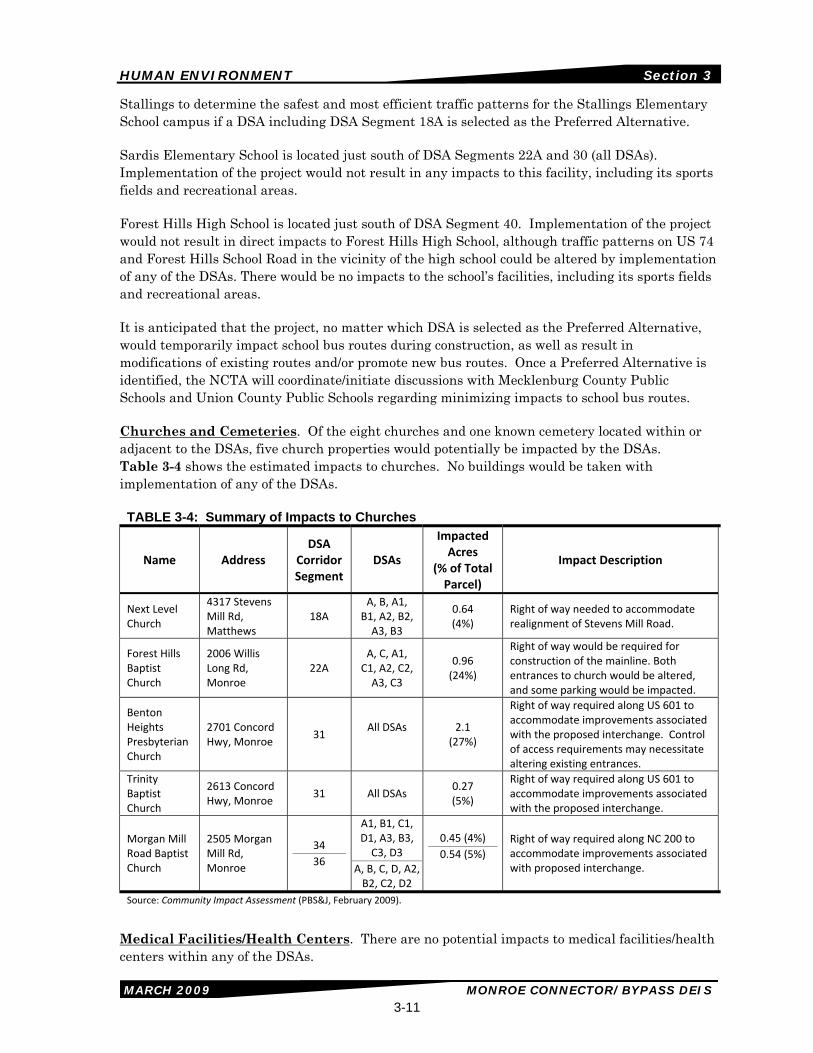
Churches and Cemeteries. Of the eight churches and one known cemetery located within or adjacent to the DSAs, five church properties would potentially be impacted by the DSAs. Table 3-4 shows the estimated impacts to churches. No buildings would be taken with implementation of any of the DSAs.
TABLE 3-4: Summary of Impacts to Churches
Name Address DSA
Corridor Segment
DSAs
Impacted Acres
(% of Total Parcel)
Impact Description
Next Level Church
4317 Stevens Mill Rd, Matthews
18A A, B, A1, B1, A2, B2, A3, B3
0.64 (4%)
Right of way needed to accommodate realignment of Stevens Mill Road.
Forest Hills Baptist Church
2006 Willis Long Rd, Monroe
22A A, C, A1, C1, A2, C2, A3, C3
0.96 (24%)
Right of way would be required for construction of the mainline. Both entrances to church would be altered, and some parking would be impacted.
Benton Heights Presbyterian Church
2701 Concord Hwy, Monroe
31 All DSAs
2.1
(27%)
Right of way required along US 601 to accommodate improvements associated with the proposed interchange. Control of access requirements may necessitate altering existing entrances.
Trinity Baptist Church
2613 Concord Hwy, Monroe
31 All DSAs 0.27 (5%)
Right of way required along US 601 to accommodate improvements associated with the proposed interchange.
Morgan Mill Road Baptist Church
2505 Morgan Mill Rd, Monroe
34 36
A1, B1, C1, D1, A3, B3, C3, D3
A, B, C, D, A2, B2, C2, D2
0.45 (4%) 0.54 (5%)
Right of way required along NC 200 to accommodate improvements associated with proposed interchange.
Source: Community Impact Assessment (PBS&J, February 2009).
Medical Facilities/Health Centers. There are no potential impacts to medical facilities/health centers within any of the DSAs.
HUMAN ENVIRONMENT CHAPTER 5 Section 3
MARCH 2009 MONROE CONNECTOR/BYPASS DEIS 3-12
Parks and Recreational Facilities. The only recreational facility that may be impacted by the proposed DSAs is the proposed Matthews Sportsplex, which would be located on property owned by Mecklenburg County. The DSAs that use Segment 18A (DSAs A, B, A1, B1, A2, B2, A3, and B3) would acquire approximately 2.25 acres on the northwest corner of the property, adjacent to the existing I-485/US 74 interchange, to accommodate interchange improvements. These minor encroachments on the edges of the parcel are not anticipated to impact access or any future use of the property for park purposes (Section 5.4.3.1 provides more detail). The DSAs that use Segment 2 (DSAs C, D, C1, D1, C2, D2, C3, and D3) would not impact the proposed Matthews Sportsplex.
In a meeting with the NCTA on September 4, 2008, the Mecklenburg County Park and Recreation Department (MCPR) stated that the proposed Matthews Sportsplex is anticipated to be built within the next three years with bonds that were approved on November 4, 2008. At the meeting, County staff stated the proposed encroachment would not affect the function and use of the property. NCTA will continue to coordinate with MCPR if a DSA including DSA Segment 18A is selected as the Preferred Alternative to ensure that right-of-way and construction limits within the property boundaries are minimized to the extent feasible. More information regarding potential Section 4(f) impacts is provided in Section 5.4.
There would be no impacts to sports fields or recreational areas associated with schools in the project study area.
Post Offices. No post offices would be impacted by any of the DSAs.
Community Centers/Libraries. No community centers or libraries would be impacted by the DSAs.
Public Safety Facilities. There would be no impacts to public safety facilities associated with any of the DSAs. The project is expected to reduce traffic on existing US 74, so there would be no impacts to emergency response times (PBSJ, Year 2035 Build Traffic Operations Technical Memorandum, February 2009).
3.2.5 SUMMARY OF COMMUNITY RESOURCE IMPACTS
Table 3-5 summarizes impacts to community resources by DSA. Based upon the summary provided in Table 3-5:
• DSAs A, A1, A2, and A3 would have the most total impacts to community facilities.
• DSAs D, D1, D2, and D3 would have the least total impacts to community facilities.
• All public facilities impacts are anticipated to be minor right-of-way encroachments and/or access changes.
HUMAN ENVIRONMENT CHAPTER 5 Section 3
MARCH 2009 MONROE CONNECTOR/BYPASS DEIS 3-13
TABLE 3-5: Summary of Impacts to Community Resources Churches
DSA Schools1 # of Churches with Impacts
to Main Buildings
Impact to Property,
Access, and/or Parking Only
Cemeteries Public Safety Facilities
Parks & Recreational Facilities2
Total Number of Community Facilities Impacted
A 1a,b 0 5 0 0 1a 7
B 1a,b 0 4 0 0 1a 6
C 1b 0 4 0 0 0 5
D 1b 0 3 0 0 0 4
A1 1a,b 0 5 0 0 1a 7
B1 1a,b 0 4 0 0 1a 6
C1 1b 0 4 0 0 0 5
D1 1b 0 3 0 0 0 4
A2 1a,b 0 5 0 0 1a 7
B2 1a,b 0 4 0 0 1a 6
C2 1b 0 4 0 0 0 5
D2 1b 0 3 0 0 0 4
A3 1a,b 0 5 0 0 1a 7
B3 1a,b 0 4 0 0 1a 6
C3 1b 0 4 0 0 0 5
D3 1b 0 3 0 0 0 4
Source: Community Impact Assessment (PBS&J, February 2009). 1. CPCC is the only school impacted 2. Future Matthews Sportsplex is the only recreational facility impacted a. Minimal right‐of‐way encroachment; no impacts to school facilities (including sports fields and recreational areas) b. Change in access
3.3 LAND USE AND TRANSPORTATION PLANNING
The Monroe Connector/Bypass project study area is located in Union and Mecklenburg Counties and includes portions of the towns of Matthews, Mint Hill, Stallings, Hemby Bridge, Indian Trail, Wingate, and Marshville; the Village of Lake Park; and the City of Monroe. The locations of the municipalities are shown on Figure 2-1. According to land use plans and field reviews, the Union County portion of the project study area is predominantly rural and suburban, while the Mecklenburg County portion is more urbanized. Much of Union County’s acreage is comprised of undeveloped or agricultural land with pockets of growing residential subdivision development, with the exception of the US 74 corridor, which is essentially built out with commercial uses. There are also pockets of industrial use near the towns of Stallings and Indian Trail. The agricultural uses within the project study area (western Union County) consist of large tracts currently being used for pastureland, cropland, and poultry. The largest farms are located in the eastern and southern portions of Union County.
Development within western Union County, including the project study area, is substantially influenced by its proximity to Charlotte, the hub of the region. Therefore, growth in Union County is concentrated in the western areas near Mecklenburg County. Although the project study area overall is still mainly rural, its character is rapidly changing to suburban.
HUMAN ENVIRONMENT CHAPTER 5 Section 3
MARCH 2009 MONROE CONNECTOR/BYPASS DEIS 3-14
Single-family residential is the predominant type of residential development within the project study area, with very little multi-family residential available. Most of the residential subdivisions have access to US 74, which provides access to the employment centers in Charlotte and Monroe. In the eastern portion of the project study area, residential development is less dense; however, there are a number of newer subdivisions that have been recently constructed or planned within this area
Most of the commercial development in the project study area is located along US 74. The commercial development is comprised of strip shopping centers, auto-oriented businesses, and service and retail industries such as convenience stores and restaurants. Commercial uses along Secrest Shortcut Road (SR 1501) are limited to a few parcels at the intersections with Rocky River Road (SR 1514) and Unionville-Indian Trail Road (SR 1367). There are a few scattered office developments within the project study area.
The industrial uses in the project study area are most commonly industrial parks with direct access to US 74. The largest of these parks are Union West Business Park (northeast side of US 74, east of Stallings Road [SR 1365]), Indian Trail Industrial Park (northeast side of US 74, north of Faith Church Road [SR 1518]), Sardis Church Road Industrial Park (northeast corner of the US 74/Helmsville Road [SR 1561] intersection), Sun Valley Industrial Park (northeast of US 74 on the north side of Sardis Church Road [SR 1516]), and Industrial Ventures Phases I and II (southeast corner of the US 74/Helmsville Road [SR 1561] intersection). The Old Hickory Business Park has some built out parcels and some undeveloped parcels near the intersection of Unionville-Indian Trail Road (SR 1367) and Stinson-Hartis Road (SR 1522) within Indian Trail.
3.3.1 LAND USE PLANS
Most of the communities within the project study area practice some type of land use planning or are included in their respective county’s land use plan. This section provides a list of policies and land use plans that are either current or being updated by jurisdictions in the project study area. More detailed information regarding land use and planning, including future land use and current zoning, is provided in the Indirect and Cumulative Effects Assessment (HNTB, January 2009) and the Community Impact Assessment (PBS&J, February 2009). The following bullets include information summarized from interviews conducted with local planning officials. The interview summaries can be found in the appendices to the above-referenced assessments.
Charlotte/Mecklenburg Planning Department. Only a small portion of southeastern Mecklenburg County is included in the project study area, but listed below are some policies that apply to this part of the County, which is located at the western terminus of the project.
• The Southeast Corridor Rapid Transit and Highway Project for southeast Mecklenburg County has been temporarily suspended, but is anticipated to be reactivated in the future.
• A revised floodplain ordinance is being updated by the Stormwater Engineering Division.
• The Independence Boulevard Area Plan that considers corridor needs is being evaluated from Briar Creek to Sardis Road (SR 1695), at the edge of the jurisdiction of Mecklenburg County. The second public meeting on the area plan was held in October 2008.
HUMAN ENVIRONMENT CHAPTER 5 Section 3
MARCH 2009 MONROE CONNECTOR/BYPASS DEIS 3-15
Town of Matthews • The existing Matthews Zoning Ordinance is currently being updated. Public workshops
are being held in January and February 2009 as part of the update process. The updated ordinance is scheduled for completion in 2010.
• The Matthews Land Use Plan, A Guide for Growth 2002-2012 was adopted in October 2002. An updated to this plan is anticipated in 2009.
• A new landscaping ordinance was adopted in October 2007.
• An economic development study was completed in winter 2007.
• The Downtown Matthews Master Plan and Design Guidelines are currently being updated and are anticipated to be adopted in 2009.
• A small area plan has been prepared for the land surrounding the proposed Matthews Sportsplex (discussed in Section 3.2.3).
Town of Mint Hill • The Mint Hill Comprehensive Transportation Plan was adopted in May 2008.
• The 2000 Land Use Plan was adopted in June 2000 but is anticipated to be updated in 2009.
• A small area study for the Bridges at Mint Hill (1.8 million square foot mall at I-485 and Lawyers Road) is underway.
• The Downtown Mint Hill Master Plan was adopted in 2002 along with the Downtown Mint Hill Overlay Code.
Union County • The Comprehensive Plan is currently being updated and a Preliminary Land Use Plan
Recommendation was prepared in August 2008. The Transportation Analysis and Strategies section of the update was competed in September 2008 and incorporated the Monroe Connector/Bypass project as a major factor influencing growth in the county. The most recent draft of the Future Land Use Map is dated September 19, 2008.
• The County has an Adequate Public Facilities Ordinance that was adopted in September 2006.
Town of Stallings • The Stallings Land Use Plan was adopted in April 2006.
• A Unified Development Ordinance is pending. It was considered for review by the Town Council in August 2008 and is still under review.
Town of Hemby Bridge. The Town of Hemby Bridge did not have any land use plans at the time of the June 2008 interview.
Village of Lake Park. The Village of Lake Park does not currently have a comprehensive plan but does have an active list of ordinances that were all updated throughout the year 2007, including:
• Parking Ordinance
• Public Parks Ordinance
• Resolution to Establish Economic Development Commission (EDC)
HUMAN ENVIRONMENT CHAPTER 5 Section 3
MARCH 2009 MONROE CONNECTOR/BYPASS DEIS 3-16
Town of Indian Trail • The Villages of Indian Trail – A Plan for Managed Growth and Livability was adopted in
November 2005.
• The Town of Indian Trail Downtown Master Plan was adopted in July 2006.
• A utilities ordinance is under review for an update
• Two pending studies that are anticipated in 2009 include: o The Stinson Hartis Road Study (within DSA Segment 2 of the Monroe
Connector/Bypass). o The US 74 Corridor Study.
• A Draft Pedestrian Plan was completed in November 2008.
• The Indian Trail Unified Development Ordinance was adopted in December 2008.
City of Monroe • The city Land Use Plan is anticipated to be updated in late 2009.
• The Economic Development division continues to evaluate an industrial park on the east side of the city. It is anticipated to serve as a corporate center for the Monroe Airport.
• There are neighborhood overlay districts specific to each neighborhood, which are detailed in the zoning code.
Town of Wingate • The town has no local land use plans in place but plans to develop a Comprehensive Plan
in 2009 based on approval by the Town Council.
• The zoning ordinance was adopted in 2002.
• The town is currently conducting a joint economic development study with the Town of Marshville in conjunction with Partnership through Progress.
Town of Marshville • The Town of Marshville Land Use Plan (August 2004) includes the incorporated limits
only.
• The Marshville Land Development Ordinance was adopted in April 1998 and revised in November 2007.
• The town is currently conducting a joint economic development study with assistance from Partnership through Progress with the Town of Wingate.
3.3.2 TRANSPORTATION PLANS
The Monroe Connector and Monroe Bypass projects are both included in the MUMPO 2030 LRTP as regionally significant projects. The Monroe Connector portion is identified as a toll road, while the Monroe Bypass portion currently is not. Both the Monroe Bypass and the Monroe Connector are 2020 horizon year projects. The Monroe Bypass was previously a 2010 horizon year project, but was moved to the 2020 horizon year in a LRTP Amendment, dated May 16, 2007. The MUMPO 2030 LRTP is currently being updated. At its September 19, 2007 meeting, the MUMPO adopted a resolution recommending that the NCTA finance the entire Monroe Connector/Bypass project as a toll facility. MUMPO has stated that it intends to incorporate both the Monroe Connector and Monroe Bypass into the updated LRTP as toll projects.
HUMAN ENVIRONMENT CHAPTER 5 Section 3
MARCH 2009 MONROE CONNECTOR/BYPASS DEIS 3-17
The 2004 Mecklenburg-Union Metropolitan Planning Organization Thoroughfare Plan shows both the Monroe Connector and Bypass as proposed freeway-expressway facilities. Both the MUMPO 2030 LRTP and the Thoroughfare Plan show a conceptual alignment for the Monroe Connector/Bypass project and include the same interchange locations for existing roads as proposed by NCTA. The MUMPO 2030 LRTP and the Thoroughfare Plan also show an interchange on the Monroe Connector/Bypass for a future Secrest Avenue Extension. The Secrest Avenue Extension is a 2030 horizon year project and there has been no planning initiated for it. The Monroe Connector/Bypass DSAs would not preclude the accommodation of a future interchange to connect the Secrest Avenue Extension, but that would be done as part of the Secrest Avenue Extension project, at such time as the extension project development activities begin.
Both the Monroe Connector (STIP Project R-3329) and Monroe Bypass (STIP Project R-2559) projects are included in the 2009–2015 State Transportation Improvement Program (STIP) as multi-lane freeways on new location.
3.3.3 LAND USE IMPACTS
Since the DSAs are on new location, direct land use changes from any of the DSAs include converting the land needed for right of way from its existing use to a transportation use. The land needed for right of way includes a wide variety of uses, such as industrial, commercial, residential, agricultural, and undeveloped. East of US 601, the project would introduce a suburban element into what is generally a rural environment. However, the project is part of the MUMPO 2030 LRTP. It is also referenced in the following land use plans and ordinances:
• Matthews Land Use Plan, A Guide for Growth 2002-2012 (October 2002)
• Mint Hill’s 2000 Land Use Plan (June 2000)
• The Transportation Analysis and Strategies section of the Union County Comprehensive Plan Update (September 2008)
• Villages of Indian Trail – A Plan for Managed Growth and Livability (November 2005).
The project is not referenced in the following land use plans and ordinances:
• Mint Hill Comprehensive Transportation Plan (May 2008)
• Stallings Land Use Plan (April 2006)
• Town of Marshville Land Use Plan (August 2004)
The Town of Hemby Bridge, the Village of Lake Park, the Town of Wingate, and the Town of Unionville do not have current land use plans.
Indirect and cumulative effects and changes in land use as a result of the project are further evaluated in Section 7 of this Draft EIS.
3.3.4 PLAN CONSISTENCY
As previously noted, the Monroe Connector and Monroe Bypass projects are both included in the MUMPO 2030 LRTP as regionally significant projects. The only inconsistency is that the Monroe Bypass portion of the project is not shown as a toll facility in the MUMPO 2030 LRTP. MUMPO
HUMAN ENVIRONMENT CHAPTER 5 Section 3
MARCH 2009 MONROE CONNECTOR/BYPASS DEIS 3-18
has stated that it intends to incorporate both the Monroe Connector and Monroe Bypass into the updated LRTP as toll projects. Both the Monroe Connector and Monroe Bypass projects are included in the 2009–2015 STIP (STIP Projects R-3329 and R-2559).
Interviews with local officials were conducted over six days between March 17, 2008 and June 27, 2008, and most of the communities along the project corridor discussed their approach to including the Monroe Connector/Bypass in their local plans and regulations. Due to the long project history and various iterations of the project, some felt that they would update their plans once the project was identified for construction and satisfied the National Environmental Policy Act of 1969 (NEPA) process. The Town of Indian Trail commented that the location of Segment 2 (which is included in DSAs C, D, C1, D1, C2, D2, C3 and D3) is inconsistent with its land use plans. Since the project is generally consistent with the MUMPO 2030 LRTP, many municipalities defer to MUMPO for transportation planning in the region.
3.4 RIGHT-OF-WAY ACQUISITION AND RELOCATIONS
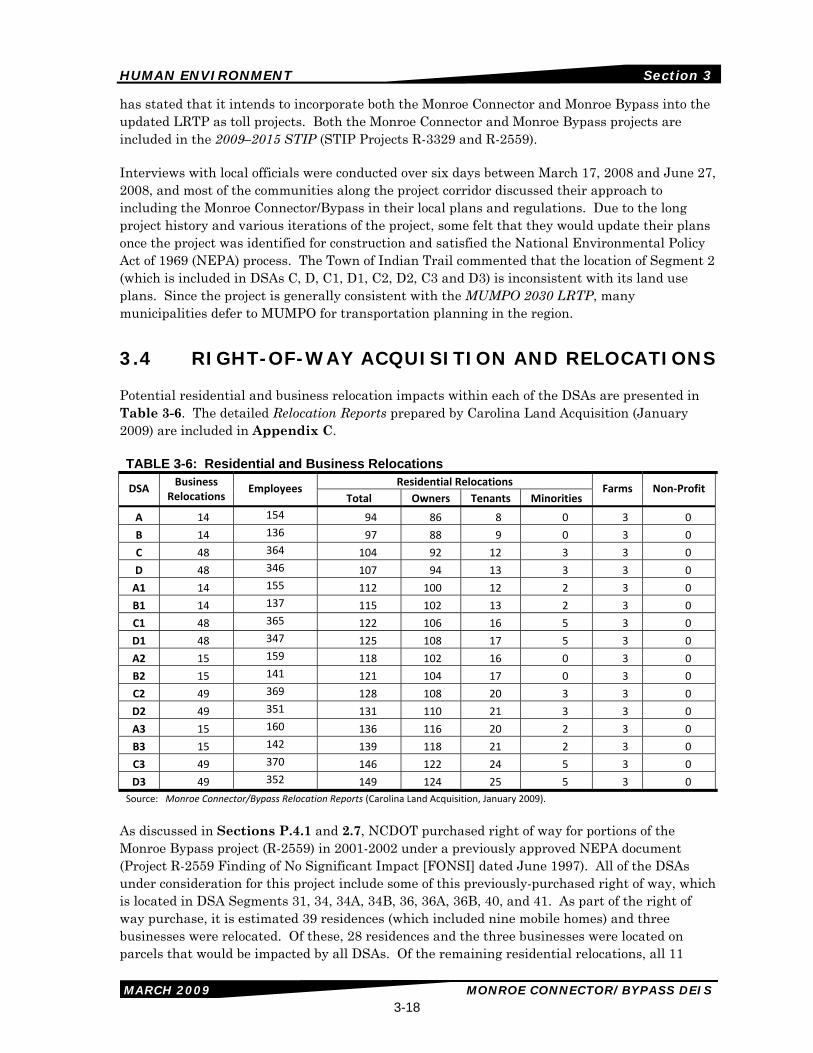
Potential residential and business relocation impacts within each of the DSAs are presented in Table 3-6. The detailed Relocation Reports prepared by Carolina Land Acquisition (January 2009) are included in Appendix C.
TABLE 3-6: Residential and Business Relocations Residential Relocations DSA Business
Relocations Employees
Total Owners Tenants Minorities Farms Non‐Profit
A 14 154 94 86 8 0 3 0
B 14 136 97 88 9 0 3 0
C 48 364 104 92 12 3 3 0
D 48 346 107 94 13 3 3 0
A1 14 155 112 100 12 2 3 0
B1 14 137 115 102 13 2 3 0
C1 48 365 122 106 16 5 3 0
D1 48 347 125 108 17 5 3 0
A2 15 159 118 102 16 0 3 0
B2 15 141 121 104 17 0 3 0
C2 49 369 128 108 20 3 3 0
D2 49 351 131 110 21 3 3 0
A3 15 160 136 116 20 2 3 0
B3 15 142 139 118 21 2 3 0
C3 49 370 146 122 24 5 3 0
D3 49 352 149 124 25 5 3 0 Source: Monroe Connector/Bypass Relocation Reports (Carolina Land Acquisition, January 2009).
As discussed in Sections P.4.1 and 2.7, NCDOT purchased right of way for portions of the Monroe Bypass project (R-2559) in 2001-2002 under a previously approved NEPA document (Project R-2559 Finding of No Significant Impact [FONSI] dated June 1997). All of the DSAs under consideration for this project include some of this previously-purchased right of way, which is located in DSA Segments 31, 34, 34A, 34B, 36, 36A, 36B, 40, and 41. As part of the right of way purchase, it is estimated 39 residences (which included nine mobile homes) and three businesses were relocated. Of these, 28 residences and the three businesses were located on parcels that would be impacted by all DSAs. Of the remaining residential relocations, all 11
HUMAN ENVIRONMENT CHAPTER 5 Section 3
MARCH 2009 MONROE CONNECTOR/BYPASS DEIS 3-19
previous relocations (if they existed today) would be common to DSAs A, B, C, and D, three would also be common to DSAs A1, B1, C1, and D1, and eight would also be common to A2, B2, C2, and D2. None would be on DSAs A3, B3, C3, and D3.
The small differences in relocations for each DSA that would be caused by the remaining 11 previous relocations would not influence the relative conclusions regarding numbers of relocations, the identification of the Recommended Alternative, or the future selection of a Preferred Alternative. Therefore, none of the previous relocations were counted in the totals provided in Sections 3.4.1 and 3.4.2.
3.4.1 RESIDENTIAL RELOCATIONS
As shown in Table 3-6, the total number of residential relocations estimated for each DSA ranges from 94 residences (DSA A) to 149 residences (DSA D3). All DSAs would include three farm relocations. The highest percentages of tenants would be relocated by DSAs C3 and D3. For DSAs C3 and D3, approximately 17 percent of the relocations would be tenants; for DSA D2 approximately 16 percent would be tenant relocations.
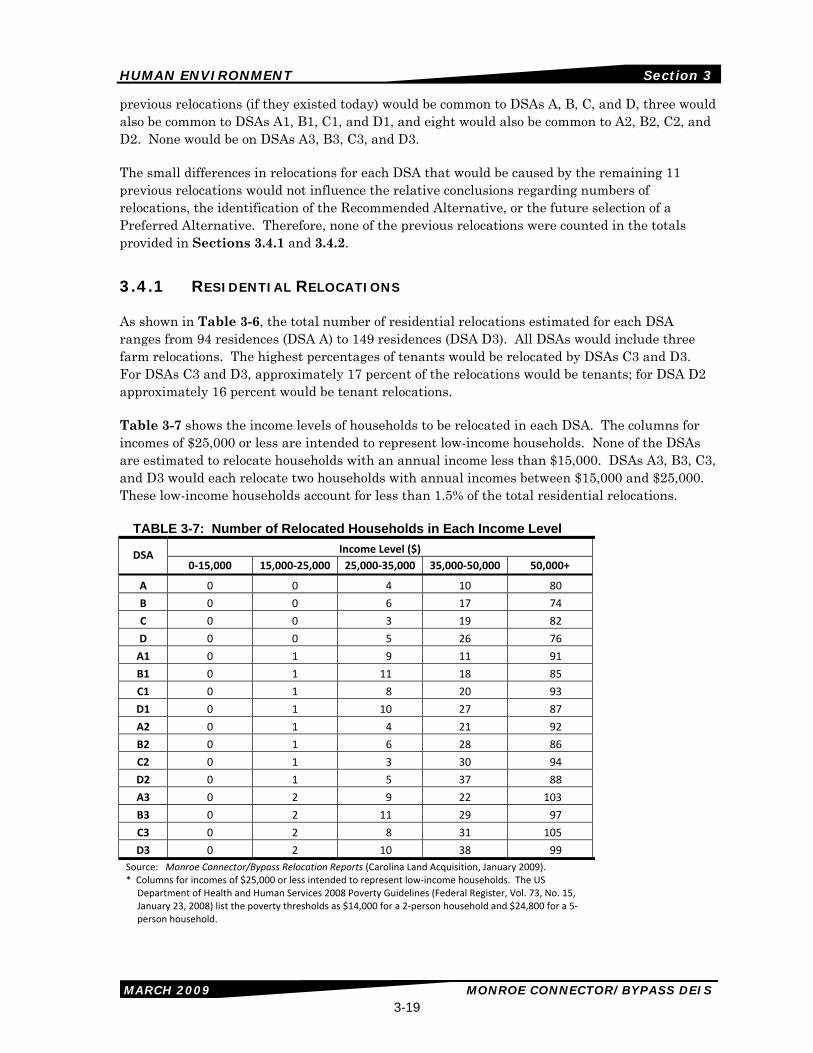
Table 3-7 shows the income levels of households to be relocated in each DSA. The columns for incomes of $25,000 or less are intended to represent low-income households. None of the DSAs are estimated to relocate households with an annual income less than $15,000. DSAs A3, B3, C3, and D3 would each relocate two households with annual incomes between $15,000 and $25,000. These low-income households account for less than 1.5% of the total residential relocations.
TABLE 3-7: Number of Relocated Households in Each Income Level Income Level ($) DSA
D3 0 2 10 38 99 Source: Monroe Connector/Bypass Relocation Reports (Carolina Land Acquisition, January 2009). * Columns for incomes of $25,000 or less intended to represent low‐income households. The US
Department of Health and Human Services 2008 Poverty Guidelines (Federal Register, Vol. 73, No. 15, January 23, 2008) list the poverty thresholds as $14,000 for a 2‐person household and $24,800 for a 5‐person household.
HUMAN ENVIRONMENT CHAPTER 5 Section 3
MARCH 2009 MONROE CONNECTOR/BYPASS DEIS 3-20
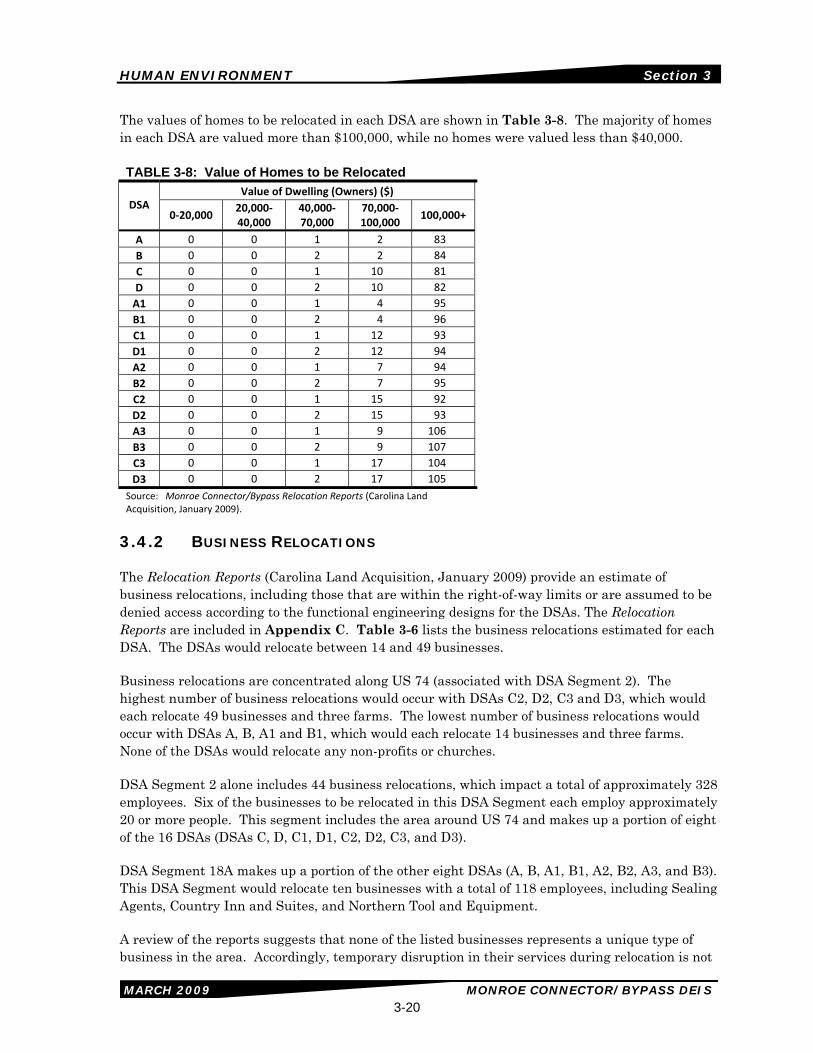
The values of homes to be relocated in each DSA are shown in Table 3-8. The majority of homes in each DSA are valued more than $100,000, while no homes were valued less than $40,000.
TABLE 3-8: Value of Homes to be Relocated Value of Dwelling (Owners) ($)
Source: Monroe Connector/Bypass Relocation Reports (Carolina Land Acquisition, January 2009).
3.4.2 BUSINESS RELOCATIONS
The Relocation Reports (Carolina Land Acquisition, January 2009) provide an estimate of business relocations, including those that are within the right-of-way limits or are assumed to be denied access according to the functional engineering designs for the DSAs. The Relocation Reports are included in Appendix C. Table 3-6 lists the business relocations estimated for each DSA. The DSAs would relocate between 14 and 49 businesses.
Business relocations are concentrated along US 74 (associated with DSA Segment 2). The highest number of business relocations would occur with DSAs C2, D2, C3 and D3, which would each relocate 49 businesses and three farms. The lowest number of business relocations would occur with DSAs A, B, A1 and B1, which would each relocate 14 businesses and three farms. None of the DSAs would relocate any non-profits or churches.
DSA Segment 2 alone includes 44 business relocations, which impact a total of approximately 328 employees. Six of the businesses to be relocated in this DSA Segment each employ approximately 20 or more people. This segment includes the area around US 74 and makes up a portion of eight of the 16 DSAs (DSAs C, D, C1, D1, C2, D2, C3, and D3).
DSA Segment 18A makes up a portion of the other eight DSAs (A, B, A1, B1, A2, B2, A3, and B3). This DSA Segment would relocate ten businesses with a total of 118 employees, including Sealing Agents, Country Inn and Suites, and Northern Tool and Equipment.
A review of the reports suggests that none of the listed businesses represents a unique type of business in the area. Accordingly, temporary disruption in their services during relocation is not
HUMAN ENVIRONMENT CHAPTER 5 Section 3
MARCH 2009 MONROE CONNECTOR/BYPASS DEIS 3-21
anticipated to create any severe hardship to patrons in the area, as the reports note that business services would remain available.
3.4.3 RELOCATION ASSISTANCE
According to the Relocation Reports, there is comparable replacement housing within the project study area for displaced homeowners and tenants.
The NCTA follows the relocation policies of NCDOT. The policies ensure that comparable replacement housing is available for relocatees prior to construction of state and/or federally assisted projects. Furthermore, the NCTA will use three programs NCDOT has to minimize the inconvenience of relocation: Relocation Assistance, Relocation Moving Payments, and Relocation Replacement Housing Payments or Rent Supplement. The relocation program for the proposed action will be conducted in accordance with the federal Uniform Relocation Assistance and Real Property Acquisition Policies Act of 1970 (Public Law 91-646) and the North Carolina Relocation Assistance Act (NCGS 133-5 through 133-18).
More information on right-of-way acquisition and relocation is available in the following two NCDOT brochures: Answers to the Questions Most Often Asked About Right of Way Acquisitions and Relocation Assistance and Relocation Assistance (NCTA Web site: www.ncturnpike.org/pdf/Right-of-Way%20Acquisition%20Brochure.pdf and www.ncturnpike.org/pdf/Relocation%20Assistance%20Brochure.pdf).
3.5 ENVIRONMENTAL JUSTICE
The Monroe Connector/Bypass project was evaluated for the potential for adverse impacts on minority and low-income populations in two ways: 1) Impacts that result from building and operating any new road (e.g., taking of land, noise impacts, air impacts etc.) and 2) Impacts that result specifically from tolling the facility.
The first category of impacts mainly involves people who are living in the immediate vicinity of the project. The second category involves people who are potential users of the road - a much broader geographic area since many of the users live outside the immediate vicinity of the project. In determining the existence of a minority or low-income population, it is important to consider both of these types of impacts and, by extension, both of these geographic areas. For the first category, NCTA has considered the potential for disproportionate impacts on minority and low-income populations in the project study area, as defined in Figure 1-3. For the second category, NCTA has considered the potential for disproportionate impacts on minority and low-income populations in the Demographic Study Area as defined in Figure 3-1.
The consideration of environmental justice (Executive Order 12989, Title VI of The Civil Rights Act of 1964)) impacts in the development of toll projects is a relatively new realm. Research revealed that Texas is the only state that has guidance to assist in assessing such effects for toll projects (Guidance on Environmental Justice for Toll Roads, TxDOT, March 2005) [referred to as the Guidance]. However, the need to identify and address the effects of tolling on environmental justice populations is gaining attention at both the transportation system level and project level. While the FHWA and NCTA have not adopted the TxDOT guidance, it has been considered for information purposes in the preparation of this analysis.
HUMAN ENVIRONMENT CHAPTER 5 Section 3
MARCH 2009 MONROE CONNECTOR/BYPASS DEIS 3-22
There are currently no plans for an inter-connected system of toll roads in the region or state. The Guidance noted above lists potential issues that could apply to all toll road scenarios, including a toll road on new location. These potential issues as they relate to the proposed Monroe Connector/Bypass DSAs are listed and evaluated in Table 3-9.
The Guidance noted above lists potential issues that could apply to toll road scenarios, including a toll road on new location and suggests that:
“When a single toll facility or a system of toll roads are placed within a mature local transportation network, the potential for disproportionate user impacts appear to be less than those for a less developed transportation network. This is because non-toll alternatives available for those who are unable to pay are limited. The users who are able to pay will not bear as much of the toll burden as the low-income population.”
TABLE 3-9: General Environmental Justice Evaluation for Toll Facilities
Project Consideration Comment
Availability of non‐toll facilities No potential for disproportionately high and adverse impact. Non‐toll facilities remain available as alternate routes, including existing US 74.
Adequate north‐south and east‐west corridors to serve as alternate routes
No potential for disproportionately high and adverse impact. Non‐toll corridors are available to continue to serve as alternate routes.
Non‐toll alternative equitable in terms of travel time or distance
No potential for disproportionately high and adverse impact. The non‐toll alternative would include existing roadways. Major existing roadways include I‐485, US 74, and US 601. All travelers would still have access to these existing routes, as they do today. If travelers choose to use existing routes, their travel distance would remain the same as it is today. Congestion may be slightly less on the existing roadways with any of the DSAs in place compared to the No‐Build Alternative since the DSAs would be diverting traffic from the existing routes.
Tolling affect on transit Not known. Transit services are primarily in Mecklenburg County with limited service to Union County. Project could provide opportunities for transit service enhancement.
Cost of toll
Although the Proposed Monroe Connector Preliminary Traffic and Revenue Study (Wilbur Smith Associates, October 2006) estimates a passenger car cash rate of $2.50 ($0.125 per mile for a full‐length trip on the facility at a length of 20 miles), this estimate is preliminary and subject to change. The actual initial price of the toll will be recommended following preparation of an Investment Grade Traffic and Revenue Study to be completed around the time of the issuance of a Record of Decision.
100% Electronic Tolling
Specific payment options have not yet been determined. In addition to paying tolls, electronic toll collection may involve establishing an account. Some low‐income users may not be willing or able to establish an account. Electronic tolling options that do not require an account are planned to be available, and NCTA will operate a facility in the immediate vicinity of the roadway that accepts cash payment for prepaid tolls. Non‐toll facilities are also available as alternate routes, including existing US 74.
Diversion of traffic through neighborhoods
No potential for disproportionately high and adverse impact. Very limited potential for diverted traffic through neighborhoods containing these populations.
Increased air quality/noise issues in neighborhoods
Although some neighborhoods with these populations would experience noise level increases, there are no disproportionately high and adverse impacts.
Access to businesses No potential for disproportionately high and adverse impacts based upon the relocation reports.
Impact to businesses No potential for disproportionately high and adverse impacts based upon the relocation reports.
HUMAN ENVIRONMENT CHAPTER 5 Section 3
MARCH 2009 MONROE CONNECTOR/BYPASS DEIS 3-23
TABLE 3-9: General Environmental Justice Evaluation for Toll Facilities
Project Consideration Comment
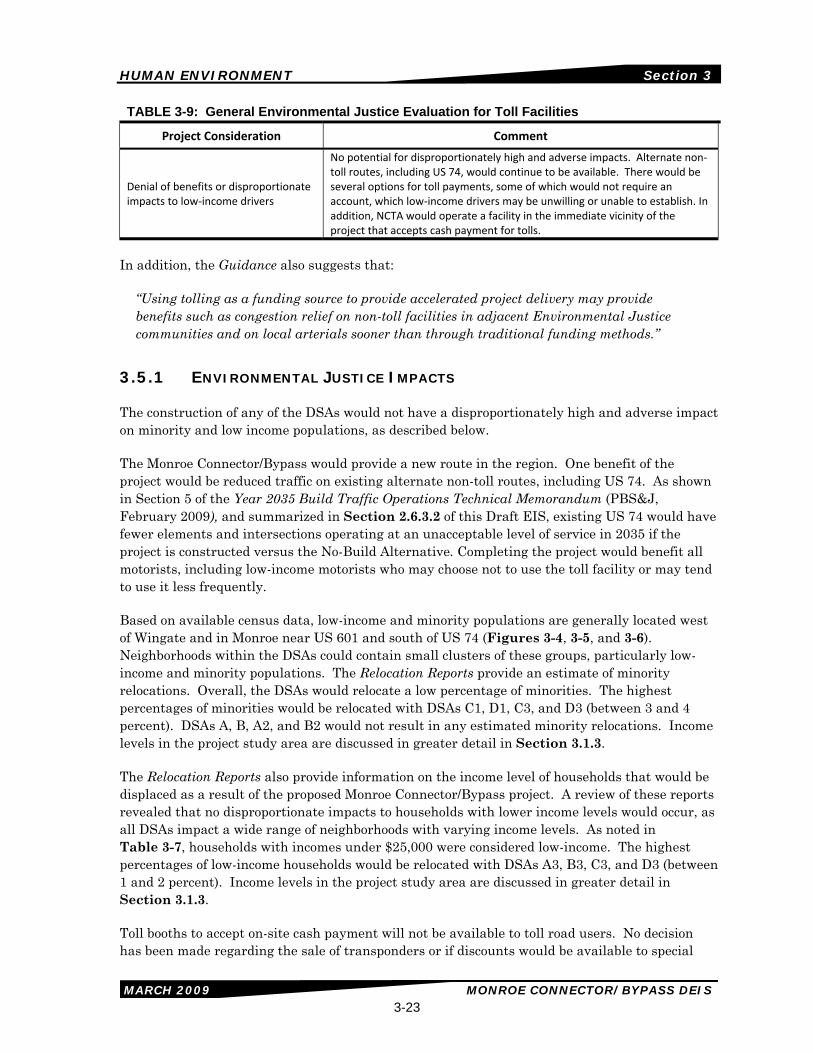
Denial of benefits or disproportionate impacts to low‐income drivers
No potential for disproportionately high and adverse impacts. Alternate non‐toll routes, including US 74, would continue to be available. There would be several options for toll payments, some of which would not require an account, which low‐income drivers may be unwilling or unable to establish. In addition, NCTA would operate a facility in the immediate vicinity of the project that accepts cash payment for tolls.
In addition, the Guidance also suggests that:
“Using tolling as a funding source to provide accelerated project delivery may provide benefits such as congestion relief on non-toll facilities in adjacent Environmental Justice communities and on local arterials sooner than through traditional funding methods.”
3.5.1 ENVIRONMENTAL JUSTICE IMPACTS
The construction of any of the DSAs would not have a disproportionately high and adverse impact on minority and low income populations, as described below.
The Monroe Connector/Bypass would provide a new route in the region. One benefit of the project would be reduced traffic on existing alternate non-toll routes, including US 74. As shown in Section 5 of the Year 2035 Build Traffic Operations Technical Memorandum (PBS&J, February 2009), and summarized in Section 2.6.3.2 of this Draft EIS, existing US 74 would have fewer elements and intersections operating at an unacceptable level of service in 2035 if the project is constructed versus the No-Build Alternative. Completing the project would benefit all motorists, including low-income motorists who may choose not to use the toll facility or may tend to use it less frequently.
Based on available census data, low-income and minority populations are generally located west of Wingate and in Monroe near US 601 and south of US 74 (Figures 3-4, 3-5, and 3-6). Neighborhoods within the DSAs could contain small clusters of these groups, particularly low-income and minority populations. The Relocation Reports provide an estimate of minority relocations. Overall, the DSAs would relocate a low percentage of minorities. The highest percentages of minorities would be relocated with DSAs C1, D1, C3, and D3 (between 3 and 4 percent). DSAs A, B, A2, and B2 would not result in any estimated minority relocations. Income levels in the project study area are discussed in greater detail in Section 3.1.3.
The Relocation Reports also provide information on the income level of households that would be displaced as a result of the proposed Monroe Connector/Bypass project. A review of these reports revealed that no disproportionate impacts to households with lower income levels would occur, as all DSAs impact a wide range of neighborhoods with varying income levels. As noted in Table 3-7, households with incomes under $25,000 were considered low-income. The highest percentages of low-income households would be relocated with DSAs A3, B3, C3, and D3 (between 1 and 2 percent). Income levels in the project study area are discussed in greater detail in Section 3.1.3.
Toll booths to accept on-site cash payment will not be available to toll road users. No decision has been made regarding the sale of transponders or if discounts would be available to special
HUMAN ENVIRONMENT CHAPTER 5 Section 3
MARCH 2009 MONROE CONNECTOR/BYPASS DEIS 3-24
groups. Low-income commuters would have the option to use a non-toll alternate route such as US 74. Non-toll routes would have less traffic after the opening of the Monroe Connector/Bypass, so users of non-toll routes would also benefit from the Monroe Connector/Bypass without paying a toll (Year 2035 Build Traffic Operations Technical Memorandum – Section 5, PBS&J, February 2009).
For Monroe Connector/Bypass users who do not have or do not wish to use a credit card, the NCTA will establish different account types to assure not all users are required to make a deposit or purchase a transponder. Users would have the option of prepaying their tolls by establishing a registered transponder or video account. These accounts would have the tolls deducted directly from their account balance based on the transponder or license plate associated with their account. These account types may be established and maintained using credit card, check, or cash as the payment method. In addition, in accordance with State law (NCGS 136-89.213), the NCTA plans to operate a facility (likely rented space in an existing building) in the immediate vicinity of the project that would accept cash payments.
All reasonable efforts have been made to include low income and minority groups in the decision-making process to date. The project would not deny, reduce, or delay receipt of project benefits to low-income or minority groups. Impacts to low-income and/or minority populations resulting from implementing the Monroe Connector/Bypass as a toll facility are not anticipated to be “disproportionately high and adverse”.