tJ 3 . I l I J 7 6 .s- ()\ y t1 7 ( I ,· ) (3 { (,.) ( 1/ J' • ) ( / \ ' ) Commission of the European Communities Report of a study into the competitiveness of European Community shipyards - ·- ........ iA)N ONLY KPMG Peat Marwick 2 October 1992 Ref ETD/91/BS - 411 0/IN/20 FINAL REPORT s -.
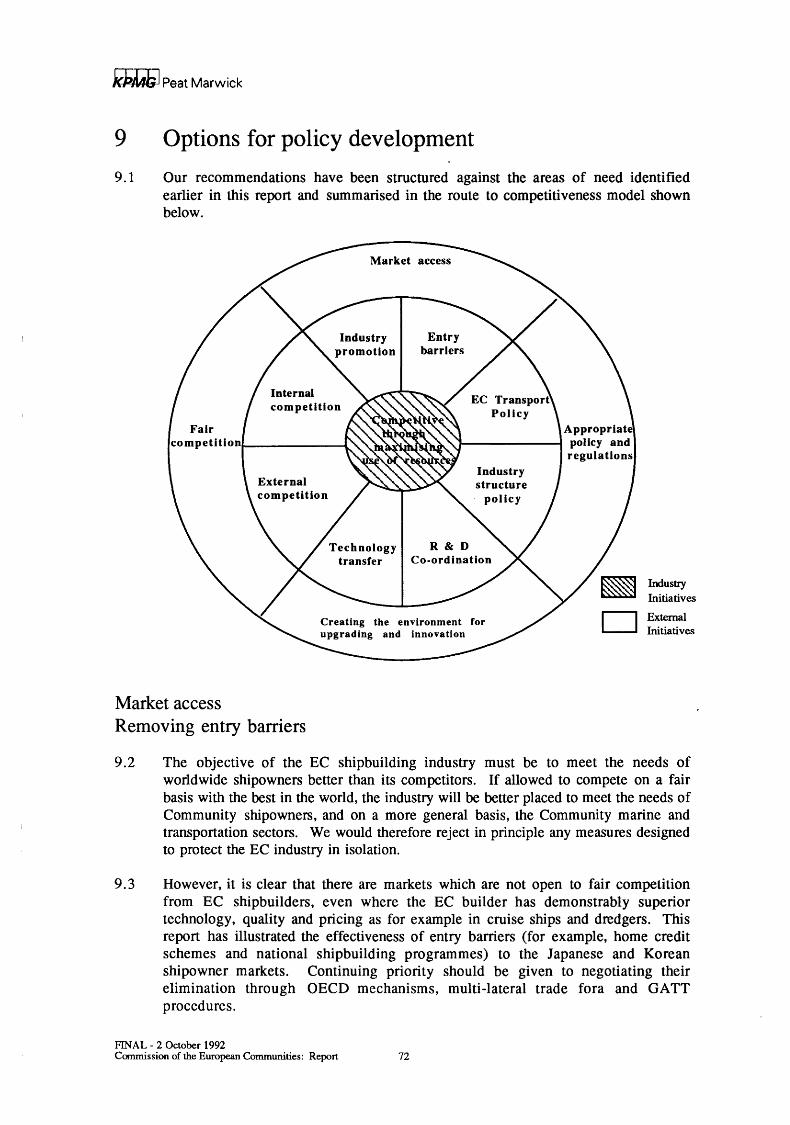
Transcript
tJ ~I 3 . ~ I l ~, 5~ I J 7 ~I~~ 6 .s- ~. ()\ y t1 7
( ~ I ,· ) (3 { (,.) ( 1/ J' • ) ( / \ ' )
Commission of the European Communities Report of a study into the competitiveness of European Community shipyards
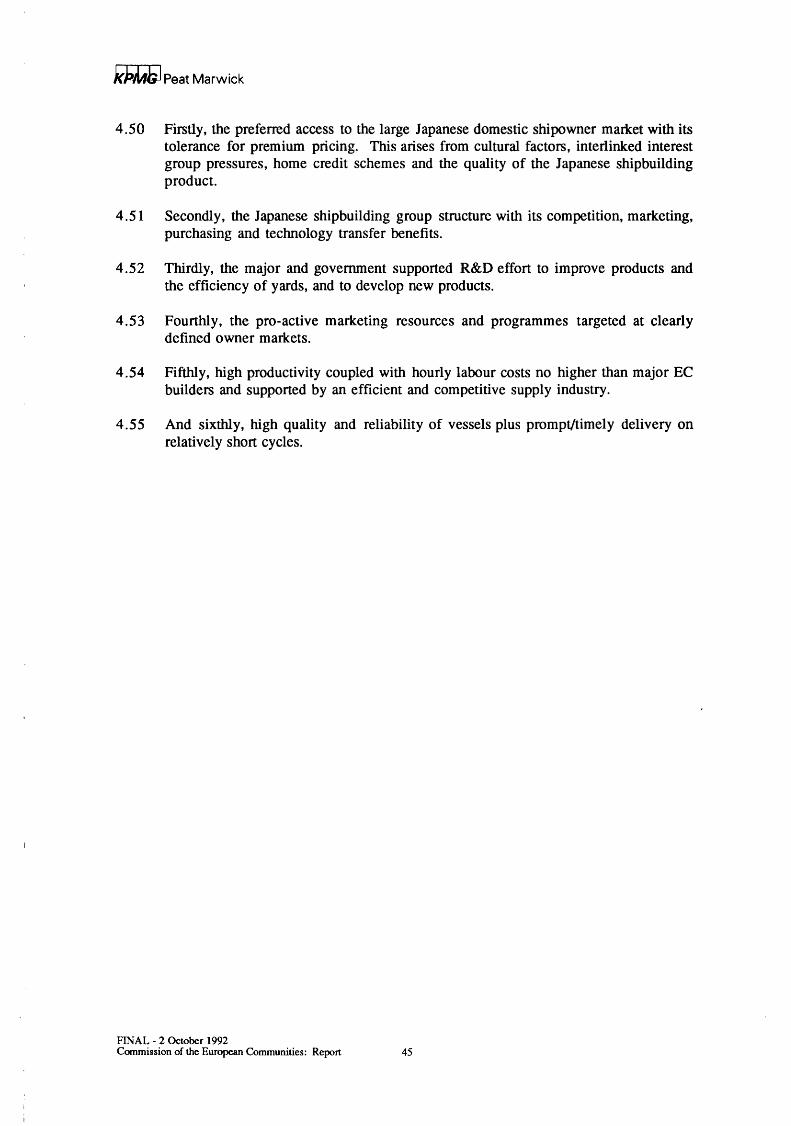
Report of a study into the competitiveness of European Community shipyards
Page
Contents
0 Executive Summary 3
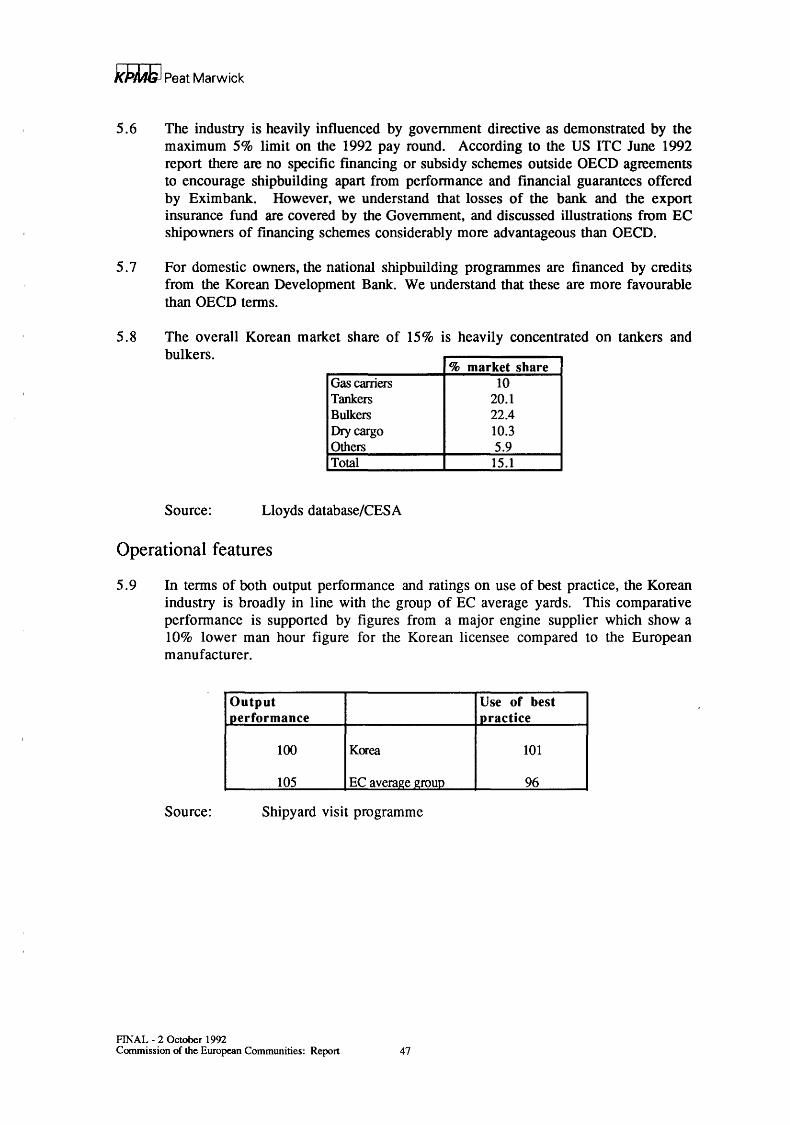
1 Introduction 13
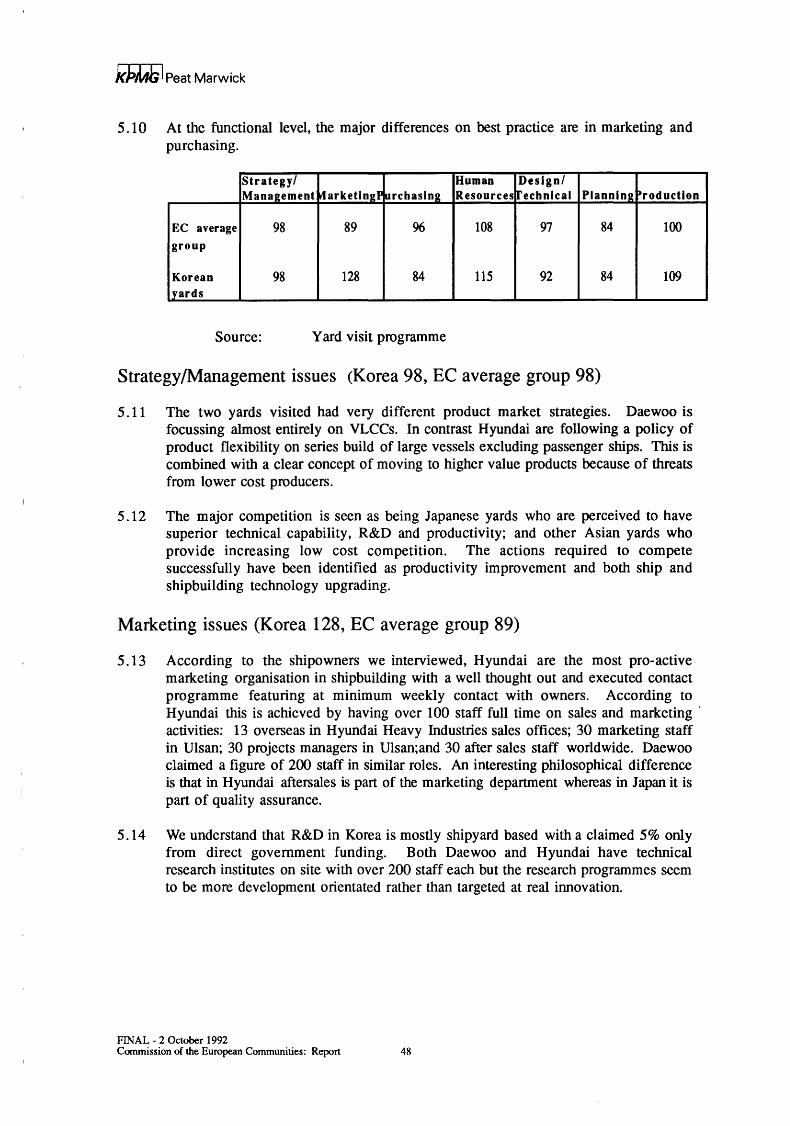
2 Current market position and market share 15
3 The European community shipbuilding industry 22
4 The Japanese shipbuilding industry 35
5 The Korean shipbuilding industry 46
6 The Finnish shipbuilding industry 51
7 Factors in competitiveness 54
8 Indicated areas for industry action 63
9 Options for policy development 72
APPENDICES
1 Details of methodology 2 Programme of contacts 3 Outline of best practice assessment methodology 4 Performance and ratings summary 5 Relationship between output and productivity 6 Concentration indices for production 7 Market share and exchange rates
FINAL- 2 October 1992 Commission of the European Communities: Report 2
k,kMG I Peat Marwick
Executive Summary
1 This report has been prepared for the Commission of the European Communities by KPMG Peat Marwick. It sets out the content, findings and conclusions of a study to assess the factors which affect the competitiveness of the European Community shipyards, and to propose ways and means to enhance it in the context of the internal market. The study covers only those yards involved in the new building of seagoing merchant ships of not less than 100 grt.
2 There are many factors that determine competitiveness which was defined as 'the ability to win and execute shipbuilding orders in open competition, and stay in business'. The study has therefore had a broad scope and covered issues surrounding:
market structures and accessibility; • product strategy and innovation; • shipyard effectiveness and efficiencies;
the role of finance.
3 There were three main phases in our approach to the study:
• market analysis of the focus countries, ie the European Community, Japan, Korea and Finland using published information sources;
• comparative data gathering on performance and use of best practice in 40 representative EC yards and eight significant competitors in international product markets in Korea, Japan and Finland. Discussions were also held with a range of shipowners and industry suppliers to integrate their views; analysis of research findings and the development of options for improving competitive performance.
Market share performance
4 The EC share of world ship production remained relatively constant during the 1980s, a period that saw a sharp rise in Korean production and a relative decline in ' Japanese share. In terms of success in winning new orders, the EC has lost competitiveness since 1988. In 1991, for the first time, Korean shipyards won more orders than the total EC industry.
5 EC shipbuilders currently have a relatively strong market share in container and dry cargo ships, and passenger and "other ships". In contrast, share is relatively weak in gas carriers, and very weak in tankers and bulk carriers. This division is not fully explained by the level of technology in the ship.
6 60% of EC production is for EC based shipowners of whom they have a 66% share of demand. In contrast both Japanese and Korean shipbuilders have virtually 100% of demand from their respective home based owners.
FINAL - 2 October 1992 Commission of the European Communities: Report 3
kPil4JiJ Peat Marwick
International comparisons
7 The EC industry is very fragmented. In Japan the seven major groupings account for 92% of order books and over 80% of production, in Korea four companies for 90% of both orders and production, and in Finland two companies for over 80%. With only three major shipbuilding groupings, accounting for about 25% of the industry, the EC industry is predominantly composed of small autonomous companies, though with examples of single yards competing successfully as world leaders in specialist product categories. In contrast there is very strong integration in Japan between shipowners, charterers, suppliers, financial and trading houses and shipbuilders.
8 One consequence of the fragmentation is the very wide variety between yards across the EC industry in terms of business objectives, management approach, use of technology and performance. There would appear to be no strong correlation between performance and shipyard ownership, nor significant differences between single yards as a whole and those which are members of groups. By performance we mean a relatively broad measure encompassing internal efficiency, build cycle times, order winning capability and profitability.
9 On this measure our research has shown that the EC yards can be divided into three groups of approximately equal size: above average, average and below average. There should also be a further division into the 'main international' yards and 'smaller' yards. This division is based not on performance, which is similar for the two divisions, but on how that performance is achieved.
'Smaller' yards typically:
• build for EC based owners and cite other EC builders as the main competition; mainly build dry cargo ships, small tankers, fishing and service vessels; are low overhead operations with limited management resources.
'Main international' yards typically:
• target a wider base of owners and compete more directly with Japanese, Korean and Finnish shipbuilders; mainly build containerships, tankers, bulk carriers, passenger vessels, reefers and dredgers; have more resources in non-direct production activities.
Within 'main international' yards, whilst there are no significant differences on performance measures, our research has shown variations in how that performance is achieved between the types of yard ownership. For example, yards that are part of a shipbuilding group, which are predominantly state owned, tend to have higher levels of investment in advanced technology than other yards. Conversely, independent yards and those owned by shipowners were shown to have higher ratings on marketing and customer related issues.
FINAL - 2 October 1992 Commission of the European Communities: Report 4
k})MJ; I Peat Marwick
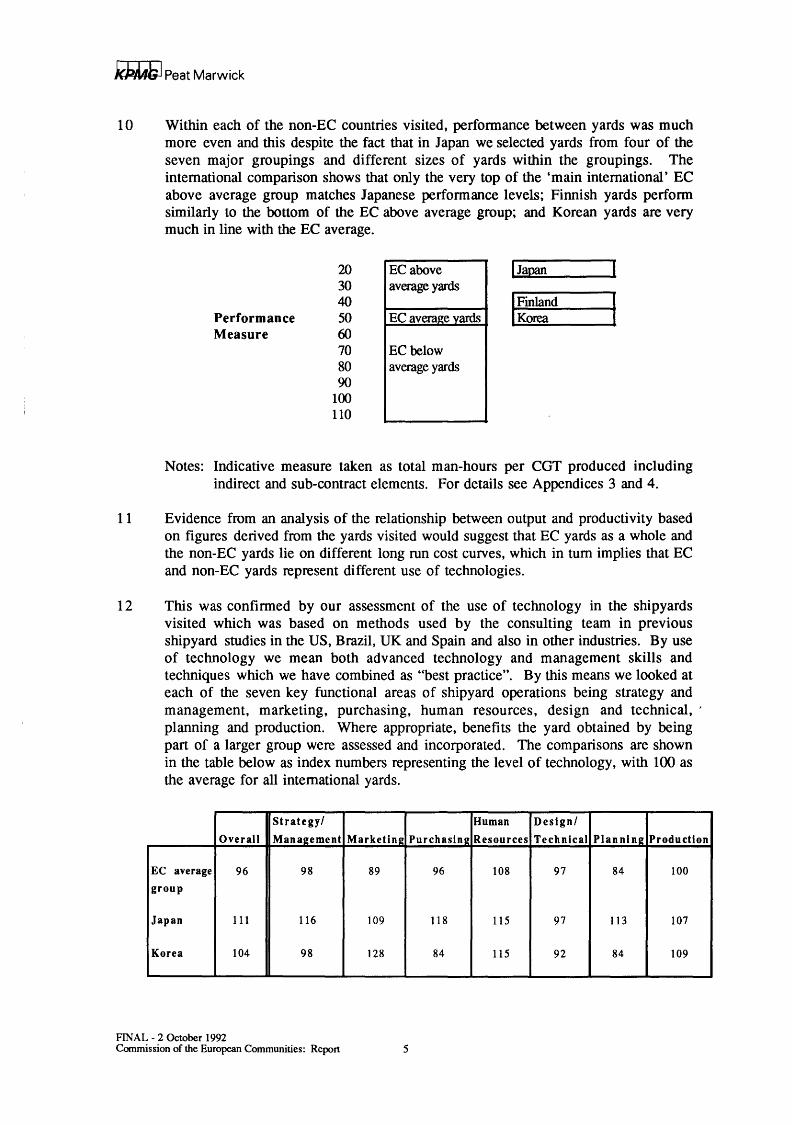
10 Within each of the non-EC countries visited, perfonnance between yards was much more even and this despite the fact that in Japan we selected yards from four of the seven major groupings and different sizes of yards within the groupings. The international comparison shows that only the very top of the 'main international' EC above average group matches Japanese perfonnance levels; Finnish yards perfonn similarly to the bottom of the EC above average group; and Korean yards are very much in line with the EC average.
20 EC above I Japan 30 average yards 40 l::d Performance 50 EC avera_g_e yards
Measure 60 70 EC below 80 average yards 90
100 110
Notes: Indicative measure taken as total man-hours per CGT produced including indirect and sub-contract elements. For details see Appendices 3 and 4.
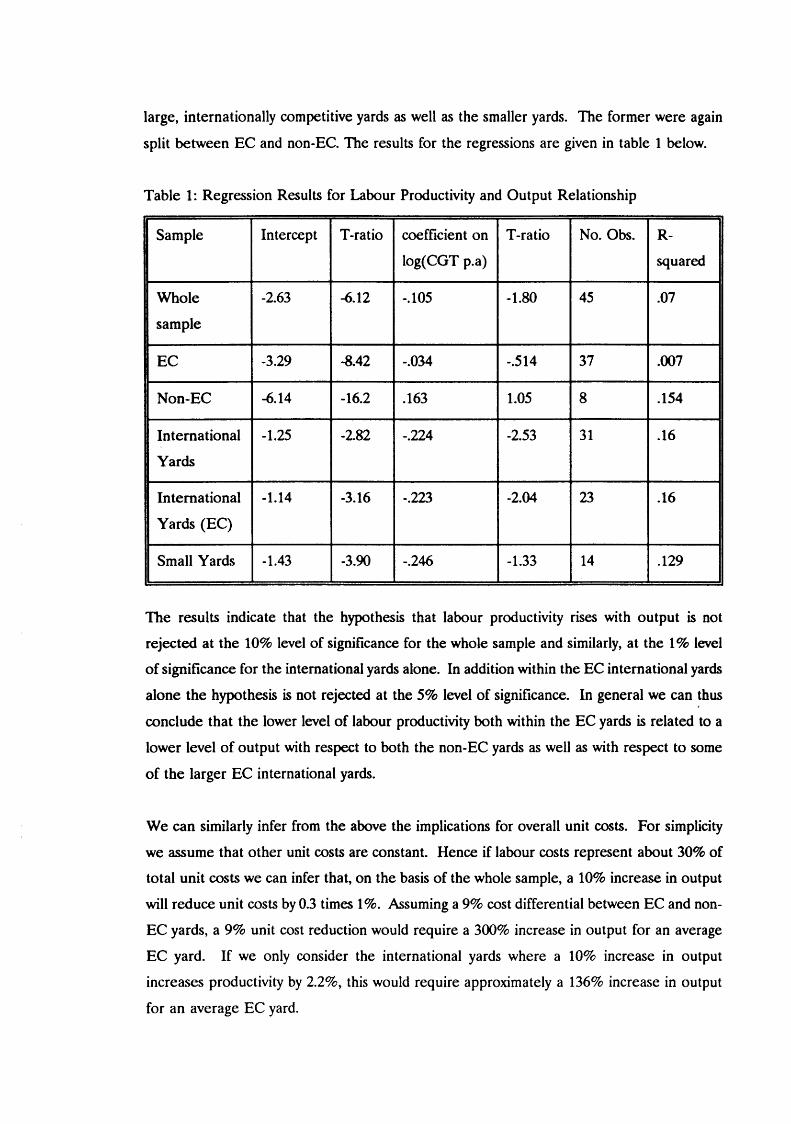
11 Evidence from an analysis of the relationship between output and productivity based on figures derived from the yards visited would suggest that EC yards as a whole and the non-EC yards lie on different long run cost curves, which in tum implies that EC and non-EC yards represent different use of technologies.
12 This was confinned by our assessment of the use of technology in the shipyards visited which was based on methods used by the consulting team in previous shipyard studies in the US, Brazil, UK and Spain and also in other industries. By use of technology we mean both advanced technology and management skills and techniques which we have combined as "best practice". By this means we looked at each of the seven key functional areas of shipyard operations being strategy and management, marketing, purchasing, human resources, design and technical, ' planning and production. Where appropriate, benefits the yard obtained by being part of a larger group were assessed and incorporated. The comparisons are shown in the table below as index numbers representing the level of technology, with 100 as the average for all international yards.
Strategy/ Human Design/
Overall Mana_g_ement Marketing Purchasing Resources Technical Planning Production
EC average 96 98 89 96 108 97 84 100 group
Japan 111 116 109 118 115 97 113 107
Korea 104 98 128 84 115 92 84 109
FINAL- 2 October 1992 Commission of the European Communities: Report 5
/(pMJ;I Peat Marwick
13 The overview results do show significantly more use of best practice in Japanese yards compared to the EC average group, with the exception of the design/technical area. Korean yards were broadly similar to the EC average group but with particular strengths in marketing and weakness in purchasing. The Finnish figures are not directly comparable because they relate almost exclusively to passengership building. However, there is strength in marketing, design/technical, planning and production.
Strategy/ Human Design/ Overall Manaeement Marketine Purchasine Resources Technical Plannine Production
Finland 106 95 114 91 94 120 Ill 108
Variations between European shipyards
14 There are similarly significant differences in the adoption of best practice across EC yards.
Strategy/ Human Design/ Overall Mana2ement Marketine PurchasinJl Resources Technical Plannin2 Production
EC above 117 134 122 118 115 110 115 107 average
EC average 96 98 89 96 108 97 84 100
EC below 88 75 85 86 81 97 100 89 avera2e
15 On strategy and management issues, the above average performing yards have a high degree of focus on a specific target market. This focus links through to clear , management objectives and actions in each functional area. In contrast, the below average yards stress the need for flexibility and tend to be trying to service a number of different markets with a mix of one-off builds and short series. This leads to confusion in co-ordinating departmental organisation structures and in the allocation of resources.
16 On marketing, the higher performing yards tend to have clearly identified and targeted owners, have a policy of pro-active contact with shipowners, see after-sales as another contact opportunity not just a cost, and use their own resources with minimum use of agents. The below average yards tend to be totally re-active to enquiries, view orders as one-offs rather than part of a long term relationship with shipowners, have no clear product development priorities and have very few resources in sales and marketing. In some yards only two or three individuals out of 4,000 plus had sales responsibilities. In contrast, Japanese and better performing EC yards devoted about 2.5% of manpower to this business winning role.
FINAL- 2 October 1992 Commission of the European Communities: Report 6
.k}))AJ; I Peat Marwick
17 In purchasing, the above average yards tended to have reduced to only two or three suppliers in each area, to operate with few sourcing restrictions and to have explored economies of scale by linking on purchasing with other yards. The below average yards tended to operate within more constraints imposed by their lack of knowledge or external financing sources and to use traditional buyer/supplier relationships.
1 8 In human resources, the major differences between the above and below average yards are in four key areas:
• the emphasis on upgrading skills; • the effort to restructure the workforce through recruitment; • the degree of employee empowerment; • mu1ti-skilling and re-skilling.
1 9 On design and technical issues, above average yards have invested heavily in CAD/CAM systems and equipment with careful implementation, the production of specific workstation information and increasingly full CAD/CAM generation of manufacturing information with DNC links. Some of the average and below average yards have made the investment but implementation has been ineffective and not integrated with other operations.
20 In planning for production, the high performing yards have decentralised multi-level planning systems with clearly defined outputs at each level, a work package approach to organisation of worlc, formal Build Strategy documentation, computerised material control systems and pre-production marshalling of kits of parts. The below average yards are ineffective in these areas.
2 1 On production, above average yards have short build cycles to maximise the use of facilities. This is achieved by implementing workstation concepts with clearly defined process flows, superior build sequences and early outfitting techniques. There is a high priority on accuracy control and both designing and organising out needless work. Below average yards tend to use a more traditional sequential approach to ship construction.
FINAL- 2 October 1992 Commission of the European Communities: Report 7
~Peat Marwick
22 Our study has shown a clear relationship between the use of best practices, improved performance and profitability. This can be summarised as:
Best practice Performance Profitability measure measure measure
EC above average 117 150 91
EC average 96 105 70
EC below average 88 65 23
NB: Profitability measure is based on percentage of Chief Executives claiming their yard is currently breaking even or in profit. For details see Section 3.16.
Agenda for the EC shipbuilding industry
2 3 The objective of the EC industry must be to meet the needs of worldwide shipowners better than its competitors. If allowed to compete on a fair basis with the best in the world, the industry will be better placed to meet the needs of Community shipowners, and on a more general basis the Community marine and transportation sectors. That success is possible is shown by those EC yards which have achieved a position of world class competitiveness by identifying a sector to compete in and organising themselves and the resources available in the most effective way.
24 The AWES market projections show rapid growth in the total worldwide demand for shipbuilding in the late 1990s. Japanese and Korean industries are planning for further dramatic improvements in productivity by the year 2000. To at least maintain the EC share at about 23% of world production, the key priorities for EC shipbuilders must be to:
maintain access to current markets; • reduce its cost base;
meet increased demand through productivity improvement; ensure it can build the right products.
2 5 Most yards are planning for productivity improvements in the range of 3 to 6% a year in the short term but many do not have such targets. This level of internal development is insufficient to improve the competitive position of the industry significantly. Among the average and below average yards, there appears to be little recognition or acceptance of the differences in performance between yards - or awareness of the reasons for those differences.
2 6 There is relatively little, though increasing, co-operation within the industry in comparison to Japan. The major motivation is for economies of scale, particularly in purchasing, but also in project design and, to a lesser extent, facilities sharing. There are few effective mechanisms for technology transfer.
FINAL- 2 October 1992 Commission of the European Communities: Report 8
i(j)-ILfJ;J Peat Marwick
27 The tasks for the management teams of EC shipyards therefore are to:
• ensure the use of appropriate best practice in all areas; develop opportunities to access economies of scale and transfer of technology through increased co-operation with other economic operators.
2 8 The objective for the industry, and the determinant of long term competitiveness, must be that each shipyard should have:
a clear business strategy focusing on core product markets and stating how it will compete and how it will organise itself to compete; a clear, fully resourced marketing programme, appropriate product development activity and a considered after sales policy; a purchasing policy featuring a minimum number of suppliers, effective supply chain management and strategic use of sub-contracting; human resources management emphasing skills upgrading and multiskilling, distributed decision making and effective recruitment; design and technical systems with appropriate use of technology and integration into downstream systems; planning and production engineering to improve build strategies and minimise build cycle times;
• appropriate production facilities, technologies and automation.
Constraints external to the shipyards
29 While a large part of the difference in competitive performance between the industries reviewed can be explained by reference to the use of best practice, there are a number of significant constraints on EC shipbuilders which include:
home credit schemes and national building programmes in both Korea and Japan which effectively exclude EC builders from these markets; unfair competition from Korea through non-OECD rules finance schemes; an inability to access comparable economies of scale because of the fragmented industry structure both in shipbuilding and the supply industry;
• sourcing constraints through the continuation of internal barriers and nonharmonised standards in the EC marine equipment internal market; a comparatively low R&D capability, particularly against Japan and Korea, where shipbuilders can more easily transfer technology from related group companies and have the support of the massive R&D facilities within the heavy industries groupings of which they are part, as well as drawing upon the government sponsored infrastructure. exchange rate movements given that market prices are usually in US $.
3 0 It is clear that there are markets which are not open for fair competition from EC shipbuilders with effective entry barriers to Japanese and Korean markets which account for 27% of total world demand. Also there is evidence that orders are being won in the EC market by Korean shipbuilders offering terms more attractive than OECD guidelines. Continuing priority should be given by the Commission to negotiating the elimination of these unfair competitive practices through OECD and other mechanisms and to reviewing the positive use of existing mechanisms including matching credit facilities, New Commercial Policy Instruments and countervailing duties.
FINAL- 2 October 1992 Commission of the European Communities: Report 9
}(J;Ml;l Peat Marwick
3 1 Within Japanese shipowners there would appear to be low awareness of the current capabilities of EC builders which is, in part, a reflection of the success of the entry barriers. Given the scale of the problem and the strength of the Japanese market, it is unlikely that the industry would be able to fund the necessary programme to increase awareness and promote EC shipbuilders. There is a case for establishing a 'EC Ship Centre' in both Japan and Korea which could have responsibilities including:
• promotion of the EC shipbuilding (and marine equipment) industries; • identifying equipment sourcing opportunities for EC shipbuilders; • monitoring developments and competitiveness in the market;
identifying and promoting joint ventures and co-operative working.
The establishment of such centres would potentially have an important signalling role in developing appropriate bi-lateral arrangements.
32 The measures taken under the seventh directive on shipbuilding are leading to a convergence of subsidies within an overall policy of eventual. elimination. Shipyard competitiveness is also impacted by the continuation of differentials across the Community, particularly in terms of:
• home credit schemes in those aspects not covered by the seventh directive; • standards and non-tariff barriers for equipment and materials; • restrictions linked to financing arrangements on sourcing of materials and
equipment.
From the perspective of an efficient shipbuilding industry, we believe that these areas should be harmonised across the Community in a non-discriminatory manner applicable across internal borders.
3 3 Judging by the general reaction of shipbuilders included in our programme, the Maritime Industries Forum would appear to have been well received in terms of the information exchange and process for developing common views. We recommend that this concept is extended into a series of fora/conventions organised on a pan- , European basis and dedicated in turn to each of the areas of best practice within shipbuilding. Each forum would focus on case studies from one or more of the centres of excellence and on practical implementation in different circumstances.
34 A key feature of the Japanese structure is the support contract for transferring technology between shipyards in the same grouping, or in some cases in different groupings. We are aware of very few examples within the European Community. We believe that this process of yard to yard transfer should be positively encouraged by the Commission and particularly where cross-border transfers of best practice are involved.
FINAL- 2 October 1992 Commission of the European Communities: Report 10
k))JLtG I Peat Marwick
35 The R&D framework supporting the industry is extensive and multi-layered. However, given the fragmented nature of the industry, in our view there is a role that is not currently being filled and that is an overall co-ordination role within a clear perspective of a future market. This role is to:
• clearly articulate a future market demand, for example road-to-sea transportation similar to the Japanese TSL project. In most cases these would be developed out of the overall EC maritime industries policy. The articulation would require a specification of the needs to be met and likely market size and would demand close consultation with potential owners;
• analyse the required underlying technologies and identify the state of the art, proposing transfer from other industries as appropriate; catalyse development where there are gaps in technologies;
• ensure technology transfer into the EC industry for competitive commercialisation.
3 6 The Maritime Industries Forum is a potential mechanism for fulfilling this role. On completion of its current programme, we recommend that the results of the Forum are reviewed against the role that has been identified here, with a view to putting it onto a permanent basis.
3 7 The competitiveness of the EC shipbuilding industry is dependent upon the equipment supply industry. Imports of machinery built in Korea or Japan under European licences are increasing and the EC industry broadly consists of a large variety of mostly medium-sized companies. The ability of this industry to meet the future needs of EC shipbuilders and their incorporation into an overall maritime policy requires urgent review.
3 8 The European Commission has already initiated the wider debate through the Martime Industries Forum, to assist in developing a policy to improve the competitiveness of the EC maritime sector. This report can only re-emphasise the need for such an integrated approach. We would recommend that DGIII looks to issue a green paper following up the Forum and parallel research programmes, which will assist in creating an appropriate business environment for the EC industry by providing a longer term policy framework for market development, and be a major , component for a fully integrated EC transport policy.
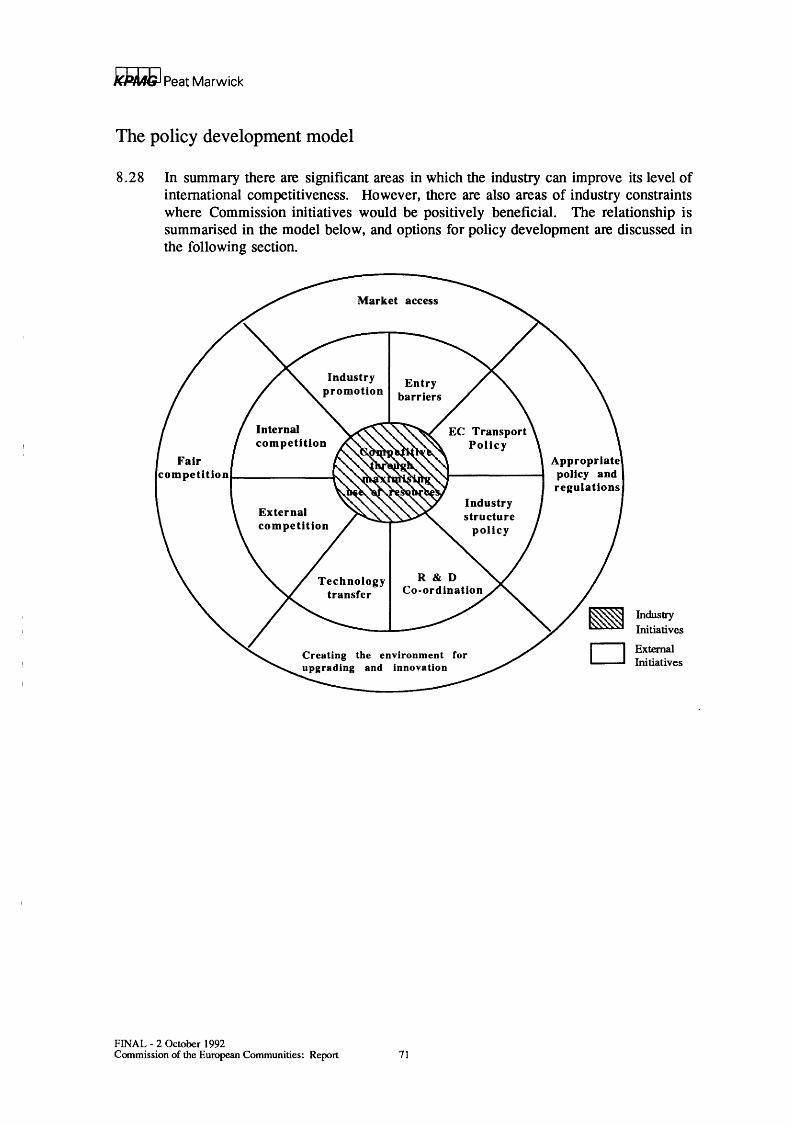
Overview
3 9 The EC shipbuilding industry has lost market share in terms of new orders and there are many recent reports of yards with low or zero order books, and indeed corporate failures. However, within this general picture of gloom, there is a minority of yards with high capacity utilisation and extended order books. While the detailed story for each successful yard is unique, our study has shown a common thread to be awareness of best practice and positive moves to achieve improved levels of performance.
40 Our study has also shown that among many of the average and below average yards, there is little acceptance of the differences that exist or understanding of the reasons for them. Unless this situation changes dramatically, there is little reason to suppose that the total EC share of the world market will recover, or even hold at its currently depressed level.
FINAL- 2 October 1992 Commission of the European Communities: Report 11
}(j;Jl$ I Peat Marwick
41 However, whilst emphasing that the major areas of potential improvement are within the control of individual shipyards, we have identified a number of industry constraints where Commission initiatives would be positively beneficial.
42 Our survey has shown no indication of a 'natural' market share for the EC industry. A major finding is that non-EC shipbuilders appear to have better contact with, and better understanding of the needs of, shipowners - including EC owners. If this position continues, then the competitiveness of the European Community industry will continue to decline.
FINAL- 2 October 1992 Commission of the European Communities: Report 12
kP/l4hJ Peat Marwick
1 Introduction
1.1 This report has been prepared for the Commission of the European Communities by KPMG Peat Marwick in association with First Marine International, specialist shipbuilding industry consultants.
1. 2 It sets out the content, findings and conclusions of a study to assess the factors which affect the competitiveness of the European Community shipyards, and to propose ways and means to enhance it in the context of the internal market. The study was to cover only the shipbuilding yards as defined under Article 1 of the Council Directive on aid to shipbuilding (90/684/EEC), ie those involved in the new building of sea going merchant ships of not less than 100 grt.
Detailed terms of reference
1. 3 The study brief issued by DGIII specifies that the study should evaluate inter alia:
• the role of production organisation; • advantages and limits of series production; • labour productivity (role of training); • the importance of design and technology features; • the importance of supplies.
1.4 When making the assessments above, the study should give particular emphasis to:
• the importance of co-operation and sub-contracting particularly as regards production, marketing and technology;
• the main differences of competitive levels between Community yards; • the comparison with the situation in countries outside the EC, namely
Finland, Japan and Korea, in particular as far as the cost structures are concerned.
1.5 Finally the study should present concrete proposals on ways and means of improving the general level of competitiveness of Community yards.
Three key points as study guidelines
1.6 The approach has been market-driven. The markets and criteria for success with small coasters or fishing vessels are very different from those for very large crude carriers (VLCCs) or cruise liners. Our approach has recognised this and significant differences have been reflected in our recommendations.
FINAL- 2 October 1992 Commission of the European Communities: Report 13
kb/l4GJ Peat Marwick
1. 7 There are many factors that determine competitiveness which was defined as 'the ability to win and execute shipbuilding orders (in open competition) and stay in business'. The study has therefore had a broad scope and covered issues surrounding:
• market structures and accessibility; • product strategy and innovation; • shipyard effectiveness and efficiencies; • the role of finance.
1. 8 The study terms of reference focus on improving the competitiveness of the whole European Community industry in the world market. The study therefore has not covered issues of intra-Community competition or differences in national industries except where relevant to the overall objective.
Approach and methodology
1. 9 There were three main phases in our approach to the study:
• Market analysis of the focus countries, ie the European Community, Japan, Korea and Finland using published information sources.
• Detailed comparative data gathering on performance and use of 'best practice' in a cross-section of European Community yards agreed with national trade associations, and also significant competitors in international product markets in Korea, Japan and Finland. Discussions were also held with a range of shipowners and industry suppliers to integrate their views.
• Analysis of the research findings and the development of options for improving competitive performance.
1. 10 Details of the contacts made and best practice assessment methodologies are shown in the appendices to this report.
FINAL- 2 October 1992 Commission of the European Communities: Report 14
k.PJWG I Peat Marwick
2 Current market position and market share
The Economic Importance of the Shipbuilding Sector
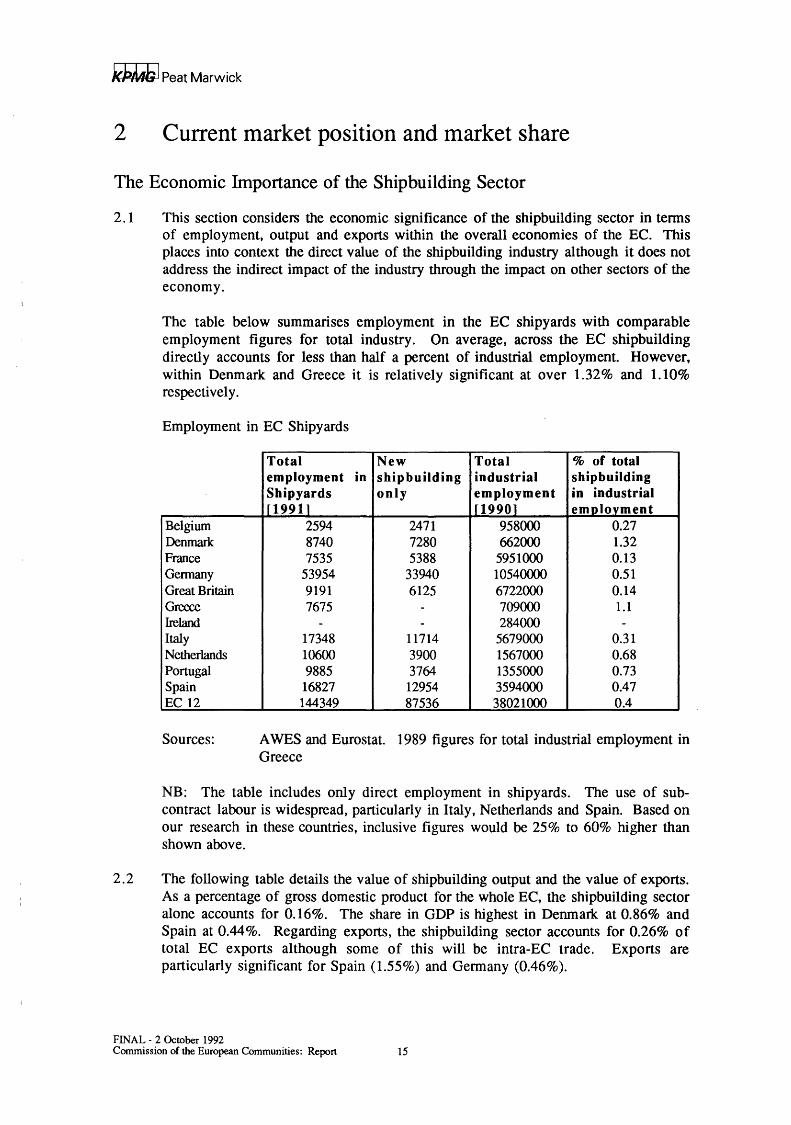
2. 1 This section considers the economic significance of the shipbuilding sector in terms of employment, output and exports within the overall economies of the EC. This places into context the direct value of the shipbuilding industry although it does not address the indirect impact of the industry through the impact on other sectors of the economy.
The table below summarises employment in the EC shipyards with comparable employment figures for total industry. On average, across the EC shipbuilding directly accounts for less than half a percent of industrial employment. However, within Denmark and Greece it is relatively significant at over 1.32% and 1.10% respectively.
Employment in EC Shipyards
Total New Total % of total employment in ship building industrial shipbuilding Shipyards only employment in industrial [ 1991] [1990] employment
Sources: AWES and Eurostat. 1989 figures for total industrial employment in Greece
NB: The table includes only direct employment in shipyards. The use of subcontract labour is widespread, particularly in Italy, Netherlands and Spain. Based on our research in these countries, inclusive figures would be 25% to 60% higher than shown above.
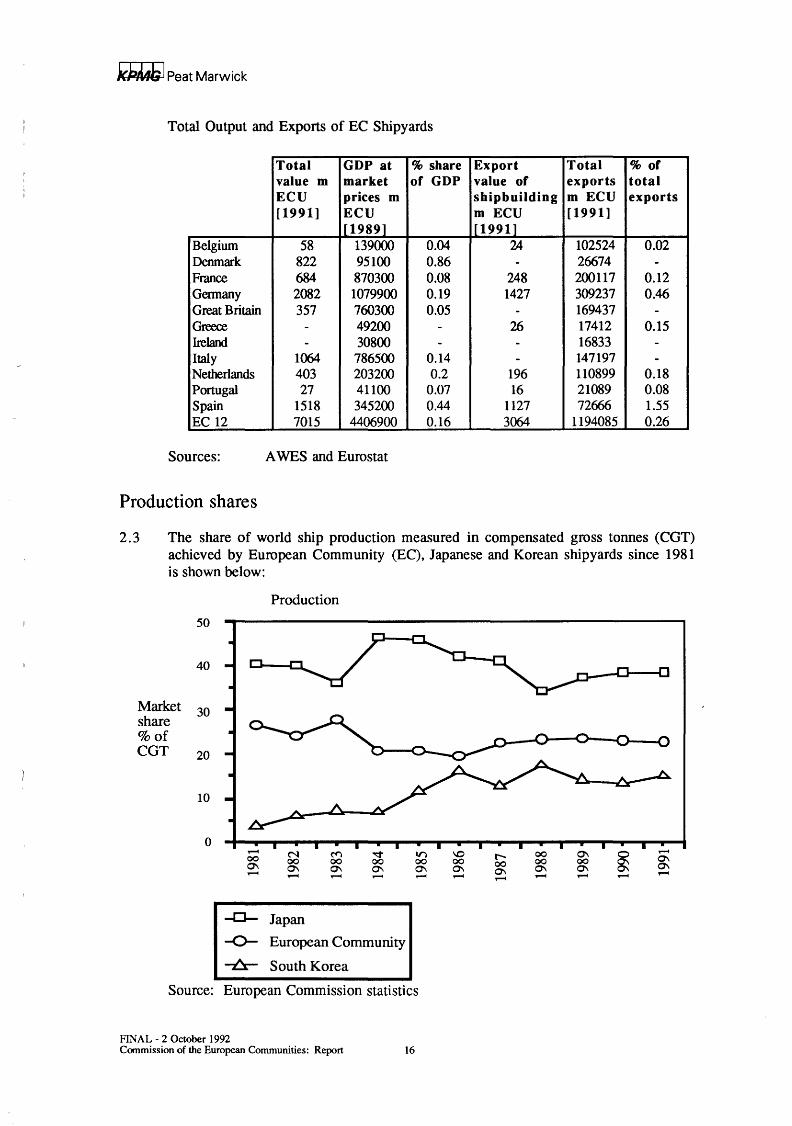
2. 2 The following table details the value of shipbuilding output and the value of exports. As a percentage of gross domestic product for the whole EC, the shipbuilding sector alone accounts for 0.16%. The share in GDP is highest in Denmark at 0.86% and Spain at 0.44%. Regarding exports, the shipbuilding sector accounts for 0.26% of total EC exports although some of this will be intra-EC trade. Exports are particularly significant for Spain (1.55%) and Germany (0.46%).
FINAL - 2 October 1992 Commission of the European Communities: Report 15
kJ:'MJi I Peat Marwick
Total Output and Exports of EC Shipyards
Total GDP at %share Export Total %of value m market of GDP value of exports total ECU prices m shipbuilding m ECU exports [1991] ECU m ECU [1991]
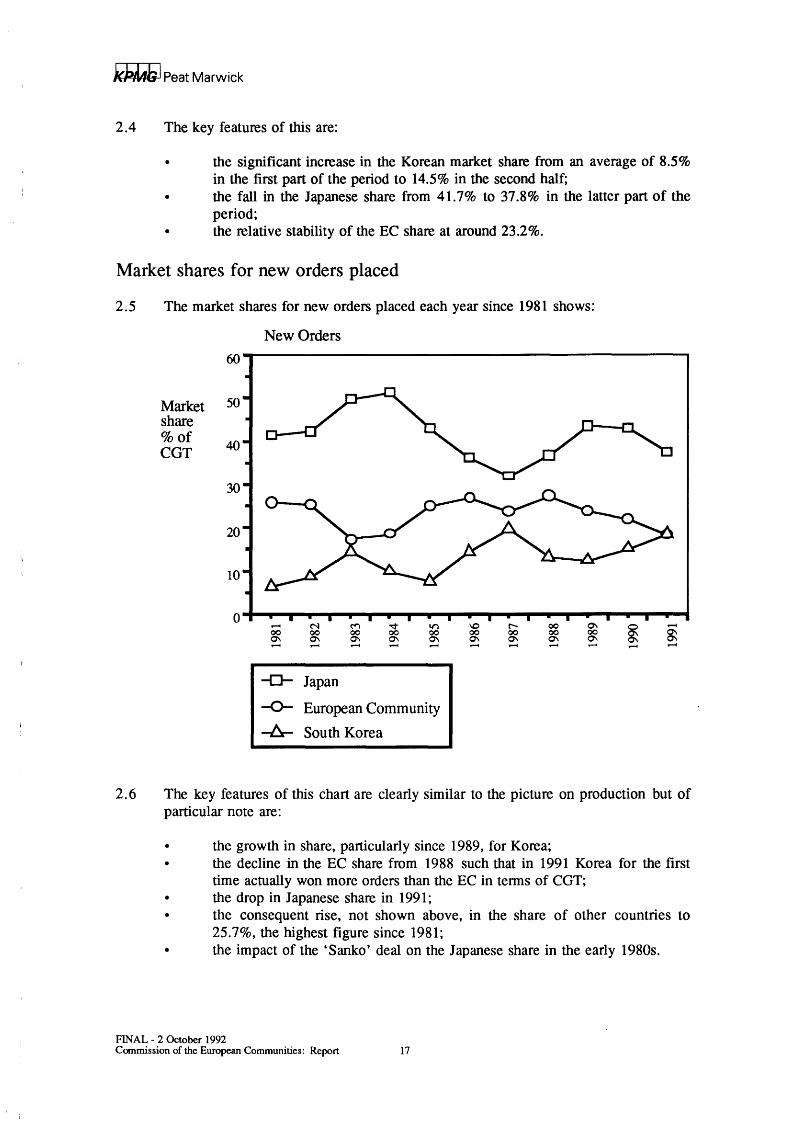
2. 3 The share of world ship production measured in compensated gross tonnes (CGT) achieved by European Community (EC), Japanese and Korean shipyards since 1981 is shown below:
2.6 The key features of this chart are clearly similar to the picture on production but of particular note are:
the growth in share, particularly since 1989, for Korea; • the decline in the EC share from 1988 such that in 1991 Korea for the first
time actually won more orders than the EC in terms of COT; • the drop in Japanese share in 1991; • the consequent rise, not shown above, in the share of other countries to
25.7%, the highest figure since 1981; • the impact of the 'Sanko' deal on the Japanese share in the early 1980s.
FINAL- 2 October 1992 Commission of the European Communities: Report 17
i(J;Mbl Peat Marwick
Market shares by product groups
2. 7 There is considerable variation in the year to year production of individual ship types. The chart below shows the average share of production within Korea, Japan, Finland and the EC, by ship type for the three year period 1989 - 1991 together with an indication of trend. For comparison an analysis of their order book as at January 1992 is shown alongside.
% share of CGT % share of CGT production Trend order book
• the significance of tankers and gas carriers in the order book, 46.6% of total CGT compared with 28.1% of production in 1989- 1991;
• the apparent relative decrease in order book in dry cargo and other ships. · However, it should be noted that these two markets tend to be both more , local in nature and made up of smaller ships with short lead times on ordering;
• the significant decline in the production of fishing vessels during the time period.
FINAL- 2 October 1992 Commission of the European Communities: Report 18
kkfltG I Peat Marwick
Shares by product sector
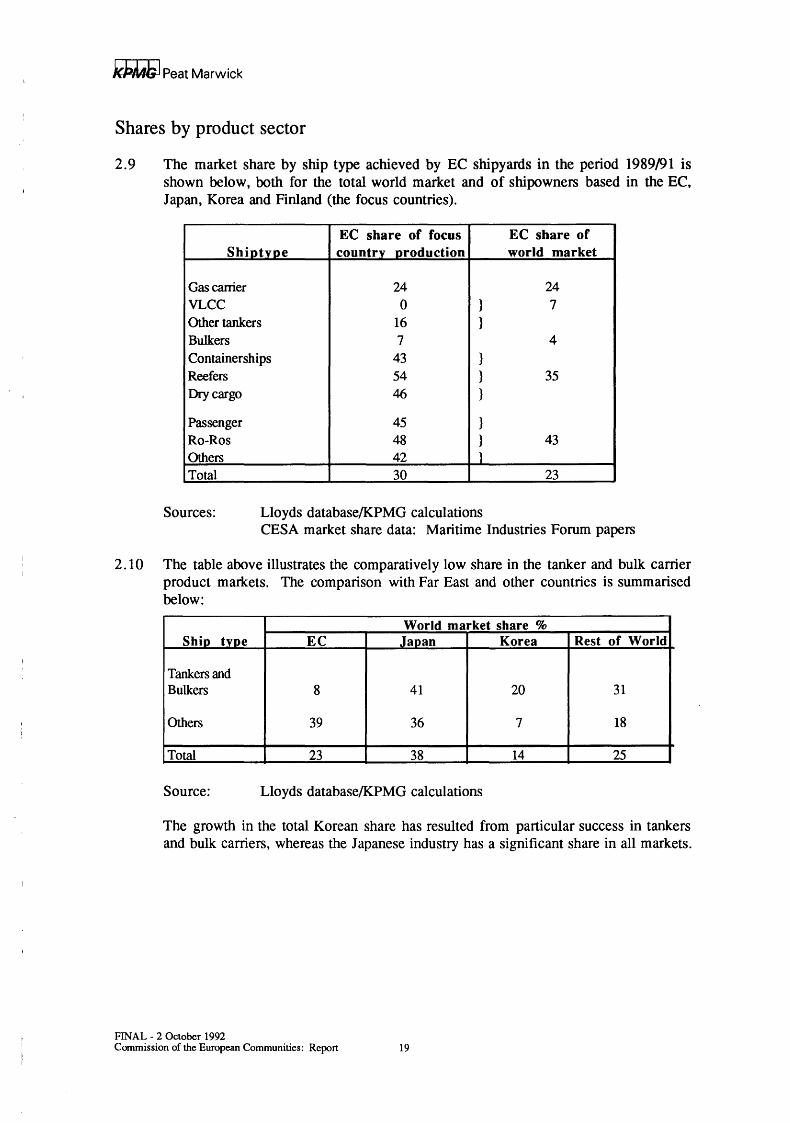
2.9 The market share by ship type achieved by EC shipyards in the period 1989/91 is shown below, both for the total world market and of shipowners based in the EC, Japan, Korea and Finland (the focus countries).
EC share of focus EC share of Shiotvoe country production world market
2.10 The table above illustrates the comparatively low share in the tanker and bulk carrier product markets. The comparison with Far East and other countries is summarised below:
World market share % Ship type EC Japan Korea Rest of World
Tankers and Bulkers 8 41 20 31
Others 39 36 7 18
Total 23 38 14 25
Source: Lloyds database/KPMG calculations
The growth in the total Korean share has resulted from particular success in tankers and bulk carriers, whereas the Japanese industry has a significant share in all markets.
FINAL- 2 October 1992 Commission of the European Communities: Report 19
j())MJ; I Peat Marwick
Market shares and shipowner nationalities
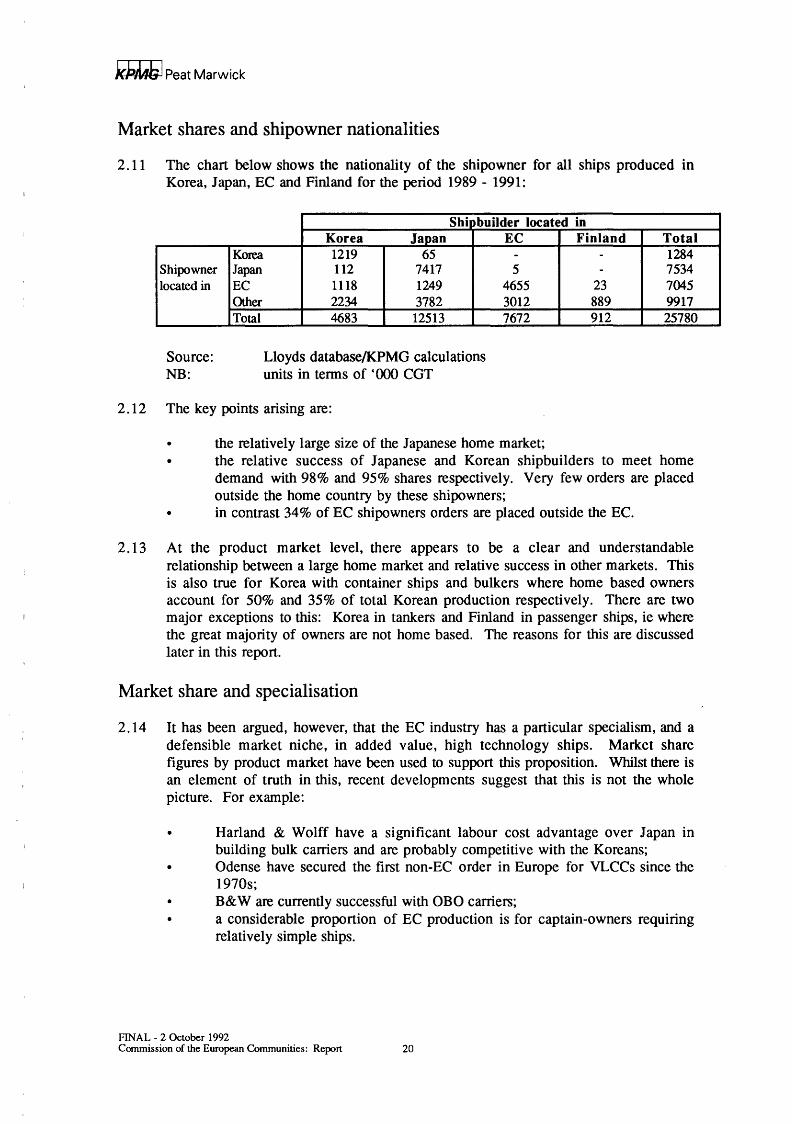
2.11 The chart below shows the nationality of the shipowner for all ships produced in Korea, Japan, EC and Finland for the period 1989- 1991:
Shh builder located in
Korea Shipowner Japan located in EC
Other Total
Source: NB:
Korea Japan 1219 65 112 7417 1118 1249 2234 3782 4683 12513
Lloyds database/KPMG calculations units in terms of '000 CGT
2.12 The key points arising are:
EC -5
4655 3012 7672
• the relatively large size of the Japanese home market;
Finland --
23 889 912
Total 1284 7534 7045 9917 25780
• the relative success of Japanese and Korean shipbuilders to meet home demand with 98% and 95% shares respectively. Very few orders are placed outside the home country by these shipowners;
• in contrast 34% of EC shipowners orders are placed outside the EC.
2.13 At the product market level, there appears to be a clear and understandable relationship between a large home market and relative success in other markets. This is also true for Korea with container ships and bulkers where home based owners account for 50% and 35% of total Korean production respectively. There are two major exceptions to this: Korea in tankers and Finland in passenger ships, ie where the great majority of owners are not home based. The reasons for this are discussed later in this report.
Market share and specialisation
2.14 It has been argued, however, that the EC industry has a particular specialism, and a defensible market niche, in added value, high technology ships. Market share figures by product market have been used to support this proposition. Whilst there is an element of truth in this, recent developments suggest that this is not the whole picture. For example:
• Harland & Wolff have a significant labour cost advantage over Japan in building bulk carriers and are probably competitive with the Koreans;
• Odense have secured the first non-EC order in Europe for VLCCs since the 1970s;
• B&W are currently successful with OBO carriers; • a considerable proportion of EC production is for captain-owners requiring
relatively simple ships.
FINAL- 2 October 1992 Commission of the European Communities: Report 20
/{})MJ; I Peat Marwick
2.15 Looking at the possible threats to such a position:
• the Japanese industry is clearly targeting the added value sector and particularly cruise vessels and gas carriers;
• the Koreans emphasise the need to upgrade and have invested significantly in LNG developments;
• some shipowners, a minority as yet, suggest ships are becoming too sophisticated for effective operations and are forecasting a move back to simpler products.
2. 16 The clear danger with a niche strategy is evidenced by the European motor cycle industry and many others where apparently defensible positions, at least apparent to those in the industry, existed only until the competition chose to focus on the area and develop appropriate products. The alternative approach is to target specific market sectors and to create a strong competitive position to win share from competition.
FINAL- 2 October 1992 Commission of the European Communities: Report 21
kkMG I Peat Marwick
3 The European Community shipbuilding industry
Basic structural features
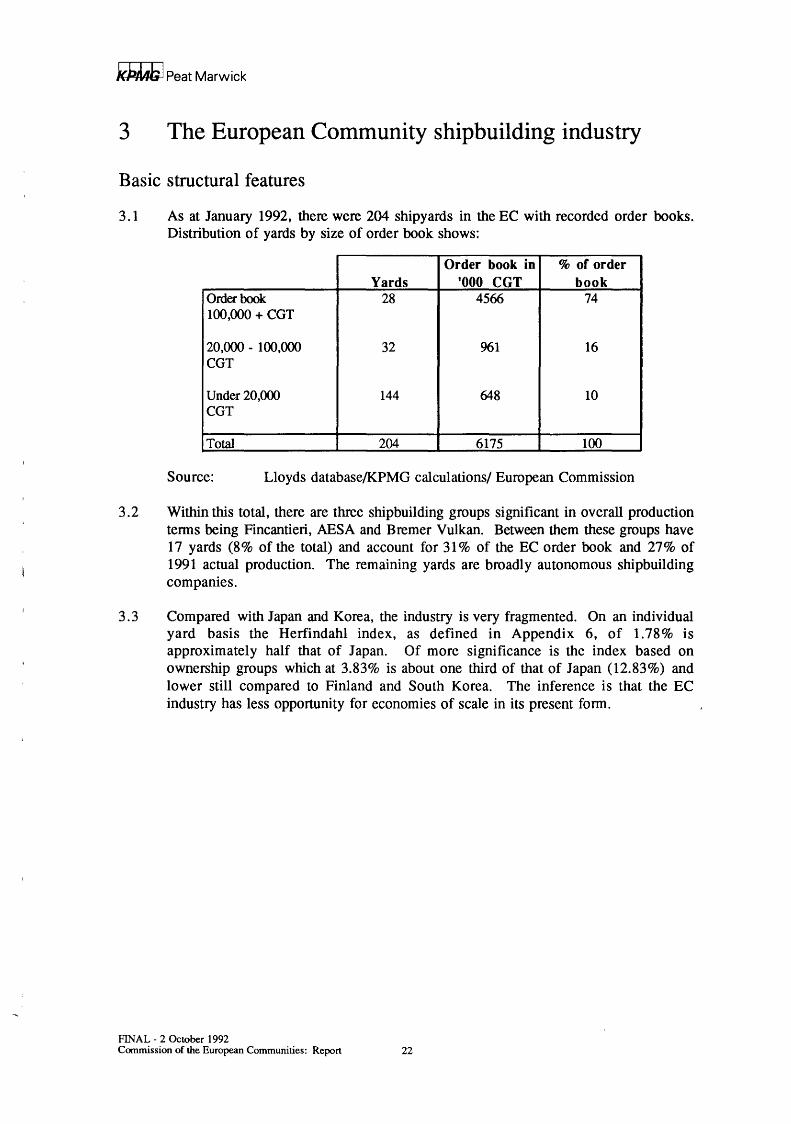
3.1 As at January 1992, there were 204 shipyards in the EC with recorded order books. Distribution of yards by size of order book shows:
Order book in % or order Yards '000 CGT book
Order book 28 4566 74 100,000 + CGT
20. ()()() - 1 00,000 32 961 16 CGT
Under 20,000 144 648 10 CGT
Total 204 6175 100
Source: Lloyds database/KPMG calculations/ European Commission
3.2 Within this total, there are three shipbuilding groups significant in overall production terms being Fincantieri, AESA and Bremer Vulkan. Between them these groups have 17 yards (8% of the total) and account for 31% of the EC order book and 27% of 1991 actual production. The remaining yards are broadly autonomous shipbuilding companies.
3.3 Compared with Japan and Korea, the industry is very fragmented. On an individual yard basis the Herfindahl index, as defined in Appendix 6, of 1.78% is approximately half that of Japan. Of more significance is the index based on ownership groups which at 3.83% is about one third of that of Japan (12.83%) and lower still compared to Finland and South Korea. The inference is that the EC industry has less opportunity for economies of scale in its present form.
FINAL- 2 October 1992 Commission of the European Communities: Report 22
k.hJl«il Peat Marwick
Ownership
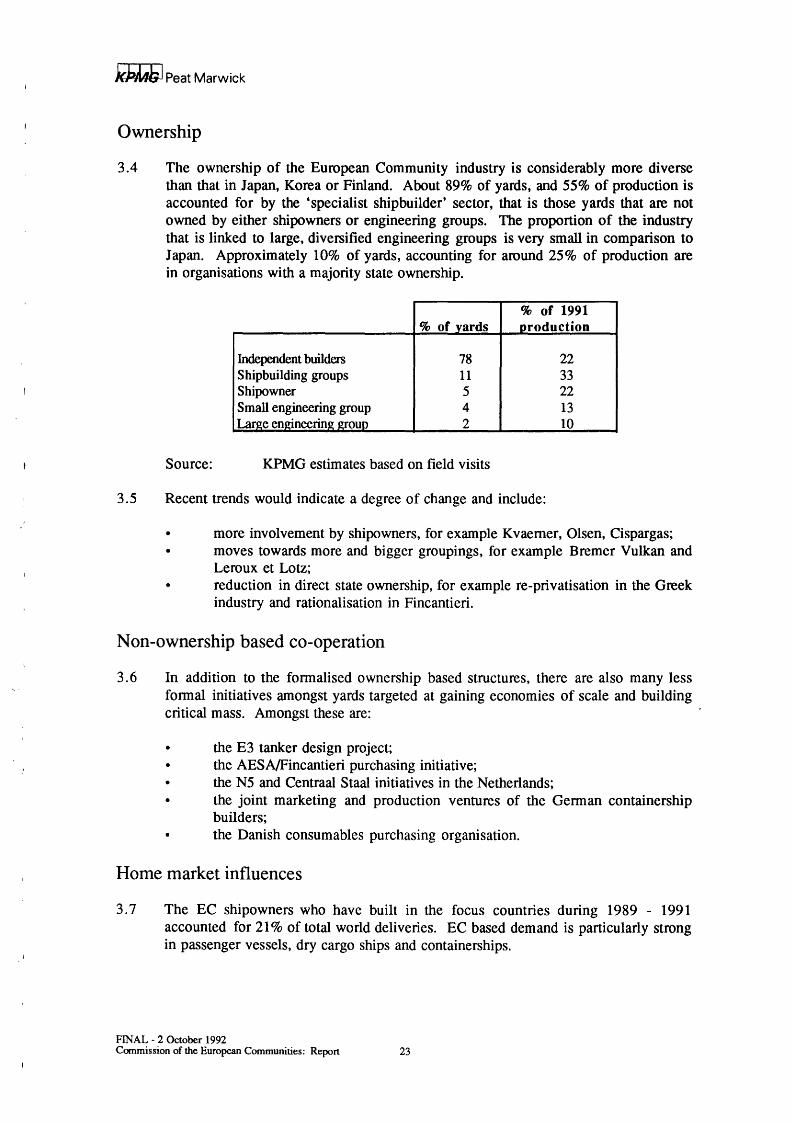
3.4 The ownership of the European Community industry is considerably more diverse than that in Japan, Korea or Finland. About 89% of yards, and 55% of production is accounted for by the 'specialist shipbuilder' sector, that is those yards that are not owned by either shipowners or engineering groups. The proportion of the industry that is linked to large, diversified engineering groups is very small in comparison to Japan. Approximately 10% of yards, accounting for around 25% of production are in organisations with a majority state ownership.
% of 1991 % of yards production
Independent build~ 78 22 Shipbuilding groups 11 33 Shipowner 5 22 Small engineering group 4 13 Large engineering group 2 10
Source: KPMG estimates based on field visits
3.5 Recent trends would indicate a degree of change and include:
• more involvement by shipowners, for example Kvaemer, Olsen, Cispargas; moves towards more and bigger groupings, for example Bremer Vulkan and Leroux et Lotz; reduction in direct state ownership, for example re-privatisation in the Greek industry and rationalisation in Fincantieri.
Non-ownership based co-operation
3. 6 In addition to the formalised ownership based structures, there are also many less formal initiatives amongst yards targeted at gaining economies of scale and building critical mass. Amongst these are:
• the E3 tanker design project; • the AESA/Fincantieri purchasing initiative; • the N5 and Centraal Staal initiatives in the Netherlands; • the joint marketing and production ventures of the German containership
builders; the Danish consumables purchasing organisation.
Home market influences
3.7 The EC shipowners who have built in the focus countries during 1989 - 1991 accounted for 21% of total world deliveries. EC based demand is particularly strong in passenger vessels, dry cargo ships and containerships.
FINAL- 2 October 1992 Commission of the European Communities: Report 23
I , I
kP/W; I Peat Marwick
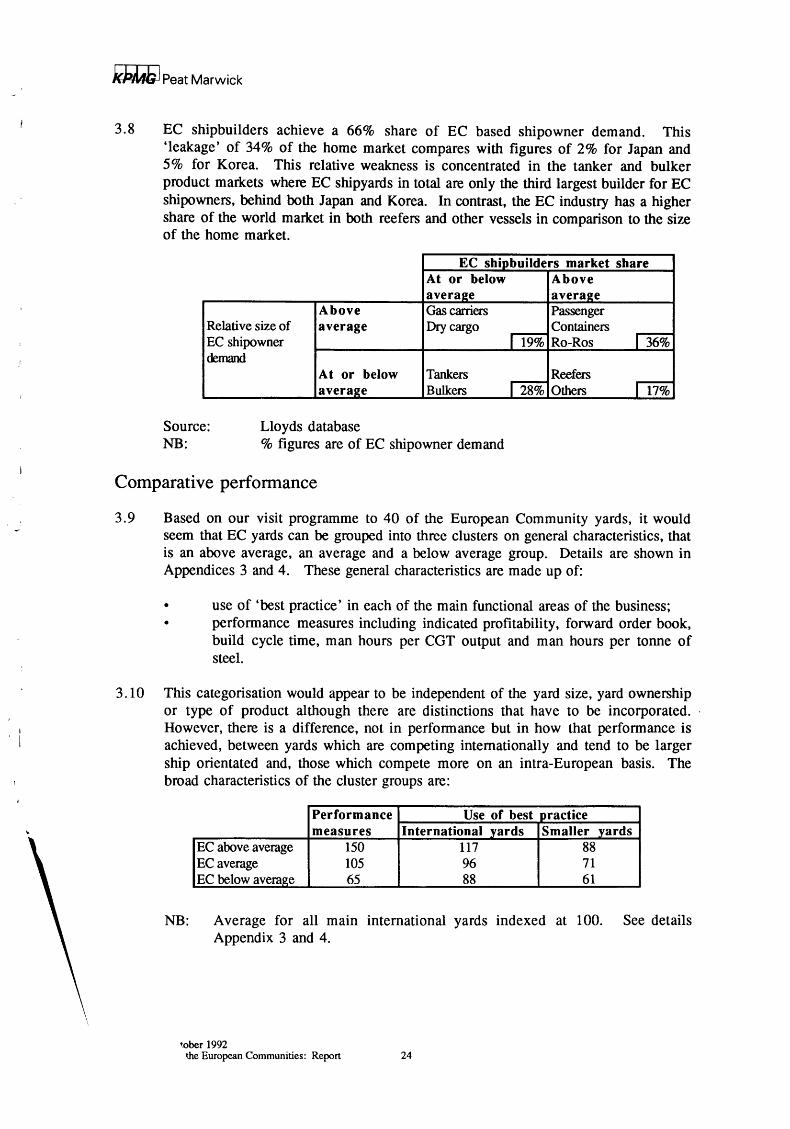
3. 8 EC shipbuilders achieve a 66% share of EC based shipowner demand. This 'leakage' of 34% of the home market compares with figures of 2% for Japan and 5% for Korea. This relative weakness is concentrated in the tanker and bulker product markets where EC shipyards in total are only the third largest builder for EC shipowners, behind both Japan and Korea. In contrast, the EC industry has a higher share of the world market in both reefers and other vessels in comparison to the size of the home market.
EC shipbuilders market share At or below Above avera2e avera2e
Above Gas carriers Passenger Relative size of average Dry cargo
rT9% Containers
rT6% EC shipowner Ro-Ros demand
At or below Tankers Reefers avera2e Bulkers r28% Others li7%
Source: Lloyds database NB: % figures are of EC shipowner demand
Comparative performance
3. 9 Based on our visit programme to 40 of the European Community yards, it would seem that EC yards can be grouped into three clusters on general characteristics, that is an above average, an average and a below average group. Details are shown in Appendices 3 and 4. These general characteristics are made up of:
• use of 'best practice' in each of the main functional areas of the business; • performance measures including indicated profitability, forward order book,
build cycle time, man hours per CGT output and man hours per tonne of steel.
3. 10 This categorisation would appear to be independent of the yard size, yard ownership or type of product although there are distinctions that have to be incorporated. , However, there is a difference, not in performance but in how that performance is achieved, between yards which are competing internationally and tend to be larger ship orientated and, those which compete more on an intra-European basis. The broad characteristics of the cluster groups are:
Performance Use of best practice measures International yards Smaller vards
EC above average 150 117 88 EC average 105 96 71 EC below average 65 88 61
NB: Average for all main international yards indexed at 100. See details Appendix 3 and 4.
•.ober 1992 the European Communities: Report 24
/(})A41; I Peat Marwick
The differences between the two types of yards can be summarised as below.
Smaller yards typically:
• build pre-dominantly for EC based owners; • cite the main competitors as other EC shipbuilders; • build mainly dry cargo ships, small tankers, fishing and service vessels;
have low overhead organisation structures.
International yards typically:
• have a wider target group of owners; claim strong competition from Japanese and Korean builders as well as other Europeans;
•
•
build containerships, tankers, bulk carriers, passenger vessels, reefers and dredgers; have a higher absolute capability in non-direct production activities .
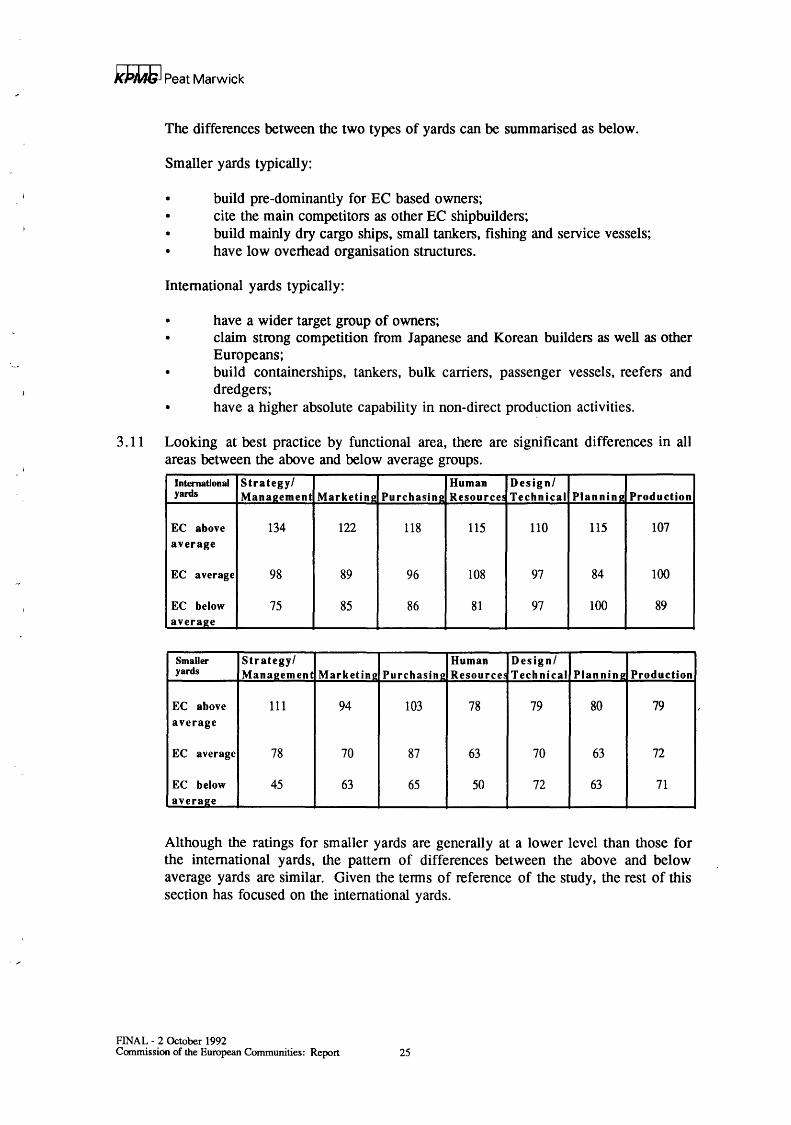
3. 11 Looking at best practice by functional area, there are significant differences in all areas between the above and below average groups.
International Strategy/ Human Design/ yards Manaeement Marketine Purchasine Resource~ Technical Plan nine Production
EC above 134 122 118 115 110 115 107 average
EC average 98 89 96 108 97 84 100
EC below 75 85 86 81 97 100 89 averaee
Smaller Strategy/ Human Design/ yards Mana~ement Marketine Purchasine Resource~ Technical Plannin2 Production
EC above 111 94 103 78 79 80 79 average
EC average 78 70 87 63 70 63 72
EC below 45 63 65 50 72 63 71 averaee
Although the ratings for smaller yards are generally at a lower level than those for the international yards, the pattern of differences between the above and below average yards are similar. Given the tenns of reference of the study, the rest of this section has focused on the international yards.
FINAL- 2 October 1992 Commission of the European Communities: Report 25
kPJAJi I Peat Marwick
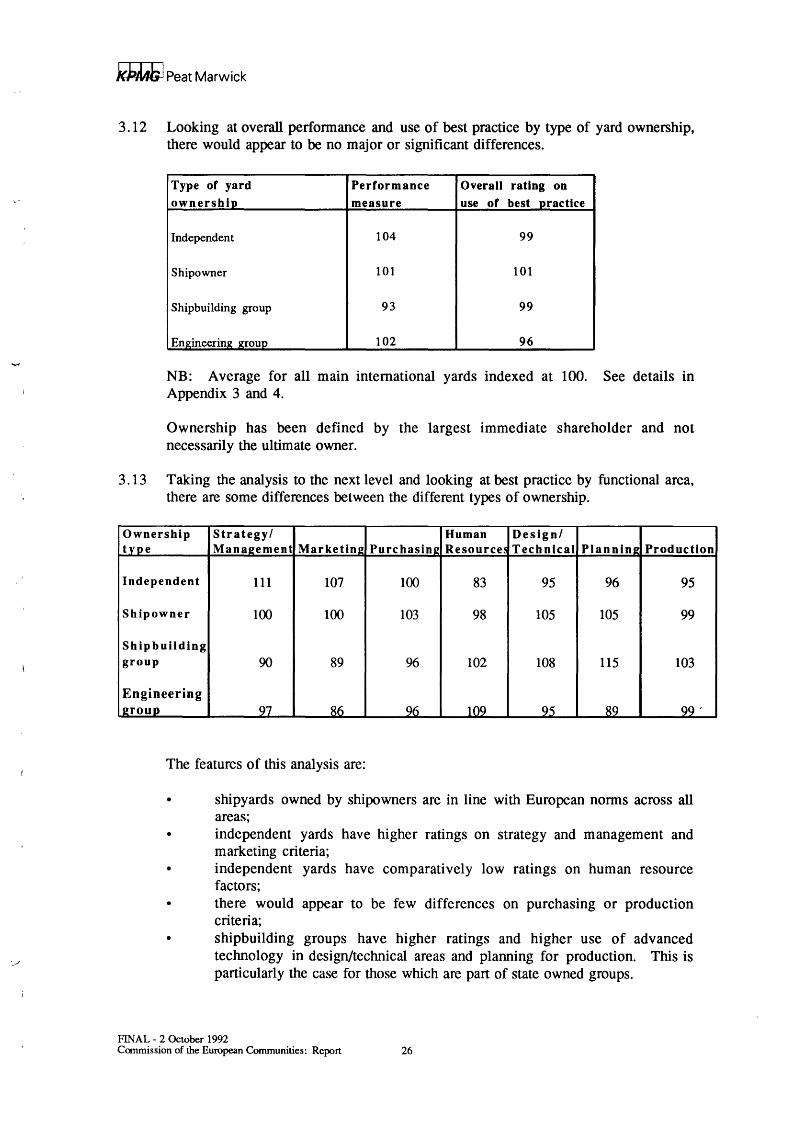
3. 12 Looking at overall performance and use of best practice by type of yard ownership, there would appear to be no major or significant differences.
Type of yard Performance Overall rating on ownership measure use of best _])_ractlce
Independent 104 99
Shipowner 101 101
Shipbuilding group 93 99
En2ineerin2 2roup 102 96
NB: Average for all main international yards indexed at 100. See details in Appendix 3 and 4.
Ownership has been defined by the largest immediate shareholder and not necessarily the ultimate owner.
3. 13 Taking the analysis to the next level and looking at best practice by functional area, there are some differences between the different types of ownership.
Ownership Strategy/ Human Design/ type Mana2ement Marketin2 Purchasin2 Resource.!i Technical Plannin2 Production
Independent Ill 107 100 83 95 96 95
Shipowner 100 100 103 98 105 105 99
Shipbuilding group 90 89 96 102 108 115 103
Engineering e-roup 97 86 96 109 95 89 99'
The features of this analysis are:
• shipyards owned by shipowners are in line with European norms across all areas;
• independent yards have higher ratings on strategy and management and marketing criteria;
• independent yards have comparatively low ratings on human resource factors;
•
there would appear to be few differences on purchasing or production criteria; shipbuilding groups have higher ratings and higher use of advanced technology in design/technical areas and planning for production. This is particularly the case for those which are part of state owned groups.
FINAL- 2 October 1992 Commission of the European Communities: Report 26
kJ'MG I Peat Marwick
3. 14 Comparing the international EC average yards with those in the other focus countries shows a pattern of comparative strengths and weaknesses summarised as:
than Japan than Korea than Finland
EC average yards are:
. significantly better on purchasing human resources
. about the same on design/technical strategy strategy design/technical purchasing planning
. significantly worse on strategy marketing marketing marketing human resources design/technical purchasing production planning human resources production planning production
3.15 In comparison, EC above average yards are relatively strong:
than Japan than Korea than Finland
EC above average yards are:
• significantly better on strategy strategy strategy marketing purchasing purchasing design/technical design/technical human resources
planning
. about the same on purchasing marketing marketing human resources human resources planning planning production production production
. significantly worse on design/technical
FINAL- 2 October 1992 Commission of the European Communities: Report 27
klJMG I Peat Marwick
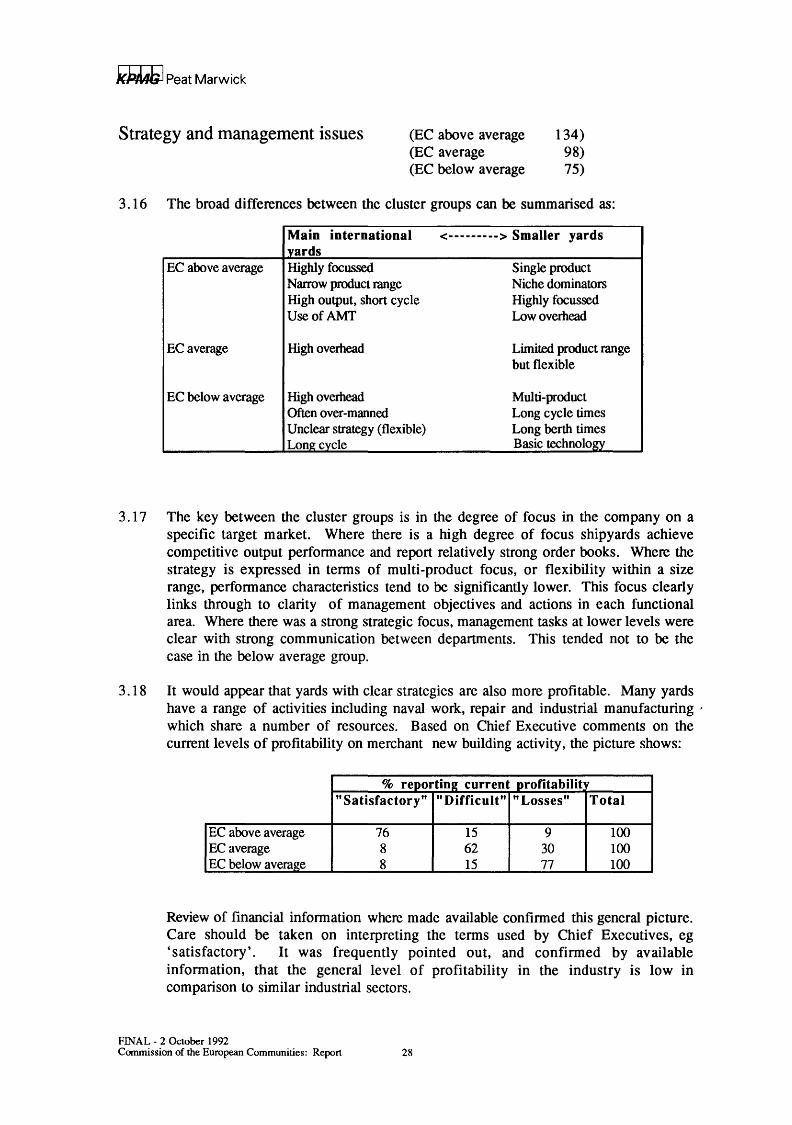
Strategy and management issues (EC above average (EC average (EC below average
134) 98) 75)
3.16 The broad differences between the cluster groups can be summarised as:
Main international <---------> Smaller yards yards
EC above average Highly focussed Single product Narrow product range Niche dominators High output, short cycle Highly focussed UseofAMT Low overhe4d
ECaverage High overhead Limited product range but flexible
EC below average High overhead Multi-product Often over-manned Long cycle times Unclear strategy (flexible) Long berth times Lon11:cvcle Basic technology
3. 17 The key between the cluster groups is in the degree of focus in the company on a specific target market. Where there is a high degree of focus shipyards achieve competitive output performance and report relatively strong order books. Where the strategy is expressed in terms of multi-product focus, or flexibility within a size range, performance characteristics tend to be significantly lower. This focus clearly links through to clarity of management objectives and actions in each functional area. Where there was a strong strategic focus, management tasks at lower levels were clear with strong communication between departments. This tended not to be the case in the below average group.
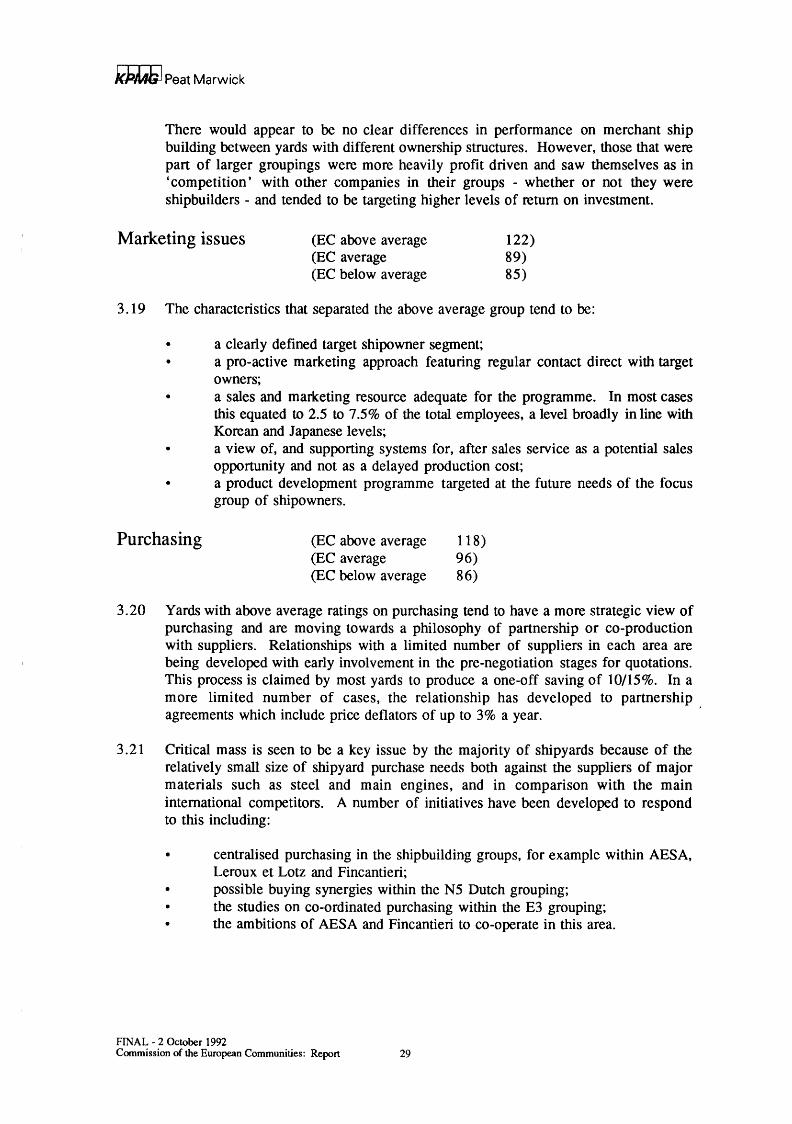
3.18 It would appear that yards with clear strategies are also more profitable. Many yards have a range of activities including naval work, repair and industrial manufacturing , which share a number of resources. Based on Chief Executive comments on the current levels of profitability on merchant new building activity, the picture shows:
% reportinl current profitabilit "Satisfactory" "Difficult" "Losses" Total
EC above average 76 15 9 100 EC average 8 62 30 100 EC below average 8 15 77 100
Review of financial information where made available confirmed this general picture. Care should be taken on interpreting the terms used by Chief Executives, eg 'satisfactory'. It was frequently pointed out, and confirmed by available information, that the general level of profitability in the industry is low in comparison to similar industrial sectors.
FINAL - 2 October 1992 Commission of the European Communities: Report 28
kJ'MG I Peat Marwick
There would appear to be no clear differences in performance on merchant ship building between yards with different ownership structures. However, those that were part of larger groupings were more heavily profit driven and saw themselves as in 'competition' with other companies in their groups - whether or not they were shipbuilders - and tended to be targeting higher levels of return on investment.
Marketing issues (EC above average (EC average (EC below average
122) 89) 85)
3.19 The characteristics that separated the above average group tend to be:
• a clearly defined target shipowner segment; • a pro-active marketing approach featuring regular contact direct with target
owners; • a sales and marketing resource adequate for the programme. In most cases
this equated to 2.5 to 7.5% of the total employees, a level broadly in line with Korean and Japanese levels; a view of, and supporting systems for, after sales service as a potential sales opportunity and not as a delayed production cost;
• a product development programme targeted at the future needs of the focus group of shipowners.
Purchasing (EC above average (EC average (EC below average
118) 96) 86)
3.20 Yards with above average ratings on purchasing tend to have a more strategic view of purchasing and are moving towards a philosophy of partnership or co-production with suppliers. Relationships with a limited number of suppliers in each area are being developed with early involvement in the pre-negotiation stages for quotations. This process is claimed by most yards to produce a one-off saving of 10/15%. In a more limited number of cases, the relationship has developed to partnership agreements which include price deflators of up to 3% a year.
3.21 Critical mass is seen to be a key issue by the majority of shipyards because of the relatively small size of shipyard purchase needs both against the suppliers of major materials such as steel and main engines, and in comparison with the main international competitors. A number of initiatives have been developed to respond to this including:
• centralised purchasing in the shipbuilding groups, for example within AESA, Leroux et Lotz and Fincantieri;
• possible buying synergies within the N5 Dutch grouping; • the studies on co-ordinated purchasing within the E3 grouping; • the ambitions of AESA and Fincantieri to co-operate in this area.
FINAL- 2 October 1992 Commission of the European Communities: Report 29
k.PMJ; I Peat Marwick
3.22 However, these by themselves are claimed by the shipyards not to be enough and they are critical of the European marine equipment industry as a constraint on their business in terms of:
the national orientation of suppliers and their standards and the difficulty in operating cross-borders; the fragmentation of the supply base (described as 'artisan not industrial');
• the lack of commitment of suppliers to the industry having short-term horizons and being investment averse.
3.23 There is no established pattern in the use of sub-contracting as a manufacturing strategy. Incidence is fairly evenly spread across a range from 0% of direct man hours up to about 50% but tends to be higher in the Netherlands, Italy and Spain which have well developed sub-contract infrastructures. A number of yards see subcontract as a means of improving productivity but are in relatively isolated areas with no infrastructure support.
3. 24 From our analysis, there is no overall direct relationship between the total amount of sub-contract activity and performance measures. However, there would appear to be a relationship depending on the nature of the sub-contract activity. There are two basic models for sub-contracting in European yards:
• firstly, the contracting out of discrete blocks of work which tend to have utilisation peaks during the shipbuilding period, for example painting, cabling, pipework;
• secondly, the structural under staffing of all departments (except sales, purchasing and production planning) so that a significant proportion of each department's workload is sub-contracted at all times (including design and technical), and at peak times the majority is contracted out.
Within EC yards the second model is associated with high output levels and short cycle building but tends to be limited to the smaller yards. In many ways it has parallels with the yard sub-contract system in Japan which gives a high degree of production flexibility with a limited fixed cost exposure.
Human resources issues (EC above average 115) (EC average 108) (EC below average 81)
3.25 The major differences between the above and below average yards are in four key areas:
the emphasis on upgrading skills; • the effort to restructure the workforce through recruitment; • the degree of employee empowerment; • multi-skilling and re-skilling.
FINAL- 2 October 1992 Commission of the European Communities: Report 30
kl'Mb I Peat Marwick
3.26 Above average yards tend to have clear policy objectives of upgrading and multiskilling both indirect and direct workforces at all levels. Significant and continuous training programmes have been implemented using both internal and external resources. In some cases these have been tied into continuous assessment processes and salary enhancement schemes. Few yards were able to measure the direct benefit of multi-skilling but where this was possible the indication was for productivity gains of around 3% a year.
3.27 Most yards in the central and northern regions of the community have now reintroduced direct workforce recruitment schemes after a period of static or declining employment numbers. In the majority of cases yards are experiencing significant difficulty in recruiting at the right quality level which is put down to the relative unattractiveness of shipbuilding compared to aerospace for example. A number of yards, particularly in Belgium and the Netherlands, have in place liaison and sponsorship programmes with local schools and technical colleges to try and improve both the quality and quantity of recruits.
3.28 Within most of the EC yards there is some form of employee representation in decision making either through workers councils or board representation. The most extreme expression of employee empowerment was seen in a Dutch yard which has the workforce organised into work groups of between 12 - 20 people by area. Leadership is by a group representative who is rotated on a regular basis. The work group is responsible for its own work planning within the overall masterplan and also for work quality and transfer of work to the next group. The system is still evolving in the yard but internal yard performance measures indicate a 10% labour productivity increase since the system was started in 1990. In assessing the importance of a 10% increase, it should be remembered that this yard was already one of the highest output per worker yards with levels comparable with the Japanese.
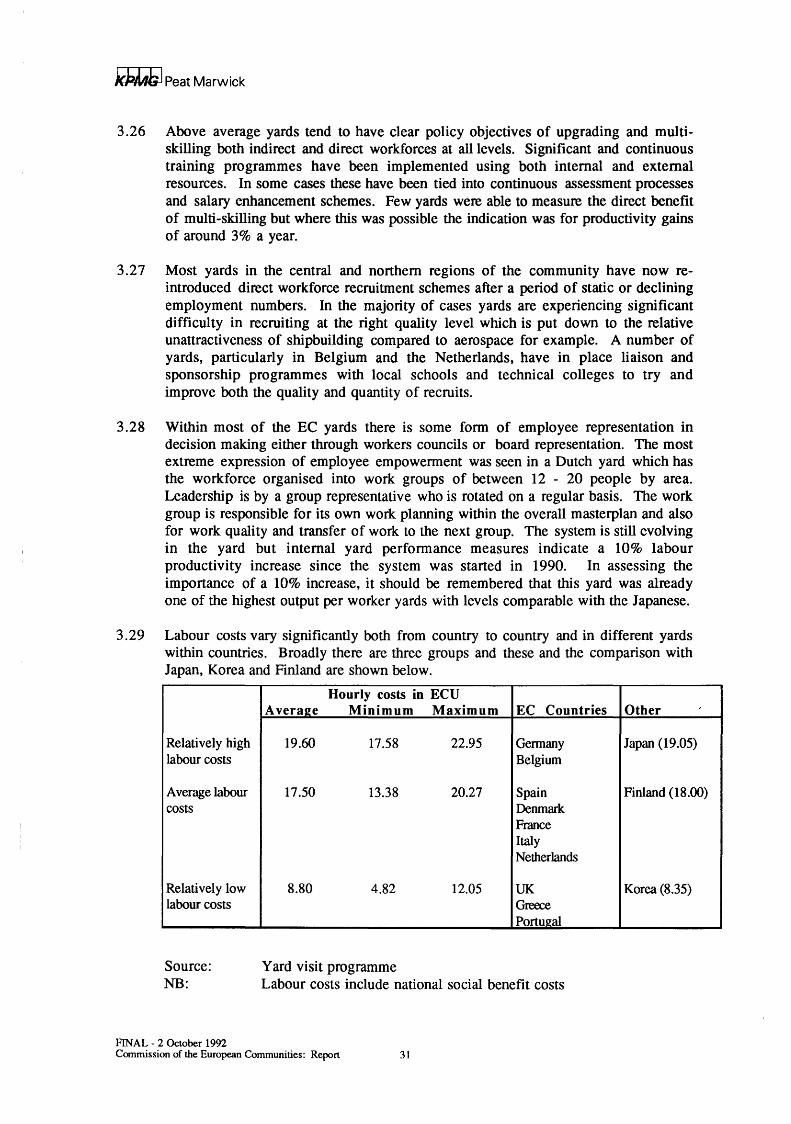
3.29 Labour costs vary significantly both from country to country and in different yards within countries. Broadly there are three groups and these and the comparison with Japan, Korea and Finland are shown below.
Hourly costs in ECU Avera2e Minimum Maximum EC Countries Other
Relatively high 19.60 17.58 22.95 Gennany Japan (19.05) labour costs Belgium
Average labour 17.50 13.38 20.27 Spain Finland (18.00) costs Denmark
France Italy Netherlands
Relatively low 8.80 4.82 12.05 UK Korea (8.35) labour costs Greece
Portugal
Source: Yard visit programme NB: Labour costs include national social benefit costs
FINAL- 2 October 1992 Commission of the European Communities: Report 31
J(}))A}; I Peat Marwick
Based on infonnation in the TecnEcon report, employee related costs make up about 30% of total shipyard costs. The existence of stable, relatively low labour cost areas within the Community, for example the UK, does provide some yards with the opportunity to compete strongly with similar cost areas such as Korea, in product sectors where the EC has a comparatively low market share, for example large bulker carriers.
3. 30 The average age of the workforce in EC yards is around 42, which is slightly below the indicated figure for Japan of 44, but significantly more than the Korean figure of 37. The average would appear to be higher in France, Spain and Portugal at about 44/45 than in other European Community countries which have a figure of about 39/40. Whilst the yards in general believe an average of 35 would lead to higher efficiencies, the problem is seen to be manageable particularly given recent developments in early retirement provisions, in for example Italy and Netherlands. In France the situation is different and yards see a significant short tenn problem in managing the retirement process both because of the scale involved and the fact that there is a significant disabled element.
3. 31 In Spain and Portugal the ability to restructure the workforce is more limited because of differing social policies. Indications from yards show 30 - 40% structural overmanning in some yards. Whilst short term relief is available through social systems, this feature is a significant constraint on the overall competitiveness of the yards.
Design/technical issues (EC above average (EC average (EC below average
110) 97) 97)
3.32 There was a very wide variation in design capability and experience and scale of technical offices (from less than ten staff to over five hundred) according to size of yard and size and type of ship in the product range. Little design work was subcontracted and this was mainly a feature of some of the smaller yards.
3. 3 3 Many yards have invested massively in CAD/CAM systems and equipment. In the ' above average yards, implementation has been carefully thought out and has resulted in improved productivity in the technical offices and a significant improvement in the quality, content and consistency of outputs and an increased ability to cope with ever shorter lead times. A feature of some of the average, and most of the below average rated yards, has been difficulty in effective implementation of CAD systems which has resulted in the pencil being replaced by the computer but at no great advantage.
3. 34 Again, there was found to be a wide variation in the quality of technical information for shopfloor purposes. Some yards still produce large area drawings requiring significant interpretive skills on the shopfloor, whereas the above average yards (excepting some of the smaller ones) produce specific workstation information in easily understandable form and increasingly have full CAD/CAM generation of manufacturing infonnation with DNC links.
FINAL - 2 October 1992 Commission of the European Communities: Report 32
I
k}).Mb I Peat Marwick
3.35 Yards with above average ratings in the design/technical area enjoyed good cooperation and exchange of information between departments which has helped to achieve production-kindly features in the detailed design of their products. Whereas, in many of the below average yards there tended to be strict departmental boundaries with rather poor liaison with planning and production and poor feedback on problem areas.
Planning issues (EC above average (EC average (EC below average
115) 84)
100)
3. 36 The above average rated yards had decentralised multi-level planning systems with clearly defined outputs at each level. At the detailed/short term level (except in some of the small yards) there was a work package approach to organisation of work (zone by stage by type of work) for planning, control and follow-up.
3.37 Some of the average and below average yards have attempted to follow the work package approach but without great success and had over-centralised planning. Others planned by activities which were long in elapsed time and involved large trade based packages of work which gave difficulties in monitoring and control because problems were discovered too late for remedial action. In the lower output, smaller yards, sophisticated planning systems cannot be justified, and an activity based approach to planning is satisfactory for control purposes.
3.38 The yards rated above average in planning produce formal Build Strategy documentation for all contracts reflecting a well planned and production engineered product. The Build Strategy was used as a means of implementing new methods and technology on each subsequent contract consistent .with the long term company policy of continuous improvement. These companies carefully monitored their shipbuilding performance and productivity and very often published this information within the shipyard together with targets to be achieved.
3. 39 The above average yards gave very high priority to effective computerised material control systems and to the pre-production marshalling of kits of parts. They also have a more disciplined and positive attitude to achieving target dates and keeping to budgets.
Production issues (EC above average (EC average (EC below average
107) 100)
89)
3.40 The yards with above average productivity were achieving short build cycles (ie short dock/berth time and short outfit quay time). This was a consequence of their adopting the best block breakdown, build sequence and outfitting philosophy to achieve the objective of maximising construction facility utilisation. For most yards, there is a clear correlation between productivity and cycle time.
3.41 The above average rated yards had adopted and implemented workstation concepts and had process flows clearly defined.
FINAL- 2 October 1992 Commission of the European Communities: Report 33
kJ;Mb I Peat Marwick
3.42 There was a wide variation in outfitting philosophy. The better yards carried out outfitting activities at the earliest sensible time so that steel and outfit work was overlapped to reduce cycle time, and outfitting and painting was done at the stage of production which minimised outfitting man hours. Some of the below average yards are still outfitting, to a greater or lesser extent, in the traditional, piece by piece, sequential way (ie late in the build cycle after most steelwork is completed).
3.43 EC yards in general are gradually realising the importance of achieving the right quality first time and the avoidance of rework. To this end, the above average yards are giving very high priority to establishing procedures for accuracy control in both steel and outfit work in order to reduce man hours at each sequential stage of work. In parallel with this, the better yards are systematically making efforts to design out and organise out needless work (eg staging, overhead working, fairing, rework).
Investment trends
3 .44 Some yards have invested almost nothing during the shipbuilding recession of the 1980s and have done little more than maintain their existing facilities and equipment and buy the occasional item of new equipment. Some have made piecemeal investments, often driven by expediency rather than by careful planning for the needs of the future. Others have continued to invest in a systematic way consistent with their long term objectives. Very, very few have yet invested seriously in automation and robotics although a number of yards have a token robot or two under development or working on minor steelwork.
3.45 Overall, the EC shipbuilding industry has invested neither significantly more or less than its Japanese and Korean counterparts on shipyard facilities, equipment and systems.
3 .46 A number of large and medium size yards now have plans for major investment in new technology - mechanisation, automation, protection from weather, operating systems etc. There is a clear realisation in some yards that although much can be achieved from low cost improvements in, for example, planning, organisation of work, production engineering, there is a need for capital investment to achieve a , significant step forward in output and productivity to have any chance of being competitive in the future.
3.4 7 However, there are yards planning very significant investments in this area who have not yet properly addressed the issues of planning, organisation of work and production engineering. Without the basic philosophy in place it is less likely that the investment will produce a return. A situation similar to that in some yards with CAD/CAM is very possible (see section 3.31 ).
FINAL - 2 October 1992 Commission of the European Communities: Report 34
kJ'JWli I Peat Marwick
4 The Japanese shipbuilding industry
Basic structural features
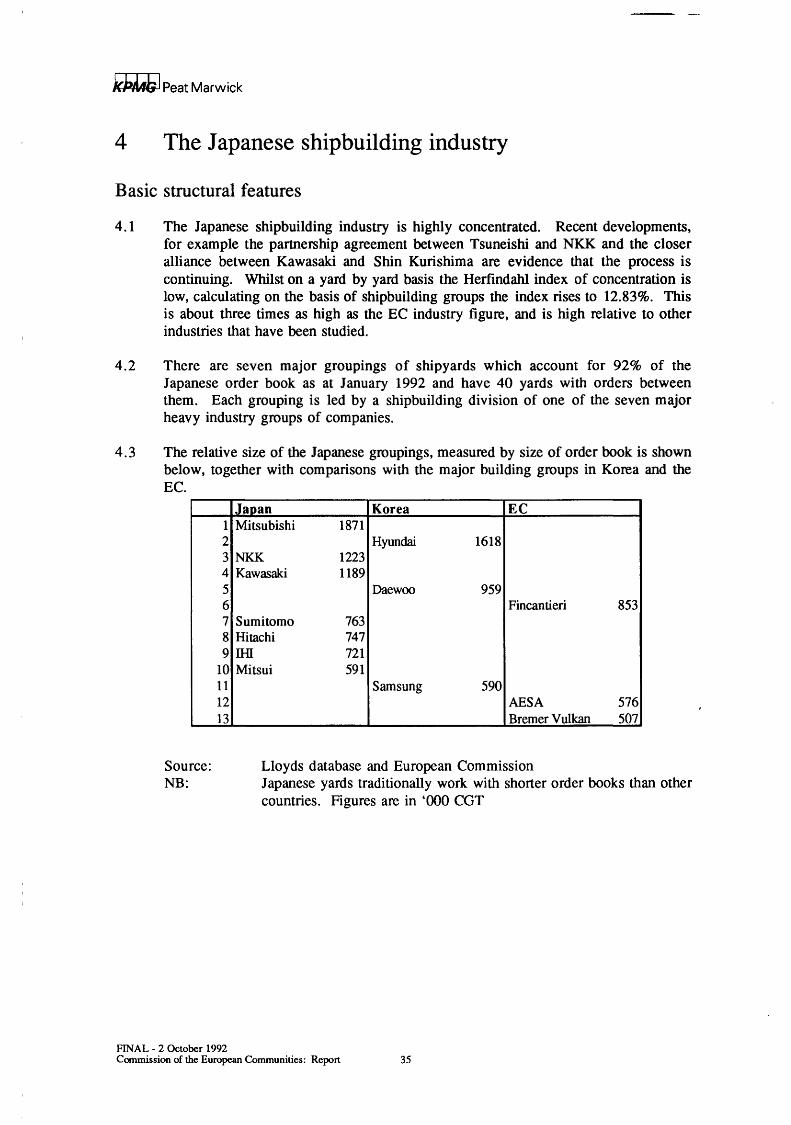
4.1 The Japanese shipbuilding industry is highly concentrated. Recent developments, for example the partnership agreement between Tsuneishi and NKK and the closer alliance between Kawasaki and Shin Kurishima are evidence that the process is continuing. Whilst on a yard by yard basis the Herfindahl index of concentration is low, calculating on the basis of shipbuilding groups the index rises to 12.83%. This is about three times as high as the EC industry figure, and is high relative to other industries that have been studied.
4.2 There are seven major groupings of shipyards which account for 92% of the Japanese order book as at January 1992 and have 40 yards with orders between them. Each grouping is led by a shipbuilding division of one of the seven major heavy industry groups of companies.
4.3 The relative size of the Japanese groupings, measured by size of order book is shown below, together with comparisons with the major building groups in Korea and the EC.
Source: Lloyds database and European Commission NB: Japanese yards traditionally work with shorter order books than other
countries. Figures are in '000 CGT
FINAL- 2 October 1992 Commission of the European Communities: Report 35
I kP/LtG I Peat Marwick
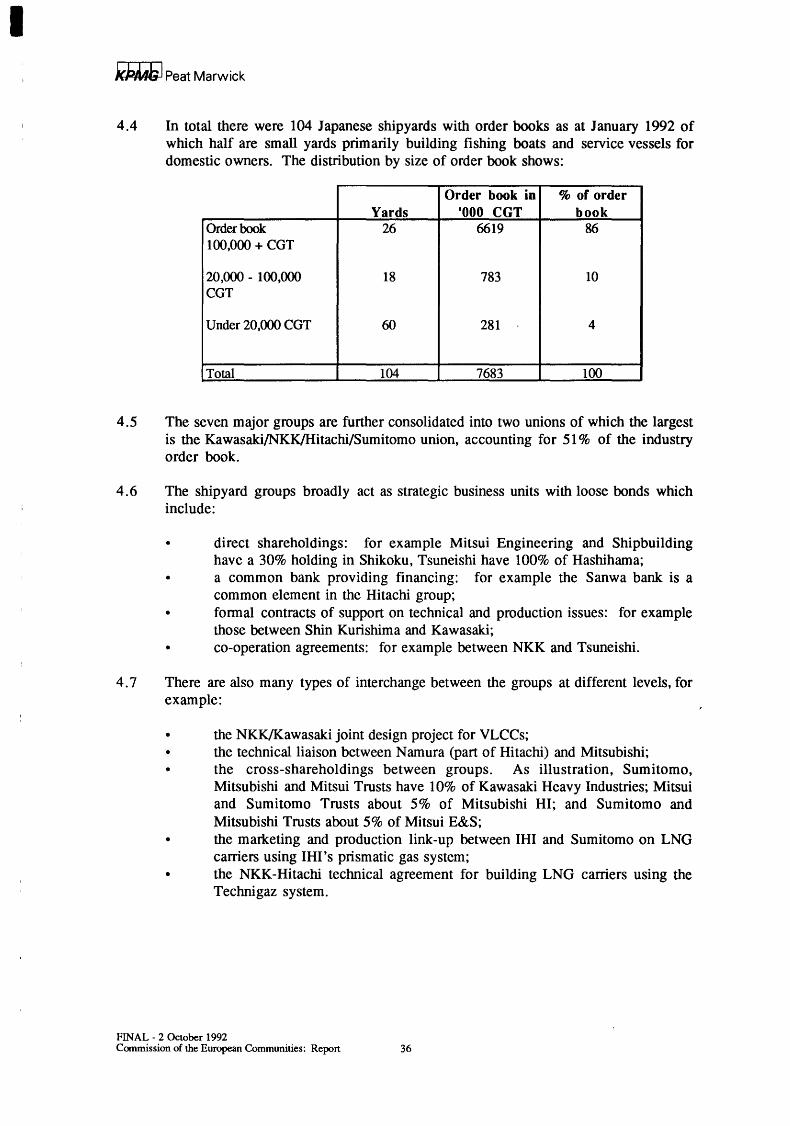
4.4 In total there were 104 Japanese shipyards with order books as at January 1992 of which half are small yards primarily building fishing boats and service vessels for domestic owners. The distribution by size of order book shows:
Order book in %of order Yards '000 CGT book
Order book 26 6619 86 100,000 + CGT
20 ,000 - 1 00,000 18 783 10 CGT
Under 20,000 CGT 60 281 4
Total 104 7683 100
4.5 The seven major groups are further consolidated into two unions of which the largest is the Kawasaki/NKK/Hitachi/Sumitomo union, accounting for 51% of the industry order book.
4.6 The shipyard groups broadly act as strategic business units with loose bonds which include:
direct shareholdings: for example Mitsui Engineering and Shipbuilding have a 30% holding in Shikoku, Tsuneishi have 100% of Hashihama;
• a common bank providing financing: for example the Sanwa bank is a common element in the Hitachi group;
• fonnal contracts of support on technical and production issues: for example those between Shin Kurishima and Kawasaki;
• co-operation agreements: for example between NKK and Tsuneishi.
4. 7 There are also many types of interchange between the groups at different levels, for example:
• the NKK/Kawasaki joint design project for VLCCs; • the technical liaison between Namura (part of Hitachi) and Mitsubishi; • the cross-shareholdings between groups. As illustration, Sumitomo,
Mitsubishi and Mitsui Trusts have 10% of Kawasaki Heavy Industries; Mitsui and Sumitomo Trusts about 5% of Mitsubishi HI; and Sumitomo and Mitsubishi Trusts about 5% of Mitsui E&S;
• the marketing and production link-up between IHI and Sumitomo on LNG carriers using IHI 's prismatic gas system;
• the NKK-Hitachi technical agreement for building LNG carriers using the Technigaz system.
FINAL- 2 October 1992 Commission of the European Communities: Report 36
k})Jl,J; I Peat Marwick
4. 8 To a far greater extent than in Europe, Japanese shipyards are members of broad based heavy industry groups with a wide range of skills and technology in, for example, nuclear engineering, construction and process plant development which are available for transfer to the shipbuilding companies. In our visit to Mitsubishi we were shown welding techniques which had been developed in the nuclear engineering division.
4.9 In addition, the industry is vertically integrated to a great extent through companies' membership of a banking group which thereby links shipowners, builders, suppliers and finance houses. For example, N avix Line shares the same bank as Hitachi (Sanwa) and a high proportion of orders are placed with that yard. However, the arrangement is not exclusive because of other influences: for example, Mitsubishi Trust is a direct shareholder in N avix.
4.10 This vertical integration is further strengthened by cross-shareholdings between shipbuilders and suppliers: as examples Nippon Steel has 7.5% of Sasebo, Kawasaki Steel a direct holding in Kawasaki Heavy Engineering.
4.11 An overall level of co-ordination is given to the industry by the Ministry of Transport and the governmental agencies; the Ship Research Institute and the Association for Structural Improvement of the Shipbuilding Industry. The MOT provides a system for clear signalling of preferred directions of development and can have an element of direct control through management of research funding.
4.12 The Japanese way of organising the shipbuilding industry has a number of significant competitive advantages compared with that operating within the European Community. These include:
• preferred access to the Japanese shipowner market; • fast technology and best practice transfer across the industry. Our research
found greater uniformity both in performance and use of best practice than in European Community yards;
• purchasing advantages through greater critical mass. In general group shipyards channel purchasing of larger items through the lead yard. , Combined with the point that a number of suppliers operate within the same group, it is probable that the Japanese industry has an equipment and materials cost advantage over EC competitors;
• increased marketing resources. Group lead shipyards provide additional marketing support for members of the group and are in tum, through linkage through the banking group, supported by the major Japanese trading companies. For example, Mitsubishi HI are building LNG tankers for a gas field development project brokered by Mitsubishi Corporation and funded, in part, by Mitsubishi Bank;
• technology transfer from parallel industries. As an example Kawasaki Robotics (part of KHI) are introducing a robotic steel marking and cutting line into Kawasaki Sakaide using information from previous work with Kawasaki Steel;
• uniform Government signalling. The Ministry of Transport is the policy making body and the industry is therefore clear on broad directions and the nature and funding of further research and development.
FINAL- 2 October 1992 Commission of the European Communities: Report 37
k})MG I Peat Marwick
Home market influences
4.13 Japan has a large domestic shipowner demand, accounting for 23% of total world production in 1989/91. Of this, in excess of 98% was built by Japanese shipbuilders and home demand therefore accounted for about 59% of their total production. Japanese owners have a large presence in all markets.
4.14 Shipowners are closely linked to the shipbuilding groups:
through membership of the same banking group, for example Navix through Sanwa to Hitachi, Mitsui OSK to Mitsui E&S, K-Line to Kawasaki;
• through direct shareholding, for example the Mitsui OSK 30% stake in Shikoku Dockyard.
4. 15 From our discussions with Japanese owners, it was clear that they had a short list of three or four Japanese yards who had favoured supplier status based on interest group linkages, with the final choice heavily dependent upon availability of production capacity. Japanese yards outside the banking/family group were not considered. Korean yards were always reviewed but needed a price advantage of 15/20% for serious consideration. European yards were dismissed on grounds of inferior quality, delivery unreliability, exchange rate risk and language problems.
4.16 The 'build at home' tendency is reinforced by the home credit schemes for domestic shipowners. We understand there are three versions:
• for foreign flagged vessels 50% of the finance is provided by the group bank and 50% by the import/export bank on OECD tenns;
• for Japanese flagged vessels, the group bank provides 50% and the Development Bank 50% at advantageous rates. To qualify for this the shipowner has to submit a full feasibility study for the building project. Especially favourable tenns have been available recently for LNG vessels;
• for Japanese coastal shipping companies, a co-ownership scheme run by the Maritime Credit Corporation to support in particular ferries and passenger vessels.
4. 17 Japanese owners interviewed stated that a Development Bank funding condition had always been that the vessel was Japanese built, but recent announcements by the Government have indicated that this no longer applies.
4. 18 A further feature of the Japanese shipowning industry is the existence of direct government subsidy to shipping companies. For example, in 1989, 37 ocean going shipping companies were receiving subsidy.
4. 19 As with shipbuilding the Ministry of Transport has a significant co-ordinating and direction setting role in shipping, as for example in the continuing programme to promote passenger cruising services through the initiatives of the 'sub-committee on ocean going passenger boats' within the General Affairs Committee of the Council for Transport Policy.
FINAL- 2 October 1992 Commission of the European Communities: Report 38
J<})Mb I Peat Marwick
4.20 From the shipbuilding point of view, the structure of the shipowning industry provides significant advantages in terms of:
• a 'secured' base load of demand; • the opportunity for early market entry, eg the LNG sector, with a build-up of
experience which can be used in competing in the non-Japanese market.
Comparative performance
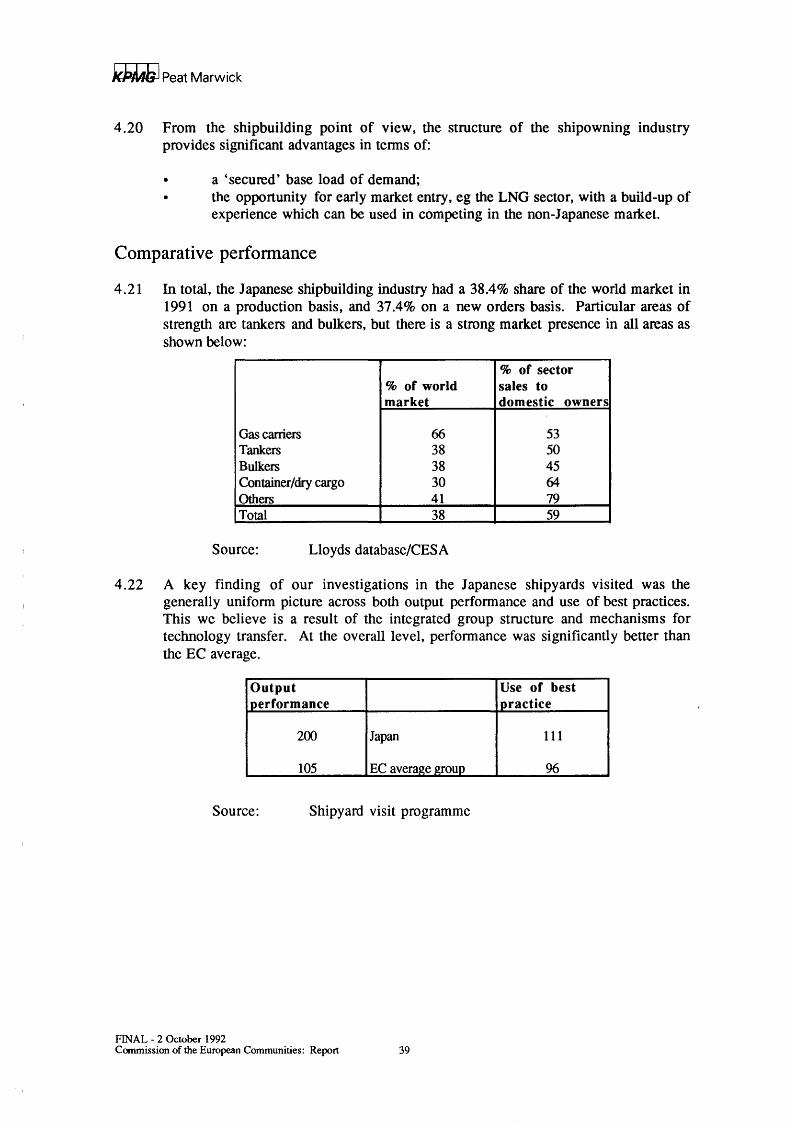
4.21 In total, the Japanese shipbuilding industry had a 38.4% share of the world market in 1991 on a production basis, and 37.4% on a new orders basis. Particular areas of strength are tankers and bulkers, but there is a strong market presence in all areas as shown below:
% or sector % or world sales to market domestic owners
Gas carriers 66 53 Tankers 38 50 Bulkers 38 45 Container/dry cargo 30 64 Others 41 79 Total 38 59
Source: Lloyds database/CESA
4. 22 A key finding of our investigations in the Japanese shipyards visited was the generally uniform picture across both output performance and use of best practices. This we believe is a result of the integrated group structure and mechanisms for technology transfer. At the overall level, performance was significantly better than the EC average.
Output Use of best performance practice
200 Japan 111
105 EC average group 96
Source: Shipyard visit programme
FINAL- 2 October 1992 Ccmmission of the European Communities: Report 39
/(})MJ; I Peat Marwick
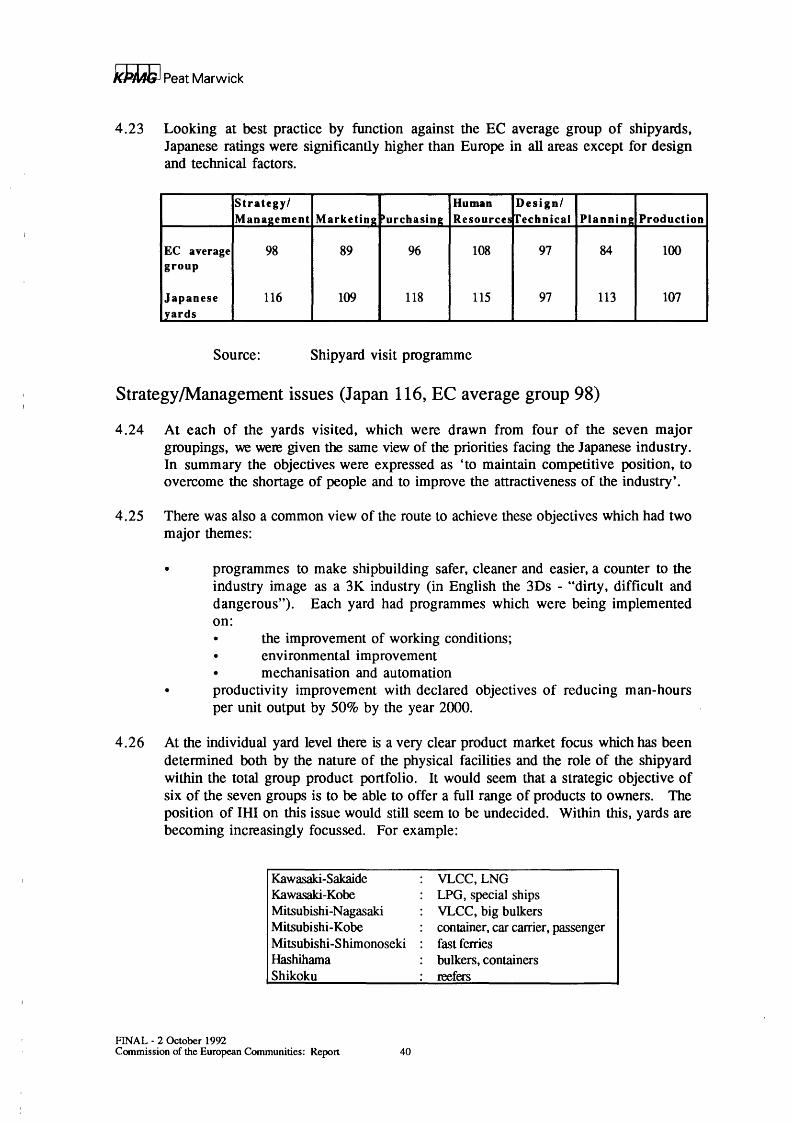
4.23 Looking at best practice by function against the EC average group of shipyards, Japanese ratings were significantly higher than Europe in all areas except for design and technical factors.
Strategy/ Human Design/ Management Marketing Purchasing Resources frechnical Planning Production
EC average 98 89 96 108 97 84 100 group
Japanese 116 109 118 115 97 113 107 !yards
Source: Shipyard visit programme
Strategy /Management issues (Japan 116, EC average group 98)
4.24 At each of the yards visited, which were drawn from four of the seven major groupings, we were given the same view of the priorities facing the Japanese industry. In summary the objectives were expressed as 'to maintain competitive position, to overcome the shortage of people and to improve the attractiveness of the industry'.
4.25 There was also a common view of the route to achieve these objectives which had two major themes:
• programmes to make shipbuilding safer, cleaner and easier, a counter to the industry image as a 3K industry (in English the 3Ds - "dirty, difficult and dangerous"). Each yard had programmes which were being implemented on: • the improvement of working conditions;
environmental improvement • mechanisation and automation productivity improvement with declared objectives of reducing man-hours per unit output by 50% by the year 2000.
4.26 At the individual yard level there is a very clear product market focus which has been determined both by the nature of the physical facilities and the role of the shipyard within the total group product portfolio. It would seem that a strategic objective of six of the seven groups is to be able to offer a full range of products to owners. The position of IHI on this issue would still seem to be undecided. Within this, yards are becoming increasingly focussed. For example:
VLCC,LNG LPG, special ships VLCC, big bulkers container, car carrier, passenger fast ferries bulkers, containers reefers
KPMJi I Peat Marwick
4.27 In terms of competition, the major threat is seen in all cases as being from other Japanese yards. The second area is seen as Korean and other Asian yards because of the labour cost advantage. It was clear that there was some interchange of information between Korean and Japanese yards. European yards were seen as competitors for passenger vessels, containerships for the North Atlantic market and reefer vessels.
4. 2 8 A key short term problem is seen to be low prices. MHI claimed to be making losses with the division being supported by profits from nuclear construction. Kawasaki claimed losses in 1991 because of the exchange rate losses on a BP contract and Shikoku reported profits below requirements because of low prices. The solutions were seen to be increased volume, more added value products, increased productivity and 'avoiding unnecessary competition'. A quoted example of the latter was the Royal Nedlloyd/IHI/Mitsubishi containership order.
Marketing issues (Japan 109, EC average group 89)
4.29 The total marketing effort applied is considerable and at different levels:
• links with the trading houses through the banking groups and specific agreements give wide coverage in most countries on a commission basis. The trading houses are frequently also the 'end customer' as for example in a recent non-competitive win from an independent Hong Kong based owner by Mitsubishi Shipbuilding. The vessels were to be chartered to Mitsubishi Auto under a deal arranged by Mitsubishi Corporation;
• Heavy Industry division offices which support the shipbuilding company. For example, MHI maintain offices in London, New York and Hong Kong;
• Tokyo office based staff. All shipyards have Tokyo offices basically serving the domestic owner. Mitsubishi have over 50 sales people and Kawasaki over 30 in these offices;
• shipyard based sales teams who focus on non-Japanese customers.
4. 30 Innovation and product development is seen as an important competitive advantage, eg the hatchless containership design by MHI for Nedlloyd. Groups tend to have large centralised research facilities and spend between 2 and 4% of revenue on R&D. Member companies have restricted individual facilities with typical spends of around 0.5% of sales.
Purchasing issues (Japan 118, average group 96)
4. 31 Japanese shipbuilders are more effective in applying purchasing muscle than the European industry. Major items, particularly steel and engine/propulsion units, are channelled through the lead companies so that there are in effect seven purchasing points. In general smaller items are purchased at yard level. Kawasaki are seeking to extend the advantages of mass further by co-ordinating purchasing throughout the KHI Union.
FINAL- 2 October 1992 Commission of the European Communities: Report 41
}(})ilfb I Peat Marwick
4.32 Economies of scale in the purchasing unit are matched by economies in the supplier base with about five or six main suppliers in each of the component areas. This situation is re-enforced by the linkages between suppliers and builders and the opportunities for advantageous transfer pricing. Most of the group lead companies have their own engine production facilities which are also marketed to EC builders through the European licensors. The supply industry is well established and generally very efficient.
4.33 In consequence virtually all non-owner specified materials and equipment are sourced in Japan, and builders claim they can buy Japanese equipment cheaper than European yards. They further state that they cannot buy European equipment as cheaply as European companies and are, in some cases, seeking to set up purchasing relationships with European yards.
4. 34 Generally about 15 - 20% of direct work is sub-contracted. Suppliers are viewed 'almost as subsidiaries' with two or three in each area to provide competition.
Human Resource issues (Japan 118, EC average group 1 08)
4.35 Employment in the Japanese industry increased significantly in 1991. This was mostly in the area of yard sub-contractors but there was also growth in the number of direct employees. In all our shipyard visits, reports were received of the start of apprentice recruitment in the last 12 months. Japanese yards use a high proportion of sub-contractors many of whom are based in and permanently attached to individual yards. This allows the yards the flexibility of directly employing only a core company workforce.
Shipbuilding Sector Employment Direct Emploxees Sub-contractors Total
Source: Fifth Joint Study Team of the Labour Management Conference in the Shipbuilding Industry, May 1992
4.36 Labour shortages, particularly in technical areas, and an ageing workforce (average age 44 in direct employees, 46 in sub-contractors) were identified by yards as major problems. To cope with this, a number of initiatives have been implemented including:
• apprenticeship recruitment; • job rotation schemes; • blue and white collar in-house training schemes; • recruitment of women, particularly in supervising robots;
planned reduction in working hours; • investment in improved working conditions; • individual training programmes and multi-skilling;
FINAL- 2 October 1992 Commission of the European Communities: Report 42
k})Jl4G I Peat Marwick
• environmental improvements with government grants for greening up the shipyards.
4.38 Labour premiums are thought to be about 20/25% because of the 3K industry image. The solutions to the twin problems of a high labour cost base and the ageing workforce are focussed on improved productivity and working conditions and the expanded recruitment of apprentices.
Design and technical issues (Japan 97, EC average group 97)
4. 39 The shipbuilding groups have an immense design capability and experience. The application of new technology to the design process varies widely from yard to yard from the very basic to the highly sophisticated. In many yards this is an increasingly important area for further investment as a means to improve productivity and quality of work and to overcome shortages of skilled people.
4.40 There is a massive R&D capacity within the major groups which is being increasingly funded now that the long shipbuilding recessionary period is felt to be over. Priorities include product development (both step changes and continuous improvement), automation of production processes (eg prefabrication, assembly, block shotblasting and painting) and development and application of new materials.
Planning and organisation of work issues (Japan 113, EC average group 84)
4.41 The shipyards visited had simple and highly effective planning and control systems which were still largely manual. This is seen as an area for increased computer application to reduce staff levels.
4.42 Production engineering (detailed planning and work preparation) was superior to European yards in terms of the elimination of non-value adding work, eg scaffolding, and the execution of work at the optimum stage of production. Production processes are organised so that job times can be accurately predicted. Material control was, without exception, excellent.
4.4 3 Cycle times are minimised by the reliability of the delivery of supplies, the evident commitment throughout the organisations to meet planned dates for completion of activities and the overlapping of steel and outfit activities.
Production issues (Japan 107, EC average group 1 00)
4.44 The application of the latest production technology and automation is limited to a few lead yards. Major investment is planned over the next five years.
4.45 Facilities and equipment are broadly in line with European norms and are well maintained. Advanced outfitting techniques are consistently applied in all yards whereas in Europe the application is patchy. Similarly quality and accuracy control is given the highest priority.
FINAL- 2 October 1992 Commission of the European Communities: Report 43
KPJLdi I Peat Marwick
Investment Trends
4.46 During the 1980s, there was comparatively little capital investment in Japanese shipbuilding facilities and the emphasis was very much on cutting production costs. Under a Ministry of Transport initiative, the seven major builders have launched programmes for replacement, modernisation and workshop construction. Expenditure of 2 - 3% of revenues a year is planned in two phases- the first phase generally being 1990 to 1995 with the expectation that VLCC replacement will accelerate from 1996.
4.46 Specific initiatives include:
• NKK, Tsu:
• Kawasaki, Sakaide:
• Hiatchi, Ariake:
installation of goliath crane for turning 400t bottom blocks and conveyorisation of subassembly lines in 1992;
automation of pipeshop, block assembly and new painting plant by 1995 and automation of painting plant in phase 2.
robotisation of section cutting by 1994 .
3D large block system for double hull tanks construction completed;
new painting plant with robotisation to be built.
Similar initiatives are underway in the other yards with a focus on introducing computer integrated manufacturing, new painting and welding facilities for double hull tankers, and environmental improvements with a minimisation of outdoor work.
4.48 On research and development, continuing projects receiving Government support would appear to be:
• the techno-superliner with research co-ordinated by Technological Research Association of Techno-Superliner with a five year budget of 9 billion yen with 33% subsidy; highly reliable marine propulsion plant being undertaken by ADD Inc with a six year budget of 2.5 billion yen and a 40% subsidy;
4.49 In summary there would appear to be six major features of the Japanese industry which create competitive advantages.
FINAL- 2 October 1992 Commission of the European Communities: Report 44
kJ)Ml'i I Peat Marwick
4.50 Firstly, the preferred access to the large Japanese domestic shipowner market with its tolerance for premium pricing. This arises from cultural factors, interlinked interest group pressures, home credit schemes and the quality of the Japanese shipbuilding product.
4.51 Secondly, the Japanese shipbuilding group structure with its competition, marketing, purchasing and technology transfer benefits.
4.52 Thirdly, the major and government supported R&D effort to improve products and the efficiency of yards, and to develop new products.
4.53 Fourthly, the pro-active marketing resources and programmes targeted at clearly defined owner markets.
4.54 Fifthly, high productivity coupled with hourly labour costs no higher than major EC builders and supported by an efficient and competitive supply industry.
4.55 And sixthly, high quality and reliability of vessels plus prompt/timely delivery on relatively short cycles.
FINAL- 2 October 1992 Commission of the European Communities: Report 45
i(M«;I Peat Marwick
5 The Korean shipbuilding industry
Basic structural features
5 .1 The Korean industry has shown significant growth during the 1980s with a share of world production growing from 3.7% in 1981 to 15.1% in 1991. The share of new orders over the period increased from 6.5% to 18.6%, which exceeded the total share secured by European Community yards.
5.2 The industry is heavily concentrated with four of the 15 companies accounting for 89% of production. Hyundai and Daewoo are the two largest individual yards in the world both in terms of production and forward order book.
5. 3 The four major companies are members of large diversified industrial and trading groups. There would appear to be little co-operation between the individual shipbuilding yards.
5.4 There is a limited degree of yard specialisation.
Hanjin Sam sung
Daewoo Hyundai
Home market influences
containerships Panamax bulkers, tankers and containerships, but have recently applied to build VLCCs large bulkers and VLCCs very broad range
5.5 In total terms, the Korean shipowner market is relatively small accounting for less than 4% of world production in the period 1989 - 91. Representation is significantly higher than this level in the two areas of containerships and bulkers. Hyundai Merchant Marine and Hanjin Shipping are two major domestic shipowners closely related to the shipbuilding companies. Neither Samsung nor Daewoo have this support.
FINAL- 2 October 1992 Commission of the European Communities: Report 46
kPM}; I Peat Marwick
5. 6 The industry is heavily influenced by government directive as demonstrated by the maximum 5% limit on the 1992 pay round. According to the US lTC June 1992 report there are no specific financing or subsidy schemes outside OECD agreements to encourage shipbuilding apart from performance and financial guarantees offered by Eximbank. However, we understand that losses of the bank and the export insurance fund are covered by the Government, and discussed illustrations from EC shipowners of financing schemes considerably more advantageous than OECD.
5. 7 For domestic owners, the national shipbuilding programmes are financed by credits from the Korean Development Bank. We understand that these are more favourable than OECD terms.
5.8 The overall Korean market share of 15% is heavily concentrated on tankers and bulkers.
% market share Gas carriers 10 Tankers 20.1 Bulkers 22.4 Dry cargo 10.3 Others 5.9 Total 15.1
Source: Lloyds database/CESA
Operational features
5. 9 In terms of both output performance and ratings on use of best practice, the Korean industry is broadly in line with the group of EC average yards. This comparative performance is supported by figures from a major engine supplier which show a 10% lower man hour figure for the Korean licensee compared to the European manufacturer.
Output Use of best performance practice
100 Korea 101
105 EC averajte group 96
Source: Shipyard visit programme
FINAL- 2 October 1992 Commission of the European Communities: Report 47
k})Mb I Peat Marwick
5. 10 At the functional level, the major differences on best practice are in marketing and purchasing.
Strategy/ Human Design/ Management ~arketlngF ~rchaslng Resources lrechnlcal Planning l»roductlon
EC average 98 89 % 108 97 84 100 group
Korean 98 128 84 115 92 84 109 I yards
Source: Yard visit programme
Strategy/Management issues (Korea 98, EC average group 98)
5 .11 The two yards visited had very different product market strategies. Daewoo is focussing almost entirely on VLCCs. In contrast Hyundai are following a policy of product flexibility on series build of large vessels excluding passenger ships. This is combined with a clear concept of moving to higher value products because of threats from lower cost producers.
5.12 The major competition is seen as being Japanese yards who are perceived to have superior technical capability, R&D and productivity; and other Asian yards who provide increasing low cost competition. The actions required to compete successfully have been identified as productivity improvement and both ship and shipbuilding technology upgrading.
Marketing issues (Korea 128, EC average group 89)
5.13 According to the shipowners we interviewed, Hyundai are the most pro-active marketing organisation in shipbuilding with a well thought out and executed contact programme featuring at minimum weekly contact with owners. According to Hyundai this is achieved by having over 100 staff full time on sales and marketing · activities: 13 overseas in Hyundai Heavy Industries sales offices; 30 marketing staff in Ulsan; 30 projects managers in Ulsan;and 30 after sales staff worldwide. Daewoo claimed a figure of 200 staff in similar roles. An interesting philosophical difference is that in Hyundai aftersales is part of the marketing department whereas in Japan it is part of quality assurance.
5.14 We understand that R&D in Korea is mostly shipyard based with a claimed 5% only from direct government funding. Both Daewoo and Hyundai have technical research institutes on site with over 200 staff each but the research programmes seem to be more development orientated rather than targeted at real innovation.
FINAL- 2 October 1992 Commission of the European Communities: Report 48
/(J!)Jl4G I Peat Marwick
Purchasing (Korea 84, EC average group 96)
5.15 It was indicated to us that about 40% of all equipment and materials is imported either because of owner specifications, particularly in reference to electronics, or restrictions of supply from the domestic steel industry. For example, Spain is an important source of steel. A key objective is to increase the degree of 'localisation' (home sourced content) both to reduce total costs and the trade imbalance with Japan, the major supply nation. Estimates were given that Korean sourced materials were 3 to 5% cheaper than Japanese equivalents.
Human Resources (Korea 115, EC average group 108)
5.16 The age profile of the labour force is much younger (at 37) than both in Japan and EC yards. With an hourly cost of around ECU 8.33 labour costs are about half those of comparable European yards although shipbuilding workers were said to be the highest paid industrial group in Korea. Although recruitment is not yet a problem, it was stated that shipbuilding no longer attracts the brightest university graduates and this is acknowledged as a potential future issue. Labour relations were now said to have normalised after the problems of the late 1980s and there was evidence of significant training programmes and quality circle concept involvement programmes. For example, Daewoo has around 600 quality circles each with about 20 employees and a strongly competitive environment for idea generation.
Design and Technical (Korea 92, EC average group 97)
5.17 The yards visited had major design capacity although experience tended to be narrower than the long established EC and Japanese yards. The yards were relatively weak in production engineering/design for production. Investment in CAD systems and equipment has been extensive but implementation has been rather slow. R&D in design and manufacturing mounted through the on-site 'institutes' seems very much to be in support of day to day activities and is impressive but may lack effectiveness in significantly assisting long-term competitiveness. Having said that, Hyundai claimed to have had 60 engineers working full time on LNG development for the last four years. The Korean yards have the scale to bring significant resources to bear on development projects.
Planning and organisation of work (Korea 84, EC average group 84)
5. 18 Planning and control systems are generally unsophisticated and less effective than those in Japan and the EC above average group of yards. High volume of output gives the opportunity to improve effectiveness in this area.
Production (Korea 109, EC average group 100)
5.19 Both Daewoo and Hyundai are essentially 1970s yards in terms of facilities and equipment. Some advantage is gained in resource management by having the flexibility of single site activities with a comparatively large throughput. There is little or no sub-contracting of shipbuilding activity.
FINAL- 2 October 1992 Commission of the European Communities: Report 49
k})MJ; I Peat Marwick
5.20 Advanced outfitting techniques are consistently applied and short build cycles are being achieved. There is relatively little development in terms of automation, robotics or accuracy control.
Investment trends
5. 21 Initial investment in advanced technology has been made in some areas, for example CAD/CAM though implementation has yet to be completed. Computer applications in other areas, for example planning are also in the early stages. The investment programmes discussed centered on evolutionary change, eg increasing covered workspace, semi-automatic welding, implementing CAD/CAM, rather than any more fundamental step changes through significant automation or introduction of robotics.
Summary of competitive advantage
5.22 The most significant advantage is cost competitiveness driven by a relatively low cost of labour compared to most EC yards and an output performance level in line with the EC average. Material costs are probably lower than for European yards both because of the relative purchasing muscle of the yards and the availability of favourable transfer prices from state owned Pohang Steel. Incremental volume advantages are obtained because of the very strict government controls on the national shipowners. The move to localisation, with a higher Korean material content and the planned productivity improvements of 15/20% in 1992/93 will keep Korean prices keen in the short term.
5.23 This is supported by heavyweight and high quality marketing programmes which ensure that Korean yards are on most owners' quotation lists when new shipbuilding projects are being developed.
5.24 Very competitive financing schemes are available for foreign owners from the Korean Eximbank.
5.25 Korean yards can deliver to very short cycles with a high degree of delivery , reliability. They have the scale to deliver large series orders from one site which is a significant benefit to some owners both on timing and in the reduction of supervision costs.
FINAL- 2 October 1992 Commission of the European Communities: Report 50
J(}:PJWG I Peat Marwick
6 The Finnish Shipbuilding Industry
Basic structural features
6.1 The Finnish shipbuilding industry is highly concentrated with two companies (four shipyards) Kvaerner-Masa and Finnyards, accounting for over 95% of production.
6.2 Kvaerner-Masa grew out of the ashes of Wartsila Marine Industries in 1991 and has two major yards, Masa Helsinki and Masa Turku. Finnyards was formed through the marriage of Rauma Yards, part of Finland's largest industrial group Repola, and the privately owned Hollming shipyard. The Finnish state has a minority holding in Finn yards.
6. 3 The companies compete with each other. Both companies specialise in cruise ships, ferries and ro-ros, and ice breakers.
Home market influences
6.4 The Finnish shipowner market is small. However, since it is predominantly in passenger ship/ferry, cruise and liner trades, which has generated the specialisation of Finnish shipyards, a high proportion of Finnish ships are built in Finland.
Operational features
6. 5 In terms of both output performance and ratings on use of best practice, the Finnish industry is between the group of average EC yards and the group of above average EC yards.
Output Use of best performance practice
124 Finland 106 105 EC average group 96
Source: Shipyard visit programme
6.6 At the functional level, the major differences on best practice compared to the average EC group of yards are in marketing, design/technical, planning and production where the Finnish yards are significantly better.
Strategy/ Human Design/ Manaeement Marketine Purchasine Resource~ Technical Plannine Production
EC average 98 89 96 108 97 84 100 group
Finnish 95 114 91 94 120 111 108 yards
Source: Shipyard visit programme
FINAL- 2 October 1992 Commission of the European Communities: Report 51
kJ'MJ"; I Peat Marwick
Strategy/management issues (Finland 95, EC average group 98)
6. 7 Both yards visited had similar product market strategies which focussed on "highly designed", state of the art, one-off ships.
6.8 The main competition is seen as being almost exclusively from Europe and they expect this situation to remain so for the time being.
6. 9 If there was a weakness apparent in the two companies whose yards were visited, it was that there is still some way to go in rationalising and consolidating the resources of the two pairs of yards.
Marketing issues (Finland 114, EC average group 89)
6. 10 Both yards visited clearly know their markets, have good people and are successful -combining "speculative" design work with a well thought out analysis of owner needs and market trends.
Purchasing (Finland 91, EC average group 96)
6.11 Basically sound but disappointing from the point that the benefits of group membership are not being fully utilised. Purchasing efficiency is handicapped to some extent by the strategy of producing one-offs and is not helped by the typically short lead times the yards have to cope with due to late owner decisions.
6.12 Over 60% of materials and equipment including engines and most steel is purchased in Finland. However, the Finnish marine supply industry is still contracting.
Human Resources (Finland 94, EC average group 108)
6.13 Good worker participation and seemingly harmonious labour relations helped in one case by recent bad times and previous company bankruptcy. Generally good progress in multi-skilling.
Design/technical (Finland 120, EC average group 97)
6.14 Impressive design capability and experience, and well organised and planned technical offices in both yards visited. In one case, very close integration of design and production is achieved by assigning a multi-discipline team the total responsibility for a ship zone.
6.15 Extensive use of CAD systems and integration of planning to allow early outfit in spite of short lead times. Both yards produced very detailed production information.
FINAL- 2 October 1992 Commission of the European Communities: Report 52
}(pJl4G I Peat Marwick
Planning (Finland 111, EC average group 84)
6.16 Both yards had multi-level, decentralised planning with high pnonty given to resource management to achieve short build cycles. Computer based material control systems effectively used to ensure material for work packages are delivered to the right place at the right time.
Production (Finland 108, EC average group 1 00)
6.17 The Finnish yards were comparable to the EC group on steelwork production but were better on accuracy control, and early painting and outfitting, to reduce build cycle time - a performance measure upon which they focussed.
Competitive advantage
6.18 Although Finnish labour costs and productivity are similar to their main (European) competitors, their product market focus coupled with the related high standards of design creates a competitive advantage for them in the cruise and ferry and ice breaker markets.
FINAL - 2 October 1992 Commission of the European Communities: Report 53
k.l'MJi I Peat Marwick
7 Factors in competiveness
7.1 There are clearly many, many factors that determine overall competitiveness which we have defined as the ability to win and execute shipbuilding orders and stay in business. Some of these factors are based on objective criteria but many are subjective and relate to confidence in the yard and the management team. However, it is possible to generalise that there is a base buying model which is used by shipowners in both Europe and the Far East, and is also independent of whether or not they have a direct interest in a shipbuilding yard. The basic buying model is:
FINAL- 2 October 1992
Initial business case covering: • feasibility study • concept design
Final shortlisting on basis of: • product performance • cost to the owner • delivery cycle
Financial engineering/ commercial evaluation
Decision
Commission of the European Communities: Report 54
k})Ml; I Peat Marwick
7.2 For a shipbuilder to compete successfully he clearly has to satisfy the criteria at each stage of the buying process. From this perspective this overall task can be subdivided into five stages:
Market access Marketing Cost to the owner Product innovation Delivery
will I be considered for the shortlist? will I be on the shortlist? can I be competitive on cost? can I offer an added value ship? can I meet or beat the required delivery time?
7. 3 Within each of these areas there is a complex of factors which together make-up the factors of competitiveness. The following sections look at what our research programme has indicated to be the key areas, and look at broad relative competitive strength of the EC shipbuilding industry against each.
~arketaccessissues
7.4 EC shipbuilders do not have access to either the Japanese or Korean shipowner markets. Of the 7,534,000 CGT delivered to Japanese owners in the period 1989/91, only 5,000 CGT was EC built. Of the 1,284,000 CGT delivered to Korean owners, none was EC supplied according to Lloyds databases. There are a number of reasons for this including:
• strict controls on purchasing new and secondhand ships by the ROK government;
• financial links and consequent shareholder pressure between shipowners, builders and finance companies in both Japan and Korea; the influence of home credit schemes which may have recently been liberalised but mean that only one foreign built ship has been completed under the Japan Development Bank finance programme as at July 1992.
7.5 In contrast 34% of the EC shipowner market is held by Korea and Japan. Indeed in the tanker and bulker product markets, Korean builders have the largest market share, with Japan second and the EC in third place in what is a 'home' market. The , net effect is that the market open to both the Korean and Japanese industries is significantly larger than that available to EC builders.
7. 6 As an additional constraint, entry into new markets is becoming more difficult for builders. Given the current economic difficulties in the shipping industry, and the increasing competitive and cost conscious environment they anticipate in the future, many EC shipowners in particular have stated that they are becoming more risk averse. An avoidable risk is being the first owner of a particular vessel type in a yard. Increasingly owners are apparently looking to place their orders with yards with specific product experience, eg double hulled VLCCs. Within the Japanese industry structure this does not appear to be a major problem and the re-emergence of the LNG market has quickly seen initial orders for ships being spread across many of the major groups. A similar position occurs in Korea with the government promotion of LNG orders to Hyundai. It is clearly less of an issue when a yard is part of a shipowning group, but for the majority of EC yards this difficulty of achieving early market entry could be a significant future constraint.
FINAL- 2 October 1992 Commission of the European Communities: Report 55
kJ;MG I Peat Marwick
Marketing issues
7. 7 In this context marketing has been defined as the process of getting on the selective list of yards to be considered, assuming the market is open, with the maximum chance to be finally successful. The EC shipowners interviewed as part of this study had a very clear ranking of the effectiveness of builders in this area being:
1 Hyundai 2 The Japanese 3 Polish, Chinese, other Eastern Europe 4 EC yards
There are recognised exceptions to the general ranking with a minority of EC yards being considered to be very effective. However, the vast majority of yards were thought to be at a competitive disadvantage because of failings in their marketing. This is strongly supported by the comparison of best practice ratings identified during our yard research.
7. 8 The majority of owners stated they had never been approached pro-actively by EC yards. The only contact with the yards was in response to invitations to tender. In contrast Hyundai make contact at least monthly and in many cases weekly, the Japanese at least quarterly and the others at least six monthly. However, EC repair yards are seen to be very pro-active and aggressive.
7. 9 Where EC yards do initiate contact, it tends to be chairman to chairman/chief executive visits which are courtesy visits and are generally held to be unsophisticated and unproductive. The advantages of regular contact are seen by shipowners as being:
• helpful in building market know ledge; • help shape the design concepts the owner is working on; • help the decision of when to place the order.
The situation was summed up by a senior director at one of the largest shipping , companies - "a yard who has not called regularly is at a basic design disadvantage from day one - and of course soon we '11 stop inviting them to tender".
7.10 Aftersales service is seen as a key area by shipowners and much less so by EC shipbuilders. At the risk of over generalising, the perception of the shipowners is:
• that the Koreans are pro-active and seek opportunities to visit ships and discuss performance with owners;
• the Japanese are superb in quickly resolving problems if they emerge; • the Europeans are basically hostile and will seek to blame poor operating
procedures or material/equipment suppliers.
FINAL- 2 October 1992 Commission of the European Communities: Report 56
kP/lfbJ Peat Marwick
This difference would appear to be one of basic business philosophy and it is probably significant that the company organisation structures for the three industries show that the aftersales department:
in Hyundai is part of the marketing department; • in Japan is part of the quality assurance department (as it is in Daewoo);
in Europe generally reports into production.
Cost to the owner issues
7.11 A TecnEcon study of November 1991 showed a price disadvantage for most EC builders for the ship types examined. During our shipowner research, figures were being quoted to us of a Korean advantage of 10-25% and Japanese prices being 5-15% lower than EC equivalents, with isolated examples of significantly larger differentials. However, it must be stressed that these figures cannot be directly compared with TecnEcon results: there were no controls to ensure like-for-like specifications, nor guarantees that the EC price was the most competitive available.
7.12 A significant and yard controllable cost is the cost of labour expressed as cost per CGT of output. The chart below shows the comparative position of the yards surveyed.
MAN HOURS PERCGT-
FINAL - 2 October 1992
Shipyard labour cost comparisons
120 0
100
80
60
40
20~-------P------~-------P------~~-----.-------.
0 10 20 30 COST PER MAN HOUR IN ECU
J - Japan F - Finland K - Korea D - EC yard
Commission of the European Communities: Report 57
f;;MJ; I Peat Marwick
From this it is clear that the Koreans have labour cost leadership based on average output efficiency and relatively low hourly costs. The Japanese yards are competitive based on high efficiency and high labour costs. A minority of EC yards approach these levels but the majority have a significant cost disadvantage because of poor output performance.
7. 13 A major factor in total cost in shipbuilding in the cost of materials. As this was not a specific comparative cost study, detailed information on relative material costs is not available. However, a feature of both the Japanese and Korean industries is a greater degree of concentration into much larger scale units both in shipbuilding and in the main supply industry. The possible cost advantages of this are shown in a study by AESA and Fincantieri indicating a potential material cost saving of 10% by coordinating purchasing and rationalising the number of suppliers. Further savings were thought possible if the supply industry itself could be rationalised so that the scale of suppliers was equivalent to that in Japan.
7.14 For about half of the owners interviewed, the issue of finance plays no role in the selection of yards because they arrange their own independent financing with cash deals with the yards. The reasons for this include:
• ability to obtain rates lower than OECD rules; • ability to have longer tenns than the OECD maximum; • ability to address the issue of residual values.
Where owners arrange financing through the yards the general experience would appear to be that Japanese and EC schemes are generally comparable but that very favourable schemes can be obtained from Korea including low interest rates, interest free periods, extended timescales and less onerous guarantees.
7. 15 Because the international market is largely dollar denominated, the cost to the owner of any individual shipyard is heavily influenced by exchange rate movements. The analysis in Appendix 4 shows the long term correlation between market share and relative exchange rates for the major countries. Whilst this does show some relationships, levels of correlation are generally low, showing that other factors are , also important. Over the short tenn, ship owners we interviewed said the continuing depreciation of the won in 1991 and early 1992 have increased Korea's relative competitiveness - and this is clearly reflected in the increase in share of new orders placed.
Product innovation issues
7.16 In broad terms owners feel that the European Community shipbuilding industry is not offering any significant product innovation, such as would favourably influence their decision. Specific examples mentioned by respondents included hatchless containership designs, propeller innovations and hull design.
FINAL- 2 October 1992 Commission of the European Communities: Report 58
kP/l4hJ Peat Marwick
Delivery issues
7.17 Shorter cycle times are increasingly important to shipowners according to respondents, primarily because it greatly facilitates their commercial strategy decision making but also because there is a direct cost benefit in reduced finance and supeiVision costs. An example from a major UK owner on their previous orders was a cost of $450,000 in Japan for supeiVision compared with $750,000 in Germany because of a longer cycle time.
7.18 Actual performance of EC yards on cycle times varies by product type. Using a 'better than average EC yard' the typical comparison is:
Cruiseships
Containerships
Reefers
Tanker/Bulker
Source: NB:
Keel-Launch Keel-Delivery
ECyard 39 60 Finnish yard 26 50 ECyard 23 45 Japanese yard 14 28 ECyard 12 27 Japanese yard 15 30 ECyard 18 38 Japanese yard 13 30
Yard visit programme Values in weeks. Korean cycle times are approaching the Japanese level
7.19 As important as cycle times is delivery reliability. The Japanese are reported as being 100% reliable, the Koreans as being increasingly able to deliver early. Penalty clauses in contracts are becoming increasingly onerous and whilst the very best European yards can live with this, many expressed concern - not so much because of internal constraints but more because of unreliability in the supplier infrastructure.
Agenda for the EC industry
7.20 This is clearly set by the earlier paragraphs. To compete successfully in the existing market the EC industry must adopt best practices. However, to see if these will be enough to maintain market share in the 1990s, it is necessary to briefly review expected key developments.
Key developments in the world shipbuilding market
7.21 AWES has recently published a forecast for the annual average requirements for new ships up to the year 2005. This forecast shows a predicted annual average for world shipyard activity in compensated gross tonnes as:
1991 - 1995 1995 - 2000 2000 - 2005
FINAL- 2 October 1992
11.8 million cgt 15.4 million cgt 18.7 million cgt
Commission of the European Communities: Report 59
/(Pil#tG I Peat Marwick
The implication of this forecast is that there will be little change in demand up to 1995, a period then of volume growth of about 10% a year for five years, followed by a period of low or zero growth but with a base level of demand 58% higher than today.
7.22 AWES have compared their figures with the April 1991 forecast by the Japan Maritime Research Institute. The JAMRI results, using a different methodology based on forecasts of shipping demand, suggest the same level of total demand across the period but with the start of growth earlier in the 1990s and with a lower growth rate in the late 1990s.
7.23 The forecasts by product market show expected growth in demand in all sectors except containerships. In contribution terms, of particular note are the expected increases of 50% for dry cargo vessels and 30% for gas/chemical carriers, and the 40% decline in contribution for containerships.
% of demand in CGT 1991 - 1995 1995 - 2000 2000 - 2005
7.24 In its studies AWES does not see lack of capacity as a short term constraint on growth in demand. Their studies predict an available capacity for 1995 of 17.7 million CGT of which 18.6% is indicated to be in the European Community. The figures show that the EC industry is currently operating at about 93% of capacity. The assumed market share figures show no overall increases compared to the average share of output of 1987/91, with loss of share in fishing vessels and other non-cargo , ships, offset by small increases in bulk carriers and tankers.
7.25 In terms of research and technological developments that are seen by the industry to be important to competitiveness in both the short and long-term, the Bossard Report to the Commission in November 1991 indicated the priorities to be:
• ship product development, ie fast ships, automation and reduced manning and better environmental protection;
• composite materials, standards and better corrosion properties; • improved standardisation and reliability of equipment; • CIM and automated production;
management, production engineering, cost control and marketing issues.
FINAL- 2 October 1992 Commission of the European Communities: Report 60
}(})MJi I Peat Marwick
7.26 Overall the Japanese market share is strongly related to movements in the exchange rate, as detailed in Appendix 7. The appreciation of the yen against the dollar during the 1980s put the pressure on cost reduction, and was mostly offset by productivity improvements in Japanese shipbuilding. Current forecasts for the yen are mixed with Goldman Sachs suggesting depreciation and OECD and London Business School suggesting appreciation by up to 8% by 1999. Even assuming this latter figure, given the planned performance increases, Japanese shipbuilding is likely to be significantly more competitive by the end of the decade.
The forward view for European Community shipbuilders
7.27 The environment for competition in summary therefore includes a number of major components including:
• a rapidly growing world demand with increases on current levels of 30% in 1995/2000 and 60% in 2000/2005;
• a forecast real decrease in demand for containerships, a major contributor to the European industry;
• labour output levels in Japan which are now twice the European norm and are targeted to be four times existing EC norms by the 2000: investment is being made now to achieve this;
• labour costs per unit output in Korea at 50% of European norms with significant short term improvement possible; increasing price competition from Eastern Europe and NIC shipyards;
• an uncertain exchange rate environment; • increasing relative labour costs in Europe through convergence, particularly
in Germany and Portugal; a massive scale of and increasing investment in R&D in Japan;
• an emerging trend in European shipowners to order more standard ships in order to contain their cost inflation.
FlNAL- 2 October 1992 Ccmmission of the European Communities: Report 61
}(})Jl,U; I Peat Marwick
Summary of EC competitive position
7.28 The position of EC shipbuilding is shown in the overview strengths, weaknesses, opportunities and threats (SWOT) analysis below. It should be noted that this is based on the industry as a whole - the situation of individual yards will be detennined by specific factors.
Streneths Weaknesses
Strong European shipowner base No access to Korean/Japanese Expertise in some product types - markets particularly passenger and Very high cost base containerships Investment in CAD/CAM
Opportunities Threats
Increase in total market Fall in containership market Cost base reduction in Korea/ Japan Trend towards standard ships Exchange rate environment Japanese led R&D
Priorities for the EC industry
7.29 Given the situation in the SWOT analysis, if the industry is to ensure that it at least maintains its current share of the world market, it must greatly improve its competitive position. The key priorities in this are to:
• maintain access to existing markets and where possible to ensure more markets are open to competition; reduce its cost base;
• meet increased demand through productivity improvement; • ensure it can build the right products.
7.30 The actions necessary to achieve this are essentially within the control of each shipyard. That success is possible is demonstrated by those EC yards which have achieved a position of world class competitiveness by identifying a sector to compete in and organising themselves and the resources available in the most effective way. However, while the prime responsibility for improving industry competitiveness is with the shipyards, there are areas in ensuring resources are available to the industry where action by external agencies is indicated.
FINAL- 2 October 1992 Commission of the European Communities: Report 62
}(J)MJ; I Peat Marwick
8 Indicated areas for industry action
8. 1 To develop a set of appropriate options for improving competitiveness we have used the following model which differentiates between factors internal to, and controllable by, the individual shipyard, and those where external authority input is required.
Fair competition
FINAL- 2 October 1992
Access to markets
Creating the environment for upgrading and innovation
Commission of the European Communities: Report 63
Appropriate policy and regulatory framework
~ Internal
D External
kP-Jl4G I Peat Marwick
Maximising the use of resources
8. 2 At its most simple this means each yard ensuring that it is using best practice as appropriate to its size, type and individual business objectives. Our research programme and analysis has demonstrated the link between the use of best practice and output performance measures which is shown in the graph below.
80
70
60 b u 50
~ 40 (J'l
~ 30
~ 20
10
0 1
Best Practice/Performance Correlation
ECBELOW AVFRAGE
INTERNATIONAL
SffiPY RDS EC BELOW D AVFRAGE
D KOREA EC AVERAGE D FINLAND
2 3 OVERALL BEST PRACfiCE RATING
Cl ECABOVE AVERAGE
4
8. 3 It is clear from this that the key requirement is for an industry which uses best practice. The objective for the industry, and the determinant of long term competitiveness, is that each shipyard should have:
• a clear business strategy focusing on core product markets and stating how it will compete and how it will organise itself to compete;
• a clear, fully resourced marketing programme, appropriate product development activity and a considered after sales policy;
• a purchasing policy featuring a minimum number of suppliers, effective supply chain management and strategic use of sub-contracting; human resources management emphasing skills upgrading, distributed decision making and effective recruitment;
• design and technical systems with appropriate use of technology and integration into downstream systems;
• planning and production engineering to improve build strategies and minimise build cycle times;
• appropriate production facilities, technologies and automation.
8 .4 A few EC shipyards have these and are among the world leaders in their product markets. However, with the exception of passenger cruise ships, among the shipyards visited there is only one yard in this category in each of the following product areas: large tankers, bulk carriers, containerships, Ro-Ros, dredgers, tugs and reefers. The level of real competition within the EC is low.
FINAL- 2 October 1992 Commission of the European Communities: Report 64
j(})MJ'.i I Peat Marwick
8.5 Setting an objective of implementing best practice is deceptively simple. In reality there will be a variety of constraints which confront yards including:
• the time required to change overall productivity significantly; • the scale that is realistically achievable; • the ability of yard management to do it unaided; • the natural resistance to change.
8.6 Information for long term trend analysis of productivity improvement in shipbuilding is not readily available. However the chart below, taken from both Japanese and European experience shows improvements in productivity over a 20 year period. Whilst these cannot be assumed to be typical, they are illustrative of long term productivity trends. The Japanese information relates to steelwork man hours, the European to total direct hours. Both yards currently have similar performance levels, but are totally dissimilar in nature and markets served. The key point is that over the 20 year period the average productivity improvement in the Japanese yard was 4.5% a year and in the European 3.5%, with, in both cases, a maximum achievement over a 5 year period of about 6% a year. At a more detailed level, the Japanese figures show improvements in welding productivity of 9% a year over a 12 year period.
Long Term Productivity Trends
110
100
90 Man hours per unit 80 output
70
60
50
40
-Q- Japanese Yard Ref. No. 28
-Q- European Yard Ref. No. 24
FINAL- 2 October 1992 Commission of the European Communities: Report 65
k})Jl$1 Peat Marwick
8. 7 The stated objective of the Japanese industry is to reduce total man hours for each ship by 50% by the end of the century. This implies a productivity improvement of around 7% a year. Although this is higher than the 20 year trend, it could be achievable based on declared investment plans and our own observations during the research programme. In our discussions with EC shipyard management teams, planned productivity improvements grouped in the range 3 to 6%. At this level the overall competitive position of the industry on labour costs will scarcely change. Among the average and below average EC groups there appeared to be a very low recognition and acceptance of the real differences of performance within the EC and Japanese industries - and a low knowledge of the technologies and techniques used to achieve these performance figures.
8. 8 The evidence from our analysis of the relationship between output and productivity as shown in Appendix 5 implies that the non-EC yards studied are on a lower long term cost curve than the EC international group of shipyards as a whole. To improve EC competitiveness significantly indicates the need for a 'step change' in the use of technology, rather than the incremental developments the . industry in general is proposing. The mechanisms for achieving a step change include technology transfer, increased co-operation and a re-focus to either one-off or series build.
8. 9 The fragmented nature of the EC industry has inhibited the transfer of technology as also has the competitive and independent nature of the companies within it. In many cases it has proved easier to transfer technology from Japan than from within the Community.
8. 10 Co-operation or joint working can clearly have benefits in terms of cost reduction through economies of scale and by facilitating technology transfer between partners. There is growing emergence of co-operation within the EC, most clearly in the area of purchasing. Other examples of strategic co-operation, as opposed to subcontracting or project sharing, are more difficult to find.
8.11 Partly through co-operation and the more integrated structure of the Japanese and Korean maritime industries, yards in those countries have a higher ratio of series building than is typical within the EC. Series building clearly has significant cost , curve benefits arising both from increased scale and repetition. Most series builders experience a 3-5% learning curve in direct hours and materials for each of the first few units of production, with additional economies in in-direct hours. Comparing organisation and cost structures between series and one-off builders shows significant differences, for example in design and technical resource, purchasing, the supervisor/worker ratios and the degree of sub-contracting. However, neither is necessarily a route to success. Yards using each approach appear in all three performance groups. The choice of approach is subsidiary to overall business decisions on company strategy and marketing policy. Series building is necessary in some markets and virtually impossible in others. What is clear from our research is that those yards which try to do both and have no clear focus are competitively the weakest.
FINAL- 2 October 1992 Commission of the European Communities: Report 66
kkfl,J; I Peat Marwick
8. 12 A related issue is whether the EC industry has the capacity to meet the demand increases identified in the AWES forecast. On the basis of assumptions of:
• a constant market share; • a 5% a year performance improvement and a parallel increase in capacity; • no additional capacity from naval yards; • adapting to the changed mix of products required in the future; • no changes in workforce sizes;
the broad picture is for falling capacity utilisation through to the mid-1990s, a rise to current levels around 2000, then a further fall.
180
160
140
Index 120
100
80
...... 0'\ 0'\ ......
Market Projections
-0- Productivity Based Capacity
-o- AWES Demand Forecast
--b- Capacity Utilisation %
00 0'\ 0'\ ......
§ N
On this analysis the EC industry will have capacity to meet the peak requirement, but with significant excess capacity up to the year 2000. If Japan does considerably increase capacity through productivity increases in the next ten years, this will probably have a significant adverse impact on the Community's industry.
Access to markets
8. 13 It is quite clear that there are national markets which are closed to EC shipbuilders and the responsibility for improving the position lies with national governments and the European Commission.
FINAL- 2 October 1992 Commission of the European Communities: Report 67
k})MG I Peat Marwick
8 .14 It is also clear that there are shipowner markets which are closed or closing to EC builders because of failures of marketing in the broadest sense. These include EC owners. Whilst marketing is a clear best practice component, there is a potential need for a non-shipyard catalysing agent promoting market research, dissemination of information, training and technology transfer.
Fair competition
8 .15 The study has shown that there is a continuing need for a European Commission role to monitor and negotiate fair trading conditions both within the Community and between the Community and the Korean, Japanese and other shipbuilders. A number of examples of continuing unfair practices have been identified in this report.
8.16 It is clear that the ability of some shipbuilders to buy from the best suppliers is seriously constrained by the continuing existence of barriers and different standards across the Community. We are aware that this issue is being addressed by a study commissioned earlier by DG III.
Upgrading and innovation
8.17 A major constraint on any industry's long term ability to compete successfully is its capacity to upgrade and innovate, in all areas of the critical success factors. This requires both access to the relevant basic technologies and resources, and the skills within the operating companies to convert these to meet shipowners' needs as part of best practice.
8.18 The EC R & D infrastructure which can support the shipbuilding industry has four main components:
EC Framework Programmes eg BRITE EURAM, ESPRIT
EUREKA projects
National R & D organisations eg CETANA, BMT-Cortec, Danish Maritime Institute
Shipbuilders
FINAL- 2 October 1992 Commission of the European Communities: Report 68
Pre-competitive, generic research eg NEUTRABAS, ROCOCO
Must cross national boundaries, closer to market, eg E3, Helios
Targeted at improving the position of Maritime Industries
Market applications
k}))Ab I Peat Marwick
The initiatives are basically designed to meet demands identified by companies and/or research organisations operating in the industry. The EC shipbuilding industry is very fragmented with limited systems for identifying major common issues for the future. The R&D committees (COREDES and ECMIR) are initial steps in this direction and the 'Euroship 2000' concepts are, we understand, to be included in the fourth framework programme for 1993/94.
8.19 The Japanese R & D infrastructure would appear to exhibit three main differences of emphasis:
• the major national programmes mounted by the Ministry of Transport through the main research institutes are specified in terms of markets or applications to obtain competitive advantage;
• there is wide involvement in all the projects: the project is led by the MOT with representatives from all seven major shipbuilding groups, key shipowners and major suppliers;
• there are more resources at company level for developing marketable products because of the groupings structure and the close relationship with the Heavy Industries groups and their R & D capability.
8.20 There are elements of this approach, ie clear and common objectives, wide involvement and improved implementation, which could well be transferred into the EC system. The Bossard Study was a step in the right direction on the first two areas. The third area requires both improved technology transfer and the development of greater R&D resources within the EC industry.
8.21 Concern was expressed on the availability of finance for shipowners for future purchasing. Whilst this mostly centered on the anticipated fleet renewal programme of the late 1990s, there was also concern at the withdrawal of smaller company schemes across the Community, for example in Germany, UK with the BES and Denmark's KS arrangements. This was thought likely to be a major constraint particularly in the northern European captain/owner sector. The generally tighter , credit environment and more restrictive banking practices were said to be depressing current ordering. This appears to be affecting smaller yards in particular and the Construnaves initiative on guarantees is, in part, a response to this.
8.22 Most yards have identified a priority to improve training and in most cases are supported by national or regional initiatives, as well as the relevant trade association. In most areas recruitment of apprentices is proving a problem. In general the industry sees these as issues for the industry, with Commission activity restricted to promoting a positive image of shipbuilding. As has been identified earlier, there are regional structural imbalances in the workforce, particularly in Spain and Portugal and concern that unfair arrangements have been made for eastern Germany. We are aware that this issue is currently in front of the Commission.
8.23 A small number of yards are currently investing in upgrading facilities, principally through self-funding or in conjunction with existing European Commission, national or regional funding mechanisms. We do not believe that there is a need for additional action in this area.
FINAL- 2 October 1992 Commission of the European Communities: Report 69
i(}lMI; I Peat Marwick
Policy and regulatory framework
8.24 One source of competitive advantage gained by shipbuilders in all three non-EC countries is the relative scale and concentration of the industry. Detailed analysis of the survey findings (see Appendix 5) would suggest that average labour productivity increases by about 2.2% for every 10% increase in total output. Given the projected excess of industry capacity this would indicate that a positive approach to industry rationalisation should form part of an overall policy for the industry.
8.25 Similar arguments have been expressed to us by the industry but in favour of rationalisation of the marine equipment supply sector. Within the constraints of this study it was not possible to review the case for action.
8.26 Clearly the industry expressed itself fully supportive of the rapid introduction of enhanced IMO regulations on safety and environmental protection. These are seen as the prime means of accelerating fleet upgrading and the demand on shipbuilding.
8.27 However, there is also concern at the lack of a fully integrated transport strategy for the Community. There is strong aversion to take the risk of investing in creating new product markets, without the knowledge that there is a detailed policy framework supporting the investment. Critical comparison has been made with the Japanese policy of 'modal shift', ie the transfer of road freight to coastal shipping, and the consequent identification of the need for fast coastal freight transport, leading to the development programme of the Techno-Super Liner. The need is seen for a similar framework to guide and incentivise developments with the Community industry.
FINAL- 2 October 1992 Commission of the European Communities: Report 70
}(})Jl,l; I Peat Marwick
The policy development model
8.28 In summary there are significant areas in which the industry can improve its level of international competitiveness. However, there are also areas of industry constraints where Commission initiatives would be positively beneficial. The relationship is summarised in the model below, and options for policy development are discussed in the following section.
FINAL- 2 October 1992
competition
External competition
Commission of the European Communities: Report 71
Industry Initiatives
External Initiatives
k})MG I Peat Marwick
9 Options for policy development
9. 1 Our recommendations have been structured against the areas of need identified earlier in this report and summarised in the route to competitiveness model shown below.
Market access
Internal competition
Removing entry barriers
Industry Initiatives
External Initiatives
9.2 The objective of the EC shipbuilding industry must be to meet the needs of worldwide shipowners better than its competitors. If allowed to compete on a fair basis with the best in the world, the industry will be better placed to meet the needs of Community shipowners, and on a more general basis, the Community marine and transportation sectors. We would therefore reject in principle any measures designed to protect the EC industry in isolation.
9. 3 However, it is clear that there are markets which are not open to fair competition from EC shipbuilders, even where the EC builder has demonstrably superior technology, quality and pricing as for example in cruise ships and dredgers. This report has illustrated the effectiveness of entry barriers (for example, home credit schemes and national shipbuilding programmes) to the Japanese and Korean shipowner markets. Continuing priority should be given to negotiating their elimination through OECD mechanisms, multi-lateral trade fora and GATT procedures.
FINAL - 2 October 1992 Commission of the European Communities: Report 72
k,b/UG I Peat Marwick
Market access Industry promotion
9.4 Within Japanese shipowners there would appear to be low awareness of the current capabilities of EC builders which is, in part, a reflection of the success of the entry barriers. Given the scale of the problem and the strength of the Japanese market, it is unlikely that the industry would be able to fund the necessary programme to increase awareness and promote EC shipbuilders. There is a case for establishing an 'EC Ship Centre' in both Japan and Korea which could have responsibilities including:
promotion of the EC shipbuilding (and marine equipment) industries; • identifying sourcing opportunities for EC shipbuilders;
monitoring developments and competitiveness in the market.
The establishment of such centres would potentially have an important signalling role in developing appropriate bi-lateral arrangements.
Fair competition External
9.5 The OECD framework is designed to provide fair competition on financing terms. There is evidence that orders are being won in the EC market by Korean shipbuilders offering terms more attractive than OECD guidelines. The Commission should pursue its efforts through OECD, GATT and bi-lateral negotiations to identify and eliminate such practices. We recommend that appropriate analysis or studies be made of the feasibility of making available matching credit facilities to EC shipbuilders, in conformity with OECD rules.
9.6 The measures taken under the seventh directive on shipbuilding are leading to a convergence of subsidies. The Commission's policy of moving to eventual elimination of subsidies in line with the comparative price studies based on the most cost-effective European shipyards would appear to be effective in that the most , efficient yards are cost competitive with Japan and many of the others are moving in the right direction. We do not believe that additional operating subsidy measures are required.
9. 7 Of equal importance for shipowners are home credit and guarantee schemes which have the impact of minimising cross-border transactions within the Community. Whilst the total effect on the EC market share is probably not large, we believe there is an impact through constraining the total potential output of the most efficient yards should these be located in another EC country. We recommend that home credit schemes in those aspects not covered by the seventh directive are hannonised across the Community. In addition we believe that schemes should be nondiscriminatory, applicable across internal borders and available in all countries to all EC owners.
FINAL- 2 October 1992 Commission of the European Communities: Report 73
}(j;M(il Peat Marwick
9. 8 Many yards experience cost penalties or restrictions on sourcing because of the continued existence of different standards for materials and equipment across the Community. We understand that this issue is under review in a study commissioned by 00111.
9. 9 EC yards are subject to differential constraints on where they can resource materials and equipment depending on the country in which they are located. In most cases financing conditions lay down an 80% EC content for the complete ship. In other cases national quotas are imposed or specific suppliers are enforced, particularly where these are state owned steel and engine manufacturers. In contrast one major yard makes 40% of its purchases outside the EC and then believes itself constrained by steel quota agreements with Brazil. If the EC supply industry were competitive, these protectionist measures would be unnecessary. From the perspective of a cost efficient shipbuilding industry, we recommend that the Commission reviews these measures against 'state aids rules' and seeks to phase out these sourcing limitations in the same way as is occurring with subsidies with the sixth and seventh directives.
9. 10 Significant steps have been taken in recent years by national governments to introduce measures to allow shipyards to deal with the problem of structural overmanning, as for example in Italy with the introduction of early retirement and pension provisions. A similar situation continues in yards in Spain and Portugal and whilst relief measures have been introduced, these are only partial solutions and the competitiveness of particular yards continues to be depressed. This is an issue for the relevant national government supported by Commission regional measures as appropriate.
Upgrading and innovation Technology transfer
9.11 There would appear to be little real transfer of either ship or shipbuilding technology, or an infrastructure to achieve it, within the EC industry and particularly in comparison with Japan. What there is tends to be organised on national lines, is related· to project problems and the high profile area is in links with Japanese yards with the technology flow almost exclusively from East to West. There would appear ' to be little recognition that there are 'centres of excellence' in best practice in Europe and little motivation within those centres to distribute information.
9. 12 Judging by the general reaction of shipbuilders included in our programme, the Maritime Industries Forum would appear to have been well received in terms of the information exchange and process for developing common views. We recommend that this concept is extended into a series of fora/conventions organised on a panEuropean basis and dedicated in tum to each of the areas of best practice within shipbuilding. Each forum would focus on case studies from one or more of the centres of excellence and on practical implementation in different circumstances.
FINAL- 2 October 1992 Commission of the European Communities: Report 74
kPMb I Peat Marwick
9.13 A key feature of the Japanese structure is the support contract for transferring technology between shipyards in the same grouping, or in some cases in different groupings. We are aware of very few examples within the European Community. One example is where a large yard is assisting implementation of a CAD/CAM system in a medium size, non-competing shipyard. We believe that this process of yard to yard transfer should be positively encouraged by the Commission and particularly where cross-border transfers of best practice are involved. Existing Community mechanisms are available, for example the Sprint programme. These should be actively promoted by DGIII to the industry.
Upgrading and innovation R&D sponsorship
9.14 The R&D framework supporting the industry is extensive and multi-layered, from the European Commission framework programmes through to commercialisation projects within shipyards. The system seems to have particular strengths in individual technology developments, eg ESPRIT programmes on ROCOCO and NEUTRABRAS and in product design, eg the E3 EUREKA programme. However, in our view there is a role that is not currently being filled and that is an overall coordination role within a clear perspective of a future market.
9.15 This role can be defined as to:
• clearly articulate a future market demand, for example for road to sea transportation similar to the Japanese TSL project. In most cases these would be developed out of the overall EC maritime industries and transport policies. The articulation would require a specification of the needs to be met and likely market size and would demand close consultation with potential owners; analyse the required underlying technologies and identify the state of the art, proposing transfer from other industries as appropriate;
• catalyse development where there are gaps in technologies; • ensure multi-point diffusion into the EC industry for competitive
commercialisation.
9. 16 The Maritime Industries Forum is a potential mechanism for fulfilling this role. On completion of its current programme, we recommend that the results of the Forum are reviewed against the role that has been identified, with a view to putting it onto a permanent basis.
FINAL - 2 October 1992 Commission of the European Communities: Report 75
j(pjLfli I Peat Marwick
Policy and regulation Industry structure policy
9. 17 The shipbuilding industries in Japan, Korea and Finland are very much more concentrated than in the EC, as shown by the relative Herfindahl indices. The inference is that the yards in these countries can obtain significant benefits of scale in terms of marketing, purchasing and production economies. The evidence from the EC results also indicates that as output increases, productivity and competitiveness improve. There is an a priori case for rationalisation. However the indicated scale for the required restructuring and the geographical spread of the industry are such as to raise concern on the real feasibility of such proposals, particularly in comparison to the benefits achievable through implementing best practices. It is clearly the responsibility of the industry to determine which route to follow. We believe that there are opportunities for further rationalisation for the industry to develop. We recommend that the Commission should take a sympathetic position on measures generated by participants in the industry, but further restructuring of the EC industry should not be a priority objective for public policy development.
9.18 We recommend that the Commission is supportive, within existing guidelines on competition policy, of co-operative arrangements and agreements between yards to develop economies of scale, for example in purchasing, or to improve the utilisation of resources, for example through sub-contracting. Such activity is the proper consequence of reviewing best practices against the commercial considerations and objectives of the individual yards.
9.19 The competitiveness of the EC shipbuilding industry is dependent upon the equipment supply industry. Imports of machinery built in Korea or Japan under European licences are increasing and the EC industry broadly consists of a large variety of mostly medium-sized companies. Measures we have suggested in section 9.9 from a shipbuilding perspective could adversely affect the supply industry. The ability of this industry to meet the future needs of EC shipbuilders and their incorporation into an overall maritime policy requires urgent review.
Policy and regulation EC transport policy
9.20 The European Commission has already initiated the wider debate through the Maritime Industries Forum, required as a basis to develop a policy to improve the competitiveness of the EC maritime sector. This report can only re-emphasise the need for such an integrated approach.
9.21 Maritime transport already plays a major role in both the internal and external communications systems of the European Community. It can offer significant benefits both commercially and in terms of environmental impact. It is as much a part of the Community's integrated transport as road, pipeline, rail and air.
FINAL- 2 October 1992 Commission of the European Communities: Report 76
j(})MJ;I Peat Marwick
9.22 We would recommend that DGIII looks to issue a green paper following up the Maritime Industries Forum and parallel research programmes, which will assist in creating an appropriate business environment for the EC shipbuilding industry by:
• providing a longer term policy framework for market development; • promoting the transfer of technology; and • being a major component for a fully integrated EC transport policy.
FINAL - 2 October 1992 Commission of the European Communities: Report 77
}(})Ml;l Peat Marwick
Overall methodology Appendix 1, Page 1
The overall methodology adopted for the study, in line with our proposed approach, is detailed below:
Data gathering on focus industries (product segments, markets)
I Information requirements and interview schedules discussed withCESA
I EC yard visit programme agreed with national associations
I I
Visits and discussions with selected yards
I Survey analysis and conclusions
l Additional interviews and contacts
I Report to the EEC's DGIII
I
Visit programme developed for Korea, Finland and Japan
Interviews with selected shipowners and industry suppliers
k.PJWG I Peat Marwick
Programme of contacts Appendix 2, Page 1
1 European Community shipyards
A sample structure of 40 EC shipyards was targeted with the objectives of:
• covering the majority part of EC production; • giving representation to yards of all size types and product types in the
European industry; • giving representation to all operating environments and types of ownership; • giving representation to yards across the apparent spectrum of performance; • but focusing on yards competing directly with Japanese, Korean or Finnish
shipbuilders.
The yards that were eventually included in the sample were:
Country Yard Country Yard
Portugal Solisnor Denmark Odense Lindo Viana do Castello (ENVC) B unneister & Wain Est Sao Jacinto Dan yard
Spain AESA - Puerto Real Orskov Christensens AESA - Bilbao Aarhus Flydedok SA Juliana Gennan Thyssen Nordseewerke AstAnnon BrandWerft Naval Gijon MTW-Wismar
France Chantiers De L'Atlantique MeyerWerft Leroux et Lotz J J Sietas
UK Cochrane Pesaro Richard Dunston Mario Morini Harland and Wolff SID SEC K vaemer Govan
Netherlands Ferus Smit Damen - Gorinchem IHC - Kinderdijk van der Giessen de Noord Shipyard K Damen Merwede Shipyard
Greece Hellenic Shipyards
In total these yards directly employ 43,900 people in merchant shipbuilding and represented 56% of the EC order book as at January 1992. Additional visits were made to two subsidiary yards of above companies and to the group head offices of Fincantieri in Trieste and AESA in Madrid. However, detailed analysis was not completed for the two subsidiary yards and the results are not included in the detail of the report.
/(})JWGI Peat Marwick
Programme of contacts Appendix 2, Page 2
Sample structure by size of yard order book:
Order book Total EC yards Sample yards
Over 200,000 CGT 12 9 100- 199,000 CGT 16 8 20- 99,000 CGT 32 10 Under 20.000 CGT 144 12 Total 204 40
Sample structure by ownership:
Ownership Total EC yards Sample yards
Independent builder 158 14 Shipbuilding group 23 9 Shipowner 10 6 Small engineering group 9 7 Larp;e engineering gr~up 4 4
% covera2e
75 50 31 8
20
% covera2e
9 39 60 77 100
Visits to shipyards were carried out by two teams of two consultants who were interchanged at intervals during the programme to ensure consistency of assessments. The visits to yards had three main elements:
• discussions with senior general managers and the managers of each of the main functional areas covering business objectives, strategies and policies, performance and perceived constraints;
• examination of documents (where allowed) covering for example master plans, personnel records, quotation documents, CAD/CAM, design and planning system outputs and purchasing records; visits to departments, workshops and the shipyard.
2 Japanese shipyards
The sample structure for Japanese shipyards had the objectives of:
• covering the majority of the major shipbuilding groups: member yards of four groups accounting for 63% of the industry order book were visited;
• covering a broad product range of relevance across the European industry and where there is direct competition: yards visited are significant builders of VLCCs, other tankers, gas carriers, bulkers, containerships, passenger ships and reefers;
• providing a basis for a detailed analysis of use of best practice in at least 10% of the industry: yards visited accounted for 12% of the industry order book as at January 1992;
J<J;MG I Peat Marwick
Programme of contacts Appendix 2, Page 3
• within other objectives, providing representation of the different levels of yards within the Japanese group structure to identify potential synergies and benefits: the sample included one lead yard, two second tier yards and one third tier yard.
The yards included in the detailed analysis were:
Kawasaki Group Mitsubishi Group Mitsui Group NKKGroup
In addition, executives interviewed provided significant comparative information on other yards in their groups, excepting Hashihama.
The visits to the shipyards were carried out in exactly the same way and with exactly the same elements as visits to EC yards.
3 Korean shipyards
The two major Korean yards, Daewoo and Hyundai were included in the sample. Between them they account for 68% of the national industry and employ 21,000 people.
The approach and structure of visits was identical to the EC programme.
4 Finnish shipyards
The two major Finnish companies, K vaemer Mas a and Finn yards were included in the sample. Between them they account for about 80% of the national industry and employ 3,200 people.
The approach and structure of visits were identical to the EC programme.
k})Jkl; I Peat Marwick
Programme of contacts Appendix 2, Page 4
5 Shipowners
A number of shipowners were contacted during the study in order to gain further understanding of the purchasing process and the factors detennining the choice of shipyard for new building. Given the fragmented nature of the industry the contacts cannot be said to be a statistically representative sample. The focus was on shipowners with relevant experience of EC, Korean, Japanese and Finnish shipbuilders. Contacts made included:
J Lauritzen NavixLines Eletson Corporation Carnival Cruise Mobil Oil NYK Bergesen Anangel Shipping Chandris SA Soponata Seatrade Groningen CMB Transport Greek Union of Shioowners
6 In addition, we have received views and information from a wide variety of respondents covering a very broad spectrum of industry interest groups including AWES, CESA, EC national shipbuilding associations, Institute of Shipbuilding and Logistics, Lloyds Maritime Services, Fairplay, JSMEA, US lTC, JETRO, Korean Shipbuilding Association, Japan Ship Centre, TecnEcon and many others. Our KPMG offices in Seoul and Tokyo provided information from industry and , government sources. We are grateful to them all for the considerable help they have provided.
k.k.MG I Peat Marwick
Best practice assessment methodology Appendix 3, Page 1
The methodology used in the study to assess the relative use of best practice in each of the yards visited is a development of an approach used by members of the consulting team in earlier shipbuilding industry studies in the US, Brazilian, UK and Spanish merchant shipbuilding industries.
The underlying principle is that for each of the detailed areas of shipyard operation that have in previous studies been shown to have an impact on overall performance measures, an assessment is made of the actual yard practice against industry best practice for that particular operation. A scale of 1 to 4 has been used corresponding with the following broad definitions:
Technology level 1
Technology level 2
Technology level 3
Technology level 4
use only the most basic systems or technologies/absence of policies/ad hoc decision making.
better than basic but below industry norms.
better than industry averages but not up to leading standards.
state of the art use of technology/clear standards, parameters for decision making/industry leading facilities, techniques and systems.
These assessments have then been combined at three additional levels to provide increasingly macro-level assessments of the use of best practices in each yard. The levels of detail therefore are:
Tier 4
Tier 3
Tier 2
Tier 1
detailed operational assessments.
sub-department level assessments, eg steelwork production, design and draughting technology.
In each case the higher level assessments are obtained by a simple averaging of the assessments in the tier below.
The full catalogue of operational assessments utilised is:
Tier 1
Overall
Tier 2
Strategy and management Marketing Purchasing Human resources Design and technical
kbJWi I Peat Marwick
Best practice assessment methodology Appendix 3, Page 2
Tier 2 Tier 3
Planning Production
Strategy and management - Strategy
Marketing
Purchasing
Human resources
Design/fechnical
Planning
- Management
- Market information - Product development - Sales/marketing approach - Enquiry systems - Estimating systems - Image presentation - After sales service
- Pipework - Outfit steel - Sheetmetal work - Joinery - Electrical - Outfit unit assembly - Stores
- Outfit parts marshalling - Block assembly - Painting - Pre-erection outfit - Unit and block storage
- Ship construction - Erection and joining - Services - Staging/access - Engine room outfit - HulVaccommodation outfit - After launch
- Tools/production aids - Workforce appearance - Material control - Materials handling - Layout and material flow - General environment - Noise, ventilation, fumes - Amenities
klJJW; I Peat Marwick
Best practice assessment methodology Appendix 3, Page 4
Performance Measurement
During the yard visit programme, a significant data set was collected on a number of perfonnance measures. During discussions on the use of measures it was again apparent that yards use a wide variety of measures to target and monitor performance; that there is great variety in the way these measures are calculated in individual yards; and great scepticism both about specific performance measures used by other yards and the value of general industry measures at all. Given this background and the study objective of providing a broad comparison of national industry performance, not a specific yard by yard comparison, our assessment has focussed on three broad measures: total man hours per CGT produced; man hours per tonne steel; and cycle times. Of these analysis _shows there is a clearer relationship between use of best practice in a yard and the total man hours per CGT.
In estimating this measure a number of conventions have been adopted to allow for the significant variations that exist from yard to yard. These are:
• Determination of man hours:
• the base figure is total yard employment and actual annual hours worked; • an estimate was made with yard management of the amount of work sub
contracted in or out in each area, eg steelwork, painting, electrical; and the hours adjusted accordingly;
• where a yard benefits from head office services, eg management, purchasing, design, an estimated adjustment has been made;
• only full or part time employment on merchant new building has been included. All other activity, eg repair, naval building, industrial work, has been excluded.
• Determination of CGT:
• 1984 OECD co-efficients have been used; • where master plans were available (most cases) the calculation has been based
on the work input requirement for the current 12 month period (ie not deliveries);
• where master plans were not available (a few cases) the calculation was based on recorded deliveries for 1991 (or an average of 1990/91 if there were significant differences in year to year deliveries) modified according to an estimate of the work done on each vessel at the beginning of the period, and an estimate of the work remaining on each vessel at the end of the period.
In using CGT, we are aware that the co-efficient is designed for broad level international comparisons and not for national or shipyard output measurements. We also understand that the actual co-efficients are being reviewed in the light of changes in ship technology. However, we do not believe that there is any better generally accepted standard, and there is widespread use of CGT in this fonn throughout the industry.
kl'M& I Peat Marwick
Best practice assessment methodology Appendix 3, Page 5
It is recognised that this approach is not perfect but it is believed to be sufficiently indicative for the broad purposes of this study and has the merit that it has been applied uniformly across yards in all the countries under review.
The distribution of yards by man-hour per CGT and best practice ratings were reviewed. From this, three approximately equal groupings were derived with the following broad characteristics.
Overall best ~ractice ratin2 Man hours per Main international Smaller CGT ~yards 1 yards
The analysis of the EC yards visited during the sutvey is as below:
Number of , ards % of total CGT production Main International Smaller Main International Smaller
EC above average 8 5 36 5 group
EC average group 6 6 26 4
EC below average group 9 5 27 2
Detailed ratings for each yard surveyed are shown in Appendix 4 with the exception of Hellenic which at the time of visit was not producing merchant new buildings.
Appendix 4
Performance and ratings summary
EC- main 'international' shipyards
Best Practice Ratings Yard reference number
Man hours per CGT
Overall Strategy/ Marketing Purchasing Human Design and
EC Above Average Group 38 26 15 27
24
12
43
30
32 33
17 34
32 35 37 37
EC Average Group 40 40
42 40
40 44
39 44
4 46
44 47 EC Below Average Group
31 55
35
41
23
9
16
5
2
6
57 57 60 75 81
85
95 112
3.7
3
3.2 3.4 2.9
3.8 3.1
3.3
2.6 2.7
2.9
1.9
3.1
3.1
2.2 2.8
2.2
2.7
2.7
2.7
2.9
1.9
2.1
Management Resources Technical
4
3.5 4
4 3.5
4 3 4
3
3.5 3
1.5
3 2.5
2.5 2
1.5 1.5 2.5 3
3.2 1.5
1.5
3.9 2.7
3.7
3
2.7
3.8 3.1
3.5
2.3 2.7
2.6 1.7
2.5 2.7
3.3 2.4 1.4 2.4 2.5 2.3 2.5 1.5 2.4
3.5 3.4 3 3
2.9
3.7
3.3 3.3
2.1
3 3
2.3 2.7
3.3
2.2 2.9
2.1
2.8
2.6 2.4 2.4 2 2
3 2.7
3.3
3
1.7 3.7 3
3.7
3
2.7
2.7
2
3.3 3
2.7
3 2.8 1.7 3 2
1.3
3.9 2.9
2.9
3.4 3.5 3.4 3.8 2.8
2.8 2.2
3.5 1.9
3.6
3.3
2.5 3.4 2.4 3.2 3.4 2.5 3.5 2.5 2.5
EC - smaller shipyards
Yard Man hours Best Practice Ratings
Planning
4
2.8 3
3.8
3.3 4
3.8 3.7
2.2 1.8
2.8 1.25 3.8 3.5
2 3.7
2.7
3.2 3.8 3
3.8 2.5 2.8
Production
3.7 2.7
2.7
3.3 2.9
3
3
2.3
2.5 2.4 2.8 2.3 3.1
3
1.8
2.6 2.3 2.8
2.1
2.8 2.7
2.2
2.2
reference per Overall Strategy/ Marketing Purchasing Human Design and Planning Production number CGT
EC Above Average Group 20 23 8
18
11
34
EC Average Group
23
26 31 32
19 41
33 42 14 44
7 47 36 50
45 N/A
EC Below Average Group 13 54
47 21 10
48
61
68 70
N/A
2.6
2.6
3.1
2.2
2.2
2.3 2.1
1.7 1.9
2.4
1.9
1.6 1.9
2.2
1.6
1.5
Management Resources Technical
3.5 3.5 4
2 3
3
2
1
1.5 3
3
1
1.5
2
2.9
3.4 3.3
1.9
1.7
2.9
2.1
1.2 1.7 2.3 1.5
1.7 2.1
2.3 1.4 1.3
3.6
2.3 3.1
2.9
2.5
2.7
2.6 1.7
2.4 3.1
2.2
1.7 2.1
2.1 1.5 1.7
1
2.5 2.8
2 2
1.3
2 1.7 1.3
2.7
1.3
1.3
2
2.4 2.4 3.1
2.1
2.1
2
2.2 2
2.4 2
2.2
2.1 2.5
2.2 2.1 2.1
Japan/Korea/Finland shipyards
Japan 28
Japan 27
Japan 29
Japan 30
Korea 26 Korea 25 F1nland 1
Finland 3
20
22 24
24
43
47 32 43
35
2.9
3.2 28 2.9
2.8 3.3
2.8
3.5
3
3.5
3
2.5
3
3.5 2
3.3
2.9
3
2.6 3.6
3.3
3.7
2.7
7 August 1992
3.9 2.8 3
3.7
2.5 2.2
2.8
2.3
3.7
3.2
3.3
1.7 3
3
2.7
2.3
3.2
2.6
3.1
2.8
2.8 2.8
3.5 3.8
2.2 2.6 3
2.7
2
2.2
2
2.3
2.2
1.7 1.5
1.8
1.8
2.3
2.5 1.5
3.7
3.2
3.7
3.3
2.8
2.5 3.5 3.5
2.6 1.8
2.!J
1.9
2
1.7
1.9 1.9
2 2.2 2
1.9
2
2.2
1.5
2.1
3.1
2.9
3.2
2.3 2.9
3
3.1
2.8
APPENDIX 5
Relationship Between Output and Productivity
This section assesses the nature of the relationship between output and labour productivity
and its implications for EC yard competitiveness. The methodology for this analysis is best
viewed in terms of the neo-classical theory of cost curves. This simply considers the long-run
cost curve as being an envelope of short-run cost curves where, in the short run, at least one
factor is fixed i.e. the capital stock. The relationship between labour productivity and output
differs between the short run and long run cases. Generally we can assume that when the
capital stock is fiXed, average labour productivity falls after a point reflecting the fact that the
productivity of the last worker falls as employment increases. In the longer run, however,
average labour productivity can increase as the capital stock is expanded reflecting the
existence of economies of scale. This implies that unit labour costs will also fall as output
expands.
Our purpose is therefore to test the hypothesis that unit labour costs fall as output expands
on the basis of a sample of yards across the EC, Japan, Korea and Finland. In order to test
this relationship we must make a number of simplifying assumptions. This implies that we
effectively are testing for a joint hypothesis. The first assumption we make is that each
output-productivity observation for a yard represents a point on a short run cost curve
conditional on the capital stock. Secondly we assume that each yard has identical
production/management technologies. This allows us to assume that there is a single long run I
cost curve which is the envelope of a number of shorter run cost curves about which the
individual observations lie. Thirdly we assume that any yard is effectively operating at or near
the optimal capacity of the plant in the sense that, given the short run cost curve, the output
level minimises unit costs.
Our approach to testing the above hypothesis is to use ordinary least squares regression
analysis with output as the explanatory variable and the inverse of labour productivity as the
dependent variable. We use the natural logarithm of compensated gross tonnage (CGT) p.a.
by yard as the output measure and the natural logarithm of the inverse of labour productivity
as the explanatory variable (i.e employment divided by CGT p.a.). This serves as a proxy for
unit labour costs. By using the logarithmic functional form we are directly estimating the
sensitivity of productivity to output. We performed these regressions across all yards and
individually for the EC and non-EC countries. In addition we split the yards between the
large, internationally competitive yards as well as the smaller yards. The former were again
split between EC and non-EC. The results for the regressions are given in table 1 below.
Table 1: Regression Results for Labour Productivity and Output Relationship
Sample Intercept T-ratio coefficient on T-ratio No. Obs. R-
log(CGT p.a) squared
Whole -2.63 -6.12 -.105 -1.80 45 .07
sample
EC -3.29 -8.42 -.034 -.514 37 .007
Non-EC -6.14 -16.2 .163 1.05 8 .154
International -1.25 -2.82 -.224 -2.53 31 .16
Yarcls
International -1.14 -3.16 -.223 -2.04 23 .16
Yarcls (EC)
Small Yards -1.43 -3.90 -.246 -1.33 14 .129
The results indicate that the hypothesis that labour productivity rises with output is not
rejected at the 10% level of significance for the whole sample and similarly, at the 1% level
of significance for the international yards alone. In addition within the EC international yards
alone the hypothesis is not rejected at the 5% level of significance. In general we can thus
conclude that the lower level of labour productivity both within the EC yards is related to a
lower level of output with respect to both the non-EC yards as well as with respect to some
of the larger EC international yards.
We can similarly infer from the above the implications for overall unit costs. For simplicity
we assume that other unit costs are constant. Hence if labour costs represent about 30% of
total unit costs we can infer that, on the basis of the whole sample, a 10% increase in output
will reduce unit costs by 0.3 times 1%. Assuming a 9% cost differential between EC and non
EC yards, a 9% unit cost reduction would require a 300% increase in output for an average
EC yard. If we only consider the international yards where a 10% increase in output
increases productivity by 2.2%, this would require approximately a 136% increase in output
for an average EC yard.
This raises an interesting issue since, in terms of the sample alone, the non-EC yards on
average only had a 14.1% higher level of output and a 15.8% lower level of unit labour costs
than EC yards. This effectively implies that either there are additional unit cost savings
arising from the other factors of production which we have ignored or the EC and non-EC
yards lie on different long run cost curves. The latter is consistent with EC and non-EC yards
employing different best practice management techniques which, by necessity, we assumed
away for the regression analysis.
APPENDIX6
Concentration Indices for Production
Concentration indices have implications for the demand and supply side of an industry. In
general these indices can be used to proxy for the degree of competitiveness or the extent of
economies of scale in an industry within a country. Here we calculate indices for the
shipbuilding sector in the EC, Japan, South Korea and Finland. On the one hand we can
interpret these as representing the degree to which economies of scale are currently being
exploited within those countries. On the other hand they also serve to illustrate the likely
bargaining power which each national industry may enjoy with regard to both potential
customers as well as suppliers.
Table 2 details the Herfindahl indices for concentration in production under two alternative
assumptions. The first considers yards individually and thus indicates the extent to which
there is concentration on a yard by yard basis. The second aggregates yards belonging to the
same company and thus attempts to reflect concentration in terms of purchasing and
marketing power. The Herfindahl index measures the sum of the squared shares in
production across yards. An index of 100% indicates that all production is carried out by a
single yard while an index of 0% implies that all yards have a fraction of the overall
production.
Table 2: Herfindahl Indices for Concentration
Index (single yard basis) Index (company yard
basis)
EC 1.78% 3.83%
Japan 3.68% 12.83%
South Korea 28.59% 28.59%
Finland 14.25% 14.25%
The index for single yards indicates the wide dispersion of production by yard in the EC and
Japan. The second index however reflects the very high degree of concentration within Japan
when we group yards by company.
APPENDIX 7
Market Share and Exchange Rates
This section presents our findings on the relationship between market shares in shipbuilding
and exchange rate movements. Table 3 details the movements in market shares, defined as
the percentage on new orders in any given year, and exchange rate indices (with respect to
the dollar, 1980=1.00) across the four blocks, EC, Japan, South Korea and Scandinavia (ie.
Finland, Norway and Sweden). We use the Ecu exchange rate for the EC and a composite
exchange rate for Scandinavia defined as a weighted average of the three constituent
countries.
Table 3: Market Shares and Exchange Rate Indices
EC Japan South Scand-
Korea ana via
% mkt. Ecu % mkt. Yen % mkt Won % mkt. Ave.
share share share share
1980 23.1 1.00 46.7 1.00 6.5 1.00 7.7 1.00
1981 23.2 1.24 41.4 .97 6.4 1.12 9.0 1.17
1982 20.8 1.42 42.1 1.10 8.7 1.20 4.9 1.33
' 1983 12.7 1.56 49.8 1.05 14.5 1.28 3.5 1.54
1984 15.1 1.76 51.3 1.05 10.0 1.33 5.4 1.69
1985 21.1 1.83 43.0 1.05 7.8 1.43 2.9 1.76
1986 16.7 1.42 36.2 .74 14.3 1.45 4.2 1.47
1987 20.2 1.21 32.0 .64 19.9 1.35 8.7 1.31
1988 24.8 1.17 36.8 .57 13.2 1.20 2.6 1.26
1989 20.3 1.26 43.3 .61 12.3 1.11 4.2 1.32
1990 19.3 1.09 42.8 .64 15.2 1.17 3.2 1.19
1991 16.8 1.12 37.4 .59 18.6 1.25 2.1 1.18
Using the above data we carry out simple regressions to determine the nature of the
relationship between market share and exchange rate movements for Japan and the EC. The
analysis includes future exchange rate movements of up to three years to capture the impact
of anticipated exchange rate movements. This might be important for example in affecting
the current value of orders as well as the actual costs incurred during the production phase
specifically related to imported materials. Table 4 presents our findings for each case under
two specifications. The first is to test the hypothesis of a simple correlation between the
contemporaneous exchange rate and market share. The second represents the preferred
specification of a more general equation which initially included all three leads of the
exchange rate as well as the contemporaneous value. Note that since we are using exchange
rate indices an increase in the index represents a depreciation of the currency and thus a
positive coefficient implies that the market share increase with depreciation.
Table 4: Exchange Rate and Market Share Results
Country Intercept ER ER+1 ER+2 ER+3 R-
squared
EC .278 -.062 .20
(8.30) (-1.60)
EC .243 -.178 .149 .62
(8.37) (-3.04) (2.72)
Japan .273 .175 .45
(6.22) (2.87)
Japan .254 .353 -.178 .82
(8.12) (5.10) ( -2.50)
T-ratios in parentheses
There are specifically two conclusions of interest to be drawn. Firstly, for Japan, a very strong
positive relationship appears to exist between the current exchange rate (or more generally
a short term future exchange rate) and market share. Over the longer term the impact of the
exchange rate is positive. Secondly there does not appear to be any such relationship for the
EC. Instead there is a positive relationship between market share and the longer term
exchange rate countered by a smaller negative relationship with a short term (two-year lead)
exchange rate. We would interpret this as being consistent with the fact that billing periods
are longer in the EC then in Japan and that the impact of exchange rate movements on
material costs occurs relatively earlier (justifying a separate negative effect). Over the longer
run the impact of the exchange rate is relatively insignificant although slightly negative.
The fact that Japan's market share, overall, is strongly related to movements in the exchange
rate compared with the EC has fundamental implications for future market share
developments. Specifically if the yen depreciates against the dollar we could infer that Japan's
market share is more likely to increase. Current forecasts for the yen are however mixed.
Goldman Sachs forecast a depreciation of 4.8% in the Yen against the dollar over the next
18 months while the OECD forecasts an appreciation of between 3-4% in 1993. Over the
longer term, the London Business School also forecast that the Yen will continue to
strengthen with an appreciation of about 7.6% by 1999. Note that a 1% depreciation in the
yen (appreciation) effectively implies a 0.175% increase (decrease) in market share in the
immediate period.
SHIPYARDS 2/8/96
OlCaraAnn,
,.
si, il rapporto e ancora ad uso intemo. L'informazione mi e stata data da Mr. LONNOY, DG 111/D/5, che e uno dei responsabili del settore "Costruzione navale". Se tu volessi sapeme di piu, puoi mandargli un fax al N_ 67014.