3 Malaysia Sazlina Md Tahir I. Introduction Historical background The course of Malaysia history has been determined by its strategic position at one of the world’s major crossroads, its tropical climate, the surrounding environment and the regime of the north-east and south-west monsoons. It’s position and other geographical circumstances made the country a natural meeting place for traders from the east and the West. The lush tropical forest and the abundance of life existing in it and in the surrounding water made Malaysia an easy place for the settlement and sustenance of small, self- supporting human communities. At the same time the thick jungle and mountainous terrain of the interior inhibited communication, while the absence of broad, flood-proned river valleys and deltas precluded the development of elaborate systems of water control such as those upon which civilizations of Java and the Southeast Asian mainland came to be based. In contrast Malaysia’s development has come from the sea. Its inhabitants quickly acquired a skill and reputation as sailors and navigators. Subsequent trading contacts have been responsible for the waves of outside influence which have modified their way of life. A new phase in the historical development of the inhabitants of Malaysia began around the first century BC with the establishment of regular trading contacts with the world beyond Southeast Asia, specifically China and the sub-continent of India. Although Chinese contacts started as early as, if not predating those of India, it was the Hindu and Buddhist elements of Indian culture which made a major impact on the region. Over a period of a thousand years these influences gradually made themselves be felt, and have left their marks in the native language, literature and social custom. During this Hindu- Buddhist period which was marked by a tremendous growth in the East-west trade, the shadowy outlines of the first political units emerged in the Peninsula and in Kalimantan. However, for the greater part of this time the inhabitants of the area were subjected to the sway of either Javanese or Sumatran power. The most tangible evidence of the Hindu-Buddhist period in Malaysia history now to be found in the temple sites of Lembah Bujang and Kuala Merbok in Kedah. The Hindu-Buddhist period of Malaysian history ended with the penetration of Islam into the area. Brought primarily by Indian and Arab traders, there is evidence of the presence of the new religion in the region as early as the thirteen century. After 1400, Islam became a major influence with the conversion of the Malay-Hindu rulers of Melaka. From Melaka, Islam spread to other parts of the Malay Peninsula and to the Malay states in Sumatra and along the trade routes throughout the Indonesian archipelago. Once established as the religion of the Malays, Islam profoundly affected Malay society and the Malay way of life. After the collapse of Melaka, the sultanate of Brunei in Kalimantan rose to become the principal agent for the propagation of Islam in that area. The Malay kingdom of Melaka which dominated both sides of the straits of Melaka for a hundred years marked the classical age of Malay culture. Most of the Malay states of the Peninsula today can trace their genesis back to the Melaka sultanate. In Kalimantan the inhabitants of modern Sabah and Sarawak lived an autonomous existence although the ancient kingdom of Brunei exercised a general sway over them until the end of the nineteenth century. European penetration and colonialism Both the Melaka and Brunei empires were shattered by the coming of the Europeans into the region. Melaka fell to a sudden Portuguese assault in 1511. The power of was crippled in its infancy by the establishment of the Spaniards in the Philippines and by the rise of Dutch power in Java. Johor tried to take place of Melaka but was restricted not only by the Europeans, but also by the activities of local rivals 91
Transcript
3 Malaysia Sazlina Md Tahir I. Introduction Historical background
The course of Malaysia history has been determined by its strategic position at one of the world’s major crossroads, its tropical climate, the surrounding environment and the regime of the north-east and south-west monsoons.
It’s position and other geographical circumstances made the country a natural meeting place for traders from the east and the West. The lush tropical forest and the abundance of life existing in it and in the surrounding water made Malaysia an easy place for the settlement and sustenance of small, self-supporting human communities. At the same time the thick jungle and mountainous terrain of the interior inhibited communication, while the absence of broad, flood-proned river valleys and deltas precluded the development of elaborate systems of water control such as those upon which civilizations of Java and the Southeast Asian mainland came to be based. In contrast Malaysia’s development has come from the sea. Its inhabitants quickly acquired a skill and reputation as sailors and navigators. Subsequent trading contacts have been responsible for the waves of outside influence which have modified their way of life.
A new phase in the historical development of the inhabitants of Malaysia began around the first century BC with the establishment of regular trading contacts with the world beyond Southeast Asia, specifically China and the sub-continent of India. Although Chinese contacts started as early as, if not predating those of India, it was the Hindu and Buddhist elements of Indian culture which made a major impact on the region. Over a period of a thousand years these influences gradually made themselves be felt, and have left their marks in the native language, literature and social custom. During this Hindu-Buddhist period which was marked by a tremendous growth in the East-west trade, the shadowy outlines of the first political units emerged in the Peninsula and in Kalimantan. However, for the greater part of this time the inhabitants of the area were subjected to the sway of either Javanese or Sumatran power. The most tangible evidence of the Hindu-Buddhist period in Malaysia history now to be found in the temple sites of Lembah Bujang and Kuala Merbok in Kedah.
The Hindu-Buddhist period of Malaysian history ended with the penetration of Islam into the area. Brought primarily by Indian and Arab traders, there is evidence of the presence of the new religion in the region as early as the thirteen century. After 1400, Islam became a major influence with the conversion of the Malay-Hindu rulers of Melaka. From Melaka, Islam spread to other parts of the Malay Peninsula and to the Malay states in Sumatra and along the trade routes throughout the Indonesian archipelago. Once established as the religion of the Malays, Islam profoundly affected Malay society and the Malay way of life. After the collapse of Melaka, the sultanate of Brunei in Kalimantan rose to become the principal agent for the propagation of Islam in that area.
The Malay kingdom of Melaka which dominated both sides of the straits of Melaka for a hundred years marked the classical age of Malay culture. Most of the Malay states of the Peninsula today can trace their genesis back to the Melaka sultanate. In Kalimantan the inhabitants of modern Sabah and Sarawak lived an autonomous existence although the ancient kingdom of Brunei exercised a general sway over them until the end of the nineteenth century. European penetration and colonialism
Both the Melaka and Brunei empires were shattered by the coming of the Europeans into the region. Melaka fell to a sudden Portuguese assault in 1511. The power of was crippled in its infancy by the establishment of the Spaniards in the Philippines and by the rise of Dutch power in Java. Johor tried to take place of Melaka but was restricted not only by the Europeans, but also by the activities of local rivals
91
such as the Achinese, Minangkabau and the Bugis. As a result, the present day states of the Peninsula gradually emerged as sovereign units in their own right.
Despite their technological superiority, European power in the region remained restricted until the British intrusion at the end of the eighteen century which brought the resources and the organization of the Industrial Revolution. From their new bases of Pulau Pinang (1786), Singapore (1819) and Melaka (1824), which became known collectively as the straits settlements, their influence and power spread into the Malaya Peninsula, and the process of political integration of the Malays states of the Peninsula into a modern nation state begin. In 1824 the Malay world was arbitrarily divided into British and Dutch spheres of influence. In 1874, the British took steps towards bringing the Peninsula state under their direct supervision when they imposed the Pangkor Treaty on the rulers of Perak and made similar arrangements in Selangor. Meanwhile in Kalimantan, the states of Sarawak and Sabah were beginning to take shape as British adventures acquired the territories at the expense of the Brunei Sultanate. The Japanese conquest and its aftermath
The Japanese invasion of Malaya and British Borneo in late 1941, which culminated in the humiliating British surrender in Singapore two and half months later, shattered Western colonial supremacy and unleashed the forces of incipient nationalism. Although the British were able to resume their authority in the region after the collapse of Japan in 1945, they faced an entirely new political situation and those circumstances forced them to adopt new policies. As a results the straits settlement were dissolved. Pulau Pinang and Melaka were joined with the Malay states of the Peninsula to form a new Malayan Union. Singapore became separate crown colony and so did both Sarawak and British North Borneo in place of the former Brooke and chartered Company regimes. Labuan was joined to British North Borneo.
These new arrangements met with considerable Malaysian opposition. In Sarawak a strong campaign developed opposing the crown colony status and culminated in the assassination of the second British governor (1949). But the most serious opposition was in the Malay Peninsula against the Malayan Union which reduced the status of the Malay states virtually to that of a British colony. Consequently, the British were obliged to abandon the Malayan Union scheme, and in 1948 in its place established the Federation of Malaya, after protracted negotiations with the Malay Rulers, the United Malays National Organisation (UMNO) and other parties concerned. The new federation consisted of all the nine Malay states of the Peninsula, along with Melaka and Pulau Pinang, united under a federal government in Kuala Lumpur headed by a British High Commissioner. Malayan independence
By the arrangement of 1948 the British had committed themselves to preparing the way for the Federation’s independence. Under the twin pressures of a communist rebellion (the emergency) and the development of a strong Malay nationalist movement (represented by UMNO), the British introduced elections, starting at local level in 1951. The problem of obtaining political cooperation among the main ethnic groups in the country to fight for independence was resolved by the successful establishment of an alliances between UMNO and the Malayan Chinese Association (MCA), the two principal communal parties, in the same year, which was subsequently joined by the Malayan Indian Congress (MIC). When the first federal election were held in 1955, the UMNO-MCA-MIC Alliance, headed by Tunku Abdul Rahman won an overwhelming victory (51 out of the 52 seats contested), and the Tunku was appointed the Federation‘s first Chief Minister. The Alliance was successful.
Environment
A. Topography
In Peninsular Malaysia a mountainous spine known as the Main Range or Banjaran Titiwangsa runs from the Thai border southwards to Negeri Sembilan, effectively separating the eastern part of the interior of Kelantan, Terengganu and Pahang is also mountainous and contains the highest peak in the Peninsula,
92
Gunung Tahan (2187 m). As the result of the configuration of the country and of the heavy rainfall, they are many rivers which, until just over one hundred years ago, formed the main arteries for trade and travel and whose historical importance is underlined by the fact that nearly all of the states of the peninsular take their names from the principal river each. The longest of these rivers is the Sungai Pahang (475 km), followed by the Sungai Perak (400 km).
The rivers of Sarawak and Sabah are longer than those of the Peninsula. The longest is the Rejang of Sarawak (563 km) which is navigable from small coastal steamers as far as Kapit, 160 km upstream. One of the most prominent mountain ranges in Sabah is the Crocker Range with an average of 457 to 914m, which separates the narrow lowland of the north-west coast from the interior. The Crocker Range culminates in Gunung Kinabalu (4,101 m), the highest mountain in Malaysia and in Southeast Asia. Malaysia’s third highest mountain, Gunung Tambuyukon (2,579 m) is close by, while the country’s second highest peak Gunung Trus Madi (2,579 m) is in the same range. In Sarawak the two highest peak are Gunung Murud (1,428 m) which also boasts of the largest natural caves in the world.
About four fifths of Malaysia are covered by tropical rain forest. Rice cultivation is practiced throught the Peninsula but the main and traditional are the states of Perlis, Kedah and mainland Pulau Pinang. Newer areas for large scale rice population are also to be found in Perak, Selangor and Kelantan.Most of the large rubber and oil palm estates on the West Coast of the Peninsula as are also the nation’s main tin deposits.
B. Climate
Malaysia lies entirely in the equatorial zone. The climate is governed by the regime of the north-east and south-west monsoons which blow alternately during the course of the year and whose existence in the days of sailing ships made the country the natural meetings and exchange point for traders from East and West. The North-East monsoons blow from approximately mid November till March, and the south-west monsoon between May and September, the periods of change between the two monsoons being marked by heavy rainfall. The period of the south-west monsoon is a drier period for the whole country, particularly for the other states of the west coast of the Peninsula, sheltered by the land mass of Sumatra. Being in the tropics the average temperature throughout the year is constantly high (26C). The diurnal temperature range is about 7C. regional variation in temperature and rainfall is mainly due to relief, e.g. Cameron Highlands has a mean temperature of 18C and an annual rainfall of over 2,500mm compared to Kuala Lumpur’s 27C and 2,410mm. near the coasts, land and sea breezes modify the temperature, while being surrounded on virtually all sides by sea results in the Peninsula’s rather equable. Mornings are generally fine and convectional rainfall in the afternoons are often accompanied by lightning and thunder. The humidity is high rate of evaporation, and the rainfall is heavy (more than 2,500mm).
The forest of Peninsula Malaysia abound with an enormous variety of wildlife. The wealth and variety of the vegetation of the forest have enabled an astonishing proliferation of animal types. Malaysia is listed as one of the world’s ‘megadiversity’ countries and has over 150,000 species of invertebrates, 286 mammal species, 736 bird species and 15,000 types of flowering plants.
People and History
As of the 2012, the population of Malaysia was 29, 179, 952 (July 2012 est.) making it the 43rd most populated country. The population of Malaysia consists of many ethnic group. Malays make up 50.4 per cent of the population, while other Bumiputera make up another 11 per cent. According to constitutional definition, Malays are Muslim who practice Malay custom and culture. They play a dominant role politically. Bumiputra status is also accorded to the natives of Sabah and Sarawak. Non-Malay Bumiputera make up more than half of Sarawak’s population and over two third of Sabah’s population. There also exist aboriginal groups in much smaller numbers on the peninsula, where they are collectively known as Orang Asli. Laws over who gets Bumiputera status vary between states. Other minorities who lack Bumiputera status make up a large amount of the population. 23.7 percent of the population are of Chinese descent, while those of Indian descent comprise 7.1 percent of the population.
93
Political Structure When Malaysia received its independence in 1957, it chase to establish a government based on the
concept of parliamentary constitutional monarchy with a federal government structure. The present constitution, with its parliamentary and cabinet system, is based on the British Westminster model. The British laid the foundation for the federal government in Malaya in 1885 when they successfully introduced the concept of federation by joining the administration of the four Malay states (Perak, Selangor, Negeri Sembilan and Pahang) under the Federated Malay States. Johor, Terengganu, Kelantan, Kedah and Perlis were controlled individually by the British in the name of the Unfederated Malay States. The Malaysian constitution is derived from the constitution of federation of Malaya on August 31, 1957. When Malaysia was formed on September 16, 1963, the existing Federation of Malaya Constitution was retained but amended and adjusted so as to permit the admission of Sabah and Sarawak and make provision for their particular (20-point agreement) requirements.
Since independence, Malaysia is being ruled by Barisan National (National Front) coalition of political parties. Formerly known as Alliance, but in 1971 it became Barisan Nasional. The party has easily retained its majority in Parliament throughout the nine elections held since the nation attained its independence.
Religious and Structure All of the world’s major religions have substantial representation in Malaysia, the main adherents of
each largely reflecting the multi-ethnic character of the population. According to the Constitution, Islam is the religion of the Malaysian federation. However, the Constitution also provides that every person has the right to profess and practice his own religion, and also has the right to propagate his faith, although the right to propagate other religion is not permitted by law among persons who are Muslims.
94
II. Overview of Macroeconomics Activities II.1 Macroeconomics Activities
Despite the challenging international economic environment in 2011, the Malaysian economy recorded a steady pace of growth of 5.1% (2010: 7.2%). Growth was more moderate in the first half of the year, particularly in the second quarter, as the economy was affected by the overall weakness in the advanced economies and the disruptions in the global manufacturing supply chain arising from the disaster in Japan. Although the global economic environment became increasingly more challenging and uncertain in the second half-year, Malaysia’s economic growth improved due to stronger domestic demand. Domestic demand registered a higher growth in 2011, driven by both household and business spending, and higher public sector consumption. Private consumption strengthened in 2011, supported by broad-based income growth, following the improvement in the overall labour market conditions. Households in the rural area benefited from the higher rubber and palm oil prices.
Private investment remained firm, although growth moderated slightly in the second half of the year, as the external environment became more uncertain. Public consumption also recorded a higher growth in 2011, in tandem with the Government’s efforts to improve public delivery services. However, public investment contracted during the year following the lower disbursement of development expenditure by the Federal Government. Investment by the non-financial public enterprises (NFPEs), nevertheless, remained strong during the year. While the external demand for electronics and electrical (E&E) products was affected by the weaker global trade, exports of commodities and non-E&E products remained strong throughout the year, providing additional support to growth.
The strong expansion in domestic demand was a key factor in driving the overall growth of the domestic-oriented sectors, while firm regional demand provided support to the commodity-related manufacturing industries and the agricultural sector. The services sector grew strongly in 2011 and remained the largest contributor to growth. The robust expansion in private consumption had provided support to the wholesale and retail trade, and accommodation and restaurant sub-sectors. The manufacturing sector expanded at a much slower pace amid weaker performances in both the export- and domestic-oriented industries.
The former was mainly on account of softer external demand and disruptions in the global E&E supply chain, while the latter was due mainly to the contraction in the transport equipment industry following the supply-chain disruptions. Higher production of palm oil had contributed to the stronger growth in the agricultural sector, while the construction sector moderated following the completion of several major projects. The mining sector contracted in 2011, as the output of crude oil and condensates was affected by the shutdown of several production facilities. Headline inflation averaged at 3.2% in 2011 (2010: 1.7%). The increase in inflation, particularly during the first half of the year, was due mainly to supply factors arising from higher food prices and upward adjustments to administered prices.
Inflation peaked in June at 3.5% and trended lower in the second half of 2011, as the impact from the upward adjustments on the prices of petroleum products and sugar in July and December 2010 wore off. Core inflation, an indicator of demand-driven pressures on prices, rose to 2.6% in 2011 (2010: 1.5%). Malaysia’s external position improved in 2011. The overall balance of payments turned around to record a strong surplus as the current account surplus widened and the financial account turned positive. The larger surplus in the trade account, arising mainly from the strong commodity exports which largely benefited from the higher prices, and a lower deficit in the income account, had contributed to the wider surplus in the current account. The positive balance in the financial account was largely attributable to the continued inflows of portfolio funds and foreign direct investment (FDI). Direct investment abroad registered a higher net outflow as the Malaysian companies continued to expand businesses abroad. Other investment outflows, primarily comprising of trade credits and banking flows, moderated sharply during the year. After adjusting for the errors and omissions, the overall balance of payments recorded a large surplus of
95
RM94.7 billion. Consequently, the net international reserves of Bank Negara Malaysia amounted to RM423.3 billion, equivalent to USD133.6 billion, as at 31 December 2011. II.1.1 International Environment A. Trade Balance Exports Malaysia’s export sector has evolved significantly over the five recent decades. In line with the nation’s economic industrialisation, the composition of exports had gradually shifted from comprising mainly of agricultural and mining products in the 1960s to manufactured goods in the 1980s. The development and growth of the manufacturing sector was so rapid that by the late 1990s, the sector accounted for more than 80% of total exports. Today, manufactured goods remain the largest component of total exports. Since 2000, two notable trends have emerged in Malaysia’s export structure. First, the gradual move away from a heavy concentration in electrical and electronics (E&E) exports, towards non-E&E manufactured products and commodities. The second key trend is the diversification of Malaysia’s export markets. This box article examines Malaysia’s changing export structure since 2000, identifies the reasons underpinning this trend and broadly outlines key challenges facing the export sector going forward. Figure 1 : Components of Malaysia's Exports Jan - Jul 2012 (RM Billion)
Source: Department of Statistics, Malaysia
Manufactured GoodsRM274.69 Billion (67.1%)
Mining GoodsRM84.24 Billion (20.6%)
Agricultural GoodsRM47.12 Billion (11.5%)
OthersRM3.27 Billion 0.8%)
Compiled By : Matrade Exports Destinations
Another key emerging trend is the greater diversification in the destination of Malaysia’s exports. While the share of Malaysia’s exports to traditional markets such as the US, Japan and the European Union (EU) remains high, demand from the regional economies, particularly East Asia, has risen substantially since 2000 (Chart 7). ASEAN1 remains a key export market, accounting for about 25% of Malaysia’s total exports. Of significance is also the deepening of trade linkages with other Asian economies, particularly the PR China and India. The share of Malaysia’s exports to PR China has quadrupled from 3.1% in 2000 to 12.5% in 2010. There has also been an accompanying rise in Malaysia’s imports from PR China, thus resulting in PR China as Malaysia’s largest trading partner. The rise in bilateral trade relations with PR China has made Malaysia the largest trading partner in South East Asia of PR China. Beyond Asia, Malaysia has also experienced growth in trade with Australia and New Zealand, as well as new markets such as those in the Middle East and Latin America.
96
The changing structure of Malaysia’s exports over the past decade can also be seen in the context of the concurrent rise of the emerging economies. It is projected that the emerging economies will grow twice as fast as the advanced economies and account for more than half of all global growth by 2025 In parallel with this development, a new global middle class is emerging in these countries, resulting in changes in the pattern of global consumption with the growing significance of consumption expenditure in emerging economies. This shift in global consumers is also transforming the patterns of global trade, with trade not only fl owing from the advanced economies into emerging economies, but also increasingly among emerging economies. In response to these developments, the product composition and destination of Malaysia’s exports has also been shifting, with a greater focus on the emerging economies. These changes reduce the nation’s vulnerability as exports become less dependent on any specific product or economy. Figure 2 : Malayisia's Export Destination
40.2%
12.5%
47.2%47.7%
21.6% 30.7%
0.0%20.0%40.0%60.0%80.0%
100.0%
East Asia Rest of the World Advanced Economies
2000 2010
Source: Department of Statistics, Malaysia Imports Figure 3 : Malaysia's Top 10 Imports Jan - Jul 2012 in RM Billion
Electrical & Electronic Products
(28.9%), 102.63
Chemicals Chemical Products (8.7%),
30.72Machinery,
Appliances & Parts (8.8%), 30.37
Refined Petroleum Products (7.7%),
27.42Transport Equipment (6.1%), 21.49
Manufactures of Metal (5.4%), 19.16
Crude Petroleum (4.8%), 17.06
Iron & Steel Products (4.2%), 14.8
Optical & Scientific Equipment (3.0%),
10.59
Processed Food (2.3%), 8.01
Other Products (20.4%), 72.39
Source: Department of Statistics, Malaysia
97
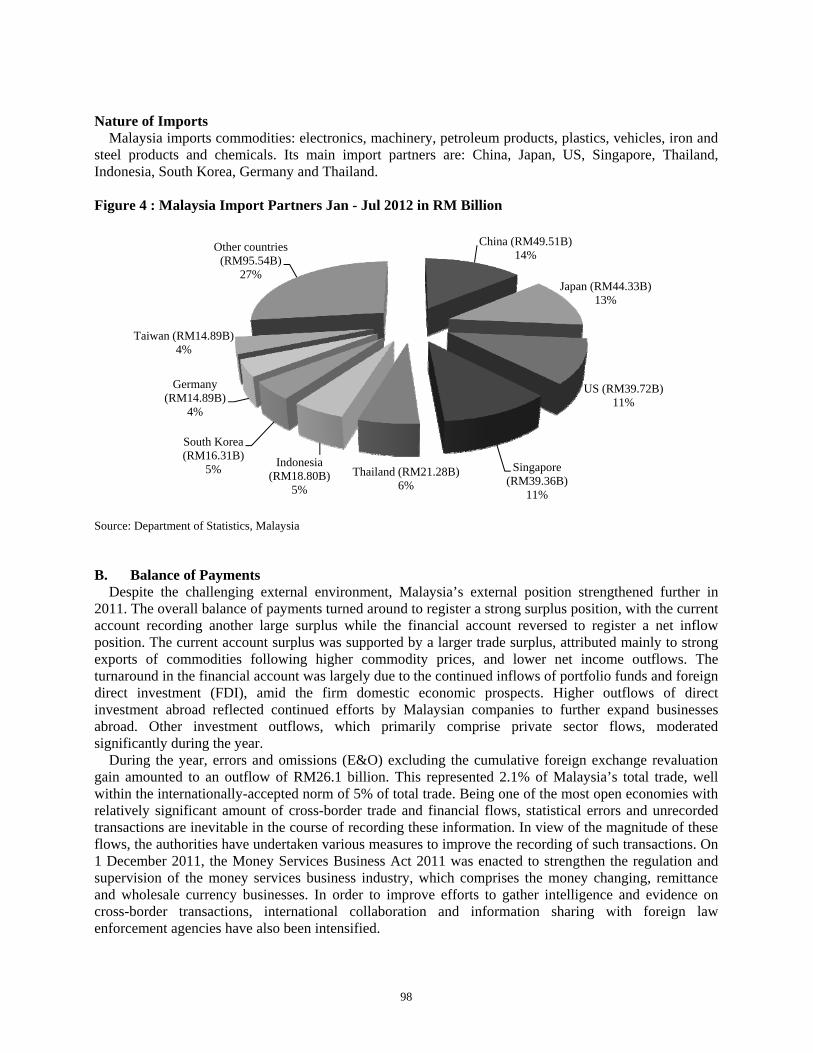
Nature of Imports
Malaysia imports commodities: electronics, machinery, petroleum products, plastics, vehicles, iron and steel products and chemicals. Its main import partners are: China, Japan, US, Singapore, Thailand, Indonesia, South Korea, Germany and Thailand. Figure 4 : Malaysia Import Partners Jan - Jul 2012 in RM Billion
Source: Department of Statistics, Malaysia
China (RM49.51B)14%
Japan (RM44.33B)13%
US (RM39.72B)11%
Singapore (RM39.36B)
11%
Thailand (RM21.28B)6%
Indonesia (RM18.80B)
5%
South Korea (RM16.31B)
5%
Germany (RM14.89B)
4%
Taiwan (RM14.89B)4%
Other countries (RM95.54B)
27%
B. Balance of Payments
Despite the challenging external environment, Malaysia’s external position strengthened further in 2011. The overall balance of payments turned around to register a strong surplus position, with the current account recording another large surplus while the financial account reversed to register a net inflow position. The current account surplus was supported by a larger trade surplus, attributed mainly to strong exports of commodities following higher commodity prices, and lower net income outflows. The turnaround in the financial account was largely due to the continued inflows of portfolio funds and foreign direct investment (FDI), amid the firm domestic economic prospects. Higher outflows of direct investment abroad reflected continued efforts by Malaysian companies to further expand businesses abroad. Other investment outflows, which primarily comprise private sector flows, moderated significantly during the year.
During the year, errors and omissions (E&O) excluding the cumulative foreign exchange revaluation gain amounted to an outflow of RM26.1 billion. This represented 2.1% of Malaysia’s total trade, well within the internationally-accepted norm of 5% of total trade. Being one of the most open economies with relatively significant amount of cross-border trade and financial flows, statistical errors and unrecorded transactions are inevitable in the course of recording these information. In view of the magnitude of these flows, the authorities have undertaken various measures to improve the recording of such transactions. On 1 December 2011, the Money Services Business Act 2011 was enacted to strengthen the regulation and supervision of the money services business industry, which comprises the money changing, remittance and wholesale currency businesses. In order to improve efforts to gather intelligence and evidence on cross-border transactions, international collaboration and information sharing with foreign law enforcement agencies have also been intensified.
98
After adjusting for the E&O, the overall balance of payments recorded a large surplus position of RM94.7 billion. Consequently, the net international reserves of Bank Negara Malaysia amounted to RM423.3 billion, equivalent to USD133.6 billion, as at 31 December 2011. As at 29 February 2012, the reserves remained high at RM426.7 billion (equivalent to USD134.7 billion). This level of reserves is adequate to finance 9.4 months of retained imports and is 4.1 times of the short-term external debt. Malaysia’s external reserves remain usable and unencumbered. Table 1 : Balance of Payments
RM billion
+ - Net + - NeGoods 640.0 505.3 134.7 696.1 546.7 149.4 Trade cccount 638.8 528.8 110.0 694.5 574.2 120.3Services 105.3 103.6 1.7 107.1 115.5 -8.4Balance on Goods and Services 745.3 608.9 136.4 803.2 662.2 141.0Income 38.3 64.8 -26.5 52.0 74.1 -22.0Current Transfers 1.9 23.7 -21.8 4.7 25.8 -21.1Balance on current account 785.5 697.4 88.1 859.9 762.1 97.9 % of GNI 11.9 11.8Capital account -0.2 -0.2Financial account -19.8 15.5 Direct investment -13.6 -12.4 Portfolio investment 48.5 30.3 Financial derivatives -0.7 -0.1 Other investment -54.0 -2.4Balance on capital and financial accounts -20.0 15.3Error and omissions -70.7 -18.5 of which : Foreign exchange revaluation gain (+) and loss (-) -32.6 7.6Overall balance -2.6 94.7 Bank Negara Malaysia international reserves, net 328.6 423.3 USD billion equivalent 106.6 133.6
2010 2011 (preliminary)Itemst
Source : Department of Statistics Malaysia C. External Debt Development
To further enhance efficiency in the management of corporate finance and access to more competitive financing, flexibility was accorded for resident corporations to freely borrow in ringgit or foreign currency within a corporate group in Malaysia and from abroad. In tandem with the flexibility accorded for accessing offshore borrowing, resident corporations were also able to undertake effective asset and liability management through the well-developed domestic financial markets. An early detection mechanism of possible risks to monetary and financial stability has been put in place. In line with this, continuous emphasis is placed on having a well-functioning and robust debt monitoring system that covers the overall debt level, structure, maturity and debt-servicing obligations.
As at end-2011, Malaysia’s total external debt amounted to RM257.2 billion (or USD80.4 billion), equivalent to 31% of GNI (2010: RM227.1 billion). This reflected the increase in both medium- and long-term and short-term debt. The appreciation of some of the major currencies against the ringgit during the year also contributed to the rise in the overall external debt level. As at end-year, Malaysia’s external debt profile continued to be skewed towards a longer maturity structure with medium- and long-term debt accounting for 59.6% of total external debt.
The increase in the medium and long-term external debt partly reflected the net drawdown of external borrowings by the Federal Government and private sector. In July 2011, the Federal Government successfully issued a dual tranche (5-year and 10-year) Wakala Global Sukuk of USD2 billion. The issuance was Malaysia’s third US dollar-denominated sovereign sukuk issuance, after the previous Global Sukuk issuance in 2010. As at end-year, the outstanding external debt of the Federal Government rose to
99
RM18.1 billion (2010: RM16.7 billion), as higher gross borrowings and exchange rate revaluation losses more than offset repayments during the year. The external debt of the NFPEs however declined to RM65 billion in 2011 (2010: RM66.6 billion). The improvement came mainly from large repayments of external loans following the maturity of several bonds, as well as continued loan repayments throughout the year. The medium- and long-term debt of the private sector increased to RM70.3 billion (2010: RM64.3 billion), following net drawdown of external borrowings by the banking sector, which outweighed the net repayment by the non-bank sector. During the year, outstanding short-term external debt rose to RM103.9 billion (2010: RM79.4 billion), attributed primarily to increased interbank borrowings. The bulk of the short-term debt continued to be held by the banking sector (88.9% share). The short-term external debt of the nonbank private sector, comprising mainly of term loans, remained low. As at end-2011, the short term external debt remained low, accounting for only 12.5% of GNI, 24.5% of international reserves and 12.9% of exports of goods and services. Table 2 : Outstanding External Debt
Total debt 227.1 257.2 73.3 83.0 Medium and long term 147.7 153.4 47.6 49.5 Short term* 79.4 103.9 25.6 33.5 As % of total debt 35.0 40.4 11.3 13.0 As % of net international reserves 24.2 24.0 7.8 7.7As % of GNI Total debt 30.7 31.0 9.9 10.0Medium and long term debt 20.0 18.5 6.5 6.0As % of exports of goods and services Total debt 30.5 32.0 9.8 10.3 Medium and long term debt 19.8 19.1 6.4 6.2Debt service ratio (%)** 7.6 10.3 2.5 3.3
Items
* Exclude currency and deposits held by non-resident with resident banking institutions ** Include prepayment of medium and long term debt p Preliminary Source : Ministry of Finance Malaysia and Bank Negara Malaysia D. Foreign Direct Investment (FDI)
Gross inflows of FDI remained significant at RM98.9 billion, accounting for 11.9% of GNI in 2011, in tandem with the strong overall domestic investment outlook and a revival of corporate earnings. This was evident in the larger inflows of equity capital and the extension of inter-company loans, amid sizeable earnings retained by existing multinational corporations (MNCs) for reinvestment purposes. Malaysia’s growth prospects were a key factor underpinning this trend. The domestic investment climate was further boosted by various Government-facilitated economic initiatives.
Throughout the year, several Entry Point Projects (EPPs) under the Economic Transformation Programme (ETP) had attracted substantial investments from foreign investors. Moreover, Malaysia’s improved position in various cross-country economic rankings enhanced investment prospects in the country. Notably, Malaysia made progress in the rankings for global competitiveness, ease of doing business, and FDI confidence, according to reports released by the World Economic Forum, World Bank and global management consultants, AT Kearney. After taking into account adjustments for outflows due largely to loan repayments to parent companies, the net inflow of FDI was higher at RM32.9 billion or 4.0% of GNI.
FDI in Malaysia continued to be broad-based, with inflows into the manufacturing sector accounting for most of the FDI (59.2% share), followed by the services (30.3%) and oil and gas (9.6%) sectors. In the manufacturing sector, FDI was mainly channelled into the E&E industry, largely by existing MNCs for
100
the upgrading of equipment and production technology. Other investments in the manufacturing sector were in petroleum refining and petroleum-related products industry, which continued to account for a sizeable portion of FDI in Malaysia. At the same time, there have also been increasingly substantial investments by firms in the solar-energy industry during the year. These investments will boost the expansion of the solar-energy value chain in Malaysia. In the services sector, FDI inflows were channelled primarily into the wholesale and retail sub-sector, followed by the finance and insurance sub-sector. Of significance, the bulk of investments in the finance and insurance sub-sector were undertaken by foreign financial institutions, mainly in the form of corporate earnings retained for reinvestment. In the wholesale and retail sub-sector, FDI inflows were mainly attributed to foreign general retailers, motor vehicle distributors, and distributive companies related to telecommunications and electronic products.
Investments in the oil and gas sector were largely for extraction operations and production activities. In terms of the country of origin of FDI, major contributors of FDI inflows in 2011 were the advanced economies, particularly the US, Japan and Germany. It is important to note that FDI from regional countries has increased in recent years, accounting for 32.3% of total FDI to Malaysia in 2011, relative to 10.1% in 2003. Figure 5 : Foreign Direct Investment (FDI)
p Preliminary f Forecast Source: Department of Statistics, Malaysia B. Inflation
Inflation is a rise in the general level of prices of goods and services in an economy over a period of time. When the general price level rises, each unit of currency buys fewer goods and services. Consequently, inflation also reflects an erosion in the purchasing power of money – a loss of real value in the internal medium of exchange and unit of account in the economy. A chief measure of price inflation is the inflation rate, the annualized percentage change in a general price index (normally the Consumer Price Index) over time.
Inflation's effects on an economy are various and can be simultaneously positive and negative. Negative effects of inflation include an increase in the opportunity cost of holding money, uncertainty over future inflation which may discourage investment and savings, and if inflation is rapid enough, shortages of goods as consumers begin hoarding out of concern that prices will increase in the future. Positive effects include ensuring that central banks can adjust real interest rates (intended to mitigate recessions), and encouraging investment in non-monetary capital projects.
Economists generally agree that high rates of inflation and hyperinflation are caused by an excessive growth of the money supply. Views on which factors determine low to moderate rates of inflation are more varied. Low or moderate inflation may be attributed to fluctuations in real demand for goods and services, or changes in available supplies such as during scarcities, as well as to growth in the money supply. However, the consensus view is that a long sustained period of inflation is caused by money supply growing faster than the rate of economic growth.
Today, most economists favor a low, steady rate of inflation. Low (as opposed to zero or negative) inflation reduces the severity of economic recessions by enabling the labor market to adjust more quickly in a downturn, and reduces the risk that a liquidity trap prevents monetary policy from stabilizing the economy. The task of keeping the rate of inflation low and stable is usually given to monetary authorities. Generally, these monetary authorities are the central banks that control monetary policy through the setting of interest rates, through open market operations, and through the setting of banking reserve requirements. Inflation Outlook in Malaysia
Headline inflation is expected to moderate in 2012, averaging between 2.5 - 3.0%. The lower inflation projection reflects moderation of global commodity prices for 2012 as a whole and slower global inflation precipitated in part, by the weaker global growth outlook. Domestically, the moderation in growth of domestic demand would also restrain price pressures. In the absence of significant adjustments to administered prices, the pressure on domestic inflation would remain contained.
Global commodity prices are expected to remain elevated in 2012. For food commodities, the Food and Agriculture Organisation of the United Nations (FAO), in its November 2011 edition of Food Outlook, projected that food prices would remain below the February 2011 peak, but would continue to be high and volatile. Despite the global slowdown, demand for high-protein food from countries experiencing sustained growth would continue to be strong. In terms of supply, while there are expectations of an improvement in production, particularly for cereals, there is also a higher probability that bad weather conditions could adversely affect production. The Intergovernmental Panel on Climate Change (IPCC) projected a high likelihood of warm spells on a global scale. High costs of inputs, such as fertilisers and energy would also continue to exert upward pressure on food prices.
Crude oil prices are expected to remain volatile n 2012, but the levels would be restrained by the slower growth of the global economy. The deterioration in global growth prospects prompted the International Energy Agency (IEA) to trim its 2012 projections for oil demand growth to 0.8 million barrels per day (mb/d) from an earlier forecast of 1.1 mb/d. Conversely, despite the higher output target announced by the rganisation of the Petroleum Exporting Countries (OPEC), geopolitical tensions in the MENA region have raised uncertainties over oil supply. This could keep oil prices high throughout 2012. The IMF’s World Economic Outlook (WEO) update in January 2012 projected crude oil to trade at an average1 of USD99 per barrel in 2012, slightly lower than the 2011 average price of USD104.
Inflationary pressures among Malaysia’s key import partners are expected to be modest in 2012 in line with weaker global growth and lower global commodity prices. Weak consumer confidence, prevailing economic slack and subdued demand pressures would keep inflationary pressures muted in the advanced economies. The January 2012 update of the WEO projected a lower inflation of 1.6% for the advanced economies (2011: 2.7%). Price pressures are also expected to be moderate in the emerging economies in line with the stable domestic demand in these economies. The emerging and developing economies are expected to register a lower inflation of 6.2% in 2012 (2011: 7.2%). The reduced pressure from external
prices could provide greater flexibility for producers to align prices with the more moderate domestic demand.
Price pressures arising from demand factors are expected to be contained as the growth of both private consumption and investment are projected to soften. However, the upward revision of public sector wages and other measures announced in the 2012 Budget would continue to support household consumption spending in 2012. Overall, the economy is expected to operate slightly below its potential. Firms would be able to accommodate the demand as production capacity had expanded following high investment in previous years.
There are, however, upside risks to inflation from both the external and domestic factors. Externally, there is potential for upward bias in global commodity prices. First, if global is stronger than expected, the corresponding expansion in global demand could exert significant upward pressure on prices, as production may not be able to adjust quickly enough to meet the unexpected surge in demand. Second, geopolitical risk to oil supply could intensify further and escalate the upward pressure on oil prices. Third, the surplus liquidity that is flooding the major financial markets, and the resulting search for higher yields, could spill over to the commodity markets. The low interest rate environment, and possible weakness in the US dollar could prompt more speculative investment in commodities, further driving up prices. While recognizing these risks, the dominant assumption is that slower global growth would restrain increases in commodity prices.
Aside from the external factors, there are also potential upside risks from domestic supply factors. Potential supply disruptions could keep food prices elevated. High vegetables, fruits and fish prices may persist due to labour shortages and adverse weather conditions. Meat prices could remain elevated if higher global corn prices lead to more expensive feed. There could also be possible adjustments to administered prices if global commodity prices are higher than expected.
The inflation rate in Malaysia was recorded at 1.40 percent in August of 2012. Historically, from 2005 until 2012, Malaysia Inflation Rate averaged 2.7 Percent reaching an all time high of 8.5 Percent in July of 2008 and a record low of -2.4 Percent in July of 2009. Inflation rate refers to a general rise in prices measured against a standard level of purchasing power. The most well known measures of Inflation are the CPI which measures consumer prices, and the GDP deflator, which measures inflation in the whole of the domestic economy. This page includes a chart with historical data for Malaysia Inflation Rate. Figure 8 : Malaysia Inflation Rate Annual Change on Consumer Price Index
Source: Department of Statistics, Malaysia
-3.0%
-1.0%
1.0%
3.0%
5.0%
7.0%
9.0%
Jan-
06A
pr-0
6Ju
l-06
Oct
-06
Jan-
07A
pr-0
7Ju
l-07
Oct
-07
Jan-
08A
pr-0
8Ju
l-08
Oct
-08
Jan-
09A
pr-0
9Ju
l-09
Oct
-09
Jan-
10A
pr-1
0Ju
l-10
Oct
-10
Jan-
11A
pr-1
1Ju
l-11
Oct
-11
Jan-
12A
pr-1
2Ju
l-12
104
Table 4 : Inflation Rate, year-on-year change of the consumer price index, average of period As of February 2011
Country Base Year 2004 2005 2006 2007 2008 2009 2009 2010
Source : Asean Finance and Macro-economics Surveillance Unit Database Determinants of Inflation in Malaysia
The drivers of inflation changes over time with the evolution of the structure of the economy, the behaviour of economic agents and economic cycles. This article looks at the structural determinants of inflation in Malaysia and how these determinants have evolved, the key supply and demand forces driving periods of high inflation, and concludes on the future challenges in managing domestic inflation. Structural Determinants of Inflation
Since independence, the Malaysian economy has witnessed rapid evolution from being agriculture based to manufacturing-driven and then to being service-based. As the economy developed and incomes grew, household expenditure patterns that underlie the Consumer Price Index (CPI1) have also evolved. In the early 1960s, a large portion of household expenditure was allocated to food and consequently, the item had a higher weight in the CPI basket. As the economy advanced and average income increased, the proportion of expenditure on food has decreased, while that on housing, transport and communication has risen.
A key feature affecting the transmission of inflation in Malaysia is the administered price mechanism. The prices of some essential goods are administered by the Government as changes in prices of these goods will have a significant impact on the cost of living for the low and middle-income group. Currently, price administered items constitute 29.3% of the CPI basket. In general, there are two types of price administered items. The first group comprises of items listed under the Price Control Act (1946), where the Government determines the retail prices for these goods. Examples of these items would be fuel and sugar. The second group are items which require Government approval for changes to be made on their prices, for example electricity tariff and public transport fares. With the administered price mechanism in place, the impact of supply shocks and external price developments on domestic prices is less direct and less immediate.
Being a small and highly open economy, domestic inflation has also been influenced by developments abroad. Global inflation moderated to historically low levels during the phase of “great moderation” whereby average inflation globally fell from 15.4% during the 1990 - 1999 period, to 3.9% during the 2000-2008 period. Changes in economic institutions, technology and business practices have improved the capacity of the economy to absorb shocks to output and inflation. For example, advances in computer technology and communications have improved the management of business inventories and allowed a reduction in costs. The shift of production to low cost centres in the emerging market economies (EMEs) also contributed to lower inflation globally. The lowering of global inflation in turn translated into lower imported inflation for Malaysia and coincided with a period of below average domestic inflation. Domestic inflation between 2000 and 2004 averaged 1.5% which was significantly below the long-term average of 2.9% (1960 – 2010).
105
Inflation Determinants during Periods of High Inflation
Historically, at a long-term average of 2.9%, inflation in Malaysia has been one of the lowest in the region. The low inflation environment over the course of 50 years, however, was punctuated by four episodes of high inflation, that is in the mid-1970s, early 1980s, 1990s and late-2000s. 1970s and 1980s : Global oil price shocks and surging food prices
The 1970s and 1980s saw significant increases in global energy and food prices due to disruptions in supply. Global oil prices rose sharply due to the Egypt-Israeli War and Iranian Revolution in 1973 and 1979 respectively. The global oil shocks resulted in domestic retail fuel prices rising by 9.3% and 7.9% in 1974 and 1981, respectively. Global food prices rose strongly due to shortages of food supplies globally. This was a reflection of weak distribution linkages, a reduction in land for cultivation amidst urban development and industrialisation as well as adverse weather conditions. The impact was amplified by the high weight of food in the CPI basket, which was as high as 47% in the late 1960s. Food price inflation surged to double digit rates of 26.2% and 11.4% in both years mainly due to the significant increase in prices of rice, bread and other cereals and fruits and vegetables subcategories. As a result, there was a broad-based increase in domestic inflation to 17.3% and 9.7% in 1974 and 1981 respectively. 1990s : Period of robust domestic demand and large capital inflows
Inflation during the 1990s remained above 3%, with the exception of 1997 and 1999. Price increases were broad-based, driven by both demand and supply factors. During this period, domestic demand was particularly resilient, following robust income and employment growth. Substantial increases in the prices of property and equity, supported by strong growth in domestic liquidity and credit amid large capital inflows, led to increased net wealth and hence, supported domestic economic activity. The Kuala Lumpur Stock Exchange (KLSE) main index surged to a historical high of 1,314 points in early 1994 while the Malaysia House Price Index (MHPI) increased by an average of 7.6% per annum during the decade with a record high increase of 25.5% in 1991. As a result of the buoyant property market, average rental rates increased persistently, leading to the gross rent, fuel and power category of the CPI recording a 13-year record inflation rate of 4.4% in 1998.
Domestic supply factors also contributed to inflation, particularly in the food category. Food supply was constrained by adverse weather conditions, continued shortage of cultivated land, adjustments in administered prices by the Government, labour shortages and high capacity utilisation. Prices of the fruits and vegetables, fish and meat sub-categories increased throughout the 1990s. Inflation in the transport and communication category was also higher as bus and taxi fares as well as postal charges were increased.
Inflation peaked at 5.3% in 1998, reflecting rising cost pressures arising from higher import prices as the ringgit depreciated by 28.3% against the US dollar towards the end of 1997 and due to cyclical shortage of essential food items. Owing to the higher import cost, the Government increased the ceiling prices of five price administered items, namely cooking oil (5% increase), chicken (5% increase), fl our (20% increase), sugar (21% increase) and milk (6% increase). 2000 – current : More persistent increases in global commodity prices
In the early 2000s, inflation moderated to very low levels as the demand and supply pressures that characterised the 1990s dissipated. Inflation in Malaysia, however, began rising in 2005,reaching a peak of 8.5% in July 2008. The higher inflation during this period was driven mainly by external factors, in particular, due to higher global commodity and food prices. In contrast to the supply shocks of the 1970s and 1980s, the increase in global commodity prices was underpinned by both supply and demand factors. Demand for commodities increased as emerging market economies such as the BRIC (Brazil, Russia, India and PR China) countries became more industrialised. Food prices rose on increasing use of biofuels in developed countries and increasing demand for a more varied diet across the expanding middle-class population of Asia. In addition to real demand, demand from increased speculative activity in the
106
commodity markets also exerted upward pressures on global commodity prices as commodities became financialised amidst excess global liquidity.
At the same time, the global supply of commodities was strained. Limited land was allocated for agriculture as food producing countries shifted their focus to industrialisation. Global warming further exacerbated weather related food shortages. Geopolitical developments and concerns over disruptions to oil supply also played a role in the surge of global crude oil prices. All these events led to a broad-based increase in global commodity prices.
The sharp rise in global commodity prices and the consequent strain on Government finances due to the significant subsidy cost resulted in a series of upward adjustments in the prices of fuel products. In 2008, fuel prices increased by an average rate of 14.5% while food inflation rose to a 10-year high of 8.8%. Other than fuel and subsidised food items, the electricity tariff has also been revised upwards. Future Challenges
Going forward, the drivers of inflation will continue to evolve in line with structural changes in the economy. As Malaysia transitions to a high value-add and higher income economy, the composition of household expenditure will also change. The inflation process could also change as a result of Government policies such as the introduction of Goods and Services Tax (GST), minimum wages and the reduction of subsidies. Domestic inflation may be more affected by external forces, especially global commodity prices, as the price mechanism gradually becomes more market driven. Supply shocks could become more persistent and may no longer be transitory as global demand for resources and food continue to rise as a result of population growth, rapid urbanisation and supply constraints. These factors suggest that the task of managing inflation would become more challenging as the same domestic and external shocks occurring today have increasingly different implications for inflation when they occur in the future. C. Money Supply
Money Supply is the entire stock of currency and other liquid instruments in a country's economy as of a particular time. The money supply can include cash, coins and balances held in checking and savings accounts. Economists analyze the money supply and develop policies revolving around it through controlling interest rates and increasing or decreasing the amount of money flowing in the economy. Public and private sector analysis is performed because of the money supply's possible impacts on price level, inflation and the business cycle. An increase in the supply of money typically lowers interest rates, which in turns generates more investment and puts more money in the hands of consumers, thereby stimulating spending. Businesses respond by ordering more raw materials and increasing production. The increased business activity raises the demand for labor. The opposite can occur if the money supply falls or when its growth rate declines. Malaysia Money Supply (M2) M2 is a category within the money supply that includes M1 in addition to all time-related deposits, savings deposits, and non-institutional money-market funds. M2 is a broader classification of money than M1. Economists use M2 when looking to quantify the amount of money in circulation and trying to explain different economic monetary conditions. Money Supply M2 in Malaysia, as shown in the graph below, has increased to 1,301,792.80 MYR million in August of 2012 from 1,290,030.20 MYR million in July of 2012, according to a report released by the Central Bank of Malaysia. Historically, from 1970 until 2012, Malaysia Money Supply M2 averaged 376,656.50 MYR million reaching an all time high of 1,301,792.80 MYR million in August of 2012 and a record low of 4,122.30 MYR million in December of 1970.
107
Figure 9: Malaysia Money Supply M2
Source : Central Bank of Malaysia
0
200,000
400,000
600,000
800,000
1,000,000
1,200,000
1,400,000
Jan-
04 Jun …
No…
Apr
…
Sep…
Feb…
Jul-0
6
Dec
…
Ma…
Oct
…
Mar
…
Au…
Jan-
09 Jun…
No…
Apr
…
Sep…
Feb…
Jul-1
1
Dec
…
Ma…
RM
Figure 10 : Monetary Aggregates (RM Million)
183,047 200,917 224,392
903,430 989,343
1,060,027 931,865
1,017,303 1,088,830
-
200,000
400,000
600,000
800,000
1,000,000
1,200,000
2,008 2,009 2,010 M1 M2 M3
Source : Central Bank of Malaysia
D. Remittances The remittance business is enjoying good growth and will march on following the inflow of foreign
workers into the country amid the Government's various projects to propel the local economy. Industry observers feel the Government's open-door policy of bringing in such workers, unskilled and skilled ones, to boost certain sectors of the Malaysian economy will see the remittance business gaining prominence as a revenue generator for remittance service providers (RSPs) despite the competition in this business. Remittance growth
108
According to the Malaysian Immigration Department 2009, the migrant workers population in Malaysia totalled 1.92 million of which 80% were from Indonesia, Bangladesh and Nepal. Currently, there are 62 RSPs in Malaysia of which 22 are commercial banks, two are national saving banks and 38 are non-bank RSPs, among others like Western Union and MoneyGram. The emergence of non-bank RSPs less than a decade ago has made the remittance business more competitive.
With the continuous rise in the intake of unskilled foreign workers in response to the needs of the expanding plantation and services sectors, the remittance of migrant funds is expected to rise further by 10%-15% this year. The stronger remittance is also underpinned by the expected rise in the number of skilled expatriates and Malaysian returnees attracted to the country's Economic Transformation Programme (ETP) and accompanying investment activities.
Remittance flows are the second largest source of external funding for developing countries behind foreign direct investment. A rough gauge of the size of banking remittance business in Malaysia can be gleaned from the country's balance of payment statistics. Based on the total inward and outward current transfers and compensation of employees, the remittance business exhibits a steadily rising trend. Over the 2005-2009 period, the total value of inward and outward flows averaged RM30bil annually, a 60% rise over the average for the preceding five-year period. The estimated total remittances rose by 22% to RM36.5bil in 2009 and recorded a further 12% increase in the first three quarters of 2010.
On the types of transactions performed by migrant workers, basically there are two types. The first involves where the fund is credited into a bank account of a beneficiary in the receiving country, and the second one is where the fund is collected in cash over the counter at the overseas appointed agent. Most of the RSPs, are using the Swift system or batch file processing for account crediting remittance service and usually the funds can be received within two to three working days. The existence of non-bank RSPs like Western Union and MoneyGram in Malaysia has moved the remittance business into a new and higher level of service where the customer may opt for instant cash collection over the counter.
Apart from partnering with MoneyGram, one of the world's largest remittance service provider, it has also launched a new remittance platform known as Maybank Money Express (MME) in September 2010 which is capable of offering both account crediting and instant cash collection service. MME is the first such service offered by a Malaysian bank that also offers instant cash collection over the counter. MME leverages on Maybank's regional presence to provide remittance touch points in seven countries like Brunei, Cambodia, Indonesia, Pakistan, the Philippines, Singapore and Vietnam. It will expand to India and the Middle East by 2011. Judging from the number of foreign workers in Malaysia and RSPs in the country, the remittance business is competitive and a profitable one. Profitable though competitive
Remittance business is a profitable one for banks as margins from transaction charges and exchange rate conversion provides a lucrative revenue line and an incentive for banks to tap the growing remittance and cross-border banking business services. As banks' interest margins come under pressure in 2010, remittance services will become an even more important segment of the banks' non-interest income stream. Banks which have invested heavily in technology and regional network infrastructure are well positioned to service the banking needs of the ever growing pool of internationally and regionally mobile skilled and unskilled labour. Migrant workers' remittance business is a profitable business for banks, especially in Malaysia which is dependent on migrant workers for certain industries. Those working in Malaysia usually commit a certain portion of their wages to support their family back home and this type of remittance happens monthly for most migrant workers during their payroll week.
UOB of Malaysia has seen an upward trend of remittance from a transaction record of 24,000 in 2008 to 95,000 in 2009. On a month-to-month comparison, January 2011 versus January 2010, the bank's remittance figure rose by 25%. Overall, the remittance business of migrant workers contribute about 9% of the bank's total remittance business revenue and hope to drive this business further.
The presence of a large number of about 1,800 touch points nationwide where remittance services are provided is an indication of the profitability of this business although the high number of RSPs does affect margins for the remittance business. Maybank Malaysia is targeting the migrant workers remittance
109
business to increase 10% in 2011 from last year with the introduction of its MME service. Without churning numbers, Maybank's remittance business is sizeable and migrant worker remittance business consist a reasonable portion of it. The need for formal channels
Moving forward, although the remittance business is poised for strong growth in view of the higher demand for foreign workers amid more projects taking shape to steer the economy, there is a need to make the service more efficient. Besides upgrading facilities for funds remittance, the expansion of branch networks of banks or tie-ups with foreign banks is needed to cater to the large number of workers looking for formal banking channels to remit funds. In turn, this will help to curb the large illicit flows transfers through informal and illegal channels. Based on a study from World Bank Conference 2007 in Bali, about 90% of remittance outflows from Malaysia to Indonesia occur through informal channels. The lack of requisite identification/status documents required to open bank accounts or interact with formal RSPs has been the main reason that some migrant workers opt for Hawala or Hundi (informal channels). In 2009, total remittance has amounted up to Malaysian Ringgit 36.5 million. Details are shown in the table below. Figure 11 : Estimated Remittances (RM)
Note: Hawala is an informal value transfer system based on the performance and honour of a huge network of money brokers,
who are primarily located in the Middle East, North Africa, the Horn of Africa and South Asia.
Total Revenue 159,653 183,375 186,906 0.6 14.9 1.9 100.0 100.0 100.0 % of GDP 20.8 21.6 20.4 1 Revised estimate2 Budget estimate, excluding 2012 tax measures3 Petroleum income tax
RM Million % Change % Share
Source: Ministry of Finance
Direct tax is anticipated to increase significantly by 22.1% to RM96.5 billion (2010: 0.8%; RM79 billion). Revenue from corporate income tax is to increase 21.2% to RM44 billion (2010: 20.1%; RM36.3 billion), reflecting continued improvements in corporate profitability. Likewise, individual income tax collection is projected to increase 10.6% to RM19.7 billion (2010: 14.2%; RM17.8 billion) 0n account of steady increase in personal income.
Despite lower production volume, strong demand for crude oil, particularly from emerging economies is expected to boost revenue from petroleum income tax (PITA). The crude oil price (Tapis) which averaged USD84 per barrel in 2010 and currently at USD117 per barel as of 28 September 2011, is expected to remain elevated for the rest of the year. Consequently, receipts from PITA are projected to rebound strongly by 38.9% to RM26 billion (2010: -31.3%; RM18.7 billion). Another contributing factor is the change in the tax treatment for assessing PITA effective 1 January 2010. PITA, which had been assessed on a preceeding year basis till 2009, is now self-assessed, and upstream petroleum companies are allowed to settle PITA on income received in 2009 by instalments over five years. In tandem with higher business transaction, revenue from stamp duties (RM4.6 billion), real property gains tax (RPGT) (RM369 million) and witholding tax (RM1.4 billion) is expected to remain firm.
111
Figure 11: Federal Government Revenue 2007
Source : Ministry of Finance
Income taxes46.9%
Import duties1.7%Export duties
1.7%
Excise duties6.4%
Sales tax4.8%
Service tax2.2%
Non-tax revenue32.0%
Others4.3%
RM139,665 Million
Figure 12: Federal Government Revenue 2011
Source : Ministry of Finance
Income taxes49.8%
Import duties1.1%Export duties
1.1%
Excise duties6.4%
Sales tax4.7%
Service tax2.7%
Non-tax revenue29.6%
Others4.6%
RM183,375 Million
In 2010, the wholesale and retail trade was the largest contributor to tax revenue, followed by the oil
and gas industry; hotels and restaurants; manufacturing; agriculture and forestry; and transport and communications. The total number of registered taxpayers as at end-july 2011 was 6.6 million. Of this, 6.1 million (92.7%) were individual taxpayers,, 468,808 (7.1%) companies while the rest included societies and trust bodies. Taxable returns comprised 1,788,337 individuals and 94, 569 companies.
112
The number of taxpayers using e-Filing has steadily increased since it was introduced in 2006. As at end-July 2011, more than 2.2 million taxpayers submitted their tax returns through e-Filing, an increase of 11.7% over 2010. The Inland Revenue Board (IRB) continues to enhance revenue collection through improving efficiency in tax submission, collection and administration. Effort are also underway to improve compliance and widen the tax base through enforcement, field audits and investigations B. Expenditure Table 6 : Federal Government Operating Expenditure by Object, 2010 -2012
Total 151,633 180,283 181,584 (3.5) 18.9 0.7 100.0 100.0 100.0 % of GDP 19.8 21.3 19.8 1 Revised estimate2 Budget estimate, excluding 2012 budget measures3 Includes emoluments
% ShareRM Million % Change
Source : Ministry of Finance
Expenditure on emoluments remains the largest component of operating expenditure. Several measures are underway to rationalise the size of the public service and create a leaner workforce. Effective 1 June 2011, the Government has frozen the hiring of new personnel or filling up vacancies to facilitate an audit of posts in all government departments with the aim of abolishing selected and non critical as well as redeploying posts to more critical agencies.
Subsidies, the second largest component of operating expenditure. The category comprises various subsidies, (RM22.5 million), incentives (RM518 million) and social assisstance programmes (9.8 million). Among them are subsidies for fuel, sugar, cooking oil and incentives to increase food production as well as educational assistance and social welfare programmes. Additional measured were introduced to clamp down on rampant abuse of fuel subsidies. All petrol stations in border areas are required to close operations at 10 pm effective 1 June 2011 to minimise smuggling of diesel and subsidied petrol (RON95) across the border. There are, however no restriction on the sale of RON97, the premium grade petrol to foreigners.
113
C. Financing Table 7: Federal Government Financing, 2010 -2011
Federal government gross borrowing are increasing every year mainly on account of higher redemptions, loan repayments and deficit financing requirements. Given the ample liquidity in the financial system, the Government will continue to source its borrowings from domestic sources. The increased funding requirements are not expected to crowd out the private sector due to a high saving rate. With revenue exceeding operating expenditure borrowings are mainly to finance development expenditure. D. Debt
The Federal Government will ensure that debt level remains sustainable through the adoption of sound macroeconomic policies and prudent debt management strategies. As at end –June 2011, national debt continued to remain low at 28.5% of GDP (2010:29.6%) while Federal Government Debt is projected to be marginally higher at 53.8% of GDP (2010:53.1%) .
In 2011, total Federal Government debt is expected to increase 11.9% to RM455.7 billion (2010: 12.3%; RM407.1 billion) mainly due to higher borrowings to meet financing requirements. Of the total, domestic debt accounts for 96.2% or RM438.5 billion (2010:95.9%; RM390.4 billion). Federal Government external debt, is mainly denominated in US dollars and yen.
Though the debt level has been trending upwards in recent years, debt servicing capacity remains affordable and within prudent limits. The Government will ensure that debt services charges at 10.1% of revenue (2010:9.8%) will remain manageable and not impinge on productive spending programme. As part of fiscal rules rigorously observed, federal Government debt will not exceed 55% of GDP while debt service charges, maintained below 15% of revenue to ensure debt sustainability. Table 9: National Debt, 2010 -2011
2010 20111 2010 20111 2010 20111
Medium and Long term debt 147,661 149,499 65.0 61.9 19.3 17.6 Public Sector 83,334 77,533 36.7 32.1 10.9 9.2 Federal Government 16,745 16,166 7.4 6.7 2.2 1.9 NFPEs 66,589 61,367 29.3 25.4 8.7 7.2 Guaranteed 11,824 11,157 5.2 4.6 1.5 1.3 Non-guaranteed 54,765 50,210 24.1 20.8 7.1 5.9 Private Sector 64,327 71,966 28.3 29.8 8.4 8.5 Short Term debt 79,447 92,191 35.0 38.1 10.4 10.9 Total 227,108 241,689 100.0 100.0 29.6 28.5 1 End June 2011
RM Million % Share % GDP
Source : Ministry of Finance
National debt, comprising the external debt of Federal Government, Non-Financial Public Enterprises (NFPEs) and private sector increased largely due to net borrowings in short term as well as medium and long term debt by the private sector. The debt was mainly denominated in USD (66.1%), yen (7.8%), Euro (4%) and others (22.1%). Figure 13 : Federal Government External Debt by Currency
Source : Ministry of Finance
68.5% 62.6%
51.3%60.6% 62.9%
26.1% 34.8%
47.8%38.8% 36.6%
3.4% 2.6%
0.9%
0.6% 0.5%
19,602 20,316
13,786
16,745 17,278
0%
20%
40%
60%
80%
100%
120%
0
5,000
10,000
15,000
20,000
2007 2008 2009 2010 2111
RM
Mill
ion
Others (RM Mil) Yen (RM Mil) US Dollar (RM Mil) Total (RM)
115
III. Tax Structure : Institutions and Reality
III.1 Inland revenue Board of Malaysia (IRBM)
Functions of IRBM a. To act as government agent in the administration, assessment, collection and enforcementbof income
tax, real property gains tax, estate duty, stamp dutyand other taxes agreed between the government and the Board;
b. To advise the government on matters related to taxation and to collaborate with Ministers and statutory bodies with respect to those matters;
c. To participate in meetings, discussions and agreement matters related to local and international taxation;
d. To act as a collection agent for and on behalf of any statutory body to recover the unpaid loans to those body under written laws; and
e. To carry out any other functions given to IRBM by any written laws Responsibilities of IRBM
IRBM is responsible for the administration of the following laws: a. Income tax Act 1967; b. Petroleum Act (Income Tax) 1967; c. Real Property Gains Tax Act 1976; d. Stamp Act 1949; e. Labuan Offshore Business Activity Tax Act 1990; and f. Promotion of Investment Act 1986.
IRBM must comply with all Double Taxation Agreements (DTAs) signed by the Malaysian Government with governments of foreign countries. In addition, IRBM must comply with all regulations related to the administration of IRBM:
a. Federal Constitution 1957; b. Interpretation Act 1948 and 1967; c. Limitation Act 1953; d. Courts of Judicature Act 1964; e. Companies Act 1965; f. Bankcruptcy Act 1967; g. National Land Code 1965; h. Criminal Procedure Code (Act 593); i. Penal Code (Act 574); j. Company Winding-Up Rules 1965; k. Rules of the High Court 1980; and l. Subordinate Courts Rules 1980
IRBM also continues to administer several repealed legislation to resolve outstanding cases from previous years:
a. Estate Duty Enactment 1941; and b. Share Transfer Tax Act (Land based Companies) 1984
Members of the Inland Revenue Board of Malaysia
IRBM is regulated by the following Board Members: a. The Secretary General of Malaysian Treasury cum IRBM Chairman; b. Attorney General or its representative; c. Director General of Public Services or its representative; d. Two other individuals appointed by the Finance Minister to represent the government; and
116
e. Two other individuals appointed by the Finance Minister from the private sector. Table 10 : Organization Structure of IRBM
III.2 Tax Specific Analysis A. Income Tax (PAYE) Background
The self assessment system (SAS) for individuals (include salaried individual and sole proprietors) and for partnership was implemented with effect from YA 2004 following the release of the Income Tax (Ammendment) Act 2002. Under SAS which is based on the concept of ‘File and Pay’, individuals are required to:
a. File their completed income tax return forms to the IRB together with the payment of the balance of tax payable (if any).
b. Pay their income tax liability through monthly salary deductions for salaried individuals or through bimonthly installments for individuals having business income.
117
Estimate of Tax
For individuals other than salaried individuals, the IRB may issue a prescribed form (Form CP500) setting out the estimate of tax payable (ETP) under an installment scheme. ETP is determined by the IRB based on the tax assessed in the preceding year. The taxpayer is required to pay the ETP in 6 bi-monthly installments as directed by the IRB commencing from the month of March. Each installment payment accompanied by a remittance slip (Form CP501) must be paid to the IRB within 30 days from the due date.
For salaried individuals, income tax will continue to be deducted through the monthly salary deductions under the Monthly Tax Deduction (MTD) scheme. Variation of installments
Every individual under an installment payment scheme may apply to revise the installment payments not later than 30 June of the relevant year by submitting the Form CP502. The IRB will issue a revised notice of installment payments (Form CP503) if the application is successful, setting out the revised installment payments. Where the revised estimate exceeds the amount of installment paid to date, the difference shall be payable in the remaining months of the installment scheme. In addition, if the revised estimated tax for a year of assessment is less than RM300, the individual is allowed to stop the subsequent payment starting from the date of submission of the Form CP502. Penalty provisions
a. Late payment of installment : Where any installment due and payable on the date specified by the IRB has been paid within 30 days from the due date, a penalty of 10% shall be imposed on the amount unpaid without any further notice.
b. Difference between revised estimate submitted and final tax liability : When the tax payable excluding tax attributable to employment income, if any, exceeds the revised estimate (if a revision is submitted) by an amount exceeding 30% of the tax payable, the difference exceeding the 30% will be subject to a penalty of 10%. Filling of Tax Returns
Every individual who: a. Has chargeable income for a year of assessment ;or b. Has no chargeable income for that year of assessment but:
i. has chargeable income for the year of assessment immediately preceding that year of assessment ; or
ii. has furnished a return for the immediately preceding year; or iii. has been required to furnish a return (but failed to furnish a return) for the immediately
preceding year, Must file a tax return to the Director General by 30 April of the following year unless that individual
with no chargeable income receives a waiver from the Director General or has business income. The tax filing deadline for a person carrying on a business, such as sole proprietor, partnership, club association and Hindu joint family, is 30 June of the following year.
Under SAS, no supporting documents need to be submitted to the IRB, but should be kept for the purpose of tax audit. The taxpayer also has to indicate whether he/she has complied with the Public Ruling issued by the IRB. In cases where the taxpayer receive dividend income which results in a tax repayable position HK-3 (Helaian Kerja 3) should be submitted together with the return. Effective YA 2008, the original dividence vouchers are not required to be submitted to the IRB.
An individual and his/ her spouse are required to file separate income tax return forms regardless of whether tax return forms are filed on a separate or combined assessment basis. The tax return furnished by the taxpayer is deemed to be a notice of assessment and the notice of assessment and the notice is deemed to be issued on the day the return is submitted to the IRB. Any balance of tax payable after taking into
118
account the installment payment made via the installment payment scheme or salary deductions, if any, would have to be remitted to the IRB by 30 April/ 30 June of the following year.
With effect from YA 2012, to further enhance the e-Filing system in line with current technological advance, it is proposed that :
a. Individual taxpayers are allowed to furnish tax returns through e-Filing via mobile devices; and b. Information on total income, Monthly Tax Deduction, Employees Provident Fund
contributions,insurance and zakat are pre-filled by the IRB for salaried taxpayer using the e-Filing system information must be submitted by their employers to the IRB.
With effect from YA 2013, taxpayers who file income tax returns before the expiry of the stipulated due date will be given compensation of 2% p.a on the amount of tax refunded late by the IRB computed on a daily basis commencing 1 day:
a. After 90 days from the due date for e-Filing; and b. 120 days from the due date for manual tax filing.
Amendment to the self-assessed return
A new provision has been gazetted in the Income Tax Act 1967 (ITA 1967) effective from YA 2009 to allow taxpayers to make self amendments for additional assessment under the following conditions:
a. Amendments allowed are in respect of errors resulting in increased assessments. b. Self amendment be allowed only once for each year of assessment. c. Self amendment be allowed within a period of 6 months from the due date of furnishing the tax
form. d. Taxpayer makes self amendment in specified forms.
Penalty provisions a. Failure to submit a tax return
Failure to submit a tax return will constitute an offence under the Act and upon conviction, the taxpayer will be liable to a fine ranging from RM200 to RM2,000 or to imprisonment for a term not exceeding 6 months or both. The IRB is allowed to impose a penalty of up to 3 times the amount of tax and/or additional tax payable if no prosecution action is taken against the taxpayer.
As a matter of practice, with effect from 1 October 2011, the IRB will impose penalties ranging from 20% to 35% of the tax payable for late filing of tax returns.
b. Failure to remit tax payable Failure to remit the balance of tax payable by 30 April/ 30 June of the following year will attract a penalty of 10%. A further 5% penalty will imposed on any balance remaining unpaid after 60 days.
c. Under declaration of income or excessive claim on deduction or expenses A taxpayer who makes a self assessment within 6 months from the due date of furnishing the return will not be subject to a penalty for under-declaration of income or excessive claim on deduction or expenses. However, he/she will be subject to a late payment penalty equivalent to the penalty imposed on a taxpayer who files a correct return but defaults in paying tax due within the stipulated period.
Tax Audit
Nature Under SAS, tax audit is a primary activity of the IRB. It is aimed at enhancing voluntary compliance
with the tax laws and regulations. A taxpayer can be selected for an audit at any tim. However, it does not necessarily mean that a taxpayer who is selected for an audit has committed an offence.
A tax audit is an examination of a taxpayer’s business records and financial affairs to ascertain that the right amount of income should be declared and the right amount of tax that should be calculated and paid are in accordance with tax laws and regulations. The IRB carries out 2 types of audit, namely desk audit and field audit. a. Desk audit
119
Desk audit is held at the IRB’s office and is normally concerned with straightforward issues or tax adjustments which are easily dealt with via correspondence.
b. Field audit Field audit takes place at a taxpayer’s premises and involves the examination of the taxpayer’s business records. In the case of a sole proprietorship or partnership, if the taxpayer’s business records are incomplete, it may involve the examination of non-business records such as personal bank statements, etc.
Upon completion of an audit and if there is no adjustment to the tax computation, the taxpayer will be informed via a letter that the case has been finalized without any adjustments. On the other hand, if there are adjustments to be made, the IRB will issue a tax computation summarizing the tax adjustments based on their findings. If an appeal is not made within a specific time, an additional assessment will be issued with appropriate penalties applicable.
To facilitate the audit process, taxpayer must therefore ensure that business as well as non-business records properly kept. Generally, the types of records to be kept are as follows:
a. Employment income – Form EA/EC, pay slip, etc. b. Business income – sales and purchases invoices, cash bills, payment vouchers, official receipts for
payments, bank statement, cheque butts and other relevant documents. c. Original receipts to substantiate all expenses or claims made.
With effect from YA 2013, to increase the certainty of the costs of doing business, enhance investor confidence and to be in tandem with best practices, it is proposed that the time bar for tax audit be reduced from 6 years to 5 years from the date the tax assessment is made. The proposal is not applicable for cases of false declaration, willful late payment and negligence. The proposal will not alter the requirement to keep record for 7 years. Tax audit framework
A revised tax audit framework which is effective from 1 January 2009 has been issued by the IRB to replace the framework issued in January 2007. The framework is to ensure that a tax audit is carried out in a fair, transparent and impartial manner. The main areas covered in the framework are as follows:
a. Selection of cases b. Tax audit methodology c. Rights and responsibilities of taxpayers, tax agents and audit officers d. Confidentiality of information e. Offences and penalties f. Complaints and payment procedures g. Appeals
This framework is not applicable to audit cases involving transfer pricing, thin capitalisation and advance pricing arrangement. Penalty provisions a. Penalties for omission/ understatement of income
The penalty for omission or understatement of income is provided under S 113(2) of the ITA 1967, which is 100% of the tax undercharged. However, the Director General of Inlad Revenue (DGIR) may impose a lower penalty of 45% for the first offence.
In the event the taxpayer makes voluntary disclosure of the omitted income before the commencement of the tax audit, the DGIR may impose the concessionary penalty rates.
The revised concessionary penalty rates as set out in the latest tax audit framework, which supercede the old framework with effect from 1 January 2009, is as follows:
120
Table 11 : Penalty Rate
Items Period from the due date of submitting return form Old Rate Revised
Rate Voluntary disclosure < 60 days 15% 10%Before case is selected
for audit > 60 days to 6 month 15% 15.5%> 6 months to 1 year 15% 20%>1 year to 3 years 20% 25%> 3 years and above 30% 30%
Voluntary Disclosure After taxpayer has been informed but before the commencement of the audit visit 35% 35%
For each repeated offence, the rate of penalty shall be increased by 10% as compared to the last penalty rate imposed for the previous offence but is restricted to a sum not exceeding 100% of the amount of tax undercharged. b. Penalty for not providing reasonable facilities and assistance
Public Ruling 7/2000 on “Providing reasonable facilities and assistance” is also applicable to individuals. The offender upon conviction may be liable to a fine of RM1,000 to RM10,000 or to imprisonment for a term not exceeding one year or both. c. Penalty for nor complying with a notice asking for certain information as required
Pursuant to S 120(1) of the ITA 1967, the offender upon conviction may be liable to a fine of RM200 to RM2,000 or to imprisonment for a term not exceeding 6 months or both. d. Penalty for failure to keep sufficient records
In accordance with Public Ruling 5/2000 (Revised), individuals carrying on a business as a sole proprietorship or a partnership are required to keep sufficient records. The offender upon conviction may be liable to a fine of not less than RM300 and not more than RM10,000 or to imprisonment for a term not exceeding 12 months or both. Appeal Against An Assessment
If a taxpayer is dissatisfied with an assessment deemed to be served on him/her, he/she should file an appeal within 30 days from the date of submission of the tax return. Specific details and the grounds of appeal should be stated in the appeal to the IRB. In the case where a notice of additional assessment is issued because of audit adjustment made by the IRB, the appeal should be submitted within 30 days after the service of the notice of additional assessment.
A new provision of the ITA 1967, s 97A, provides clarification in relation to an appeal against a notification of non-chargeability. Effective 1 January 2009, the right to appeal to the Special Commissioners of the Income Tax (SCIT) by a person is extended to cases which are not liable ta tax. B. Corporate Tax Background
Following the announcement of the 1999 Budget and the subsequent release of the Income Tax (Amendment) Act 2002, the official assessment system was changed to the self assessment system in the following stages:
121
Table 12 : Implementation of Self Assessment System Types of taxpayer Effective year Companies 2001
Business, partnership and co-operatives 2004 Salaried individual 2004
Under the self assessment system, the burden of computing the taxpayer’s liability is shifted from the Inland Revenue Board (IRB) to the taxpayer and accordingly, taxpayers are expected to compute their tax liability based on the tax laws, guidelines and ruling issued by the IRB. The tax returns submitted will no longer be subject to a detailed review by the IRB.
The main objective of the self assessment system is to inculcate a practice of voluntary compliance by the taxpayers and at the same time reduce the workload of the IRB to enable them to concentrate on areas which have a high tax risk and a potentially significant loss in revenue. The implementation of the self assessment system has also resulted in changes to the tax compliance cycle and the penalty provisions. These changes are explained in greater detail below. Estimate of tax payable and payment of installment-company Estimate of tax
Under the self assessment system, every company is required to determine and submit in a prescribed form (Form CP204) an estimate of its tax payable for a year of assessment, 30 days before the beginning of the basis period. However when a company first commences operations (’i.e during the first basis period), the estimate of tax payable must be submitted to the IRB within 3 months from the date of commercement of its business and thereafter no later than 30 days before the beginning of the basis period.
The estimate of tax payable submitted for a particular year cannot be less than the revised estimate or the estimate of tax payable (if no revised estimate was submitted) for the immediately preceding year of assessment. With effect from Y/A 2006 and subsequent years, the estimate of tax payable for that year cannot be less than 85% of the revised estimate of tax payable for the immediate preceding year of assessment or if no revised estimate is furnished, cannot be less than 85% of the estimate of tax payable for immediate preceding year of assessment.
A company is still required to submit the prescribed Form CP204 within the stipulated deadline even if it expects its estimate of tax payable to be NIL. With effect from YA 2008, where a SME first commences operations in a year of assessment, the SME is not required to furnish an estimate of tax payable or make installment payments for a period of 2 years beginning from the year of assessment in which the SME commences operations. With effect from YA 2011, where a company first commence operations in a year of assessment and the basis period for that year of assessment is less than 6 months, that company is not required to furnish an estimate of tax payable or make installment payment for that year of assessment.
A SME which is exempted from furnishing an estimate of tax payable mentioned above is advised to submit the prescribed Form CP204 notifying the IRB of its SME status without having to state the amount of estimate of tax payable for that particular year of assessment to avoid any penalty under-estimation of tax or penalty for non-submission being wrongly imposed by the IRB. Installment payment scheme (s. 107 of the Income Tax Act 1967 (ITA 1967))
When the estimate of tax payable has been submitted to the IRB, the company is required to remit this amount to the IRB in equal monthly installments according to the number of months in its basis period. For example, if a company has a 12 month basis period, the estimate of tax payable must be paid over a 12 month installment scheme.Each month installment is due and payable to the IRB by the 10th day of the following month. For example, the January installment will be due for payment by the 10th of February and so forth.However, where a company first commences operations (i.e during the first basis period); its first installment will commence from the 6th month of the basis period.
122
Revision of estimate of tax payable Under s. 107C(7) of the ITA 1967, every company is allowed to revise its estimate of tax payable by
submitting a Form CP204A in the 6th month and/or 9th month of its basis period from Y/A 2003onwards. Where the revised estimate exceeds the amount of installments paid to date, the difference shall be payable in the remaining months of the installment scheme. Conversely, when installments paid to date exceed the revised estimate, the company may discontinue its original installment scheme. For Y/A 2001 only, the IRB has granted an administrative concession to companies allowing them to revise their estimate of tax payable up to 3 times (including the 6th month revision). The additional 2 revisions may be made in either the 3rd, 9th or 12th month of the basis period. For Y/A 2002, the IRB as a concession, allows companies to further revise their estimate of tax payable in the 9th month. Penalty provision a. Failure to furnish estimate of tax payable
Under s. 120(1)(f) of the ITA 1967, any company which, without reasonable excuse fails to submit the estimate of tax payable for a year of assessment shall be guilty of an offence and upon conviction, be liable to a fine ranging from RM200 to RM2,000 or face imprisonment for a term not exceeding 6 months or both. With effect from Y/A 2011, where no prosecution is instituted by the Director general and no direction is issued by the Director General under s. 107C(8) of the ITA 1967; but there is a tax payable by that company for that year of assessment, such amount of tax payable will be subject to a penalty of 10%. b. Late payment penalty
As explained earlier, monthly payments should be remitted to the IRB by the due dates, i.e. by the 10th day of the following month. Failure to remit the instalments on a timely basis will result in an automatic penalty of 10% being imposed on the unpaid amount. c. Difference between the estimate submitted and final tax payable
When the tax payable for a particular year of assessment exceeds the original or the revised estimate (if a revision is submitted) by an amount exceeding 30% of the tax payable, the difference will be subject to a penalty of 10%. Return by Employer a. Filing of return by employer
Under s. 83(1) and 83(1A), every employer must finish the return (Form E) of its employees’ employment income no later than 31 March for each year. In addition, the employer must also prepare and deliver to his employee the statement of remuneration (Form EA) on or before the last day of February for each year. b. Penalty provisions
Under S. 120(1)(b) of the ITA 1967, any person who, without reasonable excuse fails to submit the return by employer as well as prepare and deliver the statement of remuneration shall be guilty of an offence and upon conviction, be liable to a fine ranging from RM200 to RM2,000 or to imprisonment for a term not exceeding 6 months or both. Tax return a. Filing of tax returns
123
A fundamental difference between the previous official system and the newly introduced self assessment system is the discontinuance of a detailed review of returns submitted and the subsequent issuance of notices of assessment by the IRB. This is due to the fact that the burden of computing the tax liability is passed on to the taxpayer. Accordingly, all the returns submitted by the taxpayer would be deemed as notices of assessment being served on the taxpayer.Under the self assessment system, all companies must file the tax returns within 7 months from the end of the accounting period (S77(1A), ITS 1967) from YA 2003 onwards. For example, a company with an accounting period ending on 31 January must file its tax return to the IRB by 31 August. As an administrative concession, the IRB has allowed the YA 2001 and YA 2002 tax return to be filed within 8 months respectively after the end of the accounting period. The extension of time 6.0 Penalty provisions a. Failure to submit a tax return
Failure to submit a tax return will constitute as an offence under the ITA 1967 and upon conviction, the taxpayer will be liable to a fine ranging from RM200 to RM2,000 or face imprisonment for a term not exceeding 6 months or both.However, if no prosecution is initiated, the Director General may require the person to pay a penalty equal to treble the amount of tax and/or additional tax which is payable (before any set-off, repayment or relief) for that year. As a matter of practice, with effect from 1 October 2011, the IRB will impose penalties ranging from 20% to 35% of the tax payable for late filing of tax returns. b. Failure to remit tax payable
As explained above, since the tax return is deemed as a notice of assessment, the balance of tax payable (if any) should be remitted to the IRB together with the tax return. Failure to do so will result in the IRB imposing a penalty equivalent to 10% on the balance of tax payable and if the tax is still not paid after 60 days, a further 5% penalty will be imposed. Tax Audit
The IRB issued the Tax Audit Framework which takes effect from 1 January 2009. The new tax audit framework replaces the tax audit framework issued in January 2007.Under the self assessment system, tax audit will be the IRB’s key enforcement tool to ensure that the tax returns submitted are correct and have been prepared in accordance with the provision of the law, guidelines and rulings issued by the IRB. Essentially, an audit is an examination of a taxpayer’s records to ensure that the income and tax liability declared to the IRB in the tax return are true, correct and comply with the laws and rulings.
IRB carries out 2 types of audits namely desk audit and the field audit. The former will involve the review of documents / information obtained by correspondence and interviews at the IRB’s office whilst the latter would entail a visit to the tax payer’s premises for a detailed review of all relevant documents. Cases for audit are selected through the computerized system based on risk analysis criteria and on various criteria such as business performance, financial ratios, type of industry, past compliance records, third party information, etc.
Once a tax payer is selected for an audit, the IRB will inform the taxpayer via a telephone call followed by an official notification letter sent via mail or fax. The period between the date of notification and the audit visit is 14 days. A shorter period of notification may be fixed by IRB with the consent of the taxpayer. The scope of a tax audit under self assessment normally covers a period of 1 to 3 years, unless there are valid reasons to go beyond that period. The time frame for the conclusion of a tax audit is normally within 3 months. Upon the completion of an audit, the IRB will issue a tax computation summarizing the tax adjustment based on their findings and subsequently an additional assessment to collect the additional taxes from the taxpayer. The taxpayer may still appeal against this assessment by submitting the appeal, through the prescribed Form Q to the Special Commisioners of Income Tax within 30 days from when the assessment is raised. With effect from Y/A 2013, the time bar for tax audits is reduced from 6 years to 5 years (2012 Budget)
124
Framework
To maintain and enhance public confidence in the tax administration, the IRB has issued the Revised Tax Audit Framework and the Tax Investigation Framework. The main areas covered in the frameworks are as follows:
a. Criteria for audit and investigation selection b. Tax audit and investigation methodology c. Rights and responsibilities of taxpayers and tax agents, audit and investigation officers, d. Settlement upon completion of an audit or investigation; and e. Offences and penalties.
The tax investigation framework is effective 1 January 2007, whilst the Revised Tax Audit Framework is effective 1 January 2009. Penalty provision a. Penalties for omission/non-disclosure
Under the tax audit system, the IRB has also introduced a new penalty regime for nondisclosure and omission of information that effects a taxpayers tax liability. The penalty regime is summarised as follows:
i. Voluntary disclosure before selection for audit • Within 60 days from the due date for furnishing the return form (10%) • More than 60 days but less than 6 months from the due date for furnishing the return form
(15.5%) • > 6 months to 1 year (20%) • > 1 year to 3 years (25%) • 3 years and above (30%)
ii. Voluntary disclosure after the case is selected for audit but before audit commence (35%) iii. Non disclosure (discovery during audit)
• 300% or 100% of tax undercharged (may consider for 45% for 1st offence) iv. Repeat offences
• +10% for each repeated offence not exceeding 100% b. Penalty for not providing reasonable facilities and assistance
Base on Public Ruling 7/2000, failure by a taxpayer to provide reasonable facilities and assistance to the IRB when conducting an audit is an offence and upon conviction, the taxpayer may be liable to a fine of between RM1,000 to RM10,000 or face imprisonment for a term not exceeding 1 year or both. c. Failure to keep sufficient records
The company or persons responsible, upon conviction will be liable to a fine of between RM200 to RM2,000 or face imprisonment for a term not exceeding 6 month or both. Appeal against an assessment
If a taxpayer is dissatisfied with an assessment deemed to be served on him, he should file an appeal by submitting an appeal letter or a Form Q within 30 days of the assessment being serve on him, i.e. within 30 days of the date of submission of the tax return. Specific details and the grounds of appeal should be stated in the appeal letter. In the event the IRB is unable to reach an agreement with the taxpayer, the case will be forwarded to the Special Commissioners. If the appeal was done by way of a letter, a Form Q must be submitted by the taxpayer.
Effective YA 2009, taxpayers with no chargeable income can file an appeal by using the Notification of Non-Chargeability instead of notice of assessment. The appeal is to be filed through the Director General
125
using Form Q. Effective 1 January 2012, the issuance of Notification of Non-Chargeability is extended to the following cases:
a. Persons exempted from tax under the ITA 1967 or the PIA 1986; b. Person with no statutory income from a business source but assessment has been made in respect of
other sources of income. C: Real Property Gains Tax Rates and Exemptions Real property gain tax rates
Real Property Gains Tax (RPGT) is charged on gains arising from the disposal of real property, which is defined as any land situated in Malaysia and any interest, option or other right in or over such land. RPGT is also charged on the disposal of shares in a real property company (RPC). An RPC is a controlled company holding real property or shares in another RPC of which the defined value is not less than 75% of the value of the company’s total tangible assets.
The Minister has exempted all persons from all provisions of the Real Property Gains Tax Act 1976 (RPGT Act 1976) in respect of any disposal of chargeable assets between 1 April 2007 to 31 December 2009. For any disposal of chargeable assets made by any person after 31 December 2009, the Minister will impose tax at a fixed rate of 5% on the gains arising from the disposal of real properties that are disposed of within 5 years of the date of acquisition of such chargeable assets. It is proposed that with effect from 1 January 2012, a tax rate of 10% will be imposed for a holding period exceeding 5 years.
Exemption of Real Property Gains Tax RPGT exemptions are available in the following circumstances: Exemptions under the RPGT Act 1976;
1. An individual will be given an exemption equal to RM10,000 or 10% of the chargeable gain,
whichever is greater. Prior to 1 January 2010, the exemption was equal to RM5,000 or 10% of the chargeable gain, whichever was greater.
2. An individual who is a Malaysian citizen or a permanent resident will be given a once in a lifetime exemption on any chargeable gain arising from the disposal of his/her private residence if she/he elects in writing for the exemption to apply to that private residence.
3. Transaction in which the disposal price is deemed equal to acquisition price (i.e No gain no loss transaction) – per Para 3 Sch 2 of the RPGT Act 1976: a) Devolution of a deceased person’s assets to his trustee or legatee b) Transfer between spouses c) Transfer of assets owned by an individual, his wife or by an individual jointly with his wife or
with a connected person to a company controlled by the individual, his wife or by an individual jointly with his wife or with a connected person, for a consideration consisting substantially (more than 75%) of shares in that company
d) Transfer between an individual and a nominee who has no vested interest in assets e) Transfer by way of security in or over an asset f) Gifts to the Government, local authority or charity exempt from income tax g) Disposal due to compulsory acquisition h) Disposal of chargeable assets persuant to an approved financing scheme which is in accordance
with Syariah principles, where such disposal will not be required for conventional financing schemes.
4. Gifts- per Schedule 2 Paragraph 12 of the RPGT Act 1976 Gifts between husband and wife, parent and child or grandparent and grandchild are deemed to be ‘No
gain, no loss’ transactions. 5. Transfer between companies – per Para 17 Schedule 2 of the RPGT Act 1976
i. Transfer within the same group to bring about greater efficiency and for a consideration consisting substantially of shares in the tranferee’s company
126
ii. Transfer between companies for the purposes of reorganization, reconstruction or amalgamation where the transferee company is being restructured to comply with the Government’s policy on capital participation in industry
iii. Assets distributed by a liquidator under a scheme of reorganization, reconstruction or amalgamation where the transferee company is being restructured to comply with the Government’s policy on capital participation in industry
Exemption via Gazette Orders which are currently available include:
1. Disposal of chargeable assets: a) To or in favour of a special purpose vehicle; or b) In connection with the repurchase of the chargeable assets, to or in favour of the person from
whom those assets were required, for the purpose of a transaction 2. Disposal of chargeable assets in relation to the Sukuk issued by the Malaysian Global Sukuk
Incorporated 3. Disposal of chargeable assets in relation to the Sukuk Bank Negara Malaysia-Ijarah issued or to be
issued by BNM Sukuk Berhad 4. Disposal of chargeable assets to Real Estate Investment Trust and Property Trust Funds 5. Disposal of chargeable assets in relation to the issuance of private debt securities under Islamic
principles D: Sales Tax
Sales tax is a single stage tax imposed on taxable goods manufactured locally and/or imported. “taxable goods” means goods of a class or kind not for the time being exempted from sales tax. The sales tax Act 1972 and its related legislation apply throughout Malaysia excluding the Joint Development Area (JDA). Free Zones and Licensed Manufacturing Warehouses are deemed to be places outside Malaysia ans as such, do not fall within the ambit of the tax. Special provision apply to Labuan, Langkawi and Tioman which generally exclude these places from the scope of sales tax.
Sales tax is a consumption tax and under the system, the onus is on manufacturer of taxable goods to levy, charge and collect the tax from their customers.For imported goods, sales tax is collected from the importer upon the release of taxable goods from Custom control. Rates of tax
Sales tax is an ad valorem tax and can be computed based on the value of taxable goods sold, used or disposed of, or imported. Specific sales tax rates are currently only imposed on certain clasess of petroleum (generally, refined petroleum).
Broadly, sales tax is chargeable at the following rates; Table 13 : Tax Rates
Class of Goods Rate (%) Fruits, certain foodstuff, timber and building material 5 Liquor and alcoholic drinks 5 Cigarette and tobacco products 5 All other goods not specifically exempted 10
Goods Exempted
All export are exempted from sales tax. Goods which are specifically exempted include: 1. Live animals, fish, seafood and certain essential food items including meat, milk, eggs, vegetables,
fruits, bread, etc
127
2. Medical and educational equipment including sports equipment, books, etc 3. Photographic equipment and films 4. Motorcycles not exceeding 200 cc capacity, bicycles for adult use including parts and accessories 5. Machinery for textile industry, food preparation industry, paper and printing industry, construction
industry, metal industry, etc 6. Primary commodities including cocoa, rubber and their related products 7. Naturally occuring mineral substances, chemicals, etc 8. Helicopters, aircraft, ships and other vessels
Licensing
Any person who manufactures taxable goods in the course of business is required to be licensed as a licensed manufacturer
“Manufacture” means: 1. In relation to goods other than petroleum, the conversion by manual or mechanical means of
organic or inorganic materials into a new product by changing the size, shape or nature of such materials and includes the assembly of parts into a piece of machinery or other products, but does not include the installation of machinery or equipment for the purpose of construction; and
2. In relation to petroleum, refining or compounding and includes the addition of any foreign substance
Exemption from licensing
A manufacturer of taxable goods whole total sales value did not exceed RM10,000 in the preceding year and is not expected to exceed RM10,000 during the next 12 month may apply for a certificate of exemption from licensing. Certain manufacturing operations are also exempted from the licensing requirement. They include the following:
1. Developing and printing of photographs and production of film slides. 2. Engraving of articles with the name of the recipient, his sports record or other circumstances under
which the article was donated or awarded. 3. Incorporation of goods into buildings 4. Manufacture of ready-mixed concrete 5. Repacking of bulk goods into smaller packages by a person other than a licensed manufacturer. 6. Repair of second hand goods 7. Installation of air conditioners in motor vehicles. 8. Manufacture of jewellery and goldsmith wares
Tax free raw materials
In order to uphold the single-stage concept, there are facilities for licensed manufacturers obtain taxable raw materials/packing materials free of sales tax for use in the manufacture of taxable goods. Drawback
This is an incentive to promote export of domestically manufactured products by reducing the cost of production, thereby enhancing the competiveness of such products in the global market.Where sales tax is paid in respect of goods, which are subsequently re-exported, drawback of sales tax is allowed on:
1. Tax paid finished goods, either imported or purchased from licensed manufacturer; and 2. Tax paid raw materials/packing materials, which are used in the manufacture of finished goods for
export. Drawback is not allowed for petroleum. Payment of sales tax
128
Generally, sales tax shall be due at the time the taxable goods are sold, or disposed of otherwise than by sale by the taxable person. Any sales tax that falls during any taxable period, which is 2 calendar months, shall be paid to the customs authorities within 28 days from the expiration of the taxable period.
In relation to the classes of petroleum that are subject to sales tax, there are special provisions regarding the time when sales tax is due and payable, as follows:
1. Where taxable petroleum is manufactured in Malaysia: 2. Sales tax is due at the time the taxable petroleum is sold or disposed of otherwise than by sale;and 3. Any sales tax that falls due during a taxable period, which is 1 calendar month, is payable within 10
days from the expiration of the taxable period 4. Where imported taxable petroleum is stored in licensed warehouses under S. 65 of the Custom Act
1967: 5. The sales tax is due at the time the taxable petroleum is released from the licensed warehouses for
home consumption; and 6. Any sales tax that falls due during a calendar month is payable within 10 days from the expiration
of that month.
E. Import Duties Rates of Duties
Import duties are levied on goods that are subject to import duties and imported into country. Import duties are generally levied on an ad valorem basis but may also be imposed on a specific basis. The ad valorem rates of import duties range from 0% - 60%. Raw materials, machinery, essential foodstuffs and pharmaceutical products are generally non-dutiable or subject to duties at lower rates. Claim to pay duty at preferential rate can be made in respect of qualifying goods originating from country that has a free trade agreement with Malaysia. In addition, in and out quota tariff rate is applicable to certain goods subject to tariff rate quota. Tariff rate quota
Certain agricultural products, such as chicken, hen eggs, cabbages imported are subject to tariff rate quota (TRQ). Under TRQ, the tariff charged depends on the volume of imports. Import within quota will be subject to the in-quota tariff rate, whilst import in excess of quota will be subject to out –quota tariff rate, which is generally higher (sometimes much higher) than the in quota tariff rate. The quota applicable is determined by the relevant agency, e,g Department Veterinary Services. Preferential duty
Qualifying goods originating from China, Japan, Korea, Pakistan, Australia, New Zealand, India and ASEAN countries (Brunei, Cambodia, Indonesia, Laos, Malaysia, Myanmar, Philippines, Singapore, Thailand and Vietnam) imported into Malaysia may enjoy preferential rates of duty under the relevant free trade agreements. The preferential rates can be significantly lower than the standard rates of duty. In order to qualify for the preferential rates can be significantly lower than the standard rates of duty. In order to qualify for the preferential rate of duty, evidence of qualification (usually a certificate of origin) issued by the relevant Government Agency or Ministry in the exporting country must be produced at the time of importation. Classification of goods
The rates of import duty on dutiable goods are dependent on the classification of the goods under the Customs Duties Order 2007. Malaysia adopts a coding or classification system commonly referred to as the Harmonized System (HS) which was established under the International Convention on the Harmonized Commodity Description and Coding system.
129
The general Rules of Interpretation (GRI) of the HS is an integral part of the Customs Duties Order 2007. Classification of goods under the HS is applicable to goods imported from all countries other than ASEAN. Goods imported from ASEAN countries are classified under the ASEAN Harmonized Tariff Nomenclature (AHTN) which although based on the HS, allows for certain variations. Imported may apply for classification ruling from the respective State Customs office or Customs Headquarters in advance to avoid potential dispute with Customs during importation/exportation clearance. Value of goods
The custom value of imported goods is determined largely in accordance with the World Trade Organization (WTO) principles of custom valuation. Exemptions
In general, manufacturers are eligible to apply for the following exemptions. 1. Import duty exemption on raw materials and components used directly for the manufacture of goods
for export and domestic markets not available locally; and 2. Import duty and sales tax exemption on machinery and equipment which are used directly in the
manufacturing process and are not available locally. Malaysian Industrial Development (MIDA) is the processing authority. F. Licensed Manufacturing Warehouse
Quantitative import restriction are seldom imposed except on a limited range of products for protection of local industries and reasons of security and environment grounds. Non automatic import permits/license issued by prescribed Authorities are required on selected goods (including motor vehicles, fish and fish products, certain chemicals and drugs, liquor and tobacco, radioactive materials, explosives and fireworks, etc.) . Absolute prohibition applies to 15 categories of goods prescribed (including turtle eggs, Piranha fish, certain poisonous chemicals, etc.). G. Free Zone
A free zone is deemed to be place outside Malaysia for customs purposes and is not subject to most customs formalities except certain Prohibition Orders on imports and exports. Goods can be brought into or provided in free zones without payment of customs duties and sales tax, except those that are specifically excluded (e.g. forklifts, tires, petroleum products, air conditioning equipment, office furniture, construction/ building materials). H. Export Duties Basis of taxation
Export duties are generally imposed on the country’s main commodities. The ad valorem rates of export duty range from 0% to 20%. Some of the commodities that attract export duty are crude petroleum oil (at 10%), rattan whole (at RM2.70 per kg) and crude palm oil (based on scaled rates on gazetted value) Value of goods For the purpose of computing export duty, the value of the goods is the price which an exporter would receive for the goods calculated to the stage where such goods are released by customs at the place of export. I. Excise Duties Basis of Taxation
130
Excises duties were previously imposed on a selected range of goods manufactured in Malaysia. With effect from 1 January 2004, the scope of excise duty has been expanded to also cover selected imported goods, including motor vehicles. Goods which are subject to excise duty include:
1. Beer, stout and other intoxicating liquor (e.g cider and perry, rice wine, mead, brandy, whisky rum and tafia, gin);
2. Cigarettes containing tobacco 3. Motor vehicles; and 4. Playing cards
Rates of duties
The rates of excise duties vary for each ‘exciseable’ product for example: 1. RM0.22 stick and 20% for cigarettes; 2. 10 cents per litre and 15% for spirituous beverages with alcohol content exceeding 0.5% vol but not
exceeding 1.14% volume; 3. RM7.40 per litre and 15% - RM30 per 100% volume per litre and 15% for rice wine, mead and
wines (from juices other than juice of fresh grapes or from vegetables juices); 4. 60% - 105% for motorcars (depending to the engine capacity)
Value of goods
For goods manufactured locally, the definition of ‘value’ under the Excise Act 1976 for computation of excise duty payable purposes is “ the price which a buyer would give for the goods on purchase in the open market at the time when duty is payable but will exclude any excise duty, costs, charges and expenses of transportation and storage immediately after removal from the place of manufacture”. In the case of goods imported into Malaysia, the value on which excise duty is charged is the sum total of the value of such imported goods as determined under the Custom Act 1967 and the amount of customs duty, if any, payable on such imported goods. Licensing
Unless exempted from licensing, a manufacturer of tobacco, intoxicating liquor or goods subject to excise duties must have a license to manufacture such goods. A warehouse tobacco, intoxicating liquor or goods subject to excise duty also permits the holder to store such goods. Payment of duty
As a general rule, duty is payable at the time the goods leave the place of manufacture or any other place under excise control. However, for motor vehicles, duty is payable at the time the vehicles are registered with the Road Transport Department, or, if not registered, within 4 years from the date of removal from the place of manufacture. Export
No excise duty is payable on dutiable goods that are exported.
131
IV. Malaysia Fiscal Issues
Amid the more challenging external environment, Malaysia’s economy is projected to experience a steady pace of growth of 4 – 5% in 2012. Domestic demand is expected to remain resilient and will continue to be the anchor for growth. Following the strong expansion in 2011, the growth of both private consumption and investment is projected to soften in 2012, as both income and capital expenditure in the external-related sectors of the economy are affected by the slower global growth. Nevertheless, some measures announced in the 2012 Budget are expected to provide support to private consumption. These include the one-off financial assistance to low- and middle income groups and the higher increment of public sector wages. Private investment will be supported by continued investment by domestic-oriented industries and the ongoing implementation of projects under the Economic Transformation Programme (ETP). The public sector will remain supportive of growth in 2012, with higher capital expenditure by both the Federal Government and the non-financial public enterprises (NFPEs). The implementation of the Special Stimulus Package through Private Financing Initiative that was announced in the 2012 Budget would also provide further impetus to real activity during the year.
On the supply side, most sectors will continue to expand in 2012. Nevertheless, the slower growth in global demand may adversely affect export-oriented industries in the manufacturing sector as well as trade-related industries in the services sector. The performance of domestic oriented industries, on the other hand, is expected to remain firm, benefiting from resilient domestic demand conditions. In particular, the construction sector is projected to record a stronger growth, supported by the implementation of major infrastructure projects and the Special Stimulus Package. Growth in the mining sector is also expected to strengthen. However, the agriculture sector is likely to register a more moderate growth mostly on account of lower growth of both palm oil and natural rubber following the strong performance seen in 2011.
Headline inflation is expected to moderate in 2012, averaging between 2.5 - 3.0%. The lower inflation projection reflects the moderation in global commodity prices and the weaker global growth outlook. Domestically, more modest growth in domestic demand would also restrain price pressures. In the absence of significant adjustments to administered prices, domestic inflation would remain contained. On the external front, the current account surplus is projected to remain large at RM109.5 billion or 12.2% of gross national income (GNI). Although gross exports are expected to record a slower growth in 2012, the trade account surplus will remain large. This is due to the anticipated slower growth in gross imports in tandem with the weaker demand for manufactured exports and moderate growth in private domestic demand. Deficits in the services and income accounts are also projected to narrow further in 2012. On the financial account, capital flows are likely to remain volatile, amid heightened global uncertainty. Despite the moderation in economic growth in 2012, the underlying fundamentals of the economy is expected to continue to remain strong, with the unemployment rate projected to remain low at 3.2% of the labour force. Financial stability is expected to remain intact, underpinned by well-capitalised financial institutions which will continue to provide support for financial intermediation in the economy. Given the comfortable level of reserves and relatively low external debt, Malaysia is well positioned to manage volatile capital flows under the current environment of continued volatility in the international financial markets.
The GDP growth projection of between 4 – 5% in 2012 is premised upon the expectation of a moderation in global growth and the timely and full implementation of measures announced in the 2012 Budget. Several risks, however, remain. These risks include a deterioration in the eurozone sovereign debt crisis, and much slower growth in our major trading partners. Should growth in the advanced economies turn out to be stronger than expected, there is some upside potential to domestic growth in 2012. It should also be noted that the authorities have sufficient policy flexibilities and tools to support the domestic economy and manage the international challenges, should conditions warrant it.
132
V. Conclusion : Where we stand? Where we go?
The government effective demand management policies enabled the economy to rebound strongly from the 2008/2009 global financial crisis. The swift recovery in the wake of the worst global economic slump since the 1930, examples the solidarity of Malaysians as well as the commitment of the Government in focusing and providing quick outcomes areas that matter most to the citizen. With the economy back on its growth trajectory, the every year budget will focus on strategies and programmes to enhance the nation’s potential growth as well as improve the well being of the citizen. The government remains vigilant to uncertainties in the global economy and is committed to staying course, through a comprehensive economic, government, political and social transformation, to realise Malaysia’s aspiration to be a developed and high income economy by 2020. For this, the nation relies on the unwavering support, commitment and contribution of all Malaysians.
Malaysia’s external position is expected to remain strong backed by steady intra-regional trade and services related activities. The current account is envisaged to record a surplus for the 15th consecutive year since 1998 underpinned by a larger surplus in the goods and services accounts. The goods account is expected to register a surplus spurred by expansion in domestic economic activities and higher export earnings of manufactured goods as well as firm commodity prices. Exports are expected to grow while import anticipated to pick up strong, by reflecting strong investment and consumption activity in the domestic economy.
Monetary policy will continue to facilitate economic growth while managing the risks to inflation and the build-up of financial imbalances. Prevailing monetary conditions remain supportive of economic activity. Should the global economy enter a new phase of even weaker growth and adversely affect the outlook for the Malaysian economy, the MPC at Bank Negara Malaysia has the flexibility to respond to adjust the degree of monetary accommodation. Strong fundamentals, greater policy flexibility and closer cooperation with central banks within the region also places Malaysia in a strong position to face the challenges posed by large and volatile movements of capital flows.
As part of the continuous effort to enhance regional and international cooperation, the central bank continues to be involved in technical collaboration with external agencies and central banks from other emerging economies, particularly in the areas of Islamic finance, organisational development, financial inclusion, consumer protection and financial education.
133
134
References Berita Publishing Sdn Bhd. (2005). Information malaysia 2005. Malaysia: Berita Publishing Sdn Bhd. CCH Tax Auditor. (2011). Malaysia master tax guide 2012. Malaysia: CCH Asia Pte Limited. K.S, J., & Siew Kiat, N. Malaysia's economic development policy & reform. Malaysia: Malaysian
Institute of Economic Research. Malaysian Institute of Accountant. (2011). 2012 budget commentary and tax information. Kuala Lumpur:
certified tax institute of malaysia, malaysian institute of accountants, the malaysian institute of CPA. The Commissioner of Law revision. (2006). Laws of malaysia, income tax act 1967 . Malaysia:
Percetakan Nasional malaysia Bhd. Wai Ching, P. (2008). Malaysian economy. (2nd ed.). Malaysia: Prentice Hall. (2012). Retrieved from www.bnm.gov.my (2012). Retrieved from www.matrade.gov.my (2012). Retrieved from www.statistics.gov.my (2012). Retrieved from www.treasury.gov.my