50
3. SHIPPING AND SHIPPING RELATED INDUSTRIES

3. SHIPPING AND SHIPPING RELATED INDUSTRIES

JICA-MARINA The Study on Domestic Shipping Development Plan in the Philippines (DSDP)
Final Report
3-1
3. SHIPPING AND SHIPPING RELATED INDUSTRIES
3.1 Shipping Industry
3.1.1 The Industrial Structure
From the year 1999 to 2002, there has been an increasing trend in the number of new domestic shipping companies accredited by the MARINA (see figure 3.1.1).
Figure 3.1.1. Accreditation of Shipping Companies
Source: MARINA Website
In terms of paid-up capital, it is quite apparent that the distribution is severely skewed towards a few companies owning a large share of the total paid up capital (See Figure 3.1.2 and Table 3.1.1). It is also pertinent to note that the youngest of the shipping companies in the current top ten was established in 1985. This indicates that for the last 20 years, no major player was able enter the market.
Figure 3.1.2. Domestic Shipping Companies (in Terms of Paid-Up Capital), 2000
Source: MARINA Website
327
540 560617585
0
100
200
300
400
500
600
700
1999 2000 2001 2002 2003Year
Num
ber o
f Shi
ppin
gC
ompa
nies
AccreditedShippingCompanies
11 4 3
130
2
87%
94% 97%
99%100%
0
20
40
60
80
100
120
140
0-31000 31001-86500
86501-190000
190001-301000
>301000
Assets ('000)
No.
of S
hipp
ing
Com
pani
es
80%
85%
90%
95%
100%
105%
No ofCompaniesCummulative Percentage

JICA-MARINA The Study on Domestic Shipping Development Plan in the Philippines (DSDP) Final Report
3-2
Table 3.1.1. Top Ten Domestic Shipping Companies (in Terms of Paid-up Capital and GT, 2000)
Name of Company Total
Number of Vessel
Total GRT (000 tons)
Paid-up Capital (P’ 000)
Year Established
1 Negros Navigation 21 65,500 3,637,635 1932 2 WG & A 28 173,900 1,496,599 1948 3 Lorenzo Shipping Corp 7 44,700 300,752 1973 4 Herma Shipping & Transport Corp 15 9,300 251,700 1985 5 Sulpicio Lines 31 147,300 213,252 1973 6 PNOC Shipping & Transport Corp. 9 18,150 190,000 1975 7 Solid Shipping Lines 10 37,350 125,000 1980 8 Phil. Fast Ferry Corp. 1 480 105,116 - 9 MIS Maritime Corp 6 13,000 100,000 - 10 NMC Container Lines, Inc 2 5,700 86,500 -
Source: MARINA-DSO
As shown in Table 3.1.2, the share of top ten companies accounts for almost half of the total GRT registered. The top ten companies accounts for around 0.5% of the total number of the domestic shipping companies, despite its huge share in total GRT at 48%. Thus, in the same vein as above, vessel capacity ownership is likewise skewed that most of the vessel capacity is owned by only a few companies (see Table 3.1.1).
Thus, despite the increase of the number of shipping companies shown earlier, trunk line operation remains rooted to a few companies, thereby in many forums, the Philippine domestic shipping industry is commonly referred to be oligopolistic in structure.
Table 3.1.2. Top Ten Domestic Shipping Companies in Terms of GRT (2000)
No Name of Company Total
Number of Vessel
Total GRT (Thousand
tons)
Place Registered
1 WG&A Philippines, Inc. 28 173,900 Cebu City 2 Sulpicio Lines, Inc. 31 147,300 Cebu City 3 Negros Navigation Co., Inc. 21 65,500 Iloilo 4 Lorenzo Shipping Corp. 7 44,700 Manila 5 Solid Shipping Lines 10 37,350 Manila 6 Asian Shipping Corp. 47 26,600 Manila 7 Trans-Asia Shipping Lines, Inc. 13 23,000 Cebu City 8 Loadstar Shipping Co., Inc. 19 21,500 Manila 9 Northern Mindanao Transport Corp. 25 19,800 Manila 10 Premier Shipping Lines 17 19,450 Manila Sub-total (A) 208 579,100 Others 2,945 620,900 Share of (A) in Total 6.5% 48.0% Source: MARINA website (Year 2000) Note: Fishing companies are omitted from this list.
The major part of domestic shipping, however, is operated and managed by numerous small scale shipping companies mostly registered in cities other than Manila and Cebu. Most of these companies are of single owner – single ship type of operation, similar to that of jeepney ownership and operation in the land transport sector of the Philippines. The distribution of business opportunities among these large scale shipping companies and the rest of medium and small scale shipping companies are analyzed by type of operation in the subsequent section.

JICA-MARINA The Study on Domestic Shipping Development Plan in the Philippines (DSDP)
Final Report
3-3
(1) SHIPPING COMPANIES BY TYPE OF SERVICE
Based on an updated MARINA database of vessel and companies (2003), an analysis was done to delineate the outlook of the domestic shipping industry in terms of tonnage owned by each company and by type of operation. In this report, a grouping of shipping companies is done by type of service as shown in Table 3.1.3.
Table 3.1.3 Grouping of Type of Service
Type of Service Type of Ship Operated Cargo Freighter Service Container General Cargo Passenger Cargo Service Passenger Cargo Ferry Service Passenger Ferry Passenger Liquid Carrier Service Petroleum Tanker Liquid Carrier
Source: MARINA 2003 Note: Category of service is referred with VES 2003 of MARINA
The ranking of shipping companies by type of services was analyzed to know the size of the share of top ten ranked companies in relevant service sector.
Table 3.1.4 shows the share of top ten companies in the cargo freight service in terms of GRT and the number of ships owned and operated in the group of companies for cargo freight service which is composed of full-container ship and general cargo ship having gear to handle containers. Only 1% of total number of shipping companies accounts for 10% of total number of ships owned and operated; and 40% of total GRT.
Table 3.1.4 Top Ten Companies in Cargo Freight Service
No Name of Company Service Area Nos. of Vessel Total GRT 1 Lorenzo Shipping Manila 6 39,850 2 Solid Shipping Lines Manila 10 37,350 3 Sulpicio Lines, Inc. Cebu 11 28,850 4 Loadstar Shipping Co., Inc. Manila 19 27,175 5 Asian Shipping Corporation Manila 28 26,050 6 Candano Shipping Lines, Inc. Legaspi 27 18,940 7 Northern Mindanao Transport Iligan 17 17,380 8 Premier Shipping Lines Cebu 14 14,420 9 W.G & A Philippines, Inc. Manila 4 13,500 10 APO Cement Corporation Cebu 1 11,650 Sub-total (A) 137 235,160 Others 1,275 347,320 Share of (A) in Total 10% 40% Source: MARINA 2003 Note: 1) Data of registered vessel is out and computed by the Study Team.
2) Several general cargo vessels are of geared vessel for container transport.
Table 3.1.5 shows the share of top ten companies in the passenger cargo service in terms of GRT and the number of ships owned and operated in the group of companies for passenger cargo service. Only 2.3% of total number of shipping companies account for 13% of total number of ships owned and operated; and 88% of total GRT.

JICA-MARINA The Study on Domestic Shipping Development Plan in the Philippines (DSDP) Final Report
3-4
Table 3.1.5. Top Ten Companies in Passenger Cargo Service
Nos Name of Company Service Area
Nos. of Vessel Total GRT
1 W. G. & A. Philippines, Inc. Cebu 21 148,9202 Sulpicio Lines, Inc. Cebu 20 114,6503 Negros Navigation Co., Inc. Iloilo 13 56,0504 Trans-Asia Shipping Lines, Inc. Cebu 12 22,2605 MBRS Lines, Inc. Manila 4 13,5906 Sampaguita Shipping Cebu 4 7,4007 Viva Shipping Lines, Inc. Batangas 12 7,2508 Cokaliong Shipping Lines, Inc. Cebu 5 6,1009 Montenegro Shipping Lines, Inc. Batangas 13 5,15010 George & Peter Lines, Inc. Cebu 4 2,900 Sub-total (A) 108 384,280 Others 728 49,430 Share of (A) in Total 13% 88%
Source: MARINA 2003 Note: Data of registered vessel is sorted out and computed by the Study Team.
Table 3.1.6 shows the share of top ten companies in the passenger ferry service in terms of GRT and the number of ships owned and operated in the group of companies for passenger cargo service. Only 1.6% of total number of shipping companies accounts for 1.0% of total number of ships owned and operated; and 14.6% of total GRT.
Table 3.1.6. Top Ten Companies in Passenger Ferry Service
No Name of Company Service Area
Nos. of Vessel Total GRT
1 Coco Explorer Inc. Batangas 1 1,340 2 RN Hi-speed Ferries, Inc. Batangas 1 1,140 3 Jetstream Holdings, Ltd. Cebu 1 660 4 GT Ferry, Inc. Cebu 1 590 5 Walker Dining Cruise, Inc. Manila 1 490 6 Grand Seaway Ferries, Inc. Manila 1 480 7 Negros Navigation Co., Ltd. Iloilo 1 480 8 Water Jet Shipping Corporation Cebu 2 480 9 Danilo Lines, Inc. Cebu 1 480 10 Phil. Fast Ferry Corporation Cebu 3 480 Sub-total (A) 13 6,620 Others 1268 38,620 Share of (A) in Total 1.0% 14.6% Source: MARINA 2000 Note: 1) Data of registered vessel is sorted out and computed by the Study Team.
2) Several general cargo vessels are of geared vessel for container transport.
Table 3.1.7 shows the share of top ten companies in the liquid carrier service in terms of GRT and the number of ships owned and operated for this type of service. As shown in this table, 11.5% of total number of shipping companies accounts for 65.0% of total number of ships owned and operated; and 63% of total GRT.
The client of liquid carriers is limited only to the refineries and they carry only petroleum products and LPG. Due to a substantial difference between other type of service and business, the GRT owned by shipping companies is evenly distributed among all companies rendering this type of service.

JICA-MARINA The Study on Domestic Shipping Development Plan in the Philippines (DSDP)
Final Report
3-5
Table 3.1.7. Top Ten Companies in Liquid Carrier Service
Nos Name of Company Service Area
Nos. of Vessel Total GRT
1 PNOC Shipping & Transport Corp Manila 8 17,0802 Flagship Petroleum Carriers Manila 5 12,0103 MIS Marine Corporation Manila 5 11,4504 Herma Shipping and Transport Corp Manila 15 10,2805 Supreme Marine Co., Inc. Manila 3 6,8906 Terban Marine Corporation Manila 3 6,7307 Grand Asian Shipping Lines, Inc. Manila 10 6,3208 Sun Marine Corporation Manila 3 5,6009 Core Marine Corporation Manila 3 5,34010 Safeway Maritime Bulkers Manila 2 4,940 Sub-total (A) 57 86,670 Others 110 50,650 Share of (A) in Total 65% 63%Source: MARINA 2003 Note: 1) Data of registered vessel is sorted out and computed by the Study Team.
2) Several general cargo vessels are of geared vessel for container transport.
Table 3.1.8 tabulates the summary of preceding tables which shows the skewed distribution of transport capacity.
Table 3.1.8. Share of Top Ranking Companies
Type of Service A B C D E F G Cargo Freighter 914 10 0.1% 1,412 137 10% 40% Passenger Cargo 422 10 2.5% 836 108 13% 88% Passenger Ferry 611 10 1.6% 1,281 13 1% 15% Liquid Carrier 57 10 11.5% 167 57 65% 63% Average 501 10 2.0% 924 79 12% 60 Source: Study Team based on MARINA’s ship registration data Note: A: Total number of shipping companies own and operate such type of service.
B: The number of shipping companies top ranked. C: Share of top ranking companies. D: Total number of vessel E: Number of vessels owned and operated by top ranking shipping companies. F: Share of top ranking companies in terms of number of vessels. G: Share or top ranking companies in terms of GRT.
3.1.2 Categorization of Shipping Companies
(1) SHIPPING COMPANIES BY TYPE OF SERVICE
The size and management capability of domestic shipping companies can be categorized by the number and total GRT of ships owned and operated; as well as share in total of the same in respective type of service.
The distribution of number of company and ships owned and GRT by type of service is analyzed in weight as shown in Table 3.1.9. The companies are further grouped by category which reflects the size, capability and management level as a domestic shipping operator. The criteria used for the grouping of companies for categorization is shown in Table 3.1.9.

JICA-MARINA The Study on Domestic Shipping Development Plan in the Philippines (DSDP) Final Report
3-6
Table 3.1.9. Criteria Applied for Categorization of Shipping Companies
Category III II I Cargo Freighter Total GRT of ship(s) owned and operated >5000 ≥3000 <3000 Number of ships owned and operated ≥3 ≤2 =1 Liquid Carrier Total GRT of ship(s) owned and operated >5000 ≥2000 <2000 Number of ships owned and operated ≥3 ≤2 =1 Passenger Cargo Total GRT of ship(s) owned and operated >2500 ≥1500 <1500 Number of ships owned and operated ≥3 ≤2 =1 Passenger Ferry Total GRT of ship(s) owned and operated >250 ≥5 <5 Number of ships owned and operated ≥3 ≤2 =1
As a result of the categorization, the domestic shipping companies were grouped by type of service and by category. Table 3.1.10 summarizes the percentage of shipping companies and its composition by type of service and illustrates the structure of domestic shipping business in terms of distribution of resources.
Table 3.1.10. Distribution of Company, GRT and Ships by Type of Service
Type of Service Category Cargo Freighter
Liquid Carrier
Passenger Cargo
Passenger Ferry
I 92.7% 70.9% 94.5% 45.5% II 4.0% 16.6% 2.9% 48.0% III 3.3% 12.5% 2.6% 6.5%
Percentage of Shipping Company
Total 100.0% 100.0% 100.0% 100.0% I 25.4% 24.0% 6.6% 11.1% II 18.7% 32.6% 4.2% 33.7% III 55.9% 43.4% 89.2% 55.2%
GRT
Total 100.0% 100.0% 100.0% 100.0% I 73.7% 52.8% 83.3% 24.5% II 10.6% 18.9% 3.5% 69.9% III 15.7% 0.0% 13.2% 5.6%
Number of Ships
Total 100.0% 71.7% 100.0% 100.0%
Figure 3.1.3 below illustrates the structure of domestic shipping business in terms of distribution of resources.

JICA-MARINA The Study on Domestic Shipping Development Plan in the Philippines (DSDP)
Final Report
3-7
Figure 3.1.3. Distribution of the Number of Company, Ship and GRT by Type of Service
Cargo Freighter
0%
10%
20%
30%
40%
50%
60%
70%
80%
90%
100%
Nos of Shipping Company Number of Ships GRT
Cat I
Cat II
Cat III
Liquid Carrier
0%
10%
20%
30%
40%
50%
60%
70%
80%
90%
100%
Nos of Shipping Company Number of Ships GRT
Cat I
Cat II
Cat III
Passenger Cargo
0%
10%
20%
30%
40%
50%
60%
70%
80%
90%
100%
Nos of Shipping Company Number of Ships GRT
Cat I
Cat II
Cat III
Passenger Ferry
0%
20%
40%
60%
80%
100%
Nos of Shipping Company Number of Ships GRT
Cat I
Cat II
Cat III
The above analysis on the industry structure per type of service, clearly demonstrates the oligopolistic nature of service, is more particular in cargo and passenger cargo service. Passenger ferry and liquid cargo service is much more competitive in the sense that vessel capacity ownership is much more dispersed.
3.1.3 Ship Operation and Management Practices
(1) ISSUES IN RELATION WITH THE INSTITUTIONAL FRAMEWORK
The institutional framework directly or indirectly affects actual ship operation and management practices. This section raises some ship operation and management issues identified by the Study Team in relation with the relevant institutional framework.
1) Ship Classification
The Philippine Register of Shipping (PRS) founded in 1988 once served as the solo domestic classification society to class Philippine vessels for a long time. Although PRS is the most experienced and widely operated one, i.e., 466 classed ships by PRS as of March 2004, today, seven other domestic societies also provide the same service. As results, domestic ship owners have a wide range of choice while many including financial institutions question their service quality. On the other hand, IACS members such as ABS, BV, LR and DnV provide services to many of domestic vessels as the condition to apply for DBP finance and marine insurance.
In order to improve the class surveys by domestic societies, it is necessary to impose clear assessment criteria on surveyed ships with adequate training of class surveyors. When facing difficulties in examination, for instance, it is advisable to use a set of camera and cellular phone to communicate with their headquarters and/or MARINA.

JICA-MARINA The Study on Domestic Shipping Development Plan in the Philippines (DSDP) Final Report
3-8
2) ISM Code
MARINA has seriously adopted the ISM/NSM Code to Philippine flagged vessels in order to enhance ship safety. A monitoring arm was established through Administrative Order No. 06-2003 which requires the Central Office and the Regional Offices to submit a monthly report of the status of compliance with the ISM/NSM Code by all shipping companies and ships, and take legal actions against non-compliance with the Code. MARINA has also made efforts to upgrade the current pool of NSM Auditors to become ISM Auditors.
MARINA has made efforts to adapt the Safety Management System (SMS) even to small vessels through simplified forms to fill up. MARINA’s statutory surveys, the ISM/NSM audits, and the class surveys have their own distinct areas of concern. However, there is still a need to improve the system, e.g. preparing suitable manuals, guidelines and checklists based on actual shipping conditions in terms of ship type and size, assigned route and area.
3) Capability for Ship Management
Seafarers should be responsible for onboard maintenance. According to the onboard survey, however, they conduct only ocular surveys without understanding technical criteria sufficiently. In principle, satisfactory ship-management practice can be put into practice through a combination of daily onboard maintenance by seafarers with regular ship inspection by professional superintendents. In this sense, ship-management has not been rooted in the Philippine domestic shipping.
(2) ONBOARD SURVEY FOR SHIP MANAGEMENT PRACTICES
The Study Team has conducted an onboard survey on 10 domestic vessels in collaboration with the MARINA counterparts. In conclusion, the situations are far from satisfactory. Identified problems on ship-management are summarized in the following table while the ship-wise onboard survey results are recorded in the Appendix 1A:
Table 3.1.11 Summary of the Problems from the Onboard Survey
Category Identified Problems Anticipated Problems Defective Safety Facilities and Equipment
・ Fire Prevention: - Inadequate structure of fire shelters - Inadequate design of air vents (no
dampers) ・ Life Saving:
- no lighting for life raft and releasing device
・ Obstruct to prevent the spread of the fire
・ Obstruct to evacuate passengers from ship
Inadequate Ship Operation
・ Inadequate control of engine operation ・ Inadequate implementation of ISM Manual ・ No training on emergency passenger
evacuation, etc.
・ Fire disaster ・ Engine damage
Poor Passenger Services
・ Inadequate quality of running water ・ No hot shower ・ Insufficient room cleaning and noise control
・ Decrease of passengers

JICA-MARINA The Study on Domestic Shipping Development Plan in the Philippines (DSDP)
Final Report
3-9
Figure 3.1.4. Photos from Onboard Surveys
Air Ventilators and entrance doors Name should be painted.
Packing of W/T door must be repaired.
Fire Control plan at Gangway Red color and mark must be painted.
Rope guide for rain protection canvas. In case of emergency, can’t abandon ship. System should be changed. Oil spill tanks for F.O.T. must be installed. Color paint and name for AEH must be identified.
Lobby floor Heavy luggage must be tightened.
Life Jacket stores No. of jacket for adult and children to be identified. Grip handles to be installed.
Bad design of extended wing bridge. Big dead angle for running fix of other ships
Existing poor ship management could cause serious maritime incidents, particularly due to inadequate control of engine operation and insufficient implementation of ISM Manual.
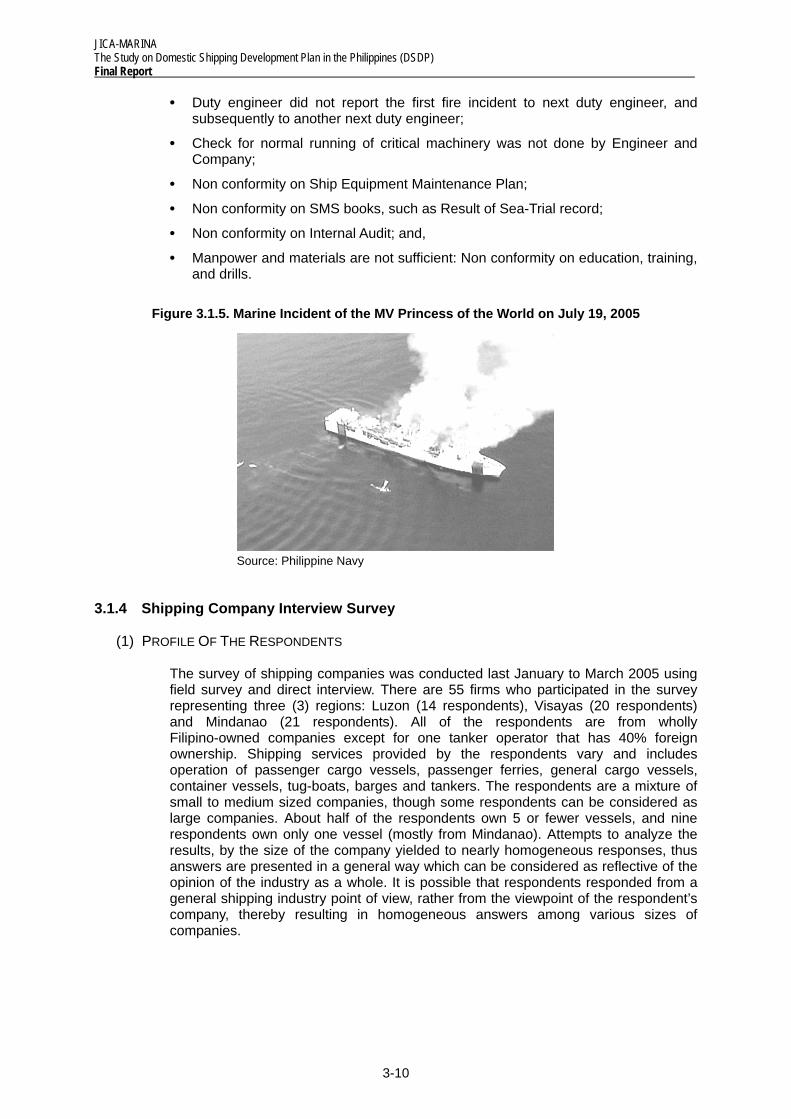
A case in point is a serious incident that happened to the MV Princess of the World (10,799 GT Ropax-type vessel), off Dulunguian Point near Siocon town of Zamboanga del Norte on July 19, 2005 when it was en route to Zamboanga City from Iloilo City. Fire took place at starboard scavenging air trunk of the main engine by combustion gas blow-by and fire spread through the engine room and accommodation area. Fortunately, all 249 passengers and crew aboard were safely evacuated.
MARINA and the Study Team inspected the vessel (after the incident) and as a result, a lot of non-conformities were found and are described below. Details are recorded in the Appendix 1B:
• No record at engine log book regarding the first fire and second fire;
• Duty engineer did not report to the chief engineer and the crew has no standing instructions;
JICA-MARINA The Study on Domestic Shipping Development Plan in the Philippines (DSDP) Final Report
3-10
• Duty engineer did not report the first fire incident to next duty engineer, and subsequently to another next duty engineer;
• Check for normal running of critical machinery was not done by Engineer and Company;
• Non conformity on Ship Equipment Maintenance Plan;
• Non conformity on SMS books, such as Result of Sea-Trial record;
• Non conformity on Internal Audit; and,
• Manpower and materials are not sufficient: Non conformity on education, training, and drills.
Figure 3.1.5. Marine Incident of the MV Princess of the World on July 19, 2005
Source: Philippine Navy
3.1.4 Shipping Company Interview Survey
(1) PROFILE OF THE RESPONDENTS
The survey of shipping companies was conducted last January to March 2005 using field survey and direct interview. There are 55 firms who participated in the survey representing three (3) regions: Luzon (14 respondents), Visayas (20 respondents) and Mindanao (21 respondents). All of the respondents are from wholly Filipino-owned companies except for one tanker operator that has 40% foreign ownership. Shipping services provided by the respondents vary and includes operation of passenger cargo vessels, passenger ferries, general cargo vessels, container vessels, tug-boats, barges and tankers. The respondents are a mixture of small to medium sized companies, though some respondents can be considered as large companies. About half of the respondents own 5 or fewer vessels, and nine respondents own only one vessel (mostly from Mindanao). Attempts to analyze the results, by the size of the company yielded to nearly homogeneous responses, thus answers are presented in a general way which can be considered as reflective of the opinion of the industry as a whole. It is possible that respondents responded from a general shipping industry point of view, rather from the viewpoint of the respondent’s company, thereby resulting in homogeneous answers among various sizes of companies.

JICA-MARINA The Study on Domestic Shipping Development Plan in the Philippines (DSDP)
Final Report
3-11
(2) BUSINESS OUTLOOKS AND OPTIONS
1) Assessment for the Past Three Years and Outlook in the Next Three Years
The general assessment of the last three years is that of lowered profitability. Reasons cited are varied, but most notable ones are: (1) higher fuel cost; (2) limited increase in cargo and passenger traffic; and (3) severe competition within the industry and against airlines.
In the coming three years, most of the respondents are projecting limited growth in profitability. The continuing increase in fuel price is most often noted, while rates will remain low.
2) Expansion Plan for the Next Three Years
Majority of the respondents are adopting a “wait-and-see” stance. However, many stated that they will probably acquire more vessels. Several respondents are considering expanding their service to non-traditional routes – in particular routes between Visayas and Mindanao (e.g. Cebu-CDO). Trans-Visayas routes are also noted – such as Iloilo-Negros.
(3) PROBLEMS AND ISSUES
1) Financing (Acquiring Loans)
Surveyed respondents raised several strong points on issues in acquiring loans from DBP. Respondents state that DBP mostly entertain and accept big companies only with good cash flow while giving low priority to small companies. Furthermore, respondents complained about the varying standards being imposed on treatment of applications, age and classification requirements based IACS standards, high interest rates, slow processing for appraisal/approval and too much requirements on insurance and collateral – all of which discouraged most of the applicants. With regard to commercial banks, participants pointed out the same issues and problems they experience with DBP but pointed out that commercial banks impose a higher interest rate compared to DBP.
2) Operations (Ports and Logistics)
Most of the respondents stated that most of the ports are too congested, imposing high rate of charges on services, lack of standards, do not implement 24-hour operations and lack proper handling equipment. Arrastre handlers lack skills in cargo handling and it results to damage of cargo. They feel that the government through PPA does not allot enough budgets for ports improvement and development. They also added that forwarders are not organized, thus cargo is not consolidated properly.
3) Regulation
Respondents complained of the difficulty of government procedures (e.g issuances of licenses) and requested for a “one-stop-shop” to streamline bureaucratic procedures. Credibility of the government is also problematic, and many respondents noted corrupt practices in the government. There is also a lack of a clear-cut policy and direction that creates uncertainty in business – most notable is the lack of a clear policy on double-hull tankers.
4) Most Pressing Issue
The most pressing issue for shipping companies mainly focuses on the increasing cost of fuel which is taking a major cut in their revenue. The high cost of repair and maintenance are cutting into their profits. Another pressing issue is too much government regulations, overlapping responsibility of agencies, including MARINA.

JICA-MARINA The Study on Domestic Shipping Development Plan in the Philippines (DSDP) Final Report
3-12
Respondents feel that freight rates should be increased to recover their high cost of operation.
5) Human Resources under the Ship Management Program
Shipping companies are positive towards a shipping modernization loan program that has a condition attached to it wherein the ships are overseen by the professional managers, if they see it as reasonable. Reasonable in a sense that it can enhance operation and profitability under agreed conditions, as well as if it is only to oversee operations and not to manage it. On the other hand, some pointed out that there is no need to hire professional ship managers because the market is limited and they are currently training professional-ship managers.
Table 3.1.12. Issues and Problems on Shipping Industry
DBP entertain only those big companies with good cash flow and low priority for small loans. Releasing/approval of loans are too long, too much requirements including collateral and high interest rate which discourage applicants. Varying standards and treatment on applications, age and classification (IACS) requirement, high interest rates and insurance conditions is not so attractive.
Financing (Acquiring Loans)
Interest rates for commercial bank id higher than the DBP. Most of the ports are too congested and lack of the proper handling equipment that hinders in attaining efficient cargo handling. No "one-stop-shop" for shipping industry in processing of documentation which is under the umbrella of one regulating body Some arrastre handlers lack skills in cargo handling causing damage to cargo. Ports do not implement 24-hour operations and wrong policy on security implementation. No maintenance budget from PPA or City Government for port's improvement and development. High cost of ancillary services and cargo handling.
Operations (ports and logistics)
Monopoly operation and no improvements whatsoever in terms of services rendered Government is imposing changes on fees which are continuing every time a new memorandum circular is implemented but there is no improvement being done for the shipping industry Lack of “one stop-shop" for the processing and submission of requirements which lead to increase of fees to be paid. No clear cut policy and unclear direction regarding local implementation of IMO regulations on double hull Conflicting regulations and standards for barges from MARINA and PRC
Regulation
Shipping is a highly regulated business wherein "dagdag" system is present.

JICA-MARINA The Study on Domestic Shipping Development Plan in the Philippines (DSDP)
Final Report
3-13
Column 3-1 PPA’s Response and Initiative
Based on the DSDP shipping company Interview Survey, PPA gave its response and explained their related actions on a comment paper dated 15 November 2005. Since they are worthwhile to facilitate, mutual understanding between the shipping and port sector, the following PPA’s comments are noted in this column.
Overall Development, Maintenance and Operation of Port Facilities
As the JICA-MARINA Study itself has recognized, the underdevelopment of the domestic ports is mainly attributable to the lack of budget or government funding. With 114 ports officially under PPA supervision, development of ports has always been dependent on the availability of Corporate funds while the prioritization of port development projects is based on market demand and financial viability. Thus, ports in highly urbanized cities and the major business centers are the ones that generate more income and have greater opportunity to be developed and maintained.
It is important to note that the bulk of PPA’s annual budget is allocated for Capital Investment Projects, Repair and Maintenance Program, and Maintenance Dredging. During the last five years (i.e. CY 2000-2004), the Port Authority spent at least P1.2 billion pesos annually for these development and maintenance programs, excluding foreign financing, e.g. for Batangas Port Project.
While the problems and issues presented in the JICA Study are based on the survey conducted nationwide, it is noteworthy to consider the following underlying issues and concerns in order to fully address the present problems confronting the domestic port facilities and services.
A. While the administration of ports is mainly guided by the PPA Charter, PPA is obliged to pursue port projects regardless of their financial viability I.e., subsidizing non-viable ports so the needs of other port users/public could be served;
B. The need for PPA to accommodate requests from politicians coupled with other requirements of LGUs for assistance in improving their ports consumed PPA funds for port infrastructure as well as affects the overall programming and implementation of port infrastructure projects;
C. PPA has been consistently contributing 50 percent of its annual net income to the national government hence, only 50 percent is retained to port development, maintenance and management; and
D. The privatization of ports has been considered as an alternative which the Government is seriously looking into however, as the Study pointed out, the feasibility of this undertaking depends on the active participation and eagerness of private investors and stakeholders.
Productivity and Efficiency major Ports like North Harbor
Similarly, one of the major findings of the Study is the underdevelopment of ports insofar as the berth length/depth of major domestic ports is concerned particularly the Manila North Harbor which is the center of the inter -island traffic. For this reason, shipping operators are considered to upgrade and acquire new and bigger vessels that would increase productivity and instead, with only small vessels available, productivity is low and inter-island shipping costs are relatively high. Again, expansion of berth depth and other related port development in Manila North Harbor and other ports would entail massive infrastructure and high costs for the Government, which the Authority could not afford to shoulder alone at this point in time. However, it must be noted that PPA has taken significant steps towards the rehabilitation of the said port through the proposed

JICA-MARINA The Study on Domestic Shipping Development Plan in the Philippines (DSDP) Final Report
3-14
Manila North Harbor Modernization Project (MNHMP) which will be implemented through BOT law or the PPA Charter, whichever is legally expedient. To jumpstart this Project, PPA already completed a major component of this Project consisting of reclamation of 12,000 sq.m. of back-up area, construction of 218 linear meter of berth and rehabilitation of the breakwater using corporate funds.
Cargo Handling Operations
With regards to handling services, the problems raised by the respondents refer to the limited number of cargo handling operators and their inability to meet the demands of the shipping operators, particularly in adopting a 24-hour operation for more operation for more efficient and timely shipping of cargoes.
PPA is implementing a twenty-four hour work schedule by cargo handling contractors/operators as contained in its memo circular numbers 34-96 and 26-99. Furthermore, PPA conducts regular performance and compliance audit of CHOs and their unsatisfactory performance or non-compliance to standards is being dealt with accordingly.
In connection with the findings that the cargo handling for container vessels at the Manila/North Harbor is not satisfactory, the JICA-MARINA Study recommends the transfer of such functions of the said port to other regional ports such as the South Harbor, Harbor center, Batangas Port and/or Subic Port. The issue however, could be properly addressed as soon as the MNHMP is finalized and implemented. Finally, PPA is currently reviewing and assessing the implementation of all existing rules and regulations on cargo handling operations and is expected to come up with an Omnibus Regulation on cargo Handling Operations by 2006.
Bureaucratic Procedures and Corrupt Practices at the Ports
As to the problem on complex bureaucratic procedures and corrupt practices at the ports, it should be mentioned that once the PPA-MIS computerization Project becomes fully operational, all transactions and procedure in all the major ports under PPA will be automated and streamlined and is expected to minimize irregularly and corrupt practices.

JICA-MARINA The Study on Domestic Shipping Development Plan in the Philippines (DSDP)
Final Report
3-15
3.2 Shippers and Forwarders
This section firstly overviews the market conditions and shipping modalities of selected commodities. Secondly, shippers’ comments on shipping are presented.
3.2.1 Commodity Wise Analysis
The following is a presentation of the overall production and consumption as well as shipping modalities of selected key commodities in the Philippines, which have been classified into perishable and non-perishable goods, namely:
Perishable
• Fish • Fruits and Vegetables • Livestock and Poultry
Non-Perishable
• Animal Feeds • Cement • Corn • Fertilizer • Rice • Sugar • Petroleum
(1) PERISHABLE
1) Fish
Fish production and consumption has been increasing in the last few years. Recent data from the Bureau of Agricultural Statistics, pegged fish production at about 4 million MT/yr and this is due to the sharp increase in aquaculture production which grew by 8% in the period 2003-04. Commercial and municipal fishing has not increased significantly. The primary regions of fish production are: Region IV, Region VI, Region IX and ARMM.
Figure 3.2.1. Fish Production
Source: Bureau of Agricultural Statistics

JICA-MARINA The Study on Domestic Shipping Development Plan in the Philippines (DSDP) Final Report
3-16
Breakbulk39%
Bulk6%
Containerized55%
0
50
100
150
200
250
Squid
Bangu
s
Salmon
ete
Pisugo
Dalinu
an
Karah
o
Panda
wan
Tanig
ue
Sapsa
p
Estancia (Iloilo)Divisoria (Manila)Libertad (Manila)SM Manila (Manila)
Figure 3.2.2. Regional Fish Production
Source: The Countryside in Figures, NSCB
The price of fish at the source and at the retail market diverges significantly, at the order of 2 to 3. The following is the landed price of fish in Panay compared with prices at selected retail outlets in Metro Manila.
Figure 3.2.3. Price of Fish at Production Site and Market (P/kg)
Source: DSDP Study market survey Dec. 2004
Figure 3.2.4. Shipping Modality of Fish
Source: PPA 2002
JICA-MARINA The Study on Domestic Shipping Development Plan in the Philippines (DSDP)
Final Report
3-17
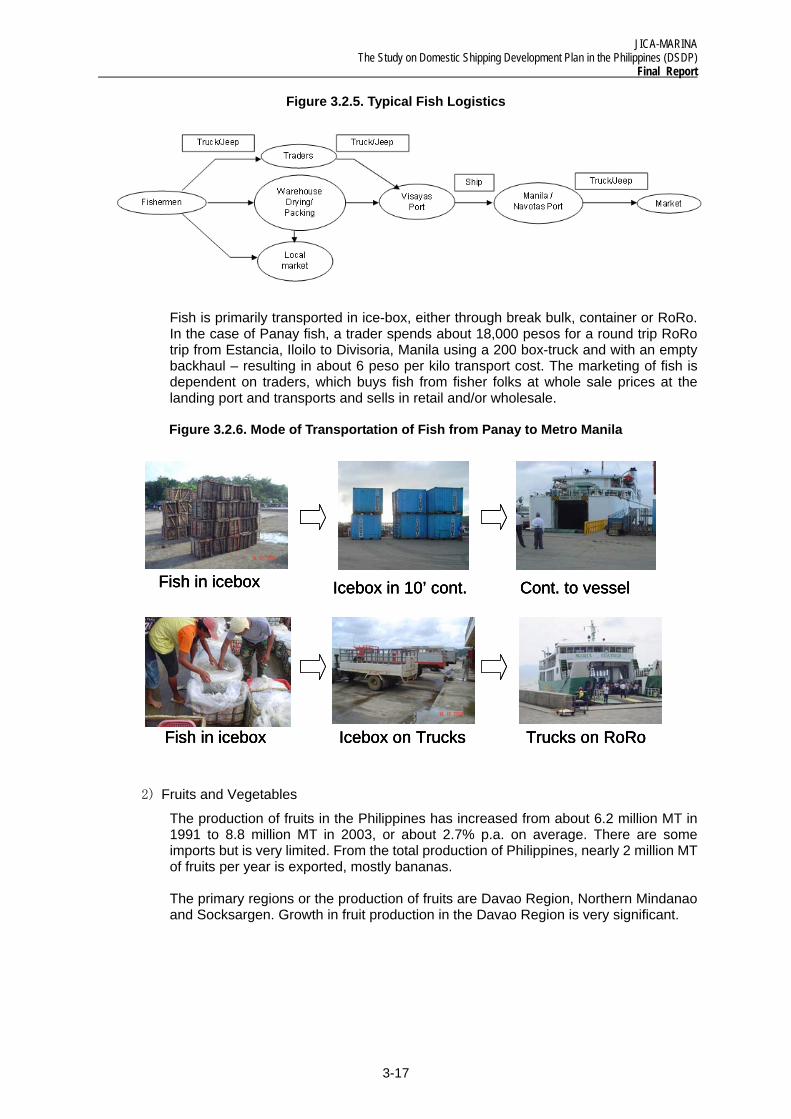
Figure 3.2.5. Typical Fish Logistics
Fish is primarily transported in ice-box, either through break bulk, container or RoRo. In the case of Panay fish, a trader spends about 18,000 pesos for a round trip RoRo trip from Estancia, Iloilo to Divisoria, Manila using a 200 box-truck and with an empty backhaul – resulting in about 6 peso per kilo transport cost. The marketing of fish is dependent on traders, which buys fish from fisher folks at whole sale prices at the landing port and transports and sells in retail and/or wholesale.
Figure 3.2.6. Mode of Transportation of Fish from Panay to Metro Manila
2) Fruits and Vegetables
The production of fruits in the Philippines has increased from about 6.2 million MT in 1991 to 8.8 million MT in 2003, or about 2.7% p.a. on average. There are some imports but is very limited. From the total production of Philippines, nearly 2 million MT of fruits per year is exported, mostly bananas.
The primary regions or the production of fruits are Davao Region, Northern Mindanao and Socksargen. Growth in fruit production in the Davao Region is very significant.
Fish in icebox Icebox in 10’ cont. Cont. to vessel
Fish in icebox Icebox on Trucks Trucks on RoRo
Fish in icebox Icebox in 10’ cont. Cont. to vesselFish in icebox Icebox in 10’ cont. Cont. to vessel
Fish in icebox Icebox on Trucks Trucks on RoRoFish in icebox Icebox on Trucks Trucks on RoRo

JICA-MARINA The Study on Domestic Shipping Development Plan in the Philippines (DSDP) Final Report
3-18
01,000,0002,000,0003,000,0004,000,0005,000,0006,000,0007,000,0008,000,0009,000,000
10,000,000
1990
19
92
1994
19
96
1998
20
0020
02
MT/
year Imports
Domestic Produce
0.00
500,000.00
1,000,000.00
1,500,000.00
2,000,000.00
2,500,000.00
1990
1991
1992
1993
1994
1995
1996
1997
1998
1999
2000
2001
2002
2003
P
Volu
me
(MT/
Yr)
CARILOCOS REGIONCAGAYAN VALLEYCENTRAL LUZONCALABARZONM IM AROPABICOL REGIONWESTERN VISAYASCENTRAL VISAYASEASTERN VISAYASZAM BOANGA PENINSULAN OR THER N M IN D A N A OD A V A O R EGIONSOC C SKSA R GENCARAGAARM M
0200,000400,000600,000800,000
1,000,0001,200,0001,400,0001,600,000
1990
1992
1994
1996
1998
2000
2002
MT/
year Imports
Domestic Produce
Figure 3.2.7. National Fruit Consumption
Source: Bureau of Agricultural Statistics
Figure 3.2.8. Regional Fruit Production
Source: Bureau of Agricultural Statistics
Vegetable consumption has increased at about 2.4% p.a. and is currently about 1.4 million MT/yr. However, domestic production has been very laggard, primarily due to the downturn of outputs right after the financial crisis. However, in recent years, domestic production has again picked up. Importation picked up the slack of domestic production and has increased from about 100,000 MT in 1991 to nearly 400,000 MT in 2003.
Figure 3.2.9. National Vegetable Consumption
Source: Bureau of Agricultural Statistics

JICA-MARINA The Study on Domestic Shipping Development Plan in the Philippines (DSDP)
Final Report
3-19
Breakbulk14%
Bulk32%
Containerized54%
The biggest producer of vegetable is ARMM, and other main producers are the Bicol Region, CAR, and Central Visayas. The drop in domestic production is due to the significant reduction of production in these regions.
Figure 3.2.10. Regional Vegetable Production
Source: Bureau of Agricultural Statistics
Figure 3.2.11. Typical Fruits and Vegetable Logistics Chain
Note: Fruits and vegetables are primarily transported in container (not reefers).
Figure 3.2.12. Shipping Modality of Fruits and Vegetables
Source: PPA 2002
3) Livestock and Poultry
Livestock consumption is growing steadily at a rate of 4.3% p.a. on average from 1990 to 2003. However, domestic production has not been able to keep up and as a result imported livestock has been increasing, but still, the relative volume of imported meat (primarily beef) is limited.
g g
0.00
200,000.00
400,000.00
600,000.00
800,000.00
1,000,000.00
1,200,000.00
1,400,000.00
1990
1991
1992
1993
1994
1995
1996
1997
1998
1999
2000
2001
2002
2003
P
Volu
me
(MT/
Yr)
CARILOCOS REGIONCAGAYAN VALLEYCENTRAL LUZONCALABARZONM IM AROPABICOL REGIONWESTERN VISAYASCENTRAL VISAYASEASTERN VISAYASZAM BOANGA PENINSULANORTHERN M INDANAODAVAO REGIONSOCCSKSARGENCARAGAARM M

JICA-MARINA The Study on Domestic Shipping Development Plan in the Philippines (DSDP) Final Report
3-20
0.00200,000.00400,000.00600,000.00800,000.00
1,000,000.001,200,000.001,400,000.001,600,000.001,800,000.002,000,000.00
1990 1993 1996 1999 2002
MT/
year Imports
Domestic Produce
Figure 3.2.13. National Livestock Consumption
Source: Bureau of Agricultural Statistics 1/ includes cattle, carabao, goat and hog
Production areas of livestock are spread across the country. This is probably due to the nature of the industry which is fundamentally backyard in nature – 86% of output is from backyard farming and only 14% is from commercial farming.
Figure 3.2.14. Regional Livestock Production
Source: The Countryside in Figures, NSCB
Poultry consumption has been increasing very significantly at 8.3% p.a. on average from 1990 to 2003. Philippines imports about 2% of national consumption. Export, so far has been limited.
Chicken production is more or less distributed across the country. However, primary production areas are Central Luzon and Southern Tagalog.

JICA-MARINA The Study on Domestic Shipping Development Plan in the Philippines (DSDP)
Final Report
3-21
0.00
100000.00
200000.00
300000.00
400000.00
500000.00
600000.00
700000.00
1990
1992
1994
1996
1998
2000
2002
MT/
year Imports
Domestic Produce
-
5,000
10,000
15,000
20,000
25,000
N. C. R
.
C. A. R
.
I - ILO
COS REGIO
N
II - C
AGAYAN VALL
EY
III - C
ENTRAL LUZON
IV - S
OUTHERN TAGALOG
V - BIC
OL REGIO
N
VI - W
ESTERN VIS
AYAS
VII - C
ENTRAL VISAYAS
VIII - E
ASTERN VIS
AYAS
IX - W
ESTERN MIN
DANAO
X - NORTHERN M
INDANAO
XI - SOUTHERN M
INDANAO
XII - C
ENTRAL MIN
DANAO
A. R. M
. M.
CARAGA
Thou
sand
sun
its/y
r
Figure 3.2.15. National Poultry Consumption
Source: Bureau of Agricultural Statistics
Figure 3.2.16. Regional Poultry Production
Source: The Countryside in Figures, NSCB 2001 1/ includes chicken and ducks
For the shipping of livestock and poultry, transporting frozen meat is being practiced by some progressive traders, such as members of the Meat Importers and Traders Association. However, the transport of live animals is still prevalent – it is estimated that about 338,000 MT of live animals are being transported compared to 295,000 MT of meat and meat preparations, which are transported in reefers. The cost of transporting meat in reefers is about 4 pesos per kilo (Mindanao to Manila via 20’ reefers).
Figure 3.2.17. Typical Live Animal Logistics Chain

JICA-MARINA The Study on Domestic Shipping Development Plan in the Philippines (DSDP) Final Report
3-22
Breakbulk34%
Bulk16%
Containerized50%
(2) NON-PERISHABLE
1) Animal Feeds
According to the Philippine Association of Feed Millers, domestic production of animal feeds is about 8 million MT per year and has continually been increasing at an average rate of 3% p.a. Based on PPA statistics, about 290,000 MT of animal feeds are imported in 2003.
There are about 70 feed mills all over the country. Feed mills, comprises about 50% corn (other main ingredient is soy beans, 20%), thus feed mills tend to locate near corn production areas.
The demand for feeds is divided between Luzon and Vis-Min at a proportion of 60:40. The demand for feeds at the Vis-Min area is further divided at 30:70 respectively.
Animal feeds are typically transported from feed mills in charted 1,000 DWT vessels or in containers. Large shipments are typically transported via conventional vessels, while smaller shipments are transported through liners. However, sometimes buyers are organized by the feed millers to coordinate their shipments to allow for a bigger order and minimize transport cost. Warehouses typically hold 30-day inventories. The ex-plant price of feeds is about 650-700 pesos/50-kg bag and retails at less than 1,000 pesos/bag.
Figure 3.2.18. Shipping Modality of Animal Feeds
Source: PPA 2002
Figure 3.2.19. Typical Animal Feeds Logistics Chain
Figure 3.2.20. SMC-BMEG Logistics Chain

JICA-MARINA The Study on Domestic Shipping Development Plan in the Philippines (DSDP)
Final Report
3-23
-
2,000
4,000
6,000
8,000
10,000
12,000
14,000
16,000
2002 2003 2004 (proj)
000
MT/
yr
Breakbulk76%
Bulk23%
Containerized1%
2) Cement
Cement production in the last three years is between 13 to 13.5 million MT/yr and, according to the Cement Manufacturers Association of the Philippines, it is roughly distributed as follows: Luzon (45%), Visayas (35%) and Mindanao (20%). Some amount of less than 2 million MT is exported abroad.
Figure 3.2.21. National Cement Production
Source: UNESCAP homepage /1 2004 is projected based on Jan-Sept data
There are about 17 manufacturers in the country: 9 in Luzon, 3 in Visayas and 5 in Mindanao:
Table 3.2.1. Geographical Location of Cement Plants
Luzon Visayas Mindanao Batangas (1) Pangasinan (1) La Union (1) Bulacan (3) Rizal (2) Bicol (1)
Cebu (3) Misamis Oriental (1) Iligan City (2) Davao City (1) Surigao City (1)
Source: CeMAP Interview
Cement is typically transported in break bulk (i.e. 40-kg bags) using general cargo vessels, ranging from 5,000 to 10,000 MT capacity. The retail price of cement is about 150 pesos/bag.
Figure 3.2.22. Shipping Modality of Cement
Source: PPA 2002

JICA-MARINA The Study on Domestic Shipping Development Plan in the Philippines (DSDP) Final Report
3-24
0
1,000
2,000
3,000
4,000
5,000
6,000
1990
19
92
1994
19
96
1998
20
0020
02
MT/
year Imports
Domestic Produce
Breakbulk24%
Bulk16%
Containerized60%
Figure 3.2.23. Typical Cement Logistics Chain
3) Corn
Corn consumption has been more or less flat during the last ten years, at about 4.5M MT. Most of the corn consumed in the country is domestically produced, with some limited importation of corn, 100M MT in year 2003. Corn is primarily used for the manufacturing of animal feeds.
Figure 3.2.24. National Corn Consumption
Source: Bureau of Agricultural Statistics
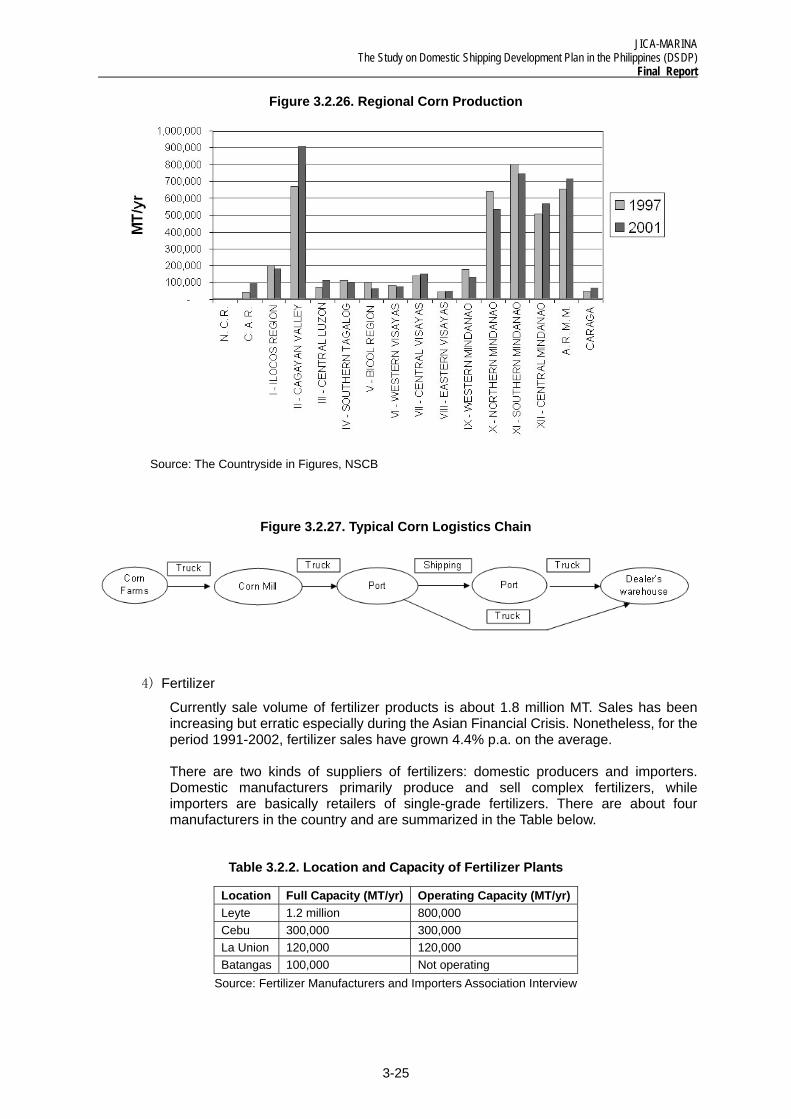
Mostly, corn is being produced in the Mindanao area and in the Cagayan Valley. In the last five years, the production of Mindanao has more or less remained static, while there is a notable increase of corn production in the Cagayan Valley.
A feed miller interviewed in Luzon indicated the cost effectiveness of using Cagayan Valley corn, because of the added cost of shipping, AS corn is usually shipped in containers.
The landed price of corn from Isabela at a Manila factory is about 8.5 pesos per kilo. Transport cost from Mindanao to Luzon is about 0.6 to 0.8 pesos per kilo resulting in a 9.0 to 9.5 peso landed price of Mindanao corn.
Figure 3.2.25. Shipping Modality of Corn
Source: PPA 2002
JICA-MARINA The Study on Domestic Shipping Development Plan in the Philippines (DSDP)
Final Report
3-25
Figure 3.2.26. Regional Corn Production
Source: The Countryside in Figures, NSCB
Figure 3.2.27. Typical Corn Logistics Chain
4) Fertilizer
Currently sale volume of fertilizer products is about 1.8 million MT. Sales has been increasing but erratic especially during the Asian Financial Crisis. Nonetheless, for the period 1991-2002, fertilizer sales have grown 4.4% p.a. on the average.
There are two kinds of suppliers of fertilizers: domestic producers and importers. Domestic manufacturers primarily produce and sell complex fertilizers, while importers are basically retailers of single-grade fertilizers. There are about four manufacturers in the country and are summarized in the Table below.
Table 3.2.2. Location and Capacity of Fertilizer Plants
Location Full Capacity (MT/yr) Operating Capacity (MT/yr) Leyte 1.2 million 800,000 Cebu 300,000 300,000 La Union 120,000 120,000 Batangas 100,000 Not operating
Source: Fertilizer Manufacturers and Importers Association Interview

JICA-MARINA The Study on Domestic Shipping Development Plan in the Philippines (DSDP) Final Report
3-26
-
500
1,000
1,500
2,000
2,500
1991 1992 1993 1994 1995 1996 1997 1998 1999 2000 2001 2002
'000
MT Production
ImportationSales
Breakbulk89%
Containerized8%Bulk
3%
Figure 3.2.28. Fertilizer Supply and Consumption
Source: Philippine Statistical Yearbook 2003
The general practice in transporting fertilizers is through bags. In the case of importers, fertilizer is imported in bulk, then bagged and distributed in bags. For larger shipments, the typical practice is to engage in voyage charter of a general cargo vessel. For cases wherein liners are available, fertilizer is transported in containers, especially when shipment volume is small.
Freight cost is about 30 pesos/50-kg bag while trucking cost is about 7 pesos/bag (from Cebu to Manila). When using conventional vessels, about 2~5% is lost due to spillage, but could be recovered and re-bagged. The price of fertilizer is about 600 pesos/bag.
Figure 3.2.29. Typical Fertilizer Logistics Chain
Figure 3.2.30. Shipping Modality of Fertilizer
Source: PPA 2002

JICA-MARINA The Study on Domestic Shipping Development Plan in the Philippines (DSDP)
Final Report
3-27
0
2,000
4,000
6,000
8,000
10,000
12,000
1990
19
92
1994
19
96
1998
20
0020
02
MT/
year Imports
Domestic Produce
5) Rice
Rice consumption has been growing steadily at an average rate of 2.9% p.a. from 1990 to 2003. Currently, rice consumption is about 9.7 million MT, of which Philippines imports about 9%. Primary producers of rice are Central Luzon, Cagayan Valley, Western Visayas, Ilocos region and Southern Tagalog.
Figure 3.2.31. National Palay Consumption
Source: Bureau of Agricultural Statistics
Figure 3.2.32. Regional Palay Production
Source: The Countryside in Figures, NSCB
Rice is typically transported in break-bulk in the form of 50-kg sacks. The National Food Authority (NFA) is the primary trader of rice, and accounts for about 10% of total supply. NFA is mandated to provide a benchmark, such that the price of rice will stabilize. NFA typically transports rice using chartered conventional cargo vessels. NFA buys palay at 10 pesos/kilo and retails ex-mill at about 15-16 pesos/kilo. Shipping of rice will cost of about 0.5 to 1.0 peso/kilo. Finally, NFA retails rice at about 18 pesos per kilo.

JICA-MARINA The Study on Domestic Shipping Development Plan in the Philippines (DSDP) Final Report
3-28
Breakbulk76%
Bulk5%
Containerized19%
0
5,000
10,000
15,000
20,000
25,000
30,000
1990
1991
1992
1993
1994
1995
1996
1997
1998
1999
2000
2001
2002
2003
P
Thou
sand
s
MT/
yr
Figure 3.2.33. Shipping Modality of Rice
Source: PPA 2002
Figure 3.2.34. Typical Rice Logistics Chain
6) Sugar
From 1990 to 2003, sugar cane production has not significantly increased but has fluctuated especially during the mid-1990s. Average refined sugar production is about 2.2 million MT per year.
Figure 3.2.35. National Sugar Cane Production
Source: Bureau of Agricultural Statistics
Table 3.2.3. Raw Sugar Production (MT)
Mill District Crop year ’04-’05 as of 31 Oct. 2004 Crop year ’03-’04 as of 02 Nov. 2003 Philippines 158,395 (100%) 164,788 (100%) Luzon 13,408 (8%) 11,639 (7%) Negros 140,497 (89%) 143,010 (87%) Panay 4,490 (3%) 5,497 (3%) Mindanao - 4,642 (3%)
Source: Sugar Regulatory Authority

JICA-MARINA The Study on Domestic Shipping Development Plan in the Philippines (DSDP)
Final Report
3-29
Breakbulk50%
Bulk3%
Containerized47%
Table 3.2.4. Refined Sugar Production (in 50 kg-Bag)
Refinery Crop year ’04-’05 as of 31 Oct. 2004 Crop year ’03-’04 as of 02 Nov. 2003 Philippines 1,661,890 (100%) 2,577,490 (100%) Luzon 603,309 (36%) 688,062 (27%) Negros 1,058,581 (64%) 1,561,782 (61%) E. Visayas - - Mindanao - 327,646 (13%)
Source: Sugar Regulatory Authority
Raw sugar is primarily transported in break bulk in 50-kg bags and refined sugar in containers. Raw sugar is bought at about 800 peso per bag, and refined for a fee of 170 peso per bag. Sugar is then retailed at a price of about 1,170 to 1,200 peso per bag.
Figure 3.2.36. Shipping Modality of Sugar
Source: PPA 2002
Figure 3.2.37. Typical Sugar Logistics Chain
7) Petroleum
Total petroleum product consumption is about 120 million barrels per year. Since 1997, total consumption has been steadily decreasing and this is largely due to the sharp decline in industrial fuel oil. On the other hand, total energy consumption in the Philippines has been increasing, which means that there is a shift in the choice of energy use in the country – most notably coal, geothermal, and gas.
There is also a shifting in terms of the mode of sourcing petroleum products. Importation of refined products is steadily increasing, while refinery output (i.e. domestic refining of imported crude) is decreasing. In fact a major company has converted its 75,000 bbl/day refining plant into an import depot.

JICA-MARINA The Study on Domestic Shipping Development Plan in the Philippines (DSDP) Final Report
3-30
-
10,000
20,000
30,000
40,000
50,000
60,000
1995 1996 1997 1998 1999 2000 2001 2002 2003
'000
bar
rels Refinery (Gasoline)
Imported (Gasoline)Refinery (Diesel Oil)Imported (Diesel Oil)Refinery (Fuel Oil)Imported (Fuel Oil)
The Philippines has very limited oil production, instead crude oil is imported and refined, or refined products are directly imported. The primary gateways or point of origin of petroleum products is thereby either an import depot or a refinery. By and large, the points of origin are located in the Bataan and Batangas areas in Luzon – as shown in Figure 3.2.40.
Figure 3.2.38. National Petroleum Consumption
Figure 3.2.39. Production of Key Petroleum Products by Source
Source: Department of Energy

JICA-MARINA The Study on Domestic Shipping Development Plan in the Philippines (DSDP)
Final Report
3-31
Price of Diesel at Selected Cities (1Q '04)
17.6
17.8
18.0
18.2
18.4
18.6
18.8
19.0
Manila Kalibo Iloilo Gen. San Davao
P/li
0
100
200
300
400
500
600
700
800
900
n. m
ile
Diesel PriceDistance from Source
Figure 3.2.40. Location of Import Depots and Refineries
Source: Presentation of Magsaysay/ NMC Group of Companies (16 Feb. 2005)
Typically, oil companies in the Philippines do not own or operate their own tankers; instead they would charter domestic vessels on a per voyage basis.
Taking that petroleum product originates from Luzon, and is distributed across the country, the price of petroleum products is higher in cities farthest from Luzon – this is shown in the following figure.
Figure 3.2.41. Price of Diesel at Selected Cities (1Q’04)
Import Depot
Refinery

JICA-MARINA The Study on Domestic Shipping Development Plan in the Philippines (DSDP) Final Report
3-32
3.2.2 Shippers and Forwarders Interview
It is recognized that shipping is for the purpose of meeting the needs of shippers: the “clients” of the industry. To account the concerns of shippers, a shippers and forwarders interview was conducted. The survey was conducted in the period of January up to March 2005. It covers stakeholders in 10 selected commodities, with 2 pre-selected inter-island corridors per commodity. The following is the result of the interview:
Table 3.2.5. Survey Coverage for Shippers and Forwarders Interview
Table 3.2.6. Ranking of the Requirements and Aspects of Transport Service
Ranking Perishables Non-Perishables Most Important-1 Cost Cost
2 Speed Reliability 3 Safety and Security Speed 4 Reliability Safety and Security
Least Important-5 Geographic coverage Geographic coverage
Commodity Corridor (origin-destination) Animal feeds Batangas – NCR
South Cotabato – NCR Cement Misamis Oriental – Bataan
Misamis Oriental – Iloilo Corn Misamis Oriental – Cebu
South Cotabato – NCR Fertilizer Iloilo – Negros Occidental
Batangas – NCR Fish Capiz – NCR
Misamis Occidental – Cebu Fruits and Vegetables Davao del Sur – NCR
South Cotabato – NCR Live Animals Misamis Oriental – NCR
South Cotabato – NCR Palay and Rice Iloilo – Cebu
South Cotabato – NCR Sugar Negros Occidental – NCR
Negros Occidental – Batangas Gen. Cargo NCR – Cebu
NCR – Davao del Sur

JICA-MARINA The Study on Domestic Shipping Development Plan in the Philippines (DSDP)
Final Report
3-33
Table 3.2.7. Comments of Shippers of Perishable Goods on Maritime Transport
Perishable Goods Empty backhauls increases unit cost of shipment. High cost of shipping and cargo handling High cost of reefer van shipment and live cargo shipment Port charges need to be more transparent
Cost
A cold storage operator commented on the high cost of electricity and old and inefficient systems that need replacement Ship schedules are unreliable – delays cause spoilage Poor ship maintenance cause delays in shipments Theft – 1-5% Poor handling cause spoilage Irresponsible shipping crew causing lost cargo
Reliability of Schedule and Service
Delays causing problems in shipment of live animals Lack of accessible ice plant for fish preservation Lack of vans Lack of vessels and service During peak season when there are many produce, service is not enough Unavailability of reefer vans Not enough hog vans Lack of berthing space
Service Availability
Limited number of shipping companies accept live hogs for shipment Fisher folks not trained to deal with frozen tuna Red tape and “SOP” A fish trader using the RoRo, commented on illegal fees levied along the nautical highway Filipinos do not appreciate value of frozen goods – and prefer or are indifferent of goods sold in the wet market
Others
Mortality due to improper cargo handling (1~2 per shipment)

JICA-MARINA The Study on Domestic Shipping Development Plan in the Philippines (DSDP) Final Report
3-34
Table 3.2.8. Comments of Shippers of Non-Perishable Goods on Maritime Transport
Non-Perishable High cost of cargo handling service High cost of shipping Very expensive to ship loose cargo (i.e.LCL) – very difficult for SME’s
Cost
The margin of profit for rice is very small, thereby reduction in transport cost, especially shipping is most desired Too much delays in scheduling Loading gears are very poorly maintained – primary cause of delays Crew do not properly follow safety standards Poor port operations, hinder improvements in shipping Booked vans will sometimes be off-loaded due to lack of space and priority of other cargoes. Some clients given preferential treatment and they get priority – causing cargoes to be off-loaded Poor cargo handling efficiency and delays in cargo handling Traffic in van withdrawal and lost van due to lack of a good system and manpower
Reliability of Schedule and Service
Need for a system to track loose cargoes Lack of domestic bulk carriers Lack of smaller, economical, vessels for small shipments – especially for 2,000~3,000 bags shipment. Most vessels are 10,000~20,000 bags capacity. Vessels are too old and un/loading equipment is very poor Poor sanitation of vans and vessels Lack of reefer vans Lack of equipment in government ports (e.g. conveyor belts for handling grains) Petroleum companies complain of the lack of tankers
Service Availability
Many vessels are very old (70% are over 25 years old) Pulupandan port has limited depth and could not accommodate larger vessels. Lack of improvement in port facilities. Use of hooks to load cargo causing damage to sacks Shallow depth of ports Red tape and corruption Lack of port space causes pier congestion which results to delay. 8am-5pm unloading operation of ports must be extended to 24 hour operation
Others
Theft and spillage
In the issue of high shipping cost, Table 3.2.9 shows the increased in shipping cost in the last five years.
Table 3.2.9. Comments of Shippers on Shipping Cost Increments
/Note: 1 In year 1998 Arrastre increased 12% and Stevedoring 40%
The survey also gathered the shippers’ request or opinion on how to improve shipping company’s service which is listed below:
• Shipping lines prioritize door-to-door over pier-to-pier. It should be on a first-come-first-serve basis.
• It is very hard to send loose cargoes because of a very high rate imposed
Shipping Cargo Handling/1 Trucking +20% (2000) +6% (2002) +6% (2003) +7.5% (2003) +9% (2004) +5.5% (2005) +67% (‘00~’05)
+10% (2000) +10% (2001) +21% (‘00~’05)
+10% (2000) + 20% (2004) +32% (2000-2005)
JICA-MARINA The Study on Domestic Shipping Development Plan in the Philippines (DSDP)
Final Report
3-35
compared to containerized cargoes. Consideration should be given to the medium sized entrepreneurs that cannot always afford to reserve or pay container vans.
• Lower rates.
• Increase load capacity of the container vans ( from 18 to 22 tons)
• Reconditioning the ships & facilities like crane & storage deck, and container vans
• Implement a more efficient way of cargo handling
• Inform all on ahead of time on delays/ problems.
• To have on-line booking/reservations thereby eliminating or minimizing red tape.
• Unloading should not be restricted to just 8 am to 5 pm. It should be a 24-hr operation.
• Improve the cargo monitoring system for faster information relay and develop the system of information of cargo whereabouts.
• Prioritize perishables.
• Increase the number of vans allocated for cattle and hogs.
• If the cargo is initially accepted and cannot be accommodated, they should at least facilitate its transfer to another ship of their own company without an added cost.
• Stop corruption. Those who suffer are the truck drivers who pay for the “lagay” and cannot reimburse them.
• Cater a schedule that can accommodate peak season demands.
• Vessels should be extremely clean.
• Hatch of ship should have tarpaulin to protect cargo.
The following are the highlights of the interview results:
• Almost all shippers considered shipping and cargo handling cost too high and unreasonable.
• Mindanao shippers complain for lack of service – especially during peak season. The coverage of service is also desired to be increased.
• Irregular and corrupt practices are causing high cost of shipment.
• Pilferage is estimated to be as high as 5%.
• Lack of vessels and lack of appropriate vessels
• Delays in vessel scheduling needs to be addressed. – causes spoilage.
• Insufficient vans including reefer vans.
• Perishable goods traders complain on cargo handling, in terms of efficiency and in terms of ensuring minimal spoilage.
• There are many complaints regarding booked cargoes being left behind.
• Port conditions are very poor – lack of equipment, security, shallow depth and port space.
• Small consignment cargo is very expensive.

JICA-MARINA The Study on Domestic Shipping Development Plan in the Philippines (DSDP) Final Report
3-36
3.2.3 Truckers Interview
Truckers are key players in the total logistics chain, thus the truckers interview was conducted in Luzon and in Mindanao. More than 20 trucking companies were interviewed in the period of January to March 2005. Table 3.2.10 and Table 3.2.11 show the profile of trucking companies from Luzon and Mindanao and truckers’ opinions and views affecting their service and their linkages to the shipping industry.
Table 3.2.10. Profile of Surveyed Truckers
Luzon Mindanao Truck units Companies 1-5 units 20% 27% 6-20 units 50% 55% above 21 30% 18% Rented Trucks Companies none 100% 86% Age of trucks Truck units 0-5 yrs 17% 3% 6-15 yrs 13% 66% above 16 1% 17% Type of Trucks Truck units Articulated truck 11% 52%
Reefer Van 42% -- Container van only 21% -- 3 axle or more 21% 17%
Tank Lorry truck and Trailer -- 9%
Cargo carried Companies Own 10% 43% 3rd party 90% 64%

JICA-MARINA The Study on Domestic Shipping Development Plan in the Philippines (DSDP)
Final Report
3-37
Table 3.2.11. Truckers Opinion and Views on Shipping
ASPECT Luzon Truckers Mindanao Truckers Road Infrastructure
• Poor traffic conditions • Low electrical wires pose as road
hazards • Poor road condition especially after
NLEX and SLEX • Narrow streets/roads • High cost of towing services
• Poor traffic condition • Roads from Butuan to Agusan and from
Surigao to Agusan are in poor condition • Portions of Gensan-Davao road w/c are
prone to landslide delaying our delivery/poor road condition affecting our units
• Narrow streets/roads • Un-cemented farm roads making it
impassable to trucks Port Infrastructure
• Congestion/ narrow roads leading to port
• Poor lighting • Lack of loading/ unloading
equipment causing delays
• Congestion delays unloading of trucks. • Lifting equipment is limited to 50 tons only,
insufficient heavy equipment • Classification of cargo - advolorem should be
line meter • Plug in facilities for reefer vans in shipping
lines and shipping container yard • Provision of refueling facilities • Wider berthing space. • SCIPCI/PPA should provide better service • Poor sanitation due to shipment of live
animals Government Regulations
• Unavailability of cheap financing (loan facility)
• Very high toll fee increase • Speed limit restriction and truck ban
(5 am to 9 am) delays delivery • High diesel prices increase cost of
trucking • Delays caused by Corruption of LTO • MMDA implementing tonnage
limitation of containers passing through MacArthur Highway
• LTO corruption • BIR corruption • High price increase of fuel and lubricants • Too much tax, every municipality has their
own policy upon entry. • Unnecessary fees for clearances • Obsolete rules and regulations • No actual weighing yet there is a weighing fee
in your bill of loading.
Overall Logistics Management
• Worsening traffic situation delays shipment
• Red tape • Lack of equipment
• High risk and high capital but low return • Financial capacity to improve and modernize
equipment.
Linkages with Shipping Service
• High shipping rates • Early closing time of shipping lines • Corruption
• Schedules should be followed strictly to follow standardization
RoRo service • Convenient only for small trucks
• No specific floater insurance coverage • OK, for general cargoes except for livestock
because not all vessels accept livestock cargoes.
Others • High membership sticker cost • Damaged products/ Poor handling
3.3 Shipbuilding and Repairing Industry
3.3.1 Shipyard in the Philippines
(1) MARINA REGISTERED SHIPYARDS
Maritime Industry Authority (MARINA) is in charge of the implementation of maritime industry development program, and also the accreditation of marine surveyors and maritime enterprises engaged in shipbuilding, ship repairing and ship breaking.
Table 3.3.1 shows the latest list of firms in the Philippines licensed by MARINA and

JICA-MARINA The Study on Domestic Shipping Development Plan in the Philippines (DSDP) Final Report
3-38
further analysis of the list of shipbuilder and repairer reveals that:
• Majority of shipyards are small scale
• Number of large/medium-scale shipyards have not changed much.
Table 3.3.1. MARINA Licensed Shipbuilding and Repairing Firms, 1999-2003
Category 1999 2000- 2001 2002 2003 Average %
Large shipyards 11 9 9 9 9.5 9.7Medium shipyard 16 14 14 13 14 14.6Small shipyards 73 90 49 84 74 75.7Total 100 113 72 106 97.75 100.0
Source: MARINA
Table 3.3.2. MARINA Licensed Shipbuilding and Repair Firms
Category Luzon Visayas Mindanao Total % Large shipyards 3 5 1 9 8.5Medium shipyards 6 4 3 13 12.3Small shipyards 44 17 23 84 79.2Total 53 26 27 106 % Distribution 50.0 24.5 25.5 100.0 100.0
Source: MARINA Note: Data as of De.31, 2003
(2) SHIPYARD SURVEYS
The Study Team conducted an investigation and interview survey at 15 shipyards (refer to Table 3.3.3). Several of them are outlined in Table 3.3.4 and it can be pointed out that most of them are engaged primarily in ship repair work to maintain the shipyard management despite of their installed facilities and equipments for new shipbuilding works. As a result, very few shipyards are concentrated in new shipbuilding business.
Table 3.3.3. Profile of Surveyed Domestic Shipyards
List of shipyards Region Category Keppel Batangas Shipyard Batangas Large Phil. Iron Construction & Marine Cagayan de Oro Large Keppel Cebu Shipyard, Inc Cebu Large Sandoval Shipyard Cebu Large Tsuneishi Heavy Industries (Cebu) Cebu Large Herma Shipyard NCR Large Colorado Shipyard Corp Cebu Medium Santiago Shipyard & Shipbuilding Cebu Medium Dansyco Marine Works & Shipbuilding Corp NCR Medium Elfa Shipyard Corp NCR Medium Neptuna Shipyard Corp NCR Medium R< Shipyard & Realty Development Corp NCR Medium Ultra Shipyard Corp NCR Medium Fortuna Shipworks Inc NCR Medium Josefa Slipways Inc NCR Medium
Note: The survey period is from December 2004 to March 2005

JICA-MARINA The Study on Domestic Shipping Development Plan in the Philippines (DSDP)
Final Report
3-39
• Phil. Iron Construction & Marine Works, Inc. The company is categorized as a large shipyard; however, it is pre-occupied with repairing works. Although, the yard has a synchrolift capacity of 1,500 tons for new shipbuilding, it may face a series of difficulties in drawing, facility and management system when getting a new building order.
• R< Shipyard & Reality Development Corp The company is classified as a medium category shipyard and concentrates on repair works. Existing facilities such as track crane needs to be improved and the working space beside the building/repairing berth is too narrow compromising safety and efficiency. Although, it has shipbuilding records in the past, it is questionable if the yard can organize itself and do a drastic shift in new shipbuilding for a short period.
• Dansyco Marine Works & Shipbuilding Corp The shipyard falls under the medium category but already experienced delivering a 5,000 DWT tanker in the past. However, the construction method used in that tanker may be different from the one used at present. Today, the yard receives ship repairing and ship conversion orders and the president has established a reputation as an experienced ship conversion designer. Besides drawing and other technical performance, the yard has identified many facility and management related problems.
• Elfa Shipyard Corp A medium-scale shipyard that mainly caters to repair works and occasional ship conversion. Records show no shipbuilding done in recent five years. There are two berths in a sufficiently confined space. On the survey day, the yard was active with well performing equipments.
• Ultra Shipyard Corp It is a medium-scale shipyard presently doing ship repairs. Although, there are two building/ repairing berths, it seems that berth occupancy is not high. The yard needs more safety awareness to manage its narrow and small working space. Due to site limitation, it would be difficult to expand its business scope to new shipbuilding.
• Neptuna Shipyard Corp The shipyard falls under the category of medium shipyards. The yard has done mostly ship repairing. On the survey day, no ship was docked so the Study Team cannot comment on operational issues.
• Herma Shipyard This is a large-scale shipyard with a graving dock capable of accommodating a 35,000 DWT vessel. Currently, the yard devotes most of its works on ship repairing. Although facilities and equipments are outdated, the company will be able to show good shipbuilding performance by reorganizing the large yard site through modern and efficient ways.
• Keppel Batangas Shipyard It is a large-scale shipyard with 80% of its operation is dedicated to ship repairing and 20% in new shipbuilding. The yard is located in a large site with a large synchrolift capacity of 2,000 tons which enables efficient repairing in dock. This yard has the most potential when the country decides to promote domestic shipbuilding. The yard shows a large dependency on Keppel Singapore in terms of ship design, material procurement and workers’ training.

JICA-MARINA The Study on Domestic Shipping Development Plan in the Philippines (DSDP) Final Report
3-40
• Keppel Cebu Shipyard, Inc. Under the same Keppel Group as Keppel Batangas, it also falls into large-scale category. Current works are ship repairs and conversions. Like Keppel Batangas, the yard is capable of expanding its operation to new shipbuilding due to site spaciousness. However, it must reinforce its facilities and technical staff.
• Colorado Shipyard Corp It is a medium-scale shipyard serving mainly for ship repairing. According to the interview with the yard owner, the yard is expanding its business scope to include new shipbuilding. It is observed that the site is large enough but financial and designing capabilities are not sufficient. In fact, the yard is looking for second-hand facilities and equipments.
• Santiago Shipyard & Shipbuilding Corp. The shipyard falls under the category of medium shipyards. Although it was not confirmed by a yard manager, the Study Team observed that the yard was installing facilities and equipments for new shipbuilding.
• Sandoval Shipyard It is a large-scale shipyard with two docks. The yard once concentrated on new shipbuilding. For example, the yard built a 4,500 DWT tanker based on the drawings supplied by a Singaporean naval architect. Taking the existing facilities and technical staff into account, it is difficult to receive a new ship order without external support.
• Tsuneishi Heavy Industry (Cebu), Inc. This large-scale shipyard was developed exclusively for new shipbuilding. Presently, the yard is constructing a series of the 52-type bulk carriers. Basic ship designs are done in the HQ in Japan and afterwards, the yard is responsible for the rest of the works with its subsidiary naval architecture office.
The yard facilities and equipments satisfied the international standards in terms of capability and layout. The yard has recently installed a new dock with two track cranes so that the large block construction method is applicable. It is questionable whether the yard can build domestic shipping vessels efficiently and cost effectively at such large docks and facilities. The yard manager explained that one floating dock would be rearranged to build domestic vessels whenever necessary. However, some problems may arise including uncoordinated divisions of works and its workers, and no suitable crane available and thus, it will take a longer construction period.
• Fortune Shipworks Inc The medium-category shipyard commenced operation in 2003. So far, the yard provides only ship repairing services but it holds a business plan to participate in new shipbuilding business. However, the Study Team observed that the site was small and no drawing capability was found.
• Josefa Slipways, Inc. Previously named Ultra Shipyard due to change in ownership, the company is a medium-scale shipyard. The yard is now under rehabilitation and the Study Team was informed that they have a new order of a 15-meter tugboat. After rehabilitation, the yard will be able to deliver such small ships.
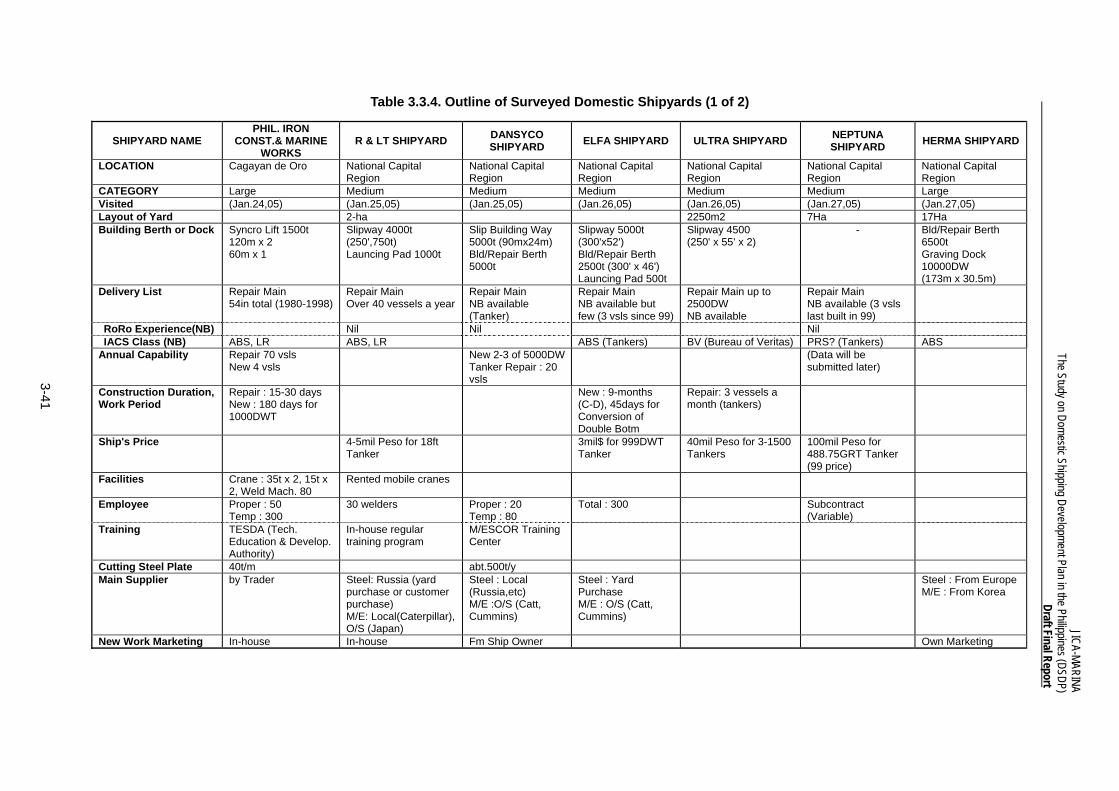
3-41
JICA-MARINA The Study on Domestic Shipping Development Plan in the Philippines (DSDP)
Draft Final Report
Table 3.3.4. Outline of Surveyed Domestic Shipyards (1 of 2)
SHIPYARD NAME PHIL. IRON
CONST.& MARINE WORKS
R & LT SHIPYARD DANSYCO SHIPYARD ELFA SHIPYARD ULTRA SHIPYARD NEPTUNA
SHIPYARD HERMA SHIPYARD
LOCATION Cagayan de Oro National Capital Region
National Capital Region
National Capital Region
National Capital Region
National Capital Region
National Capital Region
CATEGORY Large Medium Medium Medium Medium Medium Large Visited (Jan.24,05) (Jan.25,05) (Jan.25,05) (Jan.26,05) (Jan.26,05) (Jan.27,05) (Jan.27,05) Layout of Yard 2-ha 2250m2 7Ha 17Ha Building Berth or Dock Syncro Lift 1500t
120m x 2 60m x 1
Slipway 4000t (250',750t) Launcing Pad 1000t
Slip Building Way 5000t (90mx24m) Bld/Repair Berth 5000t
Slipway 5000t (300'x52') Bld/Repair Berth 2500t (300' x 46') Launcing Pad 500t
Slipway 4500 (250' x 55' x 2)
- Bld/Repair Berth 6500t Graving Dock 10000DW (173m x 30.5m)
Delivery List Repair Main 54in total (1980-1998)
Repair Main Over 40 vessels a year
Repair Main NB available (Tanker)
Repair Main NB available but few (3 vsls since 99)
Repair Main up to 2500DW NB available
Repair Main NB available (3 vsls last built in 99)
RoRo Experience(NB) Nil Nil Nil IACS Class (NB) ABS, LR ABS, LR ABS (Tankers) BV (Bureau of Veritas) PRS? (Tankers) ABS
Annual Capability Repair 70 vsls New 4 vsls
New 2-3 of 5000DW Tanker Repair : 20 vsls
(Data will be submitted later)
Construction Duration, Work Period
Repair : 15-30 days New : 180 days for 1000DWT
New : 9-months (C-D), 45days for Conversion of Double Botm
Repair: 3 vessels a month (tankers)
Ship's Price 4-5mil Peso for 18ft Tanker
3mil$ for 999DWT Tanker
40mil Peso for 3-1500 Tankers
100mil Peso for 488.75GRT Tanker (99 price)
Facilities Crane : 35t x 2, 15t x 2, Weld Mach. 80
Rented mobile cranes
Employee Proper : 50 Temp : 300
30 welders Proper : 20 Temp : 80
Total : 300 Subcontract (Variable)
Training TESDA (Tech. Education & Develop. Authority)
In-house regular training program
M/ESCOR Training Center
Cutting Steel Plate 40t/m abt.500t/y Main Supplier by Trader Steel: Russia (yard
purchase or customer purchase) M/E: Local(Caterpillar), O/S (Japan)
Steel : Local (Russia,etc) M/E :O/S (Catt, Cummins)
Steel : Yard Purchase M/E : O/S (Catt, Cummins)
Steel : From Europe M/E : From Korea
New Work Marketing In-house In-house Fm Ship Owner Own Marketing

3-42
JICA-MARINA The Study on Domestic Shipping Development Plan in the Philippines (DSDP) Draft Final Report
Table 3.3.4. Outline of Surveyed Domestic Shipyards (2 of 2)
SHIPYARD NAME SEAFRONT SHIPYARD
KEPPEL BATANGAS SHIPYARD
KEPPEL CEBU SHIPYARD, INC.
SANDOVAL SHIPYARD
TSUNEISHI HEAVY INDUSTRIES (CEBU)
COLORADO SHIPYARD
SANTIAGO SHIPYARD &
SHIPBUILDING LOCATION National
Capital Region Batangas Cebu Cebu Cebu Cebu Cebu
CATEGORY - Large Large Large Large Medium Medium Visited (Jan.27,05) (Feb. 9, 05) ( Mar. 1, 05) (Mar. 2, 05) (Mar, 3, 05) (Mar, 2, 05) ( Mar, 2, 05) Layout of Yard New shipyard 107,400m2 60,000 & 65,000m2 6.13Ha Building Berth or Dock - Graving Dock
200x38m Floating Dock 100x19m Synchrolift 172x28m Berth 167x27m, 172x27m, 100x20m
Graving Dock 210x30m Slipway 105x10.4m, 73x7.9m, 43x3.09m Launching way 100x8m
Berth 100x 17m Slipway 100x 12m
Berth 200x34m-2 Floating Dock
128x23.3m 139.5x24m
Slipway 1-1,500DWT 1-1,000DWT
1-500DWT
Dry dock 48x14m 75x22m
Berth under construction
Delivery List Repair 80%, New 20% About 20 vessels a year
Repair Main 78 vessels in 2004
Repair main, about 20 vessels in 2004
Repair main, 6-12 repair vsls/month
Repair main 31 repair vsls in 2004
RoRo Experience(NB) Nil Nil Nil Nil Nil Nil IACS Class (NB) ABS ABS NK, ABS, LRS
Annual Capability New building 52BCx7 per year
Construction Duration, Work Period
About 10 days for dock services
3 days to 1 month 7-10 days for dry dock
Ship's Price Facilities Crane: 20-100t mobile
10-50t traveling Crane: 20, 25t luffing 55,29,50t crawler 30,16,7t traveling
Crane: 50, 30t Weld machine 30 Tug boat 150ps
Crane: Jib 50t-2, 200t-2 Gantry 100t-1
Crane:crawler 100,60,55,45,30t Tug boat 750ps
Crane: crawler 30t Truck 25t Welding machine 12
Employee Regular 9 Regular 3,500 40-60 workers Regular 22 Training Singapore center Singapore center TESDA Cutting Steel Plate About 6,000t/month 5-20t/month Main Supplier Steel: UK
M/E: Caterpillar Ordered by Japan side Local hardware store Local supplier
New Work Marketing Singapore center Singapore center Japan side

JICA-MARINA The Study on Domestic Shipping Development Plan in the Philippines (DSDP)
Final Report
3-43
Figure 3.3.1. Shipyard Surveys
Painting Works at Elfa Shipyard
Herma Shipyard’s Graving Dock Sand Blasting Equipment
Slipway of Newly Built Seafront Shipyard
Bending Machine
Converting an Imported Vessel from Japan
Mobile Crane at Dansyco Shipyard
Interview with Shipyard Managers

JICA-MARINA The Study on Domestic Shipping Development Plan in the Philippines (DSDP) Final Report
3-44
3.3.2 Shipbuilding Facility, Capability and Achievement
As mentioned in 3.3.1, shipbuilding facilities are not fully utilized for new building, but rather concentrates on ship repairing. This is attributed to the low demand for new buildings for the past few years.
Table 3.3.5, shows the profile of shipyard facilities commonly used for new building and ship repair and number of this facility shows comparatively in large figures. Facility profile in 2002 and 2003 is shown in Table 3.3.6.
Table 3.3.5. Profile of Shipyard Facilities by Region, 2003
Luzon Visayas Mindanao Total
Category No
Total building capacity in DWT
No Total
building capacity in DWT
No Total
building capacity in DWT
No
Total building capacity in DWT
Marine railway - Slipway 33 65,600 15 104,650 16 18,025 64 188,275- Buildingway 10 34,950 2 9,500 7 1,410 19 45,860- Building/ repair berth 25 805,150 3 10,500 1 300 29 815,950
Launching pad 14 30,949 11 11,000 3 1,175 28 43,124Graving dock 3 390,000 2 36,000 - - 5 426,000Floating dock 4 36,150 2 17,000 3 4,165 9 57,315Lift dock 2 20,500 - - 1 1,500 3 22,000Total 91 1,383,299 35 188,650 31 26,575 157 1,598,524Source: MARINA
Table 3.3.6. Profile of Shipyard Facilities, 2002 & 2003
2002 2003 Category
No Total building
capacity in DWT No
Total building capacity in DWT
Marine railway -Slipway 98 161,000 64 188,275-Building way 32 40,490 19 45,860-Building/repair berth 52 123,100 29 815,950Launching pad 22 36,820 28 43,124Graving dock 5 394,500 5 426,000Floating dock 9 29,100 9 57,315Lift dock 3 9,500 3 22,000Total 221 794,510 157 1,598,524Source: MARINA
Table 3.3.7 shows the nine large shipyards in the Philippines, and the total building/dry docking capacities of 242,600 DWT (15.2%) in the country. Five large shipyards are joint ventures with foreign shipbuilding and ship repair companies, which are Keppel group with 3 shipyards, Tsuneishi and FBMA.

JICA-MARINA The Study on Domestic Shipping Development Plan in the Philippines (DSDP)
Final Report
3-45
Table 3.3.7. Profile of Large Shipyards in the Philippines
Name of company Location Facility Total capacity % Share
Keppel Batangas Luzon LD,FD,GD,RB 97,100 40.0 Tsuneishi Heavy Industry Visayas SW,FD 65,500 27.0 Subic Shipping & Eng Luzon GD 34,000 14.0 Keppel Cebu Shipyard Visayas SW,GD 11,000 4.5 Sandoval Shipyard Visayas SW,SBW,RB,LP 11,000 4.5 FBMA Babcock Matine Visayas SW,SBW,RB 10,500 4.3 Herma Shipping Luzon GD 10,000 4.1 Navotas Industrial Corp Luzon SW 2,000 0.8 Phil Iron Construction Mindanao LD 1,500 0.6 Total 242,600 100 Source: MARINA Note: Data as of Dec. 31, 2003
LD: Lifting Dock RB: Repair Berth SBW: Shipbuilding Way FD: Floating Dock SW: Slip Way GD: Graving Dock LP: Launching Pad
As for achievement, Table 3.3.8 and Figure 3.3.2 shows the locally constructed vessels for the past five years and Table 3.3.9 shows the total gross tonnage for each type of ship. It reveals that fishing boats and bancas are the majority of constructed vessels, and this is a predictable result since majority of shipbuilders are small shipyards.
Table 3.3.8. Number of Locally Constructed Vessels for Domestic Use
Type of Ships 1999 2000- 2001 2002 2003 Total %
Share Fishing Boat 396 96 148 256 896 55.9 Banca - 46 170 99 315 19.6 Passenger ferry 36 13 2 84 135 8.4 Pleasure yacht 11 - - 92 103 6.4 Barge 3 1 4 57 65 4.1 General Cargo 3 7 20 19 49 3.1 Patrol Boat 10 5 1 - 16 1.0 Speedboat/Sports Craft 8 - - 1 9 0.6 Tugboat 2 1 3 - 6 0.4 Landing Craft Trans 4 - - - 4 0.3 Others - - 2 1 3 0.2 Tanker 1 - 1 - 2 0.1 Landing Craft Mech - - - 1 1 0.1 Total 474 169 351 610 1,604 100.0
Source: MARINA
Figure 3.3.2. Number of Locally Constructed Vessels for Domestic Use, 1999-2003
Source: MARINA

JICA-MARINA The Study on Domestic Shipping Development Plan in the Philippines (DSDP) Final Report
3-46
Table 3.3.9. Capacity (GT) of Locally Constructed Vessels for Domestic Use
Type of ships 1999 2000- 2001 2002 2003 Total %
Share Fishing Boat 6,425 2,261 5,917 4,203 18,808 34.5Barge 1,421 1,982 3,312 7,242 13,959 25.6General Cargo 4,525 958 1,245 219 6,948 12.7Tanker 660 - 4,500 - 5,160 9.5Banca - - 2,116 985 3,102 5.7Passenger Ferry 492 770 101 887 2,252 4.1Patrol Boat 109 10 1,500 - 1,619 3.0Landing Craft Trans 1,513 - - - 1,513 2.8Pleasure Yacht 492 - - 376 868 1.6Tugboat 117 3 63 - 184 0.3Landing Craft Mech - - - 60 60 0.1Others - - 5 49 53 0.1Speedboat/Sports Craft 27 - - 5 32 0.1Total 15,784 5,986 18,762 14,762 54,564 100.0Source: MARINA
Table 3.3.10 and Table 3.3.11 are useful to understand the general trend of vessels built here for export. Vessel type is focused on the bulk carrier but the demand is low.
Table 3.3.10. No. of Locally Constructed Vessels for Export
Type of ships 1999 2000-2001 2002 2003 Total Passenger Ferry 1 1 - - 2 Bulk Carrier 4 5 7 12 28 Total 5 6 7 12 30 Source: MARINA
Table 3.3.11. Capacity (GT) of Locally Constructed Vessels for Export
Type of ships 1999 2000-2001 2002 2003 Total Passenger ferry 660 374 - - 1,034Bulk carrier 82,200 115,400 212,800 364,800 775,200Total 82,860 115,774 212,800 364,800 776,234
Source: MARINA
As a common feature in many shipyards, it is concluded that facilities were not arranged for new ship building work exclusively and are deemed as compromised with ship repair work. This might be the result of practicality to meet both new building and/or repair work requirements.
In the interview with ship yard personnel, it was found out that the low demand for new building has been the same for the past few years. Ship building activities have been limited to barges, fishing boats and other less sophisticated vessels for domestic use.
It was noticed that shipyard facilities have some irregularities in the following items:
• Generally, shipyard area is comparatively narrow for building the steel blocks or other equipment.
• There are no traveling cranes alongside the building berth. Instead of that, mobile truck cranes are employed for the same purpose.
• Steel blocks are considered to be transported within the shipyard area by truck trailers, not by jack-up carrier.
• Advanced outfitting system is not applied.

JICA-MARINA The Study on Domestic Shipping Development Plan in the Philippines (DSDP)
Final Report
3-47
• Floating crane is usually employed for outfitting alongside quay, not by traveling crane.
3.3.3 Ship Repairing Facility, Capability and Achievement
It was found that ship repair activity is the predominant industry in the country, as observed in actual works on the slip way in many shipyards.
Table 3.3.12 and 3.3.13 show the number of domestic ships and gross tonnage by type of ship drydocked/ repaired. It reveals that repair/ dry-docking of fishing vessels, passenger ferries and cargo vessels are the main activities for this industry.
Table 3.3.14 and Table 3.3.15 are the summary of foreign ships locally repaired in the country and gross tonnage by the type of ships.
Although the number of the vessels is smaller than the domestic vessels, the total gross tonnage is far bigger than the domestic ones. This only means that shipyards received the large sized vessels such as bulk carrier, general cargo or container ship.
Table 3.3.12. No. of Domestic Ships Dry-docked/Repaired
Type of ships 1999 2000- 2001 2002 2003 Total % Share
Fishing boat 289 159 367 175 987 31.7 Passenger ferry 219 150 145 176 690 22.2 General cargo 185 131 154 128 598 19.2 Tugboats 54 33 97 81 265 8.5 Barge 68 56 60 60 244 7.8 Tanker 46 29 21 96 192 6.2 Others - 34 30 4 68 2.2 Patrol boats - - - 35 35 1.1 Container ship 7 4 5 9 25 0.8 Bulk carrier 4 1 - - 5 0.2 Pleasure Yacht - - - 3 3 0.1 Livestock carrier - 1 - - 1 0.0 Total 869 598 879 767 3,113 100.0 Source: MARINA
Figure 3.3.3. Number of Domestic Ships Dry-docked/Repaired, 1999-2003
Source: MARINA

JICA-MARINA The Study on Domestic Shipping Development Plan in the Philippines (DSDP) Final Report
3-48
Table 3.3.13. Capacity of Domestic Ships Dry-docked/Repaired, 1999-2003 (GT)
Type of ships 1999 2000- 2001 2002 2003 Total %
Share Passenger ferry 248,809 213,420 204,576 433,336 1,100,142 42.1General cargo 158,715 175,932 105,994 182,569 623,211 23.9Barge 98,945 42,347 57,177 43,594 242,074 9.3Tanker 60,948 32,043 21,716 123,821 238,530 9.1Fishing boat 55,208 41,744 44,064 32,645 173,662 6.7Container ship 17,007 17,532 18,435 56,850 109,827 4.2Others - 13,706 24,829 28,557 67,092 2.6Tug boat 13,167 7,083 12,703 9,778 42,732 1.6Bulk carrier 12,364 892 - - 13,257 0.5Livestock carrier - 1,259 - - 1,259 0.1Pleasure Yacht - - - 902 902 0.0Total 665,165 545,963 489,498 912,056 2,612,682 100.0Source: MARINA
Table 3.3.14. Number of Foreign Ships Dry-docked/Repaired, 1999-2003
Type of ship 1999 2000 -2001 2002 2003 Total %
Distribution Bulk carrier 42 37 42 43 164 33.3 General cargo 33 31 40 31 135 27.4 Container ship 8 9 16 7 40 8.1 Fishing boat 2 1 13 15 31 6.3 Tanker 5 5 14 5 29 5.9 Reefer ship 2 3 14 4 23 4.7 Others - 6 8 - 14 2.9 Barges 8 2 - 3 13 2.6 Tugboat - 2 3 7 12 2.4 Product carrier 5 2 1 0 7 1.6 Passenger ferry 1 4 2 0 7 1.4 Log carrier 2 - 2 3 7 1.4 Live stock carrier 3 2 1 - 6 1.2 Ore carrier 1 1 - - 2 0.4 Car carrier 1 - - - 1 0.2 Total 113 105 156 118 492 100.0 Source: MARINA
Figure 3.3.4. Number of Foreign Ships Dry-docked/Repaired, 1999-2003
Source: MARINA

JICA-MARINA The Study on Domestic Shipping Development Plan in the Philippines (DSDP)
Final Report
3-49
Table 3.3.15. Capacity of Foreign Ships Dry-docked/Repaired, 1999-2003 (GT)
Type of ship 1999 2000 -2001 2002 2003 Total
Bulk carrier 1,976,667 1,997,063 2,395,605 2,085,557 8,454,893General cargo 273,821 227,932 197,204 155,064 854,022Container ship 81,575 146,030 240,948 136,684 605,237Tanker 29,335 17,310 97,365 107,072 251,082Reefer ship 10,969 14,280 95,455 23,649 144,353Others 5,885 33,427 98,875 - 138,187Ore carrier 102,395 25,169 - - 127,564Log carrier 9,033 - 30,897 58,528 98,458Fishing boat 1,995 1,277 6,380 65,882 75,534Product carrier 31,019 33,441 4,182 - 68,642Barge 18,257 5,146 - 5,004 28,408Passenger ferry 325 12,245 807 - 13,377Livestock carrier 4,194 2,059 1,259 - 7,513Tugboat - 1,328 1,205 2,157 4,691Car carrier 1,321 - - - 1,321Total 2,546,792 2,516,710 3,170,183 2,639,599 10,873,286Source: MARINA
In order to operate the ship repair work effectively, it is essential to secure the timely delivery of necessary equipments and parts and necessary man power.
No particular complaints on that point were raised by the shipyard personnel during the interview. Therefore, arrangements of procurement may be going well. Establishment of procurement system is indispensable for future business, such as the preparation of manufacturer’s stationary warehouse, stockyard of spare parts and reliable special trading company.


