Page 1
5/26/2014
1
Future of Quality Control –Evidence Based QC
Scott LesherDirector, Technical Support Services
June 2014
Copyright © 2013 by Sysmex America, Inc. All rights reserved.
1
Agenda
• The Repeat Issue
• Chasing Zero Bias
• What is Six Sigma
• Evidence Based Control Limits
• Customer Feedback
• Laboratory Benefits
• Additional Information
Copyright © 2013 by Sysmex America, Inc. All rights reserved.
2
Page 2
5/26/2014
2
The Repeat Issue
© 2013 Sysmex America, Inc. All rights reserved.
The Repeat Issue
© 2013 Sysmex America, Inc. All rights reserved.
• Incorrect control limits cause– Desensitizing lab staff to true out-of-control
errors• False alarms (cry wolf)
– Repeat controls when out-of-limits• Becomes a repeat, repeat, open new vial, repeat
• Practice becomes testing controls not the analyzer
– Higher QC expense, reduced lab productivity • Stress to laboratory staff (anxiety running controls)
• Repeating controls, documentation, increased TAT, review of past samples
Page 3
5/26/2014
3
CAP Q-Probe QC Practices
• 95% of labs repeat same vial when control is out-of-range– Changes a 13SD rule to 23SD or even 33SD
• Complex multirules yield no observed benefit
• Recommend simplifying QC system
• Study from 1994
Copyright © 2013 by Sysmex America, Inc. All rights reserved.
5
Balanced Control Limits
• Control limits must be appropriately sensitive – such that significant accuracy changes are
always detected.
• Recalibration is not required for minor accuracy variations of no clinical consequence. – In other words, there should be a high
probability for error detection and a low probability for false rejection.
Copyright © 2013 by Sysmex America, Inc. All rights reserved.
6
Page 4
5/26/2014
4
Chasing Zero Bias
Copyright © 2013 by Sysmex America, Inc. All rights reserved.
7
.06 (1012/L)
.14 (1012/L)
• RBC– Mean 4.30 (1012/L)
– CV = 1%
– 2SDI = .06 (1012/L)
– 1SD = .6%
Overall Patient Range Increased Chasing 0 Bias
What is Six Sigma?
Performance Goal (TEa)
6 Sigma Quality = 3 DPM0% out-of-range
1 Sigma Quality = 691,462 DPM69% out-of-range
8
Page 5
5/26/2014
5
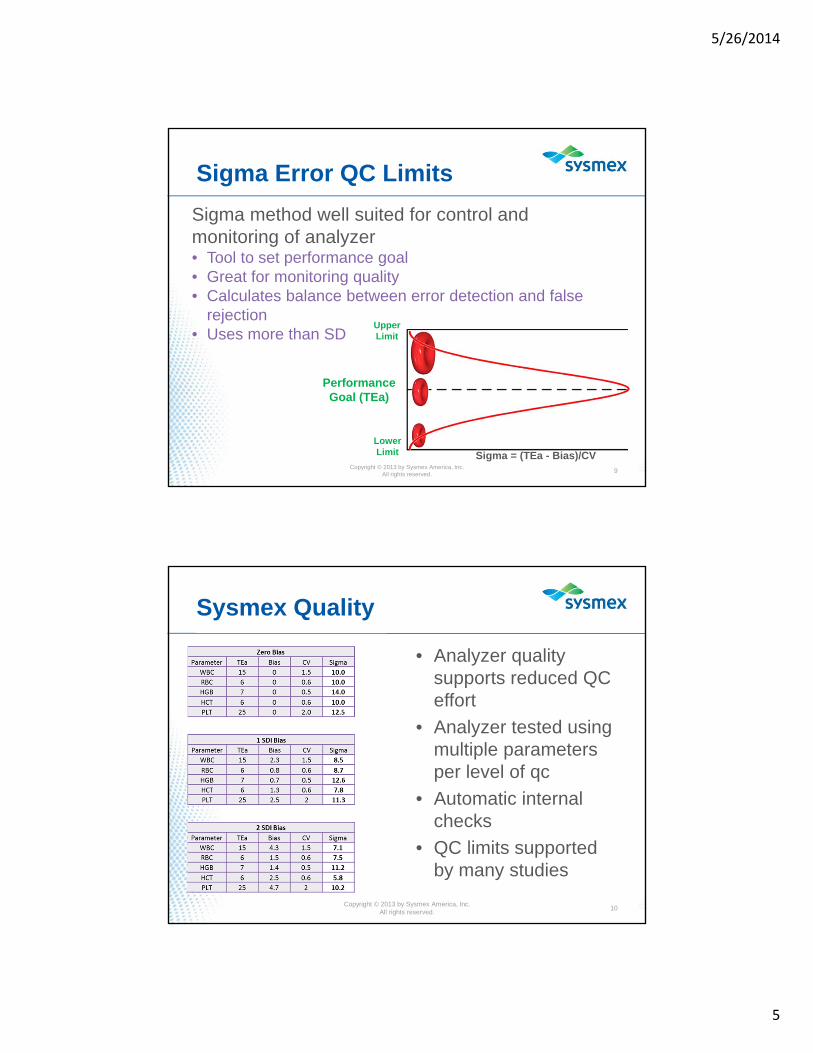
Sigma method well suited for control and monitoring of analyzer• Tool to set performance goal• Great for monitoring quality• Calculates balance between error detection and false
rejection• Uses more than SD
Sigma Error QC Limits
Copyright © 2013 by Sysmex America, Inc. All rights reserved.
9
Sigma = (TEa - Bias)/CV
Performance Goal (TEa)
Upper Limit
Lower Limit
Sysmex Quality
• Analyzer quality supports reduced QC effort
• Analyzer tested using multiple parameters per level of qc
• Automatic internal checks
• QC limits supported by many studies
Copyright © 2013 by Sysmex America, Inc. All rights reserved.
10
Page 6
5/26/2014
6
Sysmex Quality
Copyright © 2013 by Sysmex America, Inc. All rights reserved.
11
RBC
HGB
HCT
WBC
PLT
= Insight 2SDI range
= CLIA PT survey limits
Evidence Based Control Limits
• Sysmex Evidence Based Control Limits are:– Control limits that provide appropriate error
detection with minimal false rejection.
• Sysmex Evidence Based Control Limits are not:– Standalone control rules
– Multirules
– Quality Control procedure
Copyright © 2013 by Sysmex America, Inc. All rights reserved.
12
Page 7
5/26/2014
7
Evidence Based Limits
• Sigma control rules– Common industry quality measure
– Rule built using performance goal, bias, and precision of test method
– Formula to balance error detection with low false rejection rate
• Predicts defects per million (DPM)
– Common measure and performance goal by parameter independent of manufacturer
Copyright © 2013 by Sysmex America, Inc. All rights reserved.
13
Is a 3SD Limit Quality?
• Analyzer A– HGB 13.6
– 1SD .11
– 3 SD rule +/- .33
• Analyzer B– HGB 13.8
– 1SD .34
– 3 SD rules +/-1.0
Copyright © 2013 by Sysmex America, Inc. All rights reserved.
14
Page 8
5/26/2014
8
Evidence Based Limits• Sysmex did the work for the lab
• Balanced Error Detection with Low False Rejection Rate
• Control limits based on 6 Sigma methods– Calculated for each control level and model
• Monitors true analyzer performance– Calculated using tens of thousands of data
points
New Recommendations
© 2013 Sysmex America, Inc. All rights reserved.
Assay Sheet Limits
2SD limits
Evidence Based Limits
Evidence Based Limits
Copyright © 2013 by Sysmex America, Inc. All rights reserved.
16
Precision (CV) cannot be adjusted
Sigma = (Performance Goal – Bias)/CV
Performance Goal (TEa)
Low Error DetectionHigh False Rejection
Balanced Error Detection with low False Rejection
Page 9
5/26/2014
9
Sigma Control Limit
• Analyzer A– Performance goal 2.8%
• Control limit 13.2 – 14.0
• 4.6 Sigma quality
– 3 SD rule 13.3 -13.9
• Analyzer B– Performance goal 2.8%
• Control limit 13.4 – 14.2
• 1.9 Sigma quality
– 3 SD rule 12.8 -14.8
Sigma = (Performance Goal – Bias)/CV
31% out of control
.02% out of control
CV .5%
CV 1.5%
17
Performance Goal
• Used 6 cumulative Insight reports for each model– Over 500 days of control data in calculation
– Control performance throughout lot life
– Analyzer and reagent performance
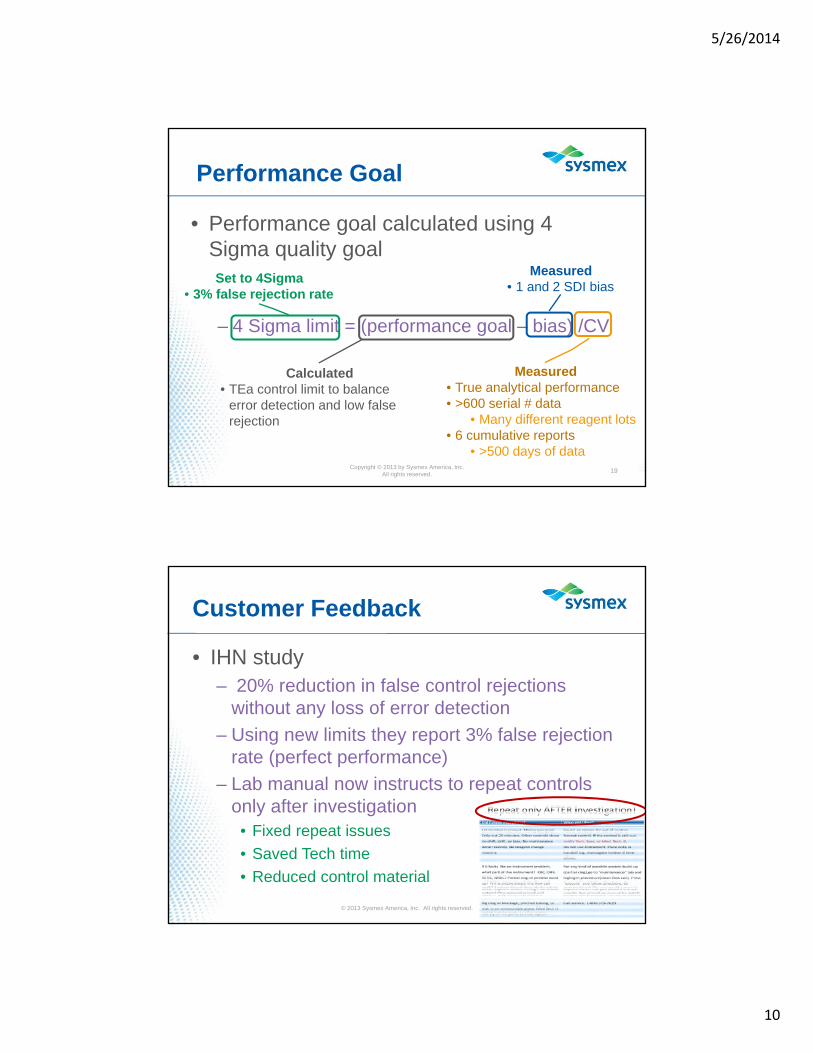
• Performance goal calculated using 4 Sigma quality goal– 4 Sigma limit = (performance goal – bias)/CV
– 3% false positive rate Copyright © 2013 by Sysmex America, Inc.
All rights reserved.18
Page 10
5/26/2014
10
Performance Goal
Copyright © 2013 by Sysmex America, Inc. All rights reserved.
19
– 4 Sigma limit = (performance goal – bias) /CV
Set to 4Sigma• 3% false rejection rate
Measured• True analytical performance • >600 serial # data
• Many different reagent lots• 6 cumulative reports
• >500 days of data
Measured• 1 and 2 SDI bias
• Performance goal calculated using 4 Sigma quality goal
Calculated• TEa control limit to balance
error detection and low false rejection
Customer Feedback
• IHN study– 20% reduction in false control rejections
without any loss of error detection
– Using new limits they report 3% false rejection rate (perfect performance)
– Lab manual now instructs to repeat controls only after investigation
• Fixed repeat issues
• Saved Tech time
• Reduced control material
© 2013 Sysmex America, Inc. All rights reserved.
Page 11
5/26/2014
11
Customer Feedback
• Fixed repeat issue and false control rejection issues
• Staff now investigates out-of-limit events
© 2013 Sysmex America, Inc. All rights reserved.
From: Ann Subject: QC Feedback
Hey Scott,
I was able to visit an XN customer yesterday and got some very positive feedback about the QC limits. This was a legacy customer that struggled significantly with getting historical limits pinned down and always fought with false flagging and numerous unnecessary repeats. She said that once she got the new NRBC limits on her XN, it has been smooth sailing. She specifically said that now if something is out, they all gather around to see what’s wrong because it is such a rare occurrence. Great comments that I wanted to pass along, thanks for doing what you do! We all appreciate it.
Have a good day,
~Ann
Laboratory Benefit
• Improve lab satisfaction with control products and processes
• Easily identify changes in analyzer performance – Appropriate error detection with low false rejections
• Reduce laboratory cost
• Increase overall productivity– Increased analyzer uptime
– Reduce labor cost for QC processes© 2013 Sysmex America, Inc. All rights reserved.
Page 12
5/26/2014
12
Quality
• Narrow control limits do not improve result quality– Error detection without corrective action
desensitizes QA processes
• Only improvements to sample preparation or test systems can improve result quality– Control limits are to identify if there has been
a clinical change to the test system
Copyright © 2013 by Sysmex America, Inc. All rights reserved.
23
Additional Information
• Customer communication 63-1100 02/2014– Located in CRC
• Insight Guide– Insight/User Manuals/Participant Overview Guide
• CAP q-probe 94-08 QC Exceptions
• International Journal of Laboratory Hematology– Rationale for using insensitive quality control rules for
today’s hematology analyzers
Copyright © 2013 by Sysmex America, Inc. All rights reserved.
Page 13
5/26/2014
13
THANK YOU
25