Örebro universitet Institutionen för hälsovetenskap och medicin Enheten klinisk medicin Kurs: Medicin, avancerad nivå. Examensarbete Datum: 2015-06-07 30-year (1983-2013) trends in saliva flow rate and saliva buffer capacity. Analyses from 10- year repeated, cross-sectional population samples in the Jönköping area Författare: Martin Ågren Handledare: Ingegerd Johansson Professor, Umeå Universitet
Transcript
Oumlrebro universitet
Institutionen foumlr haumllsovetenskap och medicin
Enheten klinisk medicin
Kurs Medicin avancerad nivaring Examensarbete
Datum 2015-06-07
30-year (1983-2013) trends in saliva flow rate
and saliva buffer capacity Analyses from 10-
year repeated cross-sectional population
samples in the Joumlnkoumlping area
Foumlrfattare Martin Aringgren
Handledare Ingegerd Johansson
Professor
Umearing Universitet
ABSTRACT
OBJECTIVE To determine trends in saliva flow rate and saliva buffer capacity and to evaluate
associations between saliva flow rate and buffer capacity with potential explanatory factors including
chewing ability medication and other health variables including oral health
MATERIALS AND METHODS The study group consisted of 2509 individuals (1204 men and 1305
women) randomly selected from the town of Joumlnkoumlping Sweden All participants underwent an oral
examination as well as completed a questionnaire
RESULTS The highest mean saliva flow rate in men and women was seen at age 50 and 40 years
respectively Sex and age standardized means for saliva flow rates for all subjects differed significantly
between the screening years but they did not follow a linear trend over time Through PLS analysis
low buffer capacity (pH lt55) being a woman xerostomia less occlusal support zones (Eichner index)
and having more daily meals of food or having less teeth were identified to have a significant
correlation to lower saliva flow rate The analytic method of buffer capacity evaluation changed
between the study years thus differences between screening years are not taken into consideration
In 8 out of 14 strata mean flow rate was significantly higher in those with buffer pH gt55 than those
with a buffer pHlt55 Univariate analysis from variables indicated in the PLS analysis revealed that
low saliva flow rate moderate degree of periodontal disease smokers and those with the poorest
Eichner index have low buffer capacity
CONCLUSIONS The stimulated salivation is dependent on gender number of teeth Eichner index
subjective xerostomia and buffer capacity Different normal salivation distribution scales could be
needed for men and women
KEYWORDS Saliva trends oral health
REGISTER
Introduction 1 The Joumlnkoumlping study 4 Aim 4 Subjects and method 4 Study cohort 4 Questionnaire 5 Outcome variables 5 Saliva collection and buffer capacity analyses 5 Potential explanatory or confounding variables 5 Statistical analyses 6 Ethical aspects 6 Results 7
Participants 7 Identification of potential confounders 7 Thirty year time trends in saliva flow rate 8 Identification of factors associated with saliva flow rate 9 Thirty years time trends in buffer capacity 11 Identification of factors associated with buffer capacity 12
30-YEAR (1983-2013) TRENDS IN SALIVA FLOW RATE AND SALIVA BUFFER CAPACITY ANALYSES
FROM 10-YEAR REPEATED CROSS-SECTIONAL POPULATION SAMPLES IN THE JOumlNKOumlPING AREA
Author Aringgren Martin
INTRODUCTION
Saliva plays a crucial role in protection of the oral cavity (Edgar et al 2004) Thus flushing (clearance
and exposure) of the soft and hard tissues and biological effects of saliva constituents such as pH-
regulatory components inorganic components participating in the de- and remineralisation of tooth
tissues and proteins peptides lipids and carbohydrates affecting microbial growth and colonization
are of importance Saliva flow and oral muscle activities are the key determinants for flushing Lack of
proper amount of saliva may lead to discomfort for the individual such as a burning sensation
dysphagia speech impairment taste disturbances and increase risk for dental caries (Bergdahl 2000
Naumlrhi 1994)
Knowledge of population based reference values are important for identification of conditions
which need to be observed or treated For saliva flow rate the cut off values 07 mLmin to 10
mLmin and 01 mLmin for stimulated and unstimlated saliva respectively are applied for
hyposalivation (Fujibayashi et al 2004 Bergdahl 2000) Values above are considered normal If the
flow rate has drifted in the population such as indicated in Bergdahl (2000) these cut-offs may be
misleading and should eventually be questioned For buffer capacity the cut off for low capacity is a
final pH lt55 after addition of a standardized amount of acid This is a reflection of the pKa value and
buffer range of the bicarbonate ion The buffer capacity is crucial for dental erosion caries and
microbiota ecology as a pH below 55 creates an environment of demineralisation and supports a
bacteria dysbiosis characterized by acidophilic and aciduric bacteria (Schuurs 2013 Marsh 2010)
Saliva is produced by the three paired major salivary glands the parotid submandibular and
sublingual glands and numerous minor salivary glands distributed in the oral mucosa In an
unstimulated state the submandibular glands account for two thirds of the secreted saliva When
stimulated secretion from the parotid glands increases proportionally the most and accounts for up
to 60 of the secretion (Carpenter 2013) The parotid glands are comprised of serous and the
submandibular glands of both mucous and serous acinar cells with a majority of the latter In
comparison to the parotid saliva saliva from the submandibular glands is more viscous and mucin-rich
The smallest of the major salivary glands are the sublingual glands which produce highly viscous
mucous saliva that accounts for a few per cent of the total amount of saliva The minor glands
2
contribute for le10 of the secreted saliva They produce mainly mucous saliva rich in secretory IgA
(Dawes and Wood 1973)
Secretion of saliva is regulated by the parasympathetic and the sympathetic systems Secretion is
initiated by afferent signals from three cranial nerves the trigeminal (V) facial (VII) and
glossopharyngeal (IX) nerves The afferent innervation stems from mechanoreceptors in the
periodontal ligament and chemoreceptors in the taste buds The stimulated salivation is increased by
frequency of chewing cycles force of chewing and number of teeth occluding on the object chewed
upon The increase in salivation from the parotid glands is higher on the ipsilateral side but the
contralateral side also shows an increase in salivation (Jensen Kjeilen et al 1987 Samnieng et al
2012) The masticatory-salivary reflex is initiated not only by the periodontal ligament as it has been
shown that edentulous subjects also have an increase in parotid salivation when chewing (Scott et al
1998) The salivation is also dependent on conditioned reflexes controlled through the autonomic
nervous system This central control inhibits unstimulated salivation during sleep fear and mental
depression and excites salivation during fight The classical parasympathetic and sympathetic
transmitters ie acetylcholine and either noradrenaline (norepinephrine) or adrenaline (epinephrine)
respectively are the main activators of salivation (Ekstroumlm 1989) The parasympathetic system mainly
regulates water secretion and the sympathetic protein secretion The complex regulation of the
secretory cells makes secretion sensitive to numerous external and intrinsic factors Examples of such
factors are medications diseases stress water balance starvation and lack of chewing stimulation
(Bardow et al 2008)
Water secretion from the acinar cells is driven by intracellular loss of potassium to the
insterstitium and chloride to the lumen The loss of potassium to the extracellular fluid forces sodium
into the lumen causing a salty environment which drives water through osmosis into the lumen of
the salivary gland During its way through the duct of the salivary gland the primary saliva is modified
in a flow rate related fashion by selective reabsorptionsecretion of electrolytes Among the
electrolytes that are affected during secretion are sodium and bicarbonate (Bardow et al 2008)
One important aspect of saliva action is its contribution to remineralisation of the teeth as well as
preventing demineralisation by buffering (Selwitz et al 2007) After each intake of food the pH in
dental plaque drops and remains at that state until soluble carbohydrates are cleared from the oral
cavity and the acids produced from bacteria are neutralized (buffered)
The magnitude and the time period below the tooth tissue critical pH are determined by the
amount of acid produced by bacteria by the buffer capacity of the saliva and saliva flushing There are
three systems in saliva that contribute in buffering the pH after an acid attack and striving it above the
3
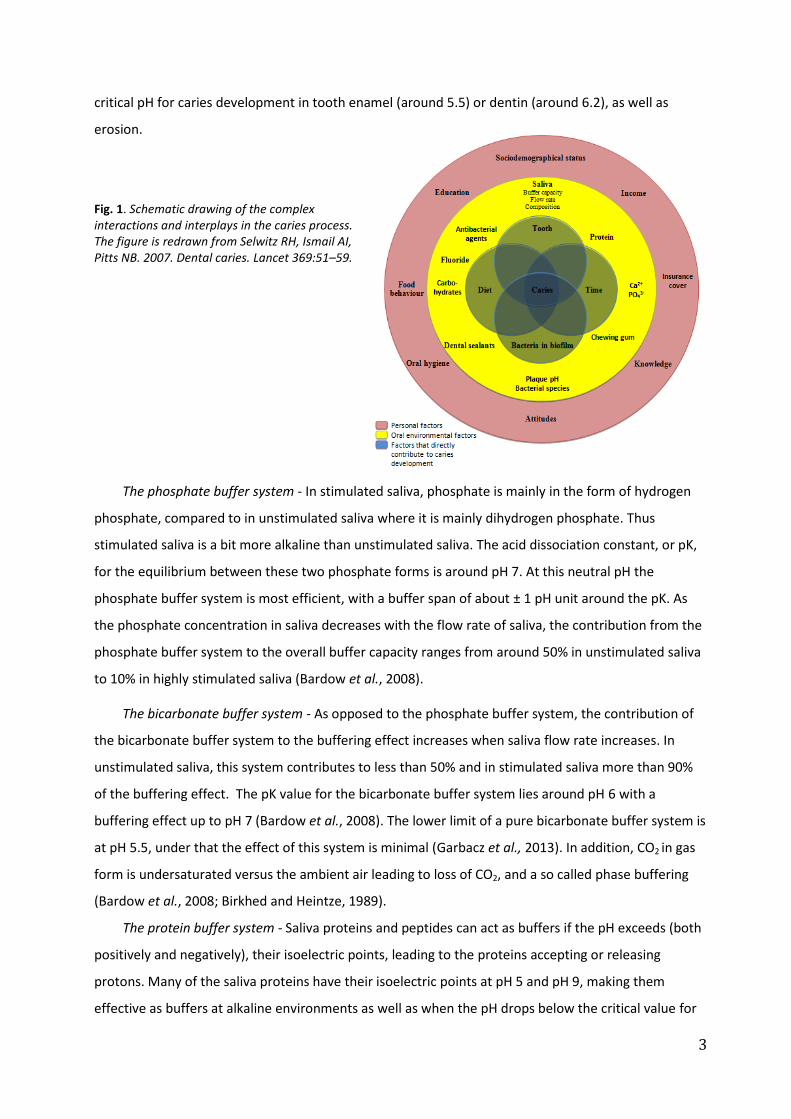
critical pH for caries development in tooth enamel (around 55) or dentin (around 62) as well as
erosion
Fig 1 Schematic drawing of the complex interactions and interplays in the caries process The figure is redrawn from Selwitz RH Ismail AI Pitts NB 2007 Dental caries Lancet 36951ndash59
The phosphate buffer system - In stimulated saliva phosphate is mainly in the form of hydrogen
phosphate compared to in unstimulated saliva where it is mainly dihydrogen phosphate Thus
stimulated saliva is a bit more alkaline than unstimulated saliva The acid dissociation constant or pK
for the equilibrium between these two phosphate forms is around pH 7 At this neutral pH the
phosphate buffer system is most efficient with a buffer span of about plusmn 1 pH unit around the pK As
the phosphate concentration in saliva decreases with the flow rate of saliva the contribution from the
phosphate buffer system to the overall buffer capacity ranges from around 50 in unstimulated saliva
to 10 in highly stimulated saliva (Bardow et al 2008)
The bicarbonate buffer system - As opposed to the phosphate buffer system the contribution of
the bicarbonate buffer system to the buffering effect increases when saliva flow rate increases In
unstimulated saliva this system contributes to less than 50 and in stimulated saliva more than 90
of the buffering effect The pK value for the bicarbonate buffer system lies around pH 6 with a
buffering effect up to pH 7 (Bardow et al 2008) The lower limit of a pure bicarbonate buffer system is
at pH 55 under that the effect of this system is minimal (Garbacz et al 2013) In addition CO2 in gas
form is undersaturated versus the ambient air leading to loss of CO2 and a so called phase buffering
(Bardow et al 2008 Birkhed and Heintze 1989)
The protein buffer system - Saliva proteins and peptides can act as buffers if the pH exceeds (both
positively and negatively) their isoelectric points leading to the proteins accepting or releasing
protons Many of the saliva proteins have their isoelectric points at pH 5 and pH 9 making them
effective as buffers at alkaline environments as well as when the pH drops below the critical value for
4
demineralisation Although generally less effective than the two first buffer system the local
concentration of proteinspeptides may render local significant buffer effect (Bardow et al 2008)
The Joumlnkoumlping study
Joumlnkoumlping is a middle sized Swedish town with 130000 inhabitants in in 2013 It is the Capital of the
Joumlnkoumlping County and is situated on the main transport roads between the three biggest cities in
Sweden namely Stockholm Gothenburg and Malmouml The Public Dental Service of Joumlnkoumlping County
also manages the Institute for Postgraduate Dental Education in Joumlnkoumlping The Joumlnkoumlping study
(Hugoson et al 2005 ab) with its 10-year repeated oral screenings with for the most part
standardized methods is one of few studies worldwide offering the capacity to do a ldquolongitudinalrdquo
evaluation of trends in saliva flow and buffer capacity in repeated cross-sectional population based
samples over a long time
AIM
The primary aim of the present study was to evaluate time trends for saliva flow rate and saliva buffer
capacity using the 10-year screenings in the Joumlnkoumlping study A second aim is to evaluate the
associations between saliva flow ratebuffer capacity and potential explanatory factors including
number of teeth chewing ability diet intake and medication
SUBJECTS AND METHODS
Study cohort
In the Joumlnkoumlping study independent cross-sectional selections of individuals in the age groups 3 5 10
15 20 30 40 50 60 70 and 80 years have been randomly selected from individuals residing in
Kristine Ljungarum Sofia and Jaumlrstorp parishes as defined in 1973 (by 2006 the two first parishes
merged into one and so did the two last in 2010) The examinations are done on a decennial basis
since 1973 saliva flow rate and buffer capacity was not measured in 1973 though The selected
individuals have been invited and in those who agreed to participate about a 100 in each age group
an extensive oral examination was performed under good clinical conditions (Hugoson et al 1986
1995 2005 ab) The age groups of 3 5 10 and 15 are not included in the present evaluation (Koch et
al 2009) At all screening occasions 130 randomly selected adult in each of the 10-year age group
were invited to participate (Huguson et al 2005) Due to a low participation rate in 2013 additionally
40 40 and 50 subjects were invited in the age groups of 30 40 and 50 years
5
Questionnaire
All participants answered a questionnaire in immediate connection to the examination In the
questionnaire the participants answered questions on the number of meals and snacks per day
medication and graded their subjective experience of xerostomia health tobacco use and ease of
chewing
Outcome variables
The outcome variables in the present study are flow rates of stimulated whole saliva and buffer
capacity of the same saliva from the screenings in 1983 1993 2003 and 2013
Saliva collection and buffer capacity analyses
Whole saliva stimulated by chewing on a 1 gram piece of paraffin was collected into graded test
tubes for 3 minutes Flow rates were calculated and buffer capacity analysed The analysis method of
the buffer capacity changed over the years In 1983 and 1993 it was done according to Ericssonrsquos
laboratory buffer capacity test (Ericsson 1959) In 2003 and 2013 chair-side simplified methods
(Dentobuff Strip Orion Diagnostica Espoo Finland GC Saliva Check GC Europe NV Leuven Belgium)
was used A study showed best agreement among results provided by strip-type systems in patients
with high buffering capacity all compared to Ericssonrsquos laboratory buffer capacity test (Cheaib et al
2012) Therefore buffer capacity measures were dichotomized into low and normal capacity ie ltpH
55 and ge pH 55 respectively
Fig 2 Correspondence between Ericssonrsquos laboratory buffer capacity test Dentobuff Strip and GC Saliva-Check The figure is drawn from Cheaib et al 2012
Potential explanatory or confounding variables
The following variables were evaluated for a potential explanatory effect or included as confounders in
statistical models Sex age number of teeth Eichner index subjective reported chewing capacity
dietary variables medication and periodontal health The Eichner index describes the number of
occlusal support zones in the mouth that is where occlusion (chewing) is supported with a maximum
of four support zones These are the molar support zone (left and right) and the premolar support
zone (left and right) If occlusion exists in all four support zones the occlusion is categorised as class A
and sub grouped if the support zones lacks teeth in either one or both of the jaws if there exists an
6
occlusion but at least one of the four support zones does not participate in the occlusion it is
categorised as class B which is sub grouped according to how many of the support zones that are
lacking if there are no occlusion or the individual is edentulous it is a class C sub grouped to whether
the individual is edentulous or have non-occluding teeth in either one or both jaws Tooth or implant
supported fixed dentures are considered to participate in the occlusion but removable dentures are
not (Eichner 1955) The number of teeth and the Eichner index does not include the wisdom teeth
ie maximum number is 28 teeth
Statistical analyses
Statistical analyses were performed for all subjects together and separately for men and women in 10-
year age strata using IBM SPSS version 22 (IBM Armonk NY USA) Statistical tests were two-sided and
p-values lt005 considered statistically significant Descriptive statistics include frequencies
proportions and means with measures of variation Differences in mean values for normally
distributed variables were tested with Studentacutes unpaired t-test or ANOVA followed by Bonferroni
post hoc tests where applicable Standardization for age andor sex was done by general linear
regression (glm) Non-normally distributed variables were tested by Chi2 ndashtest
Multivariate partial least square regression (PLS SIMCA 14 version 140 Umetrics AB Umearing
Sweden) was used to search for hidden structures in the data In contrast to traditional regression PLS
is suitable for data where the x variables co-vary and the group number is limited Variables were
autoscaled to unit variance and cross-validated prediction of Y calculated (Staringhle and Wold 1988)
Cross validation is done by a systematic prediction of 17th of the data by the remaining 67th of the
data The importance of each x variable in explaining the variation in y is displayed in a PLS loading plot
and the correlation coefficients in a bar plot with means and 95 CI Variables for which the 95 CI
does not include zero are statistically significant
Ethical aspects
The Joumlnkoumlping study is approved by the Linkoumlping Regional Ethical Review Board
7
RESULTS
Participants
The total number of participants in the four study years were 2509 (1204 men and 1305 women)
with a virtually equal distribution on sex and 10-year age groups at each screening occasions (Table 1)
The attendance rate was 772 in 1983 754 in 1993 690 in 2003 and 564 in 2013
Table 1 Numbers () of participants per study year in sex and 10-year age strata by study year
a) Participants turning the age during the study year
Identification of potential confounders
As a first step the associations between saliva flow rate and buffer capacity on the one hand and sex
and age on the other were analysed Univariate comparisons revealed that the mean saliva flow rate
was systematically higher in men than women in all age groups (Table 2 Fig 3) and that it differed
among the age groups (Table 2 Fig 3) The highest mean saliva flow rate in men and women was seen
at age 50 and 40 years respectively and thereafter flow rate decreased continuously in both sexes (Fig
3) The proportion with low saliva buffer capacity differed by age in men but not women (Table 2 Fig
4) Hence measures for screening year comparisons should be standardized for age or sex
Table 2 Saliva flow rate and buffer capacity by sex and 10-year age groups Unstandardized means and 95 CI for flow rate and proportions with a low saliva buffer capacity ie a final buffer pH lt55
a) Differences between means were tested with unpaired t-test (sex) or ANOVA (age) b) Differences in distributions were tested with a Chi
2-test
8
Fig 3 Unstandardized mean saliva flow rate with 95 CI in (A) men and (B) women)
Age
20 30 40 50 60 70 80
mL
min
00
05
10
15
20
Age
20 30 40 50 60 70 80
mLm
in
00
05
10
15
20
for p-005 and for plt001 for plt0001 when compared to all other age groups
Fig 4 Percentage of study subjects with low buffer capacity pH lt55 for (A) men (B) women)
for p-005 and for plt001 for plt0001 when compared with 1983
Thirty year time trends in saliva flow rate
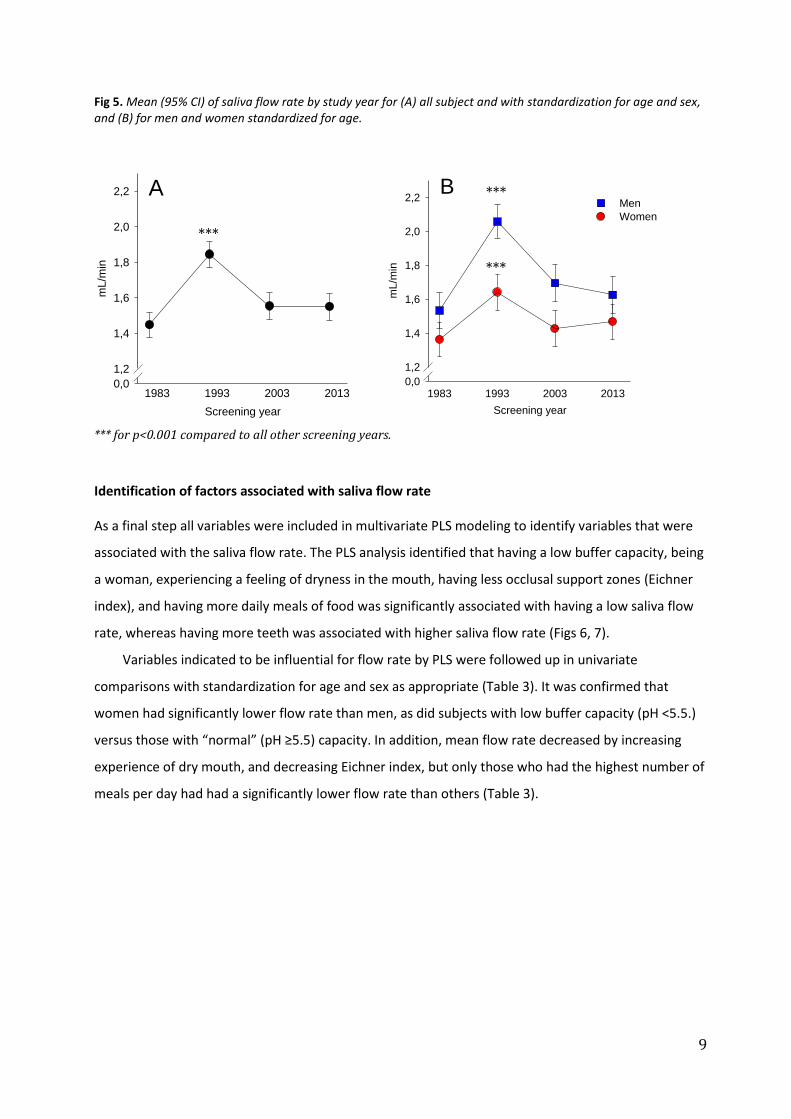
Sex and age standardized means for saliva flow rates for all subjects differed significantly between the
screening years but they did not follow a linear trend over time (Fig 5A) The same pattern was seen
when men and women were analyzed separately with standardization for age (Fig 5B) and in sex and
age strata (data not shown) Thus mean flow rates in 1993 were significantly higher than in 1983 and
then again lower in 2003 and 2013 compared to 1993 Standardization for sex and age had very limited
effect on the mean values ie only the second decimal was affected compared to the means from the
univariate analyses
A B
A B
9
Fig 5 Mean (95 CI) of saliva flow rate by study year for (A) all subject and with standardization for age and sex and (B) for men and women standardized for age
Screening year
mLm
in
00
12
14
16
18
20
22
1983 1993 2003 2013
A
Screening year
mL
min
00
12
14
16
18
20
22Men
Women
1983 1993 2003 2013
B
for plt0001 compared to all other screening years
Identification of factors associated with saliva flow rate
As a final step all variables were included in multivariate PLS modeling to identify variables that were
associated with the saliva flow rate The PLS analysis identified that having a low buffer capacity being
a woman experiencing a feeling of dryness in the mouth having less occlusal support zones (Eichner
index) and having more daily meals of food was significantly associated with having a low saliva flow
rate whereas having more teeth was associated with higher saliva flow rate (Figs 6 7)
Variables indicated to be influential for flow rate by PLS were followed up in univariate
comparisons with standardization for age and sex as appropriate (Table 3) It was confirmed that
women had significantly lower flow rate than men as did subjects with low buffer capacity (pH lt55)
versus those with ldquonormalrdquo (pH ge55) capacity In addition mean flow rate decreased by increasing
experience of dry mouth and decreasing Eichner index but only those who had the highest number of
meals per day had had a significantly lower flow rate than others (Table 3)
10
Fig 6 Scatter plot of the relation between saliva secretion and the other variables of the study population
Fig 7 Coefficient plot of the correlation of stimulated salivation and other variables Where the error bars do not pass through the zero the correlation is significant (p lt005)
11
Table 3 Sex andor age standardized measures for variables identified as influential for saliva flow rate in the multivariate PLS model all screening years
Stimulated salivation mLmin mean (95 CI)
p-value between groups
Gender lt0001
Men (n=1178) 173 (168 ndash 179)
Women (n=1271) 148 (142 ndash 153)
Buffer capacitya lt0001
pH 55 and above (n=1108) 179 (174 ndash 185)
Below pH 55 (n=1267) 145 (140 ndash 150)
Subjective xerostomia lt0001
Never (n=904) 172 (167 ndash 178)
Occasionally (n=1215) 155 (150 ndash 161)
Often (n=200) 145 (132 ndash 158)
Always (n=31) 125 (092 ndash 158)
Number of teeth lt0001
0 to 4 (n=157) 128 (112 ndash 144)
5 to 9 (n=81) 122 (101 ndash 143)
10 to 14 (n=77) 124 (102 ndash 145)
15 to 19 (n=172) 130 (115 ndash 144)
20 to 24 (n=446) 150 (141 ndash 159)
25 to 28 (n=1516) 174 (168 ndash 179)
Eichner index lt0001
Class A (n=1777) 171 (166 ndash 175)
Class B (n=438) 133 (123 ndash 143)
Class C (n=227) 130 (116 ndash 143)
Daily meals 0013
One (n=142) 163 (147 ndash 178)
Two (n=711) 157 (150 ndash 164)
Three (n=1060) 164 (158 ndash 169)
Four (n=369) 159 (149 ndash 169)
Five or more (n=53) 120 (095 ndash 145) aThe analysis method changed between study years (see Method section)
Thirty years time trends in buffer capacity
Due to the shift in analysis method for buffer capacity estimation only measures from 1983 and 1993
could be compared and those from 2003 and 2013 As seen in Table 4 the proportion of individuals
with a low buffer capacity (pHlt55) was significantly higher in 1983 than 1993 and were lower in 2003
compared to 2013 To evaluate if the lower proportion of subjects in 1993 versus 1983 was associated
with saliva flow rate the saliva flow rate was compared in 10-year age groups of men and women with
a buffer pH lt55 and those with a buffer pHgt55 (Fig 8 AB) In 8 out of 14 strata mean flow rate was
significantly higher in those with buffer pH gt55 than those with a buffer pH lt55 For some of the age
groups a significant difference between buffer capacity and years are observed (Fig 4)
12
Table 4 Proportion () with a saliva buffer capacity pH lt55
Study year 1983 Study year 1993 p-value
1983 vs 1993
Study year 2003 Study year 2013 p-value
2003 vs 2013
Analysis method
Ericssonrsquos laboratory test
Ericssonrsquos laboratory test Dentobuff strip
GC Saliva Check Dentobuff strip
Men 593 783 lt0001 254 288 0218
Women 667 881 lt0001 320 353 0228
Differences in proportions are tested with a Chi2-test Significances are tested by t-test
Fig 8 Mean (95 CI) of saliva flow rate in (A) men (n=1149) and (B) women (n=1229) with buffer pH lt55 or
ge55 all screening years
for p-005 and for plt001 for plt0001
Identification of factors associated with buffer capacity
When all measured variables were included in a multivariate PLS model with low or ldquonormalrdquo saliva
buffer capacity as the dependent variables study year periodontal health a higher saliva flow rate
not being a smoker and number of teeth were significantly associated with having a normal buffer pH
(Fig 9) whereas less occlusal support zones (Eichner index) was associated with low buffer capacity
Variables indicated to be influential for buffer capacity by PLS were followed up in univariate
comparisons with standardization for age and sex as appropriate (Table 5) Thus more subjects had
low buffer capacity among those with low saliva flow rate among those with the moderate degree of
periodontal disease among smokers and those with the poorest Eichner index (Table 5)
A B
13
Fig 9 Coefficient plot of the correlation of buffer pH Negative numbers equals to higher buffer pH Where the error bars do not pass through the zero the correlation is significant (p lt005)
Table 5 Sex andor age standardized measures for variables identified as influential for saliva buffer pH in the multivariate PLS model Proportion of subjects with
buffer pH ge55 p-value between
groups
Saliva secretion lt0001
ge 10 mLmin (n=1818) 844
lt 10 mLmin (n=557) 697
Periodontal health classification lt0001
Healthy (n=441) 444
Gingivitis (n=508) 411
Periodontitis levis (n=589) 430
Periodontitis gravis (n=228) 417
Periodontitis complicata (n=93) 495
Smoking lt0001
Smoker (n=1852) 391
Non-smoker (n=445) 494
Number of teeth lt0001
0 to 4 (n=152) 309
5 to 9 (n=80) 288
10 to 14 (n=75) 347
15 to 19 (n=170) 388
20 to 24 (n=438) 418
25 to 28 (n=1463) 522
Eichner index 0013
Class A (n=1719) 518
Class B (n=430) 349
Class C (n=223) 296
14
DISCUSSION
The present study evaluated if saliva flow rate and saliva buffer capacity has changed in the
population from 1983 to 2013 and searched for factors associated with saliva flow rate and having a
poor or acceptable saliva buffer capacity respectively The main findings were that the present data
do not support the hypothesis that saliva flow rate has changed over the 30-year period but the
proportion with poor saliva buffer capacity tended to have increased between 1983 and 1993 where
the same analytic method was used
The strengths of the present study include that (i) all clinical assessments and samplings were
performed by experienced and calibrated dentists in well-equipped dental offices at all screening
rounds (ii) that the method for saliva collection was identical at each screening occasion and (iii) that
participants were randomly selected from population registers and represented a wide age range
Besides the weaknesses of a change in the buffer analysis method it is a weakness that stratification
for sex and age resulted in small groups in relation to the variation in the population This is especially
true for the higher age groups Further it cannot be excluded that the decreasing attendance rate ie
772 754 69 and 564 has resulted in an increasing selection bias The examination was free
for the participants but even with free screenings the attendance by those having a low socio-
economical background is lower compared to others (Zarrouk et al 2013) Another group that is likely
to not have attended for time reasons are busy healthy people which in fact is supported by that
extra subjects had to be invited in 2013 to get an acceptably sized group in middle-aged individuals
For the present study it can only be speculated on the potential selection bias but it may be
anticipated that health concerned subjects and those with an oral health related problem (including
dry mouth) are overrepresented in later years compared to in 1983 and 1993 when gt75 attended the
screening but that subjects with a socioeconomically weak background and worse dental status (but
not necessarily impaired saliva flow rate and buffer capacity) might be underrepresented (Wamala et
al 2006)
The incitement for the present longitudinal evaluation of saliva flow rate was that mean saliva
flow rates of 25 and 20 mLmin were reported for men and women respectively in a screening
performed in 1995 (Bergdahl 2000) The screening was based on approximately 1400 Swedish adults
Those flow rates were considerably higher than values reported in studies from the 1970ies (Heintze et
al 1983) It was plausible to hypothesize that the mean flow rate had increased in the population
given that the number of teeth had increased people were on average taller (an overall larger
anatomy and physiology thus larger glands) and many medications inhibiting saliva secretion were
over the years substituted for non-inhibitory alternatives Notably the flow rate in 1993 was higher
than in 1983 and approached the levels reported by Bergdahl (2000) It was therefore surprising to
find that the mean flow rates were again close to the 1983 levels in 2003 and 2013 Collection of
15
chewing stimulated saliva is a very well standardized and easy-to-perform measure which makes the
variations in flow rate hard to explain with anything but a selection bias in later screening years or
regression towards the mean Still it seems unlikely that two independent screenings performed in
the same time window (early 1990ies) and giving a very similar result would be influenced by the same
bias or systematic error However at present the conclusion is that the present data do not support
that the saliva flow rate has increased in the population over time but future large scale population-
based studies have to follow up on this The implication of an increased salivation paired with a lower
buffer capacity of the same saliva might confer the need of adjusted cut off values when it comes to
normal or sub-normal saliva flow rate or a completely new way of measuring the properties of saliva
as this would imply that even though the saliva flow rate increased its buffering capacity would have
decreased
A common finding in medical studies is that different measures are not independent ie body
weight is correlated with height saliva flow rate is correlated with buffer capacity number of teeth is
correlated with Eichner index etc This is an obstacle in traditional linear or logistic regression In the
present study the multivariate projection method PLS was selected The rational for choosing that
method is that it is insensitive to covariation among variables and it works well also in smaller samples
The drawback is that it does not report standardized central measures and variation Therefore PLS
was followed up with separate analyses where standardization for age andor sex was applied
As described the method for saliva buffer capacity was changed in 2003 The rational for this was
to save manpower since the Ericsson method need laboratory personal and logistics when it comes to
transporting the saliva When comparing the proportions with low buffer capacity in 1993 with 2003
and 2013 it is evident that the two methods did not perform as well as claimed by Cheaib et al (2012)
The comparisons for this factor were therefore done with greatest restriction ie dichotomized to
poor or good
The factors associated with saliva flow rate ie sex age in women subjective xerostomia
number of teeth occlusal support zones and buffer capacity are in accordance with what has been
reported in previous studies (Ikebe et al 2012 Heintze et al 1983) Thus though the results in the
present study are mainly confirmatory they are of significant clinical importance Subjective
xerostomia is not an explanatory factor but rather a symptom of possible hyposalivation Notably
both number of teeth and Eichner index correlated with stimulated saliva secretion a finding that
should be remembered when choosing between the options of extracting a tooth or save it Thus
quality of life and medicalbiological aspects must be considered and likely more so in patients with
impaired saliva secretion those taking medicine causing hyposalivation those that have short dental
arches or previous extractions or tooth aplasia One may speculate if fixed prosthodontics should be
16
encouraged in patients with lost teeth to improve the occlusal support zones and hence saliva
secretion Further studies are needed to evaluate this
CONCLUSION
The present study found chewing stimulated saliva secretion to be associated with sex number of
teeth Eichner index subjective dry mouth and buffer capacity but it does not support that saliva
secretion has increased over time in the population Saliva secretion and its buffer components is of
outmost importance for the oral environment Hyposalivation and an associated low buffer capacity
puts a person at risk for both dental diseases and oral infection including candida infections and
overall health problems as acute respiratory infection (Iwabuchi et al 2012) and an increase over time
might reduce the risk Given that several factors associated with improved saliva flow rate has taken
place in the population future studies should follow up on the results to confirm or reject that the
present results are not due to a selection bias
ACKNOWLEDGEMENTS
Prof Ingegerd Johansson DDS PhD without whom this essay could not have been written
The personal support of Dr Elisabeth Waumlrnberg Gerdin DDS PhD
The board of the Joumlnkoumlping Studies especially the chairman Dr Ola Norderyd DDS PhD
The County Council of Vaumlsterbotten who allowed me to take time to write this essay
17
REFERENCES
Bardow A Lagerloumlf F Nauntofte B Tenovuo J The role of saliva In Fejerskov O Kidd E (eds) Dental
Caries The Disease and Its Clinical Management 2nd
ed Oxford Wiley-Blackwell 2008 189-208
Bergdahl M Salivary flow and oral complaints in adult dental patients Community Dent Oral Epidemiol
20002859-66
Birkhed D Heintze U Salivary secretion rate buffer capacity and pH In Tenovuo J (ed) Human
Saliva Clinical Chemistry and Microbiology Vol I Boca Raton (FL) CRC Press 1989 25-73
Carpenter GH The secretion components and properties of saliva Annu Rev Food Sci Technol
20134267-276
Cheaib Z Ganss C Lamanda A Turgut MD Lussi A Comparison of three strip-type tests and two
laboratory methods for salivary buffering analysis Odontology 201210067-75
Dawes C Wood CM The contribution of oral minor mucous gland secretions to the volume of whole
saliva in man Arch Oral Biol 197318337-342
Edgar M Dawes C OrsquoMullane D (eds) Saliva and Oral Health 3rd
ed London British Dental
Association 2004
Eichner K Uumlber eine gruppeneinteilung der luumlckengebisse fuumlr der prothetik Dtsch Zahnaumlrztl Z 1955
101831-1834
Ekstroumlm J Autonomic control of salivary secretion Proc Finn Dent Soc 198985323-331 361-363
Ericsson Y Clinical investigations of the salivary buffering action Acta Odontol Scand 195917131ndash
165
Fujibayashi T Sugai S Miyasaka N Hayashi Y Tsubota K Revised Japanese criteria for Sjoumlgrens
syndrome (1999) availability and validity Mod Rheumatol 200414425-434
Garbacz G Kołodziej B Koziolek M Weitchies W Klein S An automated system for minitoring and
regulating the pH of bicarbonate buffers AAPS PharmSciTech 201314517-522
Heintze U Birkhed D Bjoumlrn H Secretion rate and buffer effect of resting and stimulated whole saliva as
a function of age and sex Swed Dent J 19837227ndash238
Hugoson A Koch G Bergendal T Hallonsten AL Laurell L Lundgren D et al Oral health of individuals
aged 3-80 years in Jonkoping Sweden in 1973 and 1983 I A review of findings on dental care
habits and knowledge of oral health Swed Dent J 198610103-117
Hugoson A Koch G Bergendal T Hallonsten AL Slotte C Thorstensson B et al Oral health of
individuals aged 3-80 years in Jonkoping Sweden in 1973 1983 and 1993 I Review of findings on
dental care habits and knowledge of oral health Swed Dent J 199519225-241
Hugoson A Koch G Goumlthberg C Helkimo AN Lundin SA Norderyd O Sjoumldin B Sondell K Oral health
of individuals aged 3-80 years in Joumlnkoumlping Sweden during 30 years (1973-2003) I Review of
findings on dental care habits and knowledge of oral health Swed Dent J 2005a29125-138
Hugoson A Koch G Goumlthberg C Helkimo AN Lundin SA Norderyd O et al Oral health of individuals
aged 3ndash80 years in Jonkoping Sweden during 30 years (1973ndash2003) II Review of clinical and
Ikebe K Matsuda K Kagawa R Enoki K Okada T Yoshida M Maeda Y Masticatory performance in
older subjects with varying degrees of tooth loss J Dent 20124071-76
Iwabuchi H Fujibayashi T Yamane GY Imai H Nakao H Relationship between hyposalivation and
acute respiratory infection in dental outpatients Gerontology 201258205-11
Jensen Kjeilen JC Brodin P Aars H Berg T Parotid salivary flow in response to mechanical and
gustatory stimulation in man Acta Physiol Scand 1987131169-175
Koch G Kreiborg S Andreasen JO Eruption and shedding of teeth In Koch G Poulsen S (eds)
Pediatric Dentistry A clinical approach 2nd
ed Oxford Wiley-Blackwell 2009 197-211
Marsh PD Microbiology of dental plaque biofilms and their role in oral health and caries Dent Clin
North Am 201054441-454
Naumlrhi TO Prevalence of subjective feelings of dry mouth in the elderly J Dent Res 19947320ndash25
Oumlsterberg T Birkhed D Johansson C Svanborg A Longitudinal study of stimulated whole saliva in an
elderly population Scand J Dent Res 1992100340-345
Samnieng P Ueno M Shinada K Zaitsu T Wright FA Kawaguchi Y Association of hyposalivation with
oral fuction nutrition and oral health in community-dwelling elderly Thai Community Dent Health
201229117-123
Schuurs A Pathology of the hard dental tissues West Sussex Wiley-Blackwell 2013
Scott BJ Jassamwalia R Linden RW The masticatory-parotid salivary reflex in edentulous subjects J
Oral Rehabil 19982528-33
Selwitz RH Ismail AI Pitts NB Dental caries Lancet 200736951-59
Staringhle L Wold S Multivariate data analysis and experimental design in biomedical research Prog Med
Chem 198825291-338
Wamala S Merlo J Bostroumlm G Inequity in access to dental care services explains current
socioeconomic disparities in oral health the Swedish National Surveys of Public Health 2004-2005 J
Epidemiol Community Health 2006601027-1033
Zarrouk M Holst J Malina M Lindblad B Wann-Hansson C Rosvall M Gottsaumlter A The importance of
socioeconomic factors for compliance and outcome at screening for abdominal aortic aneurysm in
65-year-old men J Vasc Surg 20135850-55
ABSTRACT
OBJECTIVE To determine trends in saliva flow rate and saliva buffer capacity and to evaluate
associations between saliva flow rate and buffer capacity with potential explanatory factors including
chewing ability medication and other health variables including oral health
MATERIALS AND METHODS The study group consisted of 2509 individuals (1204 men and 1305
women) randomly selected from the town of Joumlnkoumlping Sweden All participants underwent an oral
examination as well as completed a questionnaire
RESULTS The highest mean saliva flow rate in men and women was seen at age 50 and 40 years
respectively Sex and age standardized means for saliva flow rates for all subjects differed significantly
between the screening years but they did not follow a linear trend over time Through PLS analysis
low buffer capacity (pH lt55) being a woman xerostomia less occlusal support zones (Eichner index)
and having more daily meals of food or having less teeth were identified to have a significant
correlation to lower saliva flow rate The analytic method of buffer capacity evaluation changed
between the study years thus differences between screening years are not taken into consideration
In 8 out of 14 strata mean flow rate was significantly higher in those with buffer pH gt55 than those
with a buffer pHlt55 Univariate analysis from variables indicated in the PLS analysis revealed that
low saliva flow rate moderate degree of periodontal disease smokers and those with the poorest
Eichner index have low buffer capacity
CONCLUSIONS The stimulated salivation is dependent on gender number of teeth Eichner index
subjective xerostomia and buffer capacity Different normal salivation distribution scales could be
needed for men and women
KEYWORDS Saliva trends oral health
REGISTER
Introduction 1 The Joumlnkoumlping study 4 Aim 4 Subjects and method 4 Study cohort 4 Questionnaire 5 Outcome variables 5 Saliva collection and buffer capacity analyses 5 Potential explanatory or confounding variables 5 Statistical analyses 6 Ethical aspects 6 Results 7
Participants 7 Identification of potential confounders 7 Thirty year time trends in saliva flow rate 8 Identification of factors associated with saliva flow rate 9 Thirty years time trends in buffer capacity 11 Identification of factors associated with buffer capacity 12
30-YEAR (1983-2013) TRENDS IN SALIVA FLOW RATE AND SALIVA BUFFER CAPACITY ANALYSES
FROM 10-YEAR REPEATED CROSS-SECTIONAL POPULATION SAMPLES IN THE JOumlNKOumlPING AREA
Author Aringgren Martin
INTRODUCTION
Saliva plays a crucial role in protection of the oral cavity (Edgar et al 2004) Thus flushing (clearance
and exposure) of the soft and hard tissues and biological effects of saliva constituents such as pH-
regulatory components inorganic components participating in the de- and remineralisation of tooth
tissues and proteins peptides lipids and carbohydrates affecting microbial growth and colonization
are of importance Saliva flow and oral muscle activities are the key determinants for flushing Lack of
proper amount of saliva may lead to discomfort for the individual such as a burning sensation
dysphagia speech impairment taste disturbances and increase risk for dental caries (Bergdahl 2000
Naumlrhi 1994)
Knowledge of population based reference values are important for identification of conditions
which need to be observed or treated For saliva flow rate the cut off values 07 mLmin to 10
mLmin and 01 mLmin for stimulated and unstimlated saliva respectively are applied for
hyposalivation (Fujibayashi et al 2004 Bergdahl 2000) Values above are considered normal If the
flow rate has drifted in the population such as indicated in Bergdahl (2000) these cut-offs may be
misleading and should eventually be questioned For buffer capacity the cut off for low capacity is a
final pH lt55 after addition of a standardized amount of acid This is a reflection of the pKa value and
buffer range of the bicarbonate ion The buffer capacity is crucial for dental erosion caries and
microbiota ecology as a pH below 55 creates an environment of demineralisation and supports a
bacteria dysbiosis characterized by acidophilic and aciduric bacteria (Schuurs 2013 Marsh 2010)
Saliva is produced by the three paired major salivary glands the parotid submandibular and
sublingual glands and numerous minor salivary glands distributed in the oral mucosa In an
unstimulated state the submandibular glands account for two thirds of the secreted saliva When
stimulated secretion from the parotid glands increases proportionally the most and accounts for up
to 60 of the secretion (Carpenter 2013) The parotid glands are comprised of serous and the
submandibular glands of both mucous and serous acinar cells with a majority of the latter In
comparison to the parotid saliva saliva from the submandibular glands is more viscous and mucin-rich
The smallest of the major salivary glands are the sublingual glands which produce highly viscous
mucous saliva that accounts for a few per cent of the total amount of saliva The minor glands
2
contribute for le10 of the secreted saliva They produce mainly mucous saliva rich in secretory IgA
(Dawes and Wood 1973)
Secretion of saliva is regulated by the parasympathetic and the sympathetic systems Secretion is
initiated by afferent signals from three cranial nerves the trigeminal (V) facial (VII) and
glossopharyngeal (IX) nerves The afferent innervation stems from mechanoreceptors in the
periodontal ligament and chemoreceptors in the taste buds The stimulated salivation is increased by
frequency of chewing cycles force of chewing and number of teeth occluding on the object chewed
upon The increase in salivation from the parotid glands is higher on the ipsilateral side but the
contralateral side also shows an increase in salivation (Jensen Kjeilen et al 1987 Samnieng et al
2012) The masticatory-salivary reflex is initiated not only by the periodontal ligament as it has been
shown that edentulous subjects also have an increase in parotid salivation when chewing (Scott et al
1998) The salivation is also dependent on conditioned reflexes controlled through the autonomic
nervous system This central control inhibits unstimulated salivation during sleep fear and mental
depression and excites salivation during fight The classical parasympathetic and sympathetic
transmitters ie acetylcholine and either noradrenaline (norepinephrine) or adrenaline (epinephrine)
respectively are the main activators of salivation (Ekstroumlm 1989) The parasympathetic system mainly
regulates water secretion and the sympathetic protein secretion The complex regulation of the
secretory cells makes secretion sensitive to numerous external and intrinsic factors Examples of such
factors are medications diseases stress water balance starvation and lack of chewing stimulation
(Bardow et al 2008)
Water secretion from the acinar cells is driven by intracellular loss of potassium to the
insterstitium and chloride to the lumen The loss of potassium to the extracellular fluid forces sodium
into the lumen causing a salty environment which drives water through osmosis into the lumen of
the salivary gland During its way through the duct of the salivary gland the primary saliva is modified
in a flow rate related fashion by selective reabsorptionsecretion of electrolytes Among the
electrolytes that are affected during secretion are sodium and bicarbonate (Bardow et al 2008)
One important aspect of saliva action is its contribution to remineralisation of the teeth as well as
preventing demineralisation by buffering (Selwitz et al 2007) After each intake of food the pH in
dental plaque drops and remains at that state until soluble carbohydrates are cleared from the oral
cavity and the acids produced from bacteria are neutralized (buffered)
The magnitude and the time period below the tooth tissue critical pH are determined by the
amount of acid produced by bacteria by the buffer capacity of the saliva and saliva flushing There are
three systems in saliva that contribute in buffering the pH after an acid attack and striving it above the
3
critical pH for caries development in tooth enamel (around 55) or dentin (around 62) as well as
erosion
Fig 1 Schematic drawing of the complex interactions and interplays in the caries process The figure is redrawn from Selwitz RH Ismail AI Pitts NB 2007 Dental caries Lancet 36951ndash59
The phosphate buffer system - In stimulated saliva phosphate is mainly in the form of hydrogen
phosphate compared to in unstimulated saliva where it is mainly dihydrogen phosphate Thus
stimulated saliva is a bit more alkaline than unstimulated saliva The acid dissociation constant or pK
for the equilibrium between these two phosphate forms is around pH 7 At this neutral pH the
phosphate buffer system is most efficient with a buffer span of about plusmn 1 pH unit around the pK As
the phosphate concentration in saliva decreases with the flow rate of saliva the contribution from the
phosphate buffer system to the overall buffer capacity ranges from around 50 in unstimulated saliva
to 10 in highly stimulated saliva (Bardow et al 2008)
The bicarbonate buffer system - As opposed to the phosphate buffer system the contribution of
the bicarbonate buffer system to the buffering effect increases when saliva flow rate increases In
unstimulated saliva this system contributes to less than 50 and in stimulated saliva more than 90
of the buffering effect The pK value for the bicarbonate buffer system lies around pH 6 with a
buffering effect up to pH 7 (Bardow et al 2008) The lower limit of a pure bicarbonate buffer system is
at pH 55 under that the effect of this system is minimal (Garbacz et al 2013) In addition CO2 in gas
form is undersaturated versus the ambient air leading to loss of CO2 and a so called phase buffering
(Bardow et al 2008 Birkhed and Heintze 1989)
The protein buffer system - Saliva proteins and peptides can act as buffers if the pH exceeds (both
positively and negatively) their isoelectric points leading to the proteins accepting or releasing
protons Many of the saliva proteins have their isoelectric points at pH 5 and pH 9 making them
effective as buffers at alkaline environments as well as when the pH drops below the critical value for
4
demineralisation Although generally less effective than the two first buffer system the local
concentration of proteinspeptides may render local significant buffer effect (Bardow et al 2008)
The Joumlnkoumlping study
Joumlnkoumlping is a middle sized Swedish town with 130000 inhabitants in in 2013 It is the Capital of the
Joumlnkoumlping County and is situated on the main transport roads between the three biggest cities in
Sweden namely Stockholm Gothenburg and Malmouml The Public Dental Service of Joumlnkoumlping County
also manages the Institute for Postgraduate Dental Education in Joumlnkoumlping The Joumlnkoumlping study
(Hugoson et al 2005 ab) with its 10-year repeated oral screenings with for the most part
standardized methods is one of few studies worldwide offering the capacity to do a ldquolongitudinalrdquo
evaluation of trends in saliva flow and buffer capacity in repeated cross-sectional population based
samples over a long time
AIM
The primary aim of the present study was to evaluate time trends for saliva flow rate and saliva buffer
capacity using the 10-year screenings in the Joumlnkoumlping study A second aim is to evaluate the
associations between saliva flow ratebuffer capacity and potential explanatory factors including
number of teeth chewing ability diet intake and medication
SUBJECTS AND METHODS
Study cohort
In the Joumlnkoumlping study independent cross-sectional selections of individuals in the age groups 3 5 10
15 20 30 40 50 60 70 and 80 years have been randomly selected from individuals residing in
Kristine Ljungarum Sofia and Jaumlrstorp parishes as defined in 1973 (by 2006 the two first parishes
merged into one and so did the two last in 2010) The examinations are done on a decennial basis
since 1973 saliva flow rate and buffer capacity was not measured in 1973 though The selected
individuals have been invited and in those who agreed to participate about a 100 in each age group
an extensive oral examination was performed under good clinical conditions (Hugoson et al 1986
1995 2005 ab) The age groups of 3 5 10 and 15 are not included in the present evaluation (Koch et
al 2009) At all screening occasions 130 randomly selected adult in each of the 10-year age group
were invited to participate (Huguson et al 2005) Due to a low participation rate in 2013 additionally
40 40 and 50 subjects were invited in the age groups of 30 40 and 50 years
5
Questionnaire
All participants answered a questionnaire in immediate connection to the examination In the
questionnaire the participants answered questions on the number of meals and snacks per day
medication and graded their subjective experience of xerostomia health tobacco use and ease of
chewing
Outcome variables
The outcome variables in the present study are flow rates of stimulated whole saliva and buffer
capacity of the same saliva from the screenings in 1983 1993 2003 and 2013
Saliva collection and buffer capacity analyses
Whole saliva stimulated by chewing on a 1 gram piece of paraffin was collected into graded test
tubes for 3 minutes Flow rates were calculated and buffer capacity analysed The analysis method of
the buffer capacity changed over the years In 1983 and 1993 it was done according to Ericssonrsquos
laboratory buffer capacity test (Ericsson 1959) In 2003 and 2013 chair-side simplified methods
(Dentobuff Strip Orion Diagnostica Espoo Finland GC Saliva Check GC Europe NV Leuven Belgium)
was used A study showed best agreement among results provided by strip-type systems in patients
with high buffering capacity all compared to Ericssonrsquos laboratory buffer capacity test (Cheaib et al
2012) Therefore buffer capacity measures were dichotomized into low and normal capacity ie ltpH
55 and ge pH 55 respectively
Fig 2 Correspondence between Ericssonrsquos laboratory buffer capacity test Dentobuff Strip and GC Saliva-Check The figure is drawn from Cheaib et al 2012
Potential explanatory or confounding variables
The following variables were evaluated for a potential explanatory effect or included as confounders in
statistical models Sex age number of teeth Eichner index subjective reported chewing capacity
dietary variables medication and periodontal health The Eichner index describes the number of
occlusal support zones in the mouth that is where occlusion (chewing) is supported with a maximum
of four support zones These are the molar support zone (left and right) and the premolar support
zone (left and right) If occlusion exists in all four support zones the occlusion is categorised as class A
and sub grouped if the support zones lacks teeth in either one or both of the jaws if there exists an
6
occlusion but at least one of the four support zones does not participate in the occlusion it is
categorised as class B which is sub grouped according to how many of the support zones that are
lacking if there are no occlusion or the individual is edentulous it is a class C sub grouped to whether
the individual is edentulous or have non-occluding teeth in either one or both jaws Tooth or implant
supported fixed dentures are considered to participate in the occlusion but removable dentures are
not (Eichner 1955) The number of teeth and the Eichner index does not include the wisdom teeth
ie maximum number is 28 teeth
Statistical analyses
Statistical analyses were performed for all subjects together and separately for men and women in 10-
year age strata using IBM SPSS version 22 (IBM Armonk NY USA) Statistical tests were two-sided and
p-values lt005 considered statistically significant Descriptive statistics include frequencies
proportions and means with measures of variation Differences in mean values for normally
distributed variables were tested with Studentacutes unpaired t-test or ANOVA followed by Bonferroni
post hoc tests where applicable Standardization for age andor sex was done by general linear
regression (glm) Non-normally distributed variables were tested by Chi2 ndashtest
Multivariate partial least square regression (PLS SIMCA 14 version 140 Umetrics AB Umearing
Sweden) was used to search for hidden structures in the data In contrast to traditional regression PLS
is suitable for data where the x variables co-vary and the group number is limited Variables were
autoscaled to unit variance and cross-validated prediction of Y calculated (Staringhle and Wold 1988)
Cross validation is done by a systematic prediction of 17th of the data by the remaining 67th of the
data The importance of each x variable in explaining the variation in y is displayed in a PLS loading plot
and the correlation coefficients in a bar plot with means and 95 CI Variables for which the 95 CI
does not include zero are statistically significant
Ethical aspects
The Joumlnkoumlping study is approved by the Linkoumlping Regional Ethical Review Board
7
RESULTS
Participants
The total number of participants in the four study years were 2509 (1204 men and 1305 women)
with a virtually equal distribution on sex and 10-year age groups at each screening occasions (Table 1)
The attendance rate was 772 in 1983 754 in 1993 690 in 2003 and 564 in 2013
Table 1 Numbers () of participants per study year in sex and 10-year age strata by study year
a) Participants turning the age during the study year
Identification of potential confounders
As a first step the associations between saliva flow rate and buffer capacity on the one hand and sex
and age on the other were analysed Univariate comparisons revealed that the mean saliva flow rate
was systematically higher in men than women in all age groups (Table 2 Fig 3) and that it differed
among the age groups (Table 2 Fig 3) The highest mean saliva flow rate in men and women was seen
at age 50 and 40 years respectively and thereafter flow rate decreased continuously in both sexes (Fig
3) The proportion with low saliva buffer capacity differed by age in men but not women (Table 2 Fig
4) Hence measures for screening year comparisons should be standardized for age or sex
Table 2 Saliva flow rate and buffer capacity by sex and 10-year age groups Unstandardized means and 95 CI for flow rate and proportions with a low saliva buffer capacity ie a final buffer pH lt55
a) Differences between means were tested with unpaired t-test (sex) or ANOVA (age) b) Differences in distributions were tested with a Chi
2-test
8
Fig 3 Unstandardized mean saliva flow rate with 95 CI in (A) men and (B) women)
Age
20 30 40 50 60 70 80
mL
min
00
05
10
15
20
Age
20 30 40 50 60 70 80
mLm
in
00
05
10
15
20
for p-005 and for plt001 for plt0001 when compared to all other age groups
Fig 4 Percentage of study subjects with low buffer capacity pH lt55 for (A) men (B) women)
for p-005 and for plt001 for plt0001 when compared with 1983
Thirty year time trends in saliva flow rate
Sex and age standardized means for saliva flow rates for all subjects differed significantly between the
screening years but they did not follow a linear trend over time (Fig 5A) The same pattern was seen
when men and women were analyzed separately with standardization for age (Fig 5B) and in sex and
age strata (data not shown) Thus mean flow rates in 1993 were significantly higher than in 1983 and
then again lower in 2003 and 2013 compared to 1993 Standardization for sex and age had very limited
effect on the mean values ie only the second decimal was affected compared to the means from the
univariate analyses
A B
A B
9
Fig 5 Mean (95 CI) of saliva flow rate by study year for (A) all subject and with standardization for age and sex and (B) for men and women standardized for age
Screening year
mLm
in
00
12
14
16
18
20
22
1983 1993 2003 2013
A
Screening year
mL
min
00
12
14
16
18
20
22Men
Women
1983 1993 2003 2013
B
for plt0001 compared to all other screening years
Identification of factors associated with saliva flow rate
As a final step all variables were included in multivariate PLS modeling to identify variables that were
associated with the saliva flow rate The PLS analysis identified that having a low buffer capacity being
a woman experiencing a feeling of dryness in the mouth having less occlusal support zones (Eichner
index) and having more daily meals of food was significantly associated with having a low saliva flow
rate whereas having more teeth was associated with higher saliva flow rate (Figs 6 7)
Variables indicated to be influential for flow rate by PLS were followed up in univariate
comparisons with standardization for age and sex as appropriate (Table 3) It was confirmed that
women had significantly lower flow rate than men as did subjects with low buffer capacity (pH lt55)
versus those with ldquonormalrdquo (pH ge55) capacity In addition mean flow rate decreased by increasing
experience of dry mouth and decreasing Eichner index but only those who had the highest number of
meals per day had had a significantly lower flow rate than others (Table 3)
10
Fig 6 Scatter plot of the relation between saliva secretion and the other variables of the study population
Fig 7 Coefficient plot of the correlation of stimulated salivation and other variables Where the error bars do not pass through the zero the correlation is significant (p lt005)
11
Table 3 Sex andor age standardized measures for variables identified as influential for saliva flow rate in the multivariate PLS model all screening years
Stimulated salivation mLmin mean (95 CI)
p-value between groups
Gender lt0001
Men (n=1178) 173 (168 ndash 179)
Women (n=1271) 148 (142 ndash 153)
Buffer capacitya lt0001
pH 55 and above (n=1108) 179 (174 ndash 185)
Below pH 55 (n=1267) 145 (140 ndash 150)
Subjective xerostomia lt0001
Never (n=904) 172 (167 ndash 178)
Occasionally (n=1215) 155 (150 ndash 161)
Often (n=200) 145 (132 ndash 158)
Always (n=31) 125 (092 ndash 158)
Number of teeth lt0001
0 to 4 (n=157) 128 (112 ndash 144)
5 to 9 (n=81) 122 (101 ndash 143)
10 to 14 (n=77) 124 (102 ndash 145)
15 to 19 (n=172) 130 (115 ndash 144)
20 to 24 (n=446) 150 (141 ndash 159)
25 to 28 (n=1516) 174 (168 ndash 179)
Eichner index lt0001
Class A (n=1777) 171 (166 ndash 175)
Class B (n=438) 133 (123 ndash 143)
Class C (n=227) 130 (116 ndash 143)
Daily meals 0013
One (n=142) 163 (147 ndash 178)
Two (n=711) 157 (150 ndash 164)
Three (n=1060) 164 (158 ndash 169)
Four (n=369) 159 (149 ndash 169)
Five or more (n=53) 120 (095 ndash 145) aThe analysis method changed between study years (see Method section)
Thirty years time trends in buffer capacity
Due to the shift in analysis method for buffer capacity estimation only measures from 1983 and 1993
could be compared and those from 2003 and 2013 As seen in Table 4 the proportion of individuals
with a low buffer capacity (pHlt55) was significantly higher in 1983 than 1993 and were lower in 2003
compared to 2013 To evaluate if the lower proportion of subjects in 1993 versus 1983 was associated
with saliva flow rate the saliva flow rate was compared in 10-year age groups of men and women with
a buffer pH lt55 and those with a buffer pHgt55 (Fig 8 AB) In 8 out of 14 strata mean flow rate was
significantly higher in those with buffer pH gt55 than those with a buffer pH lt55 For some of the age
groups a significant difference between buffer capacity and years are observed (Fig 4)
12
Table 4 Proportion () with a saliva buffer capacity pH lt55
Study year 1983 Study year 1993 p-value
1983 vs 1993
Study year 2003 Study year 2013 p-value
2003 vs 2013
Analysis method
Ericssonrsquos laboratory test
Ericssonrsquos laboratory test Dentobuff strip
GC Saliva Check Dentobuff strip
Men 593 783 lt0001 254 288 0218
Women 667 881 lt0001 320 353 0228
Differences in proportions are tested with a Chi2-test Significances are tested by t-test
Fig 8 Mean (95 CI) of saliva flow rate in (A) men (n=1149) and (B) women (n=1229) with buffer pH lt55 or
ge55 all screening years
for p-005 and for plt001 for plt0001
Identification of factors associated with buffer capacity
When all measured variables were included in a multivariate PLS model with low or ldquonormalrdquo saliva
buffer capacity as the dependent variables study year periodontal health a higher saliva flow rate
not being a smoker and number of teeth were significantly associated with having a normal buffer pH
(Fig 9) whereas less occlusal support zones (Eichner index) was associated with low buffer capacity
Variables indicated to be influential for buffer capacity by PLS were followed up in univariate
comparisons with standardization for age and sex as appropriate (Table 5) Thus more subjects had
low buffer capacity among those with low saliva flow rate among those with the moderate degree of
periodontal disease among smokers and those with the poorest Eichner index (Table 5)
A B
13
Fig 9 Coefficient plot of the correlation of buffer pH Negative numbers equals to higher buffer pH Where the error bars do not pass through the zero the correlation is significant (p lt005)
Table 5 Sex andor age standardized measures for variables identified as influential for saliva buffer pH in the multivariate PLS model Proportion of subjects with
buffer pH ge55 p-value between
groups
Saliva secretion lt0001
ge 10 mLmin (n=1818) 844
lt 10 mLmin (n=557) 697
Periodontal health classification lt0001
Healthy (n=441) 444
Gingivitis (n=508) 411
Periodontitis levis (n=589) 430
Periodontitis gravis (n=228) 417
Periodontitis complicata (n=93) 495
Smoking lt0001
Smoker (n=1852) 391
Non-smoker (n=445) 494
Number of teeth lt0001
0 to 4 (n=152) 309
5 to 9 (n=80) 288
10 to 14 (n=75) 347
15 to 19 (n=170) 388
20 to 24 (n=438) 418
25 to 28 (n=1463) 522
Eichner index 0013
Class A (n=1719) 518
Class B (n=430) 349
Class C (n=223) 296
14
DISCUSSION
The present study evaluated if saliva flow rate and saliva buffer capacity has changed in the
population from 1983 to 2013 and searched for factors associated with saliva flow rate and having a
poor or acceptable saliva buffer capacity respectively The main findings were that the present data
do not support the hypothesis that saliva flow rate has changed over the 30-year period but the
proportion with poor saliva buffer capacity tended to have increased between 1983 and 1993 where
the same analytic method was used
The strengths of the present study include that (i) all clinical assessments and samplings were
performed by experienced and calibrated dentists in well-equipped dental offices at all screening
rounds (ii) that the method for saliva collection was identical at each screening occasion and (iii) that
participants were randomly selected from population registers and represented a wide age range
Besides the weaknesses of a change in the buffer analysis method it is a weakness that stratification
for sex and age resulted in small groups in relation to the variation in the population This is especially
true for the higher age groups Further it cannot be excluded that the decreasing attendance rate ie
772 754 69 and 564 has resulted in an increasing selection bias The examination was free
for the participants but even with free screenings the attendance by those having a low socio-
economical background is lower compared to others (Zarrouk et al 2013) Another group that is likely
to not have attended for time reasons are busy healthy people which in fact is supported by that
extra subjects had to be invited in 2013 to get an acceptably sized group in middle-aged individuals
For the present study it can only be speculated on the potential selection bias but it may be
anticipated that health concerned subjects and those with an oral health related problem (including
dry mouth) are overrepresented in later years compared to in 1983 and 1993 when gt75 attended the
screening but that subjects with a socioeconomically weak background and worse dental status (but
not necessarily impaired saliva flow rate and buffer capacity) might be underrepresented (Wamala et
al 2006)
The incitement for the present longitudinal evaluation of saliva flow rate was that mean saliva
flow rates of 25 and 20 mLmin were reported for men and women respectively in a screening
performed in 1995 (Bergdahl 2000) The screening was based on approximately 1400 Swedish adults
Those flow rates were considerably higher than values reported in studies from the 1970ies (Heintze et
al 1983) It was plausible to hypothesize that the mean flow rate had increased in the population
given that the number of teeth had increased people were on average taller (an overall larger
anatomy and physiology thus larger glands) and many medications inhibiting saliva secretion were
over the years substituted for non-inhibitory alternatives Notably the flow rate in 1993 was higher
than in 1983 and approached the levels reported by Bergdahl (2000) It was therefore surprising to
find that the mean flow rates were again close to the 1983 levels in 2003 and 2013 Collection of
15
chewing stimulated saliva is a very well standardized and easy-to-perform measure which makes the
variations in flow rate hard to explain with anything but a selection bias in later screening years or
regression towards the mean Still it seems unlikely that two independent screenings performed in
the same time window (early 1990ies) and giving a very similar result would be influenced by the same
bias or systematic error However at present the conclusion is that the present data do not support
that the saliva flow rate has increased in the population over time but future large scale population-
based studies have to follow up on this The implication of an increased salivation paired with a lower
buffer capacity of the same saliva might confer the need of adjusted cut off values when it comes to
normal or sub-normal saliva flow rate or a completely new way of measuring the properties of saliva
as this would imply that even though the saliva flow rate increased its buffering capacity would have
decreased
A common finding in medical studies is that different measures are not independent ie body
weight is correlated with height saliva flow rate is correlated with buffer capacity number of teeth is
correlated with Eichner index etc This is an obstacle in traditional linear or logistic regression In the
present study the multivariate projection method PLS was selected The rational for choosing that
method is that it is insensitive to covariation among variables and it works well also in smaller samples
The drawback is that it does not report standardized central measures and variation Therefore PLS
was followed up with separate analyses where standardization for age andor sex was applied
As described the method for saliva buffer capacity was changed in 2003 The rational for this was
to save manpower since the Ericsson method need laboratory personal and logistics when it comes to
transporting the saliva When comparing the proportions with low buffer capacity in 1993 with 2003
and 2013 it is evident that the two methods did not perform as well as claimed by Cheaib et al (2012)
The comparisons for this factor were therefore done with greatest restriction ie dichotomized to
poor or good
The factors associated with saliva flow rate ie sex age in women subjective xerostomia
number of teeth occlusal support zones and buffer capacity are in accordance with what has been
reported in previous studies (Ikebe et al 2012 Heintze et al 1983) Thus though the results in the
present study are mainly confirmatory they are of significant clinical importance Subjective
xerostomia is not an explanatory factor but rather a symptom of possible hyposalivation Notably
both number of teeth and Eichner index correlated with stimulated saliva secretion a finding that
should be remembered when choosing between the options of extracting a tooth or save it Thus
quality of life and medicalbiological aspects must be considered and likely more so in patients with
impaired saliva secretion those taking medicine causing hyposalivation those that have short dental
arches or previous extractions or tooth aplasia One may speculate if fixed prosthodontics should be
16
encouraged in patients with lost teeth to improve the occlusal support zones and hence saliva
secretion Further studies are needed to evaluate this
CONCLUSION
The present study found chewing stimulated saliva secretion to be associated with sex number of
teeth Eichner index subjective dry mouth and buffer capacity but it does not support that saliva
secretion has increased over time in the population Saliva secretion and its buffer components is of
outmost importance for the oral environment Hyposalivation and an associated low buffer capacity
puts a person at risk for both dental diseases and oral infection including candida infections and
overall health problems as acute respiratory infection (Iwabuchi et al 2012) and an increase over time
might reduce the risk Given that several factors associated with improved saliva flow rate has taken
place in the population future studies should follow up on the results to confirm or reject that the
present results are not due to a selection bias
ACKNOWLEDGEMENTS
Prof Ingegerd Johansson DDS PhD without whom this essay could not have been written
The personal support of Dr Elisabeth Waumlrnberg Gerdin DDS PhD
The board of the Joumlnkoumlping Studies especially the chairman Dr Ola Norderyd DDS PhD
The County Council of Vaumlsterbotten who allowed me to take time to write this essay
17
REFERENCES
Bardow A Lagerloumlf F Nauntofte B Tenovuo J The role of saliva In Fejerskov O Kidd E (eds) Dental
Caries The Disease and Its Clinical Management 2nd
ed Oxford Wiley-Blackwell 2008 189-208
Bergdahl M Salivary flow and oral complaints in adult dental patients Community Dent Oral Epidemiol
20002859-66
Birkhed D Heintze U Salivary secretion rate buffer capacity and pH In Tenovuo J (ed) Human
Saliva Clinical Chemistry and Microbiology Vol I Boca Raton (FL) CRC Press 1989 25-73
Carpenter GH The secretion components and properties of saliva Annu Rev Food Sci Technol
20134267-276
Cheaib Z Ganss C Lamanda A Turgut MD Lussi A Comparison of three strip-type tests and two
laboratory methods for salivary buffering analysis Odontology 201210067-75
Dawes C Wood CM The contribution of oral minor mucous gland secretions to the volume of whole
saliva in man Arch Oral Biol 197318337-342
Edgar M Dawes C OrsquoMullane D (eds) Saliva and Oral Health 3rd
ed London British Dental
Association 2004
Eichner K Uumlber eine gruppeneinteilung der luumlckengebisse fuumlr der prothetik Dtsch Zahnaumlrztl Z 1955
101831-1834
Ekstroumlm J Autonomic control of salivary secretion Proc Finn Dent Soc 198985323-331 361-363
Ericsson Y Clinical investigations of the salivary buffering action Acta Odontol Scand 195917131ndash
165
Fujibayashi T Sugai S Miyasaka N Hayashi Y Tsubota K Revised Japanese criteria for Sjoumlgrens
syndrome (1999) availability and validity Mod Rheumatol 200414425-434
Garbacz G Kołodziej B Koziolek M Weitchies W Klein S An automated system for minitoring and
regulating the pH of bicarbonate buffers AAPS PharmSciTech 201314517-522
Heintze U Birkhed D Bjoumlrn H Secretion rate and buffer effect of resting and stimulated whole saliva as
a function of age and sex Swed Dent J 19837227ndash238
Hugoson A Koch G Bergendal T Hallonsten AL Laurell L Lundgren D et al Oral health of individuals
aged 3-80 years in Jonkoping Sweden in 1973 and 1983 I A review of findings on dental care
habits and knowledge of oral health Swed Dent J 198610103-117
Hugoson A Koch G Bergendal T Hallonsten AL Slotte C Thorstensson B et al Oral health of
individuals aged 3-80 years in Jonkoping Sweden in 1973 1983 and 1993 I Review of findings on
dental care habits and knowledge of oral health Swed Dent J 199519225-241
Hugoson A Koch G Goumlthberg C Helkimo AN Lundin SA Norderyd O Sjoumldin B Sondell K Oral health
of individuals aged 3-80 years in Joumlnkoumlping Sweden during 30 years (1973-2003) I Review of
findings on dental care habits and knowledge of oral health Swed Dent J 2005a29125-138
Hugoson A Koch G Goumlthberg C Helkimo AN Lundin SA Norderyd O et al Oral health of individuals
aged 3ndash80 years in Jonkoping Sweden during 30 years (1973ndash2003) II Review of clinical and
Ikebe K Matsuda K Kagawa R Enoki K Okada T Yoshida M Maeda Y Masticatory performance in
older subjects with varying degrees of tooth loss J Dent 20124071-76
Iwabuchi H Fujibayashi T Yamane GY Imai H Nakao H Relationship between hyposalivation and
acute respiratory infection in dental outpatients Gerontology 201258205-11
Jensen Kjeilen JC Brodin P Aars H Berg T Parotid salivary flow in response to mechanical and
gustatory stimulation in man Acta Physiol Scand 1987131169-175
Koch G Kreiborg S Andreasen JO Eruption and shedding of teeth In Koch G Poulsen S (eds)
Pediatric Dentistry A clinical approach 2nd
ed Oxford Wiley-Blackwell 2009 197-211
Marsh PD Microbiology of dental plaque biofilms and their role in oral health and caries Dent Clin
North Am 201054441-454
Naumlrhi TO Prevalence of subjective feelings of dry mouth in the elderly J Dent Res 19947320ndash25
Oumlsterberg T Birkhed D Johansson C Svanborg A Longitudinal study of stimulated whole saliva in an
elderly population Scand J Dent Res 1992100340-345
Samnieng P Ueno M Shinada K Zaitsu T Wright FA Kawaguchi Y Association of hyposalivation with
oral fuction nutrition and oral health in community-dwelling elderly Thai Community Dent Health
201229117-123
Schuurs A Pathology of the hard dental tissues West Sussex Wiley-Blackwell 2013
Scott BJ Jassamwalia R Linden RW The masticatory-parotid salivary reflex in edentulous subjects J
Oral Rehabil 19982528-33
Selwitz RH Ismail AI Pitts NB Dental caries Lancet 200736951-59
Staringhle L Wold S Multivariate data analysis and experimental design in biomedical research Prog Med
Chem 198825291-338
Wamala S Merlo J Bostroumlm G Inequity in access to dental care services explains current
socioeconomic disparities in oral health the Swedish National Surveys of Public Health 2004-2005 J
Epidemiol Community Health 2006601027-1033
Zarrouk M Holst J Malina M Lindblad B Wann-Hansson C Rosvall M Gottsaumlter A The importance of
socioeconomic factors for compliance and outcome at screening for abdominal aortic aneurysm in
65-year-old men J Vasc Surg 20135850-55
1
30-YEAR (1983-2013) TRENDS IN SALIVA FLOW RATE AND SALIVA BUFFER CAPACITY ANALYSES
FROM 10-YEAR REPEATED CROSS-SECTIONAL POPULATION SAMPLES IN THE JOumlNKOumlPING AREA
Author Aringgren Martin
INTRODUCTION
Saliva plays a crucial role in protection of the oral cavity (Edgar et al 2004) Thus flushing (clearance
and exposure) of the soft and hard tissues and biological effects of saliva constituents such as pH-
regulatory components inorganic components participating in the de- and remineralisation of tooth
tissues and proteins peptides lipids and carbohydrates affecting microbial growth and colonization
are of importance Saliva flow and oral muscle activities are the key determinants for flushing Lack of
proper amount of saliva may lead to discomfort for the individual such as a burning sensation
dysphagia speech impairment taste disturbances and increase risk for dental caries (Bergdahl 2000
Naumlrhi 1994)
Knowledge of population based reference values are important for identification of conditions
which need to be observed or treated For saliva flow rate the cut off values 07 mLmin to 10
mLmin and 01 mLmin for stimulated and unstimlated saliva respectively are applied for
hyposalivation (Fujibayashi et al 2004 Bergdahl 2000) Values above are considered normal If the
flow rate has drifted in the population such as indicated in Bergdahl (2000) these cut-offs may be
misleading and should eventually be questioned For buffer capacity the cut off for low capacity is a
final pH lt55 after addition of a standardized amount of acid This is a reflection of the pKa value and
buffer range of the bicarbonate ion The buffer capacity is crucial for dental erosion caries and
microbiota ecology as a pH below 55 creates an environment of demineralisation and supports a
bacteria dysbiosis characterized by acidophilic and aciduric bacteria (Schuurs 2013 Marsh 2010)
Saliva is produced by the three paired major salivary glands the parotid submandibular and
sublingual glands and numerous minor salivary glands distributed in the oral mucosa In an
unstimulated state the submandibular glands account for two thirds of the secreted saliva When
stimulated secretion from the parotid glands increases proportionally the most and accounts for up
to 60 of the secretion (Carpenter 2013) The parotid glands are comprised of serous and the
submandibular glands of both mucous and serous acinar cells with a majority of the latter In
comparison to the parotid saliva saliva from the submandibular glands is more viscous and mucin-rich
The smallest of the major salivary glands are the sublingual glands which produce highly viscous
mucous saliva that accounts for a few per cent of the total amount of saliva The minor glands
2
contribute for le10 of the secreted saliva They produce mainly mucous saliva rich in secretory IgA
(Dawes and Wood 1973)
Secretion of saliva is regulated by the parasympathetic and the sympathetic systems Secretion is
initiated by afferent signals from three cranial nerves the trigeminal (V) facial (VII) and
glossopharyngeal (IX) nerves The afferent innervation stems from mechanoreceptors in the
periodontal ligament and chemoreceptors in the taste buds The stimulated salivation is increased by
frequency of chewing cycles force of chewing and number of teeth occluding on the object chewed
upon The increase in salivation from the parotid glands is higher on the ipsilateral side but the
contralateral side also shows an increase in salivation (Jensen Kjeilen et al 1987 Samnieng et al
2012) The masticatory-salivary reflex is initiated not only by the periodontal ligament as it has been
shown that edentulous subjects also have an increase in parotid salivation when chewing (Scott et al
1998) The salivation is also dependent on conditioned reflexes controlled through the autonomic
nervous system This central control inhibits unstimulated salivation during sleep fear and mental
depression and excites salivation during fight The classical parasympathetic and sympathetic
transmitters ie acetylcholine and either noradrenaline (norepinephrine) or adrenaline (epinephrine)
respectively are the main activators of salivation (Ekstroumlm 1989) The parasympathetic system mainly
regulates water secretion and the sympathetic protein secretion The complex regulation of the
secretory cells makes secretion sensitive to numerous external and intrinsic factors Examples of such
factors are medications diseases stress water balance starvation and lack of chewing stimulation
(Bardow et al 2008)
Water secretion from the acinar cells is driven by intracellular loss of potassium to the
insterstitium and chloride to the lumen The loss of potassium to the extracellular fluid forces sodium
into the lumen causing a salty environment which drives water through osmosis into the lumen of
the salivary gland During its way through the duct of the salivary gland the primary saliva is modified
in a flow rate related fashion by selective reabsorptionsecretion of electrolytes Among the
electrolytes that are affected during secretion are sodium and bicarbonate (Bardow et al 2008)
One important aspect of saliva action is its contribution to remineralisation of the teeth as well as
preventing demineralisation by buffering (Selwitz et al 2007) After each intake of food the pH in
dental plaque drops and remains at that state until soluble carbohydrates are cleared from the oral
cavity and the acids produced from bacteria are neutralized (buffered)
The magnitude and the time period below the tooth tissue critical pH are determined by the
amount of acid produced by bacteria by the buffer capacity of the saliva and saliva flushing There are
three systems in saliva that contribute in buffering the pH after an acid attack and striving it above the
3
critical pH for caries development in tooth enamel (around 55) or dentin (around 62) as well as
erosion
Fig 1 Schematic drawing of the complex interactions and interplays in the caries process The figure is redrawn from Selwitz RH Ismail AI Pitts NB 2007 Dental caries Lancet 36951ndash59
The phosphate buffer system - In stimulated saliva phosphate is mainly in the form of hydrogen
phosphate compared to in unstimulated saliva where it is mainly dihydrogen phosphate Thus
stimulated saliva is a bit more alkaline than unstimulated saliva The acid dissociation constant or pK
for the equilibrium between these two phosphate forms is around pH 7 At this neutral pH the
phosphate buffer system is most efficient with a buffer span of about plusmn 1 pH unit around the pK As
the phosphate concentration in saliva decreases with the flow rate of saliva the contribution from the
phosphate buffer system to the overall buffer capacity ranges from around 50 in unstimulated saliva
to 10 in highly stimulated saliva (Bardow et al 2008)
The bicarbonate buffer system - As opposed to the phosphate buffer system the contribution of
the bicarbonate buffer system to the buffering effect increases when saliva flow rate increases In
unstimulated saliva this system contributes to less than 50 and in stimulated saliva more than 90
of the buffering effect The pK value for the bicarbonate buffer system lies around pH 6 with a
buffering effect up to pH 7 (Bardow et al 2008) The lower limit of a pure bicarbonate buffer system is
at pH 55 under that the effect of this system is minimal (Garbacz et al 2013) In addition CO2 in gas
form is undersaturated versus the ambient air leading to loss of CO2 and a so called phase buffering
(Bardow et al 2008 Birkhed and Heintze 1989)
The protein buffer system - Saliva proteins and peptides can act as buffers if the pH exceeds (both
positively and negatively) their isoelectric points leading to the proteins accepting or releasing
protons Many of the saliva proteins have their isoelectric points at pH 5 and pH 9 making them
effective as buffers at alkaline environments as well as when the pH drops below the critical value for
4
demineralisation Although generally less effective than the two first buffer system the local
concentration of proteinspeptides may render local significant buffer effect (Bardow et al 2008)
The Joumlnkoumlping study
Joumlnkoumlping is a middle sized Swedish town with 130000 inhabitants in in 2013 It is the Capital of the
Joumlnkoumlping County and is situated on the main transport roads between the three biggest cities in
Sweden namely Stockholm Gothenburg and Malmouml The Public Dental Service of Joumlnkoumlping County
also manages the Institute for Postgraduate Dental Education in Joumlnkoumlping The Joumlnkoumlping study
(Hugoson et al 2005 ab) with its 10-year repeated oral screenings with for the most part
standardized methods is one of few studies worldwide offering the capacity to do a ldquolongitudinalrdquo
evaluation of trends in saliva flow and buffer capacity in repeated cross-sectional population based
samples over a long time
AIM
The primary aim of the present study was to evaluate time trends for saliva flow rate and saliva buffer
capacity using the 10-year screenings in the Joumlnkoumlping study A second aim is to evaluate the
associations between saliva flow ratebuffer capacity and potential explanatory factors including
number of teeth chewing ability diet intake and medication
SUBJECTS AND METHODS
Study cohort
In the Joumlnkoumlping study independent cross-sectional selections of individuals in the age groups 3 5 10
15 20 30 40 50 60 70 and 80 years have been randomly selected from individuals residing in
Kristine Ljungarum Sofia and Jaumlrstorp parishes as defined in 1973 (by 2006 the two first parishes
merged into one and so did the two last in 2010) The examinations are done on a decennial basis
since 1973 saliva flow rate and buffer capacity was not measured in 1973 though The selected
individuals have been invited and in those who agreed to participate about a 100 in each age group
an extensive oral examination was performed under good clinical conditions (Hugoson et al 1986
1995 2005 ab) The age groups of 3 5 10 and 15 are not included in the present evaluation (Koch et
al 2009) At all screening occasions 130 randomly selected adult in each of the 10-year age group
were invited to participate (Huguson et al 2005) Due to a low participation rate in 2013 additionally
40 40 and 50 subjects were invited in the age groups of 30 40 and 50 years
5
Questionnaire
All participants answered a questionnaire in immediate connection to the examination In the
questionnaire the participants answered questions on the number of meals and snacks per day
medication and graded their subjective experience of xerostomia health tobacco use and ease of
chewing
Outcome variables
The outcome variables in the present study are flow rates of stimulated whole saliva and buffer
capacity of the same saliva from the screenings in 1983 1993 2003 and 2013
Saliva collection and buffer capacity analyses
Whole saliva stimulated by chewing on a 1 gram piece of paraffin was collected into graded test
tubes for 3 minutes Flow rates were calculated and buffer capacity analysed The analysis method of
the buffer capacity changed over the years In 1983 and 1993 it was done according to Ericssonrsquos
laboratory buffer capacity test (Ericsson 1959) In 2003 and 2013 chair-side simplified methods
(Dentobuff Strip Orion Diagnostica Espoo Finland GC Saliva Check GC Europe NV Leuven Belgium)
was used A study showed best agreement among results provided by strip-type systems in patients
with high buffering capacity all compared to Ericssonrsquos laboratory buffer capacity test (Cheaib et al
2012) Therefore buffer capacity measures were dichotomized into low and normal capacity ie ltpH
55 and ge pH 55 respectively
Fig 2 Correspondence between Ericssonrsquos laboratory buffer capacity test Dentobuff Strip and GC Saliva-Check The figure is drawn from Cheaib et al 2012
Potential explanatory or confounding variables
The following variables were evaluated for a potential explanatory effect or included as confounders in
statistical models Sex age number of teeth Eichner index subjective reported chewing capacity
dietary variables medication and periodontal health The Eichner index describes the number of
occlusal support zones in the mouth that is where occlusion (chewing) is supported with a maximum
of four support zones These are the molar support zone (left and right) and the premolar support
zone (left and right) If occlusion exists in all four support zones the occlusion is categorised as class A
and sub grouped if the support zones lacks teeth in either one or both of the jaws if there exists an
6
occlusion but at least one of the four support zones does not participate in the occlusion it is
categorised as class B which is sub grouped according to how many of the support zones that are
lacking if there are no occlusion or the individual is edentulous it is a class C sub grouped to whether
the individual is edentulous or have non-occluding teeth in either one or both jaws Tooth or implant
supported fixed dentures are considered to participate in the occlusion but removable dentures are
not (Eichner 1955) The number of teeth and the Eichner index does not include the wisdom teeth
ie maximum number is 28 teeth
Statistical analyses
Statistical analyses were performed for all subjects together and separately for men and women in 10-
year age strata using IBM SPSS version 22 (IBM Armonk NY USA) Statistical tests were two-sided and
p-values lt005 considered statistically significant Descriptive statistics include frequencies
proportions and means with measures of variation Differences in mean values for normally
distributed variables were tested with Studentacutes unpaired t-test or ANOVA followed by Bonferroni
post hoc tests where applicable Standardization for age andor sex was done by general linear
regression (glm) Non-normally distributed variables were tested by Chi2 ndashtest
Multivariate partial least square regression (PLS SIMCA 14 version 140 Umetrics AB Umearing
Sweden) was used to search for hidden structures in the data In contrast to traditional regression PLS
is suitable for data where the x variables co-vary and the group number is limited Variables were
autoscaled to unit variance and cross-validated prediction of Y calculated (Staringhle and Wold 1988)
Cross validation is done by a systematic prediction of 17th of the data by the remaining 67th of the
data The importance of each x variable in explaining the variation in y is displayed in a PLS loading plot
and the correlation coefficients in a bar plot with means and 95 CI Variables for which the 95 CI
does not include zero are statistically significant
Ethical aspects
The Joumlnkoumlping study is approved by the Linkoumlping Regional Ethical Review Board
7
RESULTS
Participants
The total number of participants in the four study years were 2509 (1204 men and 1305 women)
with a virtually equal distribution on sex and 10-year age groups at each screening occasions (Table 1)
The attendance rate was 772 in 1983 754 in 1993 690 in 2003 and 564 in 2013
Table 1 Numbers () of participants per study year in sex and 10-year age strata by study year
a) Participants turning the age during the study year
Identification of potential confounders
As a first step the associations between saliva flow rate and buffer capacity on the one hand and sex
and age on the other were analysed Univariate comparisons revealed that the mean saliva flow rate
was systematically higher in men than women in all age groups (Table 2 Fig 3) and that it differed
among the age groups (Table 2 Fig 3) The highest mean saliva flow rate in men and women was seen
at age 50 and 40 years respectively and thereafter flow rate decreased continuously in both sexes (Fig
3) The proportion with low saliva buffer capacity differed by age in men but not women (Table 2 Fig
4) Hence measures for screening year comparisons should be standardized for age or sex
Table 2 Saliva flow rate and buffer capacity by sex and 10-year age groups Unstandardized means and 95 CI for flow rate and proportions with a low saliva buffer capacity ie a final buffer pH lt55
a) Differences between means were tested with unpaired t-test (sex) or ANOVA (age) b) Differences in distributions were tested with a Chi
2-test
8
Fig 3 Unstandardized mean saliva flow rate with 95 CI in (A) men and (B) women)
Age
20 30 40 50 60 70 80
mL
min
00
05
10
15
20
Age
20 30 40 50 60 70 80
mLm
in
00
05
10
15
20
for p-005 and for plt001 for plt0001 when compared to all other age groups
Fig 4 Percentage of study subjects with low buffer capacity pH lt55 for (A) men (B) women)
for p-005 and for plt001 for plt0001 when compared with 1983
Thirty year time trends in saliva flow rate
Sex and age standardized means for saliva flow rates for all subjects differed significantly between the
screening years but they did not follow a linear trend over time (Fig 5A) The same pattern was seen
when men and women were analyzed separately with standardization for age (Fig 5B) and in sex and
age strata (data not shown) Thus mean flow rates in 1993 were significantly higher than in 1983 and
then again lower in 2003 and 2013 compared to 1993 Standardization for sex and age had very limited
effect on the mean values ie only the second decimal was affected compared to the means from the
univariate analyses
A B
A B
9
Fig 5 Mean (95 CI) of saliva flow rate by study year for (A) all subject and with standardization for age and sex and (B) for men and women standardized for age
Screening year
mLm
in
00
12
14
16
18
20
22
1983 1993 2003 2013
A
Screening year
mL
min
00
12
14
16
18
20
22Men
Women
1983 1993 2003 2013
B
for plt0001 compared to all other screening years
Identification of factors associated with saliva flow rate
As a final step all variables were included in multivariate PLS modeling to identify variables that were
associated with the saliva flow rate The PLS analysis identified that having a low buffer capacity being
a woman experiencing a feeling of dryness in the mouth having less occlusal support zones (Eichner
index) and having more daily meals of food was significantly associated with having a low saliva flow
rate whereas having more teeth was associated with higher saliva flow rate (Figs 6 7)
Variables indicated to be influential for flow rate by PLS were followed up in univariate
comparisons with standardization for age and sex as appropriate (Table 3) It was confirmed that
women had significantly lower flow rate than men as did subjects with low buffer capacity (pH lt55)
versus those with ldquonormalrdquo (pH ge55) capacity In addition mean flow rate decreased by increasing
experience of dry mouth and decreasing Eichner index but only those who had the highest number of
meals per day had had a significantly lower flow rate than others (Table 3)
10
Fig 6 Scatter plot of the relation between saliva secretion and the other variables of the study population
Fig 7 Coefficient plot of the correlation of stimulated salivation and other variables Where the error bars do not pass through the zero the correlation is significant (p lt005)
11
Table 3 Sex andor age standardized measures for variables identified as influential for saliva flow rate in the multivariate PLS model all screening years
Stimulated salivation mLmin mean (95 CI)
p-value between groups
Gender lt0001
Men (n=1178) 173 (168 ndash 179)
Women (n=1271) 148 (142 ndash 153)
Buffer capacitya lt0001
pH 55 and above (n=1108) 179 (174 ndash 185)
Below pH 55 (n=1267) 145 (140 ndash 150)
Subjective xerostomia lt0001
Never (n=904) 172 (167 ndash 178)
Occasionally (n=1215) 155 (150 ndash 161)
Often (n=200) 145 (132 ndash 158)
Always (n=31) 125 (092 ndash 158)
Number of teeth lt0001
0 to 4 (n=157) 128 (112 ndash 144)
5 to 9 (n=81) 122 (101 ndash 143)
10 to 14 (n=77) 124 (102 ndash 145)
15 to 19 (n=172) 130 (115 ndash 144)
20 to 24 (n=446) 150 (141 ndash 159)
25 to 28 (n=1516) 174 (168 ndash 179)
Eichner index lt0001
Class A (n=1777) 171 (166 ndash 175)
Class B (n=438) 133 (123 ndash 143)
Class C (n=227) 130 (116 ndash 143)
Daily meals 0013
One (n=142) 163 (147 ndash 178)
Two (n=711) 157 (150 ndash 164)
Three (n=1060) 164 (158 ndash 169)
Four (n=369) 159 (149 ndash 169)
Five or more (n=53) 120 (095 ndash 145) aThe analysis method changed between study years (see Method section)
Thirty years time trends in buffer capacity
Due to the shift in analysis method for buffer capacity estimation only measures from 1983 and 1993
could be compared and those from 2003 and 2013 As seen in Table 4 the proportion of individuals
with a low buffer capacity (pHlt55) was significantly higher in 1983 than 1993 and were lower in 2003
compared to 2013 To evaluate if the lower proportion of subjects in 1993 versus 1983 was associated
with saliva flow rate the saliva flow rate was compared in 10-year age groups of men and women with
a buffer pH lt55 and those with a buffer pHgt55 (Fig 8 AB) In 8 out of 14 strata mean flow rate was
significantly higher in those with buffer pH gt55 than those with a buffer pH lt55 For some of the age
groups a significant difference between buffer capacity and years are observed (Fig 4)
12
Table 4 Proportion () with a saliva buffer capacity pH lt55
Study year 1983 Study year 1993 p-value
1983 vs 1993
Study year 2003 Study year 2013 p-value
2003 vs 2013
Analysis method
Ericssonrsquos laboratory test
Ericssonrsquos laboratory test Dentobuff strip
GC Saliva Check Dentobuff strip
Men 593 783 lt0001 254 288 0218
Women 667 881 lt0001 320 353 0228
Differences in proportions are tested with a Chi2-test Significances are tested by t-test
Fig 8 Mean (95 CI) of saliva flow rate in (A) men (n=1149) and (B) women (n=1229) with buffer pH lt55 or
ge55 all screening years
for p-005 and for plt001 for plt0001
Identification of factors associated with buffer capacity
When all measured variables were included in a multivariate PLS model with low or ldquonormalrdquo saliva
buffer capacity as the dependent variables study year periodontal health a higher saliva flow rate
not being a smoker and number of teeth were significantly associated with having a normal buffer pH
(Fig 9) whereas less occlusal support zones (Eichner index) was associated with low buffer capacity
Variables indicated to be influential for buffer capacity by PLS were followed up in univariate
comparisons with standardization for age and sex as appropriate (Table 5) Thus more subjects had
low buffer capacity among those with low saliva flow rate among those with the moderate degree of
periodontal disease among smokers and those with the poorest Eichner index (Table 5)
A B
13
Fig 9 Coefficient plot of the correlation of buffer pH Negative numbers equals to higher buffer pH Where the error bars do not pass through the zero the correlation is significant (p lt005)
Table 5 Sex andor age standardized measures for variables identified as influential for saliva buffer pH in the multivariate PLS model Proportion of subjects with
buffer pH ge55 p-value between
groups
Saliva secretion lt0001
ge 10 mLmin (n=1818) 844
lt 10 mLmin (n=557) 697
Periodontal health classification lt0001
Healthy (n=441) 444
Gingivitis (n=508) 411
Periodontitis levis (n=589) 430
Periodontitis gravis (n=228) 417
Periodontitis complicata (n=93) 495
Smoking lt0001
Smoker (n=1852) 391
Non-smoker (n=445) 494
Number of teeth lt0001
0 to 4 (n=152) 309
5 to 9 (n=80) 288
10 to 14 (n=75) 347
15 to 19 (n=170) 388
20 to 24 (n=438) 418
25 to 28 (n=1463) 522
Eichner index 0013
Class A (n=1719) 518
Class B (n=430) 349
Class C (n=223) 296
14
DISCUSSION
The present study evaluated if saliva flow rate and saliva buffer capacity has changed in the
population from 1983 to 2013 and searched for factors associated with saliva flow rate and having a
poor or acceptable saliva buffer capacity respectively The main findings were that the present data
do not support the hypothesis that saliva flow rate has changed over the 30-year period but the
proportion with poor saliva buffer capacity tended to have increased between 1983 and 1993 where
the same analytic method was used
The strengths of the present study include that (i) all clinical assessments and samplings were
performed by experienced and calibrated dentists in well-equipped dental offices at all screening
rounds (ii) that the method for saliva collection was identical at each screening occasion and (iii) that
participants were randomly selected from population registers and represented a wide age range
Besides the weaknesses of a change in the buffer analysis method it is a weakness that stratification
for sex and age resulted in small groups in relation to the variation in the population This is especially
true for the higher age groups Further it cannot be excluded that the decreasing attendance rate ie
772 754 69 and 564 has resulted in an increasing selection bias The examination was free
for the participants but even with free screenings the attendance by those having a low socio-
economical background is lower compared to others (Zarrouk et al 2013) Another group that is likely
to not have attended for time reasons are busy healthy people which in fact is supported by that
extra subjects had to be invited in 2013 to get an acceptably sized group in middle-aged individuals
For the present study it can only be speculated on the potential selection bias but it may be
anticipated that health concerned subjects and those with an oral health related problem (including
dry mouth) are overrepresented in later years compared to in 1983 and 1993 when gt75 attended the
screening but that subjects with a socioeconomically weak background and worse dental status (but
not necessarily impaired saliva flow rate and buffer capacity) might be underrepresented (Wamala et
al 2006)
The incitement for the present longitudinal evaluation of saliva flow rate was that mean saliva
flow rates of 25 and 20 mLmin were reported for men and women respectively in a screening
performed in 1995 (Bergdahl 2000) The screening was based on approximately 1400 Swedish adults
Those flow rates were considerably higher than values reported in studies from the 1970ies (Heintze et
al 1983) It was plausible to hypothesize that the mean flow rate had increased in the population
given that the number of teeth had increased people were on average taller (an overall larger
anatomy and physiology thus larger glands) and many medications inhibiting saliva secretion were
over the years substituted for non-inhibitory alternatives Notably the flow rate in 1993 was higher
than in 1983 and approached the levels reported by Bergdahl (2000) It was therefore surprising to
find that the mean flow rates were again close to the 1983 levels in 2003 and 2013 Collection of
15
chewing stimulated saliva is a very well standardized and easy-to-perform measure which makes the
variations in flow rate hard to explain with anything but a selection bias in later screening years or
regression towards the mean Still it seems unlikely that two independent screenings performed in
the same time window (early 1990ies) and giving a very similar result would be influenced by the same
bias or systematic error However at present the conclusion is that the present data do not support
that the saliva flow rate has increased in the population over time but future large scale population-
based studies have to follow up on this The implication of an increased salivation paired with a lower
buffer capacity of the same saliva might confer the need of adjusted cut off values when it comes to
normal or sub-normal saliva flow rate or a completely new way of measuring the properties of saliva
as this would imply that even though the saliva flow rate increased its buffering capacity would have
decreased
A common finding in medical studies is that different measures are not independent ie body
weight is correlated with height saliva flow rate is correlated with buffer capacity number of teeth is
correlated with Eichner index etc This is an obstacle in traditional linear or logistic regression In the
present study the multivariate projection method PLS was selected The rational for choosing that
method is that it is insensitive to covariation among variables and it works well also in smaller samples
The drawback is that it does not report standardized central measures and variation Therefore PLS
was followed up with separate analyses where standardization for age andor sex was applied
As described the method for saliva buffer capacity was changed in 2003 The rational for this was
to save manpower since the Ericsson method need laboratory personal and logistics when it comes to
transporting the saliva When comparing the proportions with low buffer capacity in 1993 with 2003
and 2013 it is evident that the two methods did not perform as well as claimed by Cheaib et al (2012)
The comparisons for this factor were therefore done with greatest restriction ie dichotomized to
poor or good
The factors associated with saliva flow rate ie sex age in women subjective xerostomia
number of teeth occlusal support zones and buffer capacity are in accordance with what has been
reported in previous studies (Ikebe et al 2012 Heintze et al 1983) Thus though the results in the
present study are mainly confirmatory they are of significant clinical importance Subjective
xerostomia is not an explanatory factor but rather a symptom of possible hyposalivation Notably
both number of teeth and Eichner index correlated with stimulated saliva secretion a finding that
should be remembered when choosing between the options of extracting a tooth or save it Thus
quality of life and medicalbiological aspects must be considered and likely more so in patients with
impaired saliva secretion those taking medicine causing hyposalivation those that have short dental
arches or previous extractions or tooth aplasia One may speculate if fixed prosthodontics should be
16
encouraged in patients with lost teeth to improve the occlusal support zones and hence saliva
secretion Further studies are needed to evaluate this
CONCLUSION
The present study found chewing stimulated saliva secretion to be associated with sex number of
teeth Eichner index subjective dry mouth and buffer capacity but it does not support that saliva
secretion has increased over time in the population Saliva secretion and its buffer components is of
outmost importance for the oral environment Hyposalivation and an associated low buffer capacity
puts a person at risk for both dental diseases and oral infection including candida infections and
overall health problems as acute respiratory infection (Iwabuchi et al 2012) and an increase over time
might reduce the risk Given that several factors associated with improved saliva flow rate has taken
place in the population future studies should follow up on the results to confirm or reject that the
present results are not due to a selection bias
ACKNOWLEDGEMENTS
Prof Ingegerd Johansson DDS PhD without whom this essay could not have been written
The personal support of Dr Elisabeth Waumlrnberg Gerdin DDS PhD
The board of the Joumlnkoumlping Studies especially the chairman Dr Ola Norderyd DDS PhD
The County Council of Vaumlsterbotten who allowed me to take time to write this essay
17
REFERENCES
Bardow A Lagerloumlf F Nauntofte B Tenovuo J The role of saliva In Fejerskov O Kidd E (eds) Dental
Caries The Disease and Its Clinical Management 2nd
ed Oxford Wiley-Blackwell 2008 189-208
Bergdahl M Salivary flow and oral complaints in adult dental patients Community Dent Oral Epidemiol
20002859-66
Birkhed D Heintze U Salivary secretion rate buffer capacity and pH In Tenovuo J (ed) Human
Saliva Clinical Chemistry and Microbiology Vol I Boca Raton (FL) CRC Press 1989 25-73
Carpenter GH The secretion components and properties of saliva Annu Rev Food Sci Technol
20134267-276
Cheaib Z Ganss C Lamanda A Turgut MD Lussi A Comparison of three strip-type tests and two
laboratory methods for salivary buffering analysis Odontology 201210067-75
Dawes C Wood CM The contribution of oral minor mucous gland secretions to the volume of whole
saliva in man Arch Oral Biol 197318337-342
Edgar M Dawes C OrsquoMullane D (eds) Saliva and Oral Health 3rd
ed London British Dental
Association 2004
Eichner K Uumlber eine gruppeneinteilung der luumlckengebisse fuumlr der prothetik Dtsch Zahnaumlrztl Z 1955
101831-1834
Ekstroumlm J Autonomic control of salivary secretion Proc Finn Dent Soc 198985323-331 361-363
Ericsson Y Clinical investigations of the salivary buffering action Acta Odontol Scand 195917131ndash
165
Fujibayashi T Sugai S Miyasaka N Hayashi Y Tsubota K Revised Japanese criteria for Sjoumlgrens
syndrome (1999) availability and validity Mod Rheumatol 200414425-434
Garbacz G Kołodziej B Koziolek M Weitchies W Klein S An automated system for minitoring and
regulating the pH of bicarbonate buffers AAPS PharmSciTech 201314517-522
Heintze U Birkhed D Bjoumlrn H Secretion rate and buffer effect of resting and stimulated whole saliva as
a function of age and sex Swed Dent J 19837227ndash238
Hugoson A Koch G Bergendal T Hallonsten AL Laurell L Lundgren D et al Oral health of individuals
aged 3-80 years in Jonkoping Sweden in 1973 and 1983 I A review of findings on dental care
habits and knowledge of oral health Swed Dent J 198610103-117
Hugoson A Koch G Bergendal T Hallonsten AL Slotte C Thorstensson B et al Oral health of
individuals aged 3-80 years in Jonkoping Sweden in 1973 1983 and 1993 I Review of findings on
dental care habits and knowledge of oral health Swed Dent J 199519225-241
Hugoson A Koch G Goumlthberg C Helkimo AN Lundin SA Norderyd O Sjoumldin B Sondell K Oral health
of individuals aged 3-80 years in Joumlnkoumlping Sweden during 30 years (1973-2003) I Review of
findings on dental care habits and knowledge of oral health Swed Dent J 2005a29125-138
Hugoson A Koch G Goumlthberg C Helkimo AN Lundin SA Norderyd O et al Oral health of individuals
aged 3ndash80 years in Jonkoping Sweden during 30 years (1973ndash2003) II Review of clinical and
Ikebe K Matsuda K Kagawa R Enoki K Okada T Yoshida M Maeda Y Masticatory performance in
older subjects with varying degrees of tooth loss J Dent 20124071-76
Iwabuchi H Fujibayashi T Yamane GY Imai H Nakao H Relationship between hyposalivation and
acute respiratory infection in dental outpatients Gerontology 201258205-11
Jensen Kjeilen JC Brodin P Aars H Berg T Parotid salivary flow in response to mechanical and
gustatory stimulation in man Acta Physiol Scand 1987131169-175
Koch G Kreiborg S Andreasen JO Eruption and shedding of teeth In Koch G Poulsen S (eds)
Pediatric Dentistry A clinical approach 2nd
ed Oxford Wiley-Blackwell 2009 197-211
Marsh PD Microbiology of dental plaque biofilms and their role in oral health and caries Dent Clin
North Am 201054441-454
Naumlrhi TO Prevalence of subjective feelings of dry mouth in the elderly J Dent Res 19947320ndash25
Oumlsterberg T Birkhed D Johansson C Svanborg A Longitudinal study of stimulated whole saliva in an
elderly population Scand J Dent Res 1992100340-345
Samnieng P Ueno M Shinada K Zaitsu T Wright FA Kawaguchi Y Association of hyposalivation with
oral fuction nutrition and oral health in community-dwelling elderly Thai Community Dent Health
201229117-123
Schuurs A Pathology of the hard dental tissues West Sussex Wiley-Blackwell 2013
Scott BJ Jassamwalia R Linden RW The masticatory-parotid salivary reflex in edentulous subjects J
Oral Rehabil 19982528-33
Selwitz RH Ismail AI Pitts NB Dental caries Lancet 200736951-59
Staringhle L Wold S Multivariate data analysis and experimental design in biomedical research Prog Med
Chem 198825291-338
Wamala S Merlo J Bostroumlm G Inequity in access to dental care services explains current
socioeconomic disparities in oral health the Swedish National Surveys of Public Health 2004-2005 J
Epidemiol Community Health 2006601027-1033
Zarrouk M Holst J Malina M Lindblad B Wann-Hansson C Rosvall M Gottsaumlter A The importance of
socioeconomic factors for compliance and outcome at screening for abdominal aortic aneurysm in
65-year-old men J Vasc Surg 20135850-55
5
Questionnaire
All participants answered a questionnaire in immediate connection to the examination In the
questionnaire the participants answered questions on the number of meals and snacks per day
medication and graded their subjective experience of xerostomia health tobacco use and ease of
chewing
Outcome variables
The outcome variables in the present study are flow rates of stimulated whole saliva and buffer
capacity of the same saliva from the screenings in 1983 1993 2003 and 2013
Saliva collection and buffer capacity analyses
Whole saliva stimulated by chewing on a 1 gram piece of paraffin was collected into graded test
tubes for 3 minutes Flow rates were calculated and buffer capacity analysed The analysis method of
the buffer capacity changed over the years In 1983 and 1993 it was done according to Ericssonrsquos
laboratory buffer capacity test (Ericsson 1959) In 2003 and 2013 chair-side simplified methods
(Dentobuff Strip Orion Diagnostica Espoo Finland GC Saliva Check GC Europe NV Leuven Belgium)
was used A study showed best agreement among results provided by strip-type systems in patients
with high buffering capacity all compared to Ericssonrsquos laboratory buffer capacity test (Cheaib et al
2012) Therefore buffer capacity measures were dichotomized into low and normal capacity ie ltpH
55 and ge pH 55 respectively
Fig 2 Correspondence between Ericssonrsquos laboratory buffer capacity test Dentobuff Strip and GC Saliva-Check The figure is drawn from Cheaib et al 2012
Potential explanatory or confounding variables
The following variables were evaluated for a potential explanatory effect or included as confounders in
statistical models Sex age number of teeth Eichner index subjective reported chewing capacity
dietary variables medication and periodontal health The Eichner index describes the number of
occlusal support zones in the mouth that is where occlusion (chewing) is supported with a maximum
of four support zones These are the molar support zone (left and right) and the premolar support
zone (left and right) If occlusion exists in all four support zones the occlusion is categorised as class A
and sub grouped if the support zones lacks teeth in either one or both of the jaws if there exists an
6
occlusion but at least one of the four support zones does not participate in the occlusion it is
categorised as class B which is sub grouped according to how many of the support zones that are
lacking if there are no occlusion or the individual is edentulous it is a class C sub grouped to whether
the individual is edentulous or have non-occluding teeth in either one or both jaws Tooth or implant
supported fixed dentures are considered to participate in the occlusion but removable dentures are
not (Eichner 1955) The number of teeth and the Eichner index does not include the wisdom teeth
ie maximum number is 28 teeth
Statistical analyses
Statistical analyses were performed for all subjects together and separately for men and women in 10-
year age strata using IBM SPSS version 22 (IBM Armonk NY USA) Statistical tests were two-sided and
p-values lt005 considered statistically significant Descriptive statistics include frequencies
proportions and means with measures of variation Differences in mean values for normally
distributed variables were tested with Studentacutes unpaired t-test or ANOVA followed by Bonferroni
post hoc tests where applicable Standardization for age andor sex was done by general linear
regression (glm) Non-normally distributed variables were tested by Chi2 ndashtest
Multivariate partial least square regression (PLS SIMCA 14 version 140 Umetrics AB Umearing
Sweden) was used to search for hidden structures in the data In contrast to traditional regression PLS
is suitable for data where the x variables co-vary and the group number is limited Variables were
autoscaled to unit variance and cross-validated prediction of Y calculated (Staringhle and Wold 1988)
Cross validation is done by a systematic prediction of 17th of the data by the remaining 67th of the
data The importance of each x variable in explaining the variation in y is displayed in a PLS loading plot
and the correlation coefficients in a bar plot with means and 95 CI Variables for which the 95 CI
does not include zero are statistically significant
Ethical aspects
The Joumlnkoumlping study is approved by the Linkoumlping Regional Ethical Review Board
7
RESULTS
Participants
The total number of participants in the four study years were 2509 (1204 men and 1305 women)
with a virtually equal distribution on sex and 10-year age groups at each screening occasions (Table 1)
The attendance rate was 772 in 1983 754 in 1993 690 in 2003 and 564 in 2013
Table 1 Numbers () of participants per study year in sex and 10-year age strata by study year
a) Participants turning the age during the study year
Identification of potential confounders
As a first step the associations between saliva flow rate and buffer capacity on the one hand and sex
and age on the other were analysed Univariate comparisons revealed that the mean saliva flow rate
was systematically higher in men than women in all age groups (Table 2 Fig 3) and that it differed
among the age groups (Table 2 Fig 3) The highest mean saliva flow rate in men and women was seen
at age 50 and 40 years respectively and thereafter flow rate decreased continuously in both sexes (Fig
3) The proportion with low saliva buffer capacity differed by age in men but not women (Table 2 Fig
4) Hence measures for screening year comparisons should be standardized for age or sex
Table 2 Saliva flow rate and buffer capacity by sex and 10-year age groups Unstandardized means and 95 CI for flow rate and proportions with a low saliva buffer capacity ie a final buffer pH lt55
a) Differences between means were tested with unpaired t-test (sex) or ANOVA (age) b) Differences in distributions were tested with a Chi
2-test
8
Fig 3 Unstandardized mean saliva flow rate with 95 CI in (A) men and (B) women)
Age
20 30 40 50 60 70 80
mL
min
00
05
10
15
20
Age
20 30 40 50 60 70 80
mLm
in
00
05
10
15
20
for p-005 and for plt001 for plt0001 when compared to all other age groups
Fig 4 Percentage of study subjects with low buffer capacity pH lt55 for (A) men (B) women)
for p-005 and for plt001 for plt0001 when compared with 1983
Thirty year time trends in saliva flow rate
Sex and age standardized means for saliva flow rates for all subjects differed significantly between the
screening years but they did not follow a linear trend over time (Fig 5A) The same pattern was seen
when men and women were analyzed separately with standardization for age (Fig 5B) and in sex and
age strata (data not shown) Thus mean flow rates in 1993 were significantly higher than in 1983 and
then again lower in 2003 and 2013 compared to 1993 Standardization for sex and age had very limited
effect on the mean values ie only the second decimal was affected compared to the means from the
univariate analyses
A B
A B
9
Fig 5 Mean (95 CI) of saliva flow rate by study year for (A) all subject and with standardization for age and sex and (B) for men and women standardized for age
Screening year
mLm
in
00
12
14
16
18
20
22
1983 1993 2003 2013
A
Screening year
mL
min
00
12
14
16
18
20
22Men
Women
1983 1993 2003 2013
B
for plt0001 compared to all other screening years
Identification of factors associated with saliva flow rate
As a final step all variables were included in multivariate PLS modeling to identify variables that were
associated with the saliva flow rate The PLS analysis identified that having a low buffer capacity being
a woman experiencing a feeling of dryness in the mouth having less occlusal support zones (Eichner
index) and having more daily meals of food was significantly associated with having a low saliva flow
rate whereas having more teeth was associated with higher saliva flow rate (Figs 6 7)
Variables indicated to be influential for flow rate by PLS were followed up in univariate
comparisons with standardization for age and sex as appropriate (Table 3) It was confirmed that
women had significantly lower flow rate than men as did subjects with low buffer capacity (pH lt55)
versus those with ldquonormalrdquo (pH ge55) capacity In addition mean flow rate decreased by increasing
experience of dry mouth and decreasing Eichner index but only those who had the highest number of
meals per day had had a significantly lower flow rate than others (Table 3)
10
Fig 6 Scatter plot of the relation between saliva secretion and the other variables of the study population
Fig 7 Coefficient plot of the correlation of stimulated salivation and other variables Where the error bars do not pass through the zero the correlation is significant (p lt005)
11
Table 3 Sex andor age standardized measures for variables identified as influential for saliva flow rate in the multivariate PLS model all screening years
Stimulated salivation mLmin mean (95 CI)
p-value between groups
Gender lt0001
Men (n=1178) 173 (168 ndash 179)
Women (n=1271) 148 (142 ndash 153)
Buffer capacitya lt0001
pH 55 and above (n=1108) 179 (174 ndash 185)
Below pH 55 (n=1267) 145 (140 ndash 150)
Subjective xerostomia lt0001
Never (n=904) 172 (167 ndash 178)
Occasionally (n=1215) 155 (150 ndash 161)
Often (n=200) 145 (132 ndash 158)
Always (n=31) 125 (092 ndash 158)
Number of teeth lt0001
0 to 4 (n=157) 128 (112 ndash 144)
5 to 9 (n=81) 122 (101 ndash 143)
10 to 14 (n=77) 124 (102 ndash 145)
15 to 19 (n=172) 130 (115 ndash 144)
20 to 24 (n=446) 150 (141 ndash 159)
25 to 28 (n=1516) 174 (168 ndash 179)
Eichner index lt0001
Class A (n=1777) 171 (166 ndash 175)
Class B (n=438) 133 (123 ndash 143)
Class C (n=227) 130 (116 ndash 143)
Daily meals 0013
One (n=142) 163 (147 ndash 178)
Two (n=711) 157 (150 ndash 164)
Three (n=1060) 164 (158 ndash 169)
Four (n=369) 159 (149 ndash 169)
Five or more (n=53) 120 (095 ndash 145) aThe analysis method changed between study years (see Method section)
Thirty years time trends in buffer capacity
Due to the shift in analysis method for buffer capacity estimation only measures from 1983 and 1993
could be compared and those from 2003 and 2013 As seen in Table 4 the proportion of individuals
with a low buffer capacity (pHlt55) was significantly higher in 1983 than 1993 and were lower in 2003
compared to 2013 To evaluate if the lower proportion of subjects in 1993 versus 1983 was associated
with saliva flow rate the saliva flow rate was compared in 10-year age groups of men and women with
a buffer pH lt55 and those with a buffer pHgt55 (Fig 8 AB) In 8 out of 14 strata mean flow rate was
significantly higher in those with buffer pH gt55 than those with a buffer pH lt55 For some of the age
groups a significant difference between buffer capacity and years are observed (Fig 4)
12
Table 4 Proportion () with a saliva buffer capacity pH lt55
Study year 1983 Study year 1993 p-value
1983 vs 1993
Study year 2003 Study year 2013 p-value
2003 vs 2013
Analysis method
Ericssonrsquos laboratory test
Ericssonrsquos laboratory test Dentobuff strip
GC Saliva Check Dentobuff strip
Men 593 783 lt0001 254 288 0218
Women 667 881 lt0001 320 353 0228
Differences in proportions are tested with a Chi2-test Significances are tested by t-test
Fig 8 Mean (95 CI) of saliva flow rate in (A) men (n=1149) and (B) women (n=1229) with buffer pH lt55 or
ge55 all screening years
for p-005 and for plt001 for plt0001
Identification of factors associated with buffer capacity
When all measured variables were included in a multivariate PLS model with low or ldquonormalrdquo saliva
buffer capacity as the dependent variables study year periodontal health a higher saliva flow rate
not being a smoker and number of teeth were significantly associated with having a normal buffer pH
(Fig 9) whereas less occlusal support zones (Eichner index) was associated with low buffer capacity
Variables indicated to be influential for buffer capacity by PLS were followed up in univariate
comparisons with standardization for age and sex as appropriate (Table 5) Thus more subjects had
low buffer capacity among those with low saliva flow rate among those with the moderate degree of
periodontal disease among smokers and those with the poorest Eichner index (Table 5)
A B
13
Fig 9 Coefficient plot of the correlation of buffer pH Negative numbers equals to higher buffer pH Where the error bars do not pass through the zero the correlation is significant (p lt005)
Table 5 Sex andor age standardized measures for variables identified as influential for saliva buffer pH in the multivariate PLS model Proportion of subjects with
buffer pH ge55 p-value between
groups
Saliva secretion lt0001
ge 10 mLmin (n=1818) 844
lt 10 mLmin (n=557) 697
Periodontal health classification lt0001
Healthy (n=441) 444
Gingivitis (n=508) 411
Periodontitis levis (n=589) 430
Periodontitis gravis (n=228) 417
Periodontitis complicata (n=93) 495
Smoking lt0001
Smoker (n=1852) 391
Non-smoker (n=445) 494
Number of teeth lt0001
0 to 4 (n=152) 309
5 to 9 (n=80) 288
10 to 14 (n=75) 347
15 to 19 (n=170) 388
20 to 24 (n=438) 418
25 to 28 (n=1463) 522
Eichner index 0013
Class A (n=1719) 518
Class B (n=430) 349
Class C (n=223) 296
14
DISCUSSION
The present study evaluated if saliva flow rate and saliva buffer capacity has changed in the
population from 1983 to 2013 and searched for factors associated with saliva flow rate and having a
poor or acceptable saliva buffer capacity respectively The main findings were that the present data
do not support the hypothesis that saliva flow rate has changed over the 30-year period but the
proportion with poor saliva buffer capacity tended to have increased between 1983 and 1993 where
the same analytic method was used
The strengths of the present study include that (i) all clinical assessments and samplings were
performed by experienced and calibrated dentists in well-equipped dental offices at all screening
rounds (ii) that the method for saliva collection was identical at each screening occasion and (iii) that
participants were randomly selected from population registers and represented a wide age range
Besides the weaknesses of a change in the buffer analysis method it is a weakness that stratification
for sex and age resulted in small groups in relation to the variation in the population This is especially
true for the higher age groups Further it cannot be excluded that the decreasing attendance rate ie
772 754 69 and 564 has resulted in an increasing selection bias The examination was free
for the participants but even with free screenings the attendance by those having a low socio-
economical background is lower compared to others (Zarrouk et al 2013) Another group that is likely
to not have attended for time reasons are busy healthy people which in fact is supported by that
extra subjects had to be invited in 2013 to get an acceptably sized group in middle-aged individuals
For the present study it can only be speculated on the potential selection bias but it may be
anticipated that health concerned subjects and those with an oral health related problem (including
dry mouth) are overrepresented in later years compared to in 1983 and 1993 when gt75 attended the
screening but that subjects with a socioeconomically weak background and worse dental status (but
not necessarily impaired saliva flow rate and buffer capacity) might be underrepresented (Wamala et
al 2006)
The incitement for the present longitudinal evaluation of saliva flow rate was that mean saliva
flow rates of 25 and 20 mLmin were reported for men and women respectively in a screening
performed in 1995 (Bergdahl 2000) The screening was based on approximately 1400 Swedish adults
Those flow rates were considerably higher than values reported in studies from the 1970ies (Heintze et
al 1983) It was plausible to hypothesize that the mean flow rate had increased in the population
given that the number of teeth had increased people were on average taller (an overall larger
anatomy and physiology thus larger glands) and many medications inhibiting saliva secretion were
over the years substituted for non-inhibitory alternatives Notably the flow rate in 1993 was higher
than in 1983 and approached the levels reported by Bergdahl (2000) It was therefore surprising to
find that the mean flow rates were again close to the 1983 levels in 2003 and 2013 Collection of
15
chewing stimulated saliva is a very well standardized and easy-to-perform measure which makes the
variations in flow rate hard to explain with anything but a selection bias in later screening years or
regression towards the mean Still it seems unlikely that two independent screenings performed in
the same time window (early 1990ies) and giving a very similar result would be influenced by the same
bias or systematic error However at present the conclusion is that the present data do not support
that the saliva flow rate has increased in the population over time but future large scale population-
based studies have to follow up on this The implication of an increased salivation paired with a lower
buffer capacity of the same saliva might confer the need of adjusted cut off values when it comes to
normal or sub-normal saliva flow rate or a completely new way of measuring the properties of saliva
as this would imply that even though the saliva flow rate increased its buffering capacity would have
decreased
A common finding in medical studies is that different measures are not independent ie body
weight is correlated with height saliva flow rate is correlated with buffer capacity number of teeth is
correlated with Eichner index etc This is an obstacle in traditional linear or logistic regression In the
present study the multivariate projection method PLS was selected The rational for choosing that
method is that it is insensitive to covariation among variables and it works well also in smaller samples
The drawback is that it does not report standardized central measures and variation Therefore PLS
was followed up with separate analyses where standardization for age andor sex was applied
As described the method for saliva buffer capacity was changed in 2003 The rational for this was
to save manpower since the Ericsson method need laboratory personal and logistics when it comes to
transporting the saliva When comparing the proportions with low buffer capacity in 1993 with 2003
and 2013 it is evident that the two methods did not perform as well as claimed by Cheaib et al (2012)
The comparisons for this factor were therefore done with greatest restriction ie dichotomized to
poor or good
The factors associated with saliva flow rate ie sex age in women subjective xerostomia
number of teeth occlusal support zones and buffer capacity are in accordance with what has been
reported in previous studies (Ikebe et al 2012 Heintze et al 1983) Thus though the results in the
present study are mainly confirmatory they are of significant clinical importance Subjective
xerostomia is not an explanatory factor but rather a symptom of possible hyposalivation Notably
both number of teeth and Eichner index correlated with stimulated saliva secretion a finding that
should be remembered when choosing between the options of extracting a tooth or save it Thus
quality of life and medicalbiological aspects must be considered and likely more so in patients with
impaired saliva secretion those taking medicine causing hyposalivation those that have short dental
arches or previous extractions or tooth aplasia One may speculate if fixed prosthodontics should be
16
encouraged in patients with lost teeth to improve the occlusal support zones and hence saliva
secretion Further studies are needed to evaluate this
CONCLUSION
The present study found chewing stimulated saliva secretion to be associated with sex number of
teeth Eichner index subjective dry mouth and buffer capacity but it does not support that saliva
secretion has increased over time in the population Saliva secretion and its buffer components is of
outmost importance for the oral environment Hyposalivation and an associated low buffer capacity
puts a person at risk for both dental diseases and oral infection including candida infections and
overall health problems as acute respiratory infection (Iwabuchi et al 2012) and an increase over time
might reduce the risk Given that several factors associated with improved saliva flow rate has taken
place in the population future studies should follow up on the results to confirm or reject that the
present results are not due to a selection bias
ACKNOWLEDGEMENTS
Prof Ingegerd Johansson DDS PhD without whom this essay could not have been written
The personal support of Dr Elisabeth Waumlrnberg Gerdin DDS PhD
The board of the Joumlnkoumlping Studies especially the chairman Dr Ola Norderyd DDS PhD
The County Council of Vaumlsterbotten who allowed me to take time to write this essay
17
REFERENCES
Bardow A Lagerloumlf F Nauntofte B Tenovuo J The role of saliva In Fejerskov O Kidd E (eds) Dental
Caries The Disease and Its Clinical Management 2nd
ed Oxford Wiley-Blackwell 2008 189-208
Bergdahl M Salivary flow and oral complaints in adult dental patients Community Dent Oral Epidemiol
20002859-66
Birkhed D Heintze U Salivary secretion rate buffer capacity and pH In Tenovuo J (ed) Human
Saliva Clinical Chemistry and Microbiology Vol I Boca Raton (FL) CRC Press 1989 25-73
Carpenter GH The secretion components and properties of saliva Annu Rev Food Sci Technol
20134267-276
Cheaib Z Ganss C Lamanda A Turgut MD Lussi A Comparison of three strip-type tests and two
laboratory methods for salivary buffering analysis Odontology 201210067-75
Dawes C Wood CM The contribution of oral minor mucous gland secretions to the volume of whole
saliva in man Arch Oral Biol 197318337-342
Edgar M Dawes C OrsquoMullane D (eds) Saliva and Oral Health 3rd
ed London British Dental
Association 2004
Eichner K Uumlber eine gruppeneinteilung der luumlckengebisse fuumlr der prothetik Dtsch Zahnaumlrztl Z 1955
101831-1834
Ekstroumlm J Autonomic control of salivary secretion Proc Finn Dent Soc 198985323-331 361-363
Ericsson Y Clinical investigations of the salivary buffering action Acta Odontol Scand 195917131ndash
165
Fujibayashi T Sugai S Miyasaka N Hayashi Y Tsubota K Revised Japanese criteria for Sjoumlgrens
syndrome (1999) availability and validity Mod Rheumatol 200414425-434
Garbacz G Kołodziej B Koziolek M Weitchies W Klein S An automated system for minitoring and
regulating the pH of bicarbonate buffers AAPS PharmSciTech 201314517-522
Heintze U Birkhed D Bjoumlrn H Secretion rate and buffer effect of resting and stimulated whole saliva as
a function of age and sex Swed Dent J 19837227ndash238
Hugoson A Koch G Bergendal T Hallonsten AL Laurell L Lundgren D et al Oral health of individuals
aged 3-80 years in Jonkoping Sweden in 1973 and 1983 I A review of findings on dental care
habits and knowledge of oral health Swed Dent J 198610103-117
Hugoson A Koch G Bergendal T Hallonsten AL Slotte C Thorstensson B et al Oral health of
individuals aged 3-80 years in Jonkoping Sweden in 1973 1983 and 1993 I Review of findings on
dental care habits and knowledge of oral health Swed Dent J 199519225-241
Hugoson A Koch G Goumlthberg C Helkimo AN Lundin SA Norderyd O Sjoumldin B Sondell K Oral health
of individuals aged 3-80 years in Joumlnkoumlping Sweden during 30 years (1973-2003) I Review of
findings on dental care habits and knowledge of oral health Swed Dent J 2005a29125-138
Hugoson A Koch G Goumlthberg C Helkimo AN Lundin SA Norderyd O et al Oral health of individuals
aged 3ndash80 years in Jonkoping Sweden during 30 years (1973ndash2003) II Review of clinical and
Ikebe K Matsuda K Kagawa R Enoki K Okada T Yoshida M Maeda Y Masticatory performance in
older subjects with varying degrees of tooth loss J Dent 20124071-76
Iwabuchi H Fujibayashi T Yamane GY Imai H Nakao H Relationship between hyposalivation and
acute respiratory infection in dental outpatients Gerontology 201258205-11
Jensen Kjeilen JC Brodin P Aars H Berg T Parotid salivary flow in response to mechanical and
gustatory stimulation in man Acta Physiol Scand 1987131169-175
Koch G Kreiborg S Andreasen JO Eruption and shedding of teeth In Koch G Poulsen S (eds)
Pediatric Dentistry A clinical approach 2nd
ed Oxford Wiley-Blackwell 2009 197-211
Marsh PD Microbiology of dental plaque biofilms and their role in oral health and caries Dent Clin
North Am 201054441-454
Naumlrhi TO Prevalence of subjective feelings of dry mouth in the elderly J Dent Res 19947320ndash25
Oumlsterberg T Birkhed D Johansson C Svanborg A Longitudinal study of stimulated whole saliva in an
elderly population Scand J Dent Res 1992100340-345
Samnieng P Ueno M Shinada K Zaitsu T Wright FA Kawaguchi Y Association of hyposalivation with
oral fuction nutrition and oral health in community-dwelling elderly Thai Community Dent Health
201229117-123
Schuurs A Pathology of the hard dental tissues West Sussex Wiley-Blackwell 2013
Scott BJ Jassamwalia R Linden RW The masticatory-parotid salivary reflex in edentulous subjects J
Oral Rehabil 19982528-33
Selwitz RH Ismail AI Pitts NB Dental caries Lancet 200736951-59
Staringhle L Wold S Multivariate data analysis and experimental design in biomedical research Prog Med
Chem 198825291-338
Wamala S Merlo J Bostroumlm G Inequity in access to dental care services explains current
socioeconomic disparities in oral health the Swedish National Surveys of Public Health 2004-2005 J
Epidemiol Community Health 2006601027-1033
Zarrouk M Holst J Malina M Lindblad B Wann-Hansson C Rosvall M Gottsaumlter A The importance of
socioeconomic factors for compliance and outcome at screening for abdominal aortic aneurysm in
65-year-old men J Vasc Surg 20135850-55
13
Fig 9 Coefficient plot of the correlation of buffer pH Negative numbers equals to higher buffer pH Where the error bars do not pass through the zero the correlation is significant (p lt005)
Table 5 Sex andor age standardized measures for variables identified as influential for saliva buffer pH in the multivariate PLS model Proportion of subjects with
buffer pH ge55 p-value between
groups
Saliva secretion lt0001
ge 10 mLmin (n=1818) 844
lt 10 mLmin (n=557) 697
Periodontal health classification lt0001
Healthy (n=441) 444
Gingivitis (n=508) 411
Periodontitis levis (n=589) 430
Periodontitis gravis (n=228) 417
Periodontitis complicata (n=93) 495
Smoking lt0001
Smoker (n=1852) 391
Non-smoker (n=445) 494
Number of teeth lt0001
0 to 4 (n=152) 309
5 to 9 (n=80) 288
10 to 14 (n=75) 347
15 to 19 (n=170) 388
20 to 24 (n=438) 418
25 to 28 (n=1463) 522
Eichner index 0013
Class A (n=1719) 518
Class B (n=430) 349
Class C (n=223) 296
14
DISCUSSION
The present study evaluated if saliva flow rate and saliva buffer capacity has changed in the
population from 1983 to 2013 and searched for factors associated with saliva flow rate and having a
poor or acceptable saliva buffer capacity respectively The main findings were that the present data
do not support the hypothesis that saliva flow rate has changed over the 30-year period but the
proportion with poor saliva buffer capacity tended to have increased between 1983 and 1993 where
the same analytic method was used
The strengths of the present study include that (i) all clinical assessments and samplings were
performed by experienced and calibrated dentists in well-equipped dental offices at all screening
rounds (ii) that the method for saliva collection was identical at each screening occasion and (iii) that
participants were randomly selected from population registers and represented a wide age range
Besides the weaknesses of a change in the buffer analysis method it is a weakness that stratification
for sex and age resulted in small groups in relation to the variation in the population This is especially
true for the higher age groups Further it cannot be excluded that the decreasing attendance rate ie
772 754 69 and 564 has resulted in an increasing selection bias The examination was free
for the participants but even with free screenings the attendance by those having a low socio-
economical background is lower compared to others (Zarrouk et al 2013) Another group that is likely
to not have attended for time reasons are busy healthy people which in fact is supported by that
extra subjects had to be invited in 2013 to get an acceptably sized group in middle-aged individuals
For the present study it can only be speculated on the potential selection bias but it may be
anticipated that health concerned subjects and those with an oral health related problem (including
dry mouth) are overrepresented in later years compared to in 1983 and 1993 when gt75 attended the
screening but that subjects with a socioeconomically weak background and worse dental status (but
not necessarily impaired saliva flow rate and buffer capacity) might be underrepresented (Wamala et
al 2006)
The incitement for the present longitudinal evaluation of saliva flow rate was that mean saliva
flow rates of 25 and 20 mLmin were reported for men and women respectively in a screening
performed in 1995 (Bergdahl 2000) The screening was based on approximately 1400 Swedish adults
Those flow rates were considerably higher than values reported in studies from the 1970ies (Heintze et
al 1983) It was plausible to hypothesize that the mean flow rate had increased in the population
given that the number of teeth had increased people were on average taller (an overall larger
anatomy and physiology thus larger glands) and many medications inhibiting saliva secretion were
over the years substituted for non-inhibitory alternatives Notably the flow rate in 1993 was higher
than in 1983 and approached the levels reported by Bergdahl (2000) It was therefore surprising to
find that the mean flow rates were again close to the 1983 levels in 2003 and 2013 Collection of
15
chewing stimulated saliva is a very well standardized and easy-to-perform measure which makes the
variations in flow rate hard to explain with anything but a selection bias in later screening years or
regression towards the mean Still it seems unlikely that two independent screenings performed in
the same time window (early 1990ies) and giving a very similar result would be influenced by the same
bias or systematic error However at present the conclusion is that the present data do not support
that the saliva flow rate has increased in the population over time but future large scale population-
based studies have to follow up on this The implication of an increased salivation paired with a lower
buffer capacity of the same saliva might confer the need of adjusted cut off values when it comes to
normal or sub-normal saliva flow rate or a completely new way of measuring the properties of saliva
as this would imply that even though the saliva flow rate increased its buffering capacity would have
decreased
A common finding in medical studies is that different measures are not independent ie body
weight is correlated with height saliva flow rate is correlated with buffer capacity number of teeth is
correlated with Eichner index etc This is an obstacle in traditional linear or logistic regression In the
present study the multivariate projection method PLS was selected The rational for choosing that
method is that it is insensitive to covariation among variables and it works well also in smaller samples
The drawback is that it does not report standardized central measures and variation Therefore PLS
was followed up with separate analyses where standardization for age andor sex was applied
As described the method for saliva buffer capacity was changed in 2003 The rational for this was
to save manpower since the Ericsson method need laboratory personal and logistics when it comes to
transporting the saliva When comparing the proportions with low buffer capacity in 1993 with 2003
and 2013 it is evident that the two methods did not perform as well as claimed by Cheaib et al (2012)
The comparisons for this factor were therefore done with greatest restriction ie dichotomized to
poor or good
The factors associated with saliva flow rate ie sex age in women subjective xerostomia
number of teeth occlusal support zones and buffer capacity are in accordance with what has been
reported in previous studies (Ikebe et al 2012 Heintze et al 1983) Thus though the results in the
present study are mainly confirmatory they are of significant clinical importance Subjective
xerostomia is not an explanatory factor but rather a symptom of possible hyposalivation Notably
both number of teeth and Eichner index correlated with stimulated saliva secretion a finding that
should be remembered when choosing between the options of extracting a tooth or save it Thus
quality of life and medicalbiological aspects must be considered and likely more so in patients with
impaired saliva secretion those taking medicine causing hyposalivation those that have short dental
arches or previous extractions or tooth aplasia One may speculate if fixed prosthodontics should be
16
encouraged in patients with lost teeth to improve the occlusal support zones and hence saliva
secretion Further studies are needed to evaluate this
CONCLUSION
The present study found chewing stimulated saliva secretion to be associated with sex number of
teeth Eichner index subjective dry mouth and buffer capacity but it does not support that saliva
secretion has increased over time in the population Saliva secretion and its buffer components is of
outmost importance for the oral environment Hyposalivation and an associated low buffer capacity
puts a person at risk for both dental diseases and oral infection including candida infections and
overall health problems as acute respiratory infection (Iwabuchi et al 2012) and an increase over time
might reduce the risk Given that several factors associated with improved saliva flow rate has taken
place in the population future studies should follow up on the results to confirm or reject that the
present results are not due to a selection bias
ACKNOWLEDGEMENTS
Prof Ingegerd Johansson DDS PhD without whom this essay could not have been written
The personal support of Dr Elisabeth Waumlrnberg Gerdin DDS PhD
The board of the Joumlnkoumlping Studies especially the chairman Dr Ola Norderyd DDS PhD
The County Council of Vaumlsterbotten who allowed me to take time to write this essay
17
REFERENCES
Bardow A Lagerloumlf F Nauntofte B Tenovuo J The role of saliva In Fejerskov O Kidd E (eds) Dental
Caries The Disease and Its Clinical Management 2nd
ed Oxford Wiley-Blackwell 2008 189-208
Bergdahl M Salivary flow and oral complaints in adult dental patients Community Dent Oral Epidemiol
20002859-66
Birkhed D Heintze U Salivary secretion rate buffer capacity and pH In Tenovuo J (ed) Human
Saliva Clinical Chemistry and Microbiology Vol I Boca Raton (FL) CRC Press 1989 25-73
Carpenter GH The secretion components and properties of saliva Annu Rev Food Sci Technol
20134267-276
Cheaib Z Ganss C Lamanda A Turgut MD Lussi A Comparison of three strip-type tests and two
laboratory methods for salivary buffering analysis Odontology 201210067-75
Dawes C Wood CM The contribution of oral minor mucous gland secretions to the volume of whole
saliva in man Arch Oral Biol 197318337-342
Edgar M Dawes C OrsquoMullane D (eds) Saliva and Oral Health 3rd
ed London British Dental
Association 2004
Eichner K Uumlber eine gruppeneinteilung der luumlckengebisse fuumlr der prothetik Dtsch Zahnaumlrztl Z 1955
101831-1834
Ekstroumlm J Autonomic control of salivary secretion Proc Finn Dent Soc 198985323-331 361-363
Ericsson Y Clinical investigations of the salivary buffering action Acta Odontol Scand 195917131ndash
165
Fujibayashi T Sugai S Miyasaka N Hayashi Y Tsubota K Revised Japanese criteria for Sjoumlgrens
syndrome (1999) availability and validity Mod Rheumatol 200414425-434
Garbacz G Kołodziej B Koziolek M Weitchies W Klein S An automated system for minitoring and
regulating the pH of bicarbonate buffers AAPS PharmSciTech 201314517-522
Heintze U Birkhed D Bjoumlrn H Secretion rate and buffer effect of resting and stimulated whole saliva as
a function of age and sex Swed Dent J 19837227ndash238
Hugoson A Koch G Bergendal T Hallonsten AL Laurell L Lundgren D et al Oral health of individuals
aged 3-80 years in Jonkoping Sweden in 1973 and 1983 I A review of findings on dental care
habits and knowledge of oral health Swed Dent J 198610103-117
Hugoson A Koch G Bergendal T Hallonsten AL Slotte C Thorstensson B et al Oral health of
individuals aged 3-80 years in Jonkoping Sweden in 1973 1983 and 1993 I Review of findings on
dental care habits and knowledge of oral health Swed Dent J 199519225-241
Hugoson A Koch G Goumlthberg C Helkimo AN Lundin SA Norderyd O Sjoumldin B Sondell K Oral health
of individuals aged 3-80 years in Joumlnkoumlping Sweden during 30 years (1973-2003) I Review of
findings on dental care habits and knowledge of oral health Swed Dent J 2005a29125-138
Hugoson A Koch G Goumlthberg C Helkimo AN Lundin SA Norderyd O et al Oral health of individuals
aged 3ndash80 years in Jonkoping Sweden during 30 years (1973ndash2003) II Review of clinical and