13
Mongolian Economic Outlook TUVSHINTUGS Batdelger Economic Research Institute, November 2012
| Date post: | 16-Feb-2017 |
| Category: |
Business |
| Upload: | the-business-council-of-mongolia |
| View: | 89 times |
| Download: | 1 times |

Mongolian Economic Outlook
TUVSHINTUGS Batdelger
Economic Research Institute, November 2012

Economic Overview: Growing, but volatile
• Average Growth Rate between 1997-2011 of 6.3%
• Nominal GDP per capita has increased 6 fold between 1997-2011
503
3056
17.3
-5
0
5
10
15
20
0
1000
2000
3000
GDP per capita and growth (1997-2011)
GDP per capita (current US$) GDP growth (annual %)
Source: World Development Indicators, World Bank
MONGOLIA: country profile
Population: 2 811 600
Labor force: 1 124 700
Area (km2): 1 564 115
Neighborcountries:
China and Russia
HDI 0.653 (110th)
Source:Yearbook 2011. NSO, Mongolia
2
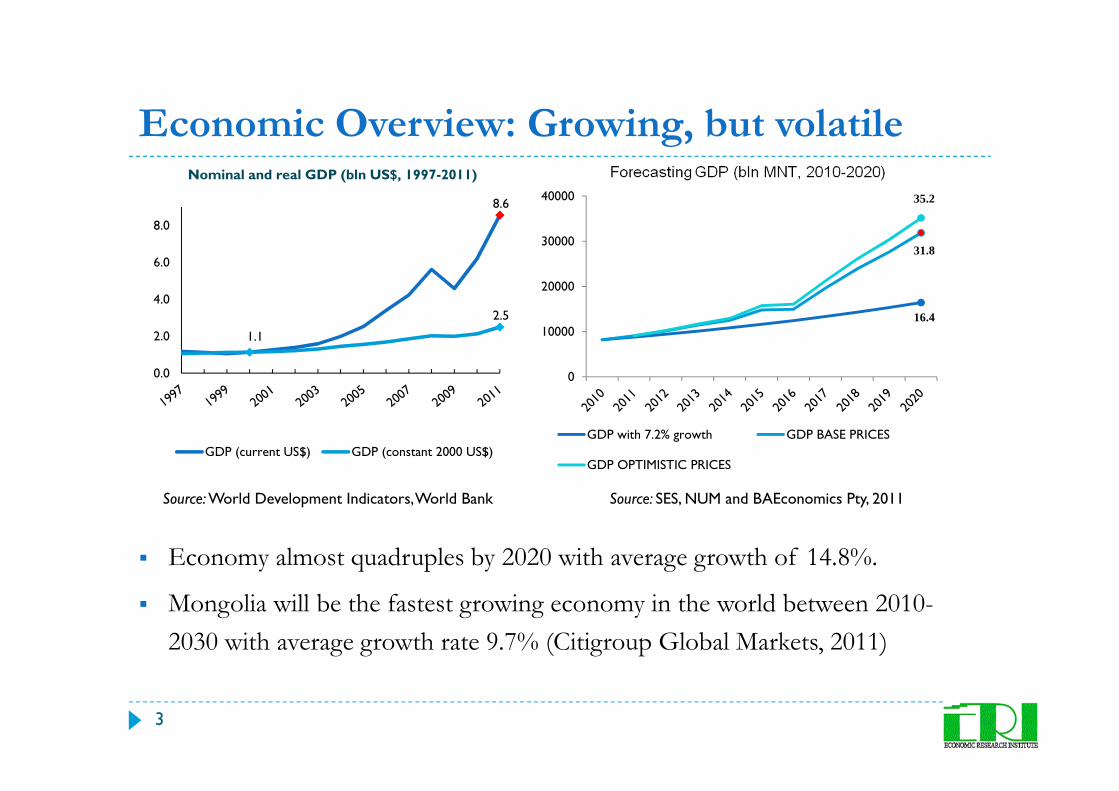
Economic Overview: Growing, but volatile
� Economy almost quadruples by 2020 with average growth of 14.8%.
� Mongolia will be the fastest growing economy in the world between 2010-
2030 with average growth rate 9.7% (Citigroup Global Markets, 2011)
Source: SES, NUM and BAEconomics Pty, 2011
8.6
1.1
2.5
0.0
2.0
4.0
6.0
8.0
Nominal and real GDP (bln US$, 1997-2011)
GDP (current US$) GDP (constant 2000 US$)
Source: World Development Indicators, World Bank
16.4
31.8
35.2
0
10000
20000
30000
40000
GDP with 7.2% growth GDP BASE PRICES
GDP OPTIMISTIC PRICES
3

Contributors to GDP: mining as a main driver
� Economy is highly reliant on the mining sector
� In the Future (copper $5,300; gold $965/oz; coking coal $ 54): Mining
sector will be even more dominant (29% as of 2040) and Agriculture
not so much (16% as of 2040)
� Policies remain the same
Source: SES, NUM and BAEconomics Pty, 2011
25%
12%
3%
7% 8%9%
22%
2%
29%
15%
2%4%
7%
13%
18%
1%
Mining Livestock andother agri
Manufacturing Transportation Construction Health, educ. anddefence
Other service Oil, gas andelectricity
2011 base 2020 base 2030 base 2040 base
4

Future major developments in the mining sector
Oyu Tolgoi: reaches 800,000 tonnes of copper
concentrate by 2020 and 28 tonnes of gold. Estimates
suggest, 25% of GDP in 2020 (price $5,300)
�Tavan Tolgoi: reaches 10 mln tonnes of coking coal by
2020 and 40 mln tonnes of thermal coal (~40 mln
tonnes, yesterday)
5

However, there are challenges:
Dutch Disease and Resource Curse
Many experiences of Dutch Disease and Resource Curse in
resource rich countries
Dutch Disease: RER appreciation combined with high labor cost
=> dominant Non-tradable and mining sectors; lower economic
growth potential; susceptible to high economic fluctuations
Resource Curse: Low quality of institutions and governance =>
Rising inequality, low economic growth, rampant corruption
These challenges are real for Mongolia!
Why?
6

Challenges for Mongolia : Institutional and
Governance Quality
Review of various surveys point to following major difficulties
in conducting business, negatively affecting country’s
competitiveness in general:
� Corruption: ranked 120 out of 183 (Transparency International,
2011)
� Index of Economic Freedom: ranked at 81 out of 179 (Heritage
foundation, 2012)
� Doing Business: ranked 86 out of 183 (World Bank, 2012)
� World Competitiveness Index: ranked 93 out of 144 (World
Economic Forum, 2012-2013)
7
Challenges for Mongolia : Institutional
Quality and Infrastructure
Major hurdles to conducting business in Mongolia:
-Inefficient government bureaucracy: Taxes, supervision and regulations
-Access to financing
-Government policy instability
-Law and contract enforcement
-Corruption
Infrastructure is another major hurdle for businesses:
� Bottlenecks at border
� Quality of roads and air transport infrastructure

Challenges for Mongolia :
Macroeconomic policies
Main purpose of macroeconomic policies: Stable and
sustainable growth
However, past Fiscal and Monetary policies have been pro-
cyclical:
— Exacerbates economic volatility and uncertainty
— Dutch disease effects are more prominent
— Increasing vulnerability from volatile commodity prices
— Limited policy room when needed: 2008/2009 crisis
9

Strongly Pro-cyclical Fiscal Policy
Average growth rate of nominal GDP is 22% while government revenue growth is 26% and expenditure growth is 25%
Fiscal Stability Law was ratified in 2010. Fully operational from 2013
There are risks: Development bank was established to finance big infrastructure and industrial projects – $1.5 bln. government bonds for 2013 being discussed. Off-budget?
Source:Yearbook 1998-2011, NSO Mongolia
-20%
0%
20%
40%
60%
80%
1997 1999 2001 2003 2005 2007 2009 2011
GDP and Fiscal nominal change (%)
GDP nominal growth Government revenue growth Government expenditure growth
10

Economic vulnerability
11
� 08/09 crisis clearly showed the country is extremely vulnerable to TOT shocks (25% decrease)
� Transmission: Export prices decrease => Drop in currency inflow into the economy => Pressure on Togrog to devaluate and Stagnant government revenue
� TOT shocks exacerbated by Pro-cyclical monetary and fiscal policies: i.e. when gov’t revenue is tight, expenditure is even tighter, leads to worsening economic downturn

What is Economic Outlook ?
Unless Institutional and economic policy challenges are
addressed:
� High Economic growth
� Rising Inequality
� Dominant Non-tradable and Mining sectors
� Volatile economy with many uncertainties
12

Thank you for your attention!


