Page 1
Technical Papers30th Annual Meeting
International Institute of Ammonia Refrigeration
March 16–19, 2008
2008 Ammonia Refrigeration Conference & ExhibitionThe Broadmoor Hotel
Colorado Springs, Colorado
Page 2
ACKNOWLEDGEMENT
The success of the 30th Annual Meeting of the International Institute of Ammonia
Refrigeration is due to the quality of the technical papers in this volume and the labor of its
authors. IIAR expresses its deep appreciation to the authors, reviewers, and editors for their
contributions to the ammonia refrigeration industry.
Board of Directors, International Institute of Ammonia Refrigeration
ABOUT THIS VOLUME
IIAR Technical Papers are subjected to rigorous technical peer review.
The views expressed in the papers in this volume are those of the authors, not the
International Institute of Ammonia Refrigeration. They are not official positions of the
Institute and are not officially endorsed.
International Institute of Ammonia Refrigeration
1110 North Glebe Road
Suite 250
Arlington, VA 22201
+ 1-703-312-4200 (voice)
+ 1-703-312-0065 (fax)
www.iiar.org
2008 Ammonia Refrigeration Conference & Exhibition
The Broadmoor Hotel
Colorado Springs, Colorado
Page 3
© IIAR 2008 1
Technical Paper #3
Ammonia as the Sustainable Refrigerant: An Ammonia-Halocarbon Comparison
Alex GooseffALTA Refrigeration
Peachtree City, Georgia
Jamie HortonElectroMotion Refrigeration
Fenton, Missouri
Abstract
When contemplating the question “Should our facility utilize an ammonia or halocarbon refrigeration system?” an owner should perform a detailed financial analysis of the two systems. The first cost difference of the two systems may be easily returned via the savings in operating costs and the long term benefits can be significant. For the example Case Study, the original investment of $208,000 for an ammonia system resulted in a simple pay-back of about 1.7 years and a total savings of about $4.9 million over 20 years. In general the following rules of thumb apply for a distribution facility application: Less than 50,000 sq. ft. refrigerated space, halocarbon split circuit systems are normally accepted. A 50,000 to 200,000 sq. ft. refrigerated space, both halocarbon split circuit systems and central ammonia systems are common. Over 200,000 sq. ft. refrigerated space, central ammonia refrigeration systems are most common.
2008 IIAR Ammonia Refrigeration Conference & Exhibition, Colorado Springs, Colorado
Page 5
Technical Paper #3 © IIAR 2008 3
Ammonia as the Sustainable Refrigerant: An Ammonia-Halocarbon Comparison
Introduction
Owners of refrigerated distribution centers and cold storage facilities frequently ask
refrigeration design engineers a common question: Should our facility utilize an
ammonia or halocarbon refrigeration system?
This question has been asked more frequently since the U.S. Occupational Safety
and Health Administration (OSHA) enacted 29 CFR 1910.119 entitled Process
Safety Management of Highly Hazardous Chemicals (PSM) in 1992. Also, the U.S.
Environmental Protection Agency (EPA) issued a rule under the Clean Air Act (CAA)
encompassing provisions for accidental release prevention in 1992 which required
facilities to develop and implement a Risk Management Plan (RMP). Ammonia
systems containing over 10,000 lbs (4536 kg) of refrigerant are required to comply
with OSHA PSM and EPA RMP programs. The latest government compliance is
the chemical facility anti-terrorism security (CFATS) regulation required by the
Department of Homeland Security (DHS) in 2007. Companies with 10,000 lbs (4536
kg) or more of ammonia on-site in a refrigeration system were required to submit
information to DHS by January 22, 2008.
Another issue which brings this question to light is the current and proposed phase
out of certain CFC and HCFC refrigerants like R-22. These phase-outs have raised
concern over the long term availability of refrigerants that have high Ozone Depleting
Potential (ODP) and Global Warming Potential (GWP).
Most industrial refrigeration design engineers will agree that for refrigerated
distribution centers, the smaller size facility under 50,000 sq. ft. (4645 m2) are
usually split circuit halocarbon systems (one or two air units traditionally connected
with a close coupled air-cooled condensing compressor unit on the roof directly
above). Also, refrigerated spaces over 200,000 sq. ft. (18580 m2) are traditionally
ammonia, due to ownership costs. Those facilities in between 50,000 and 200,000
Page 6
4 © IIAR 2008 Technical Paper #3
2008 IIAR Ammonia Refrigeration Conference & Exhibition, Colorado Springs, Colorado
sq. ft. (4645 and 18580 m2) will require considerations and an understanding of an
owner’s priorities and preferences.
In order to properly answer the question of which system type is the best choice, an
owner should make a comprehensive comparison of the alternatives based on a life
cycle cost analysis. Additional items that should enter into this evaluation are:
• Purchaseorleasefacility
• Neworexistingfacility
• Futureexpansionconsiderations
• Refrigerationsystemcosts
C Build cost considerations
C Compressor room requirements
C Power availability and cost
C Water and sewage availability and cost
• Equipmentcostconsiderations
C Initial cost
C Operating cost
C Preventative maintenance and service costs
C Safety equipment provisions
• Regulationcompliancecosts
C PSM/RMP documentation and personnel training
C Personnel safety equipment and training requirements
C Liability and property damage insurance
• Facilitylocationandthesurroundingareas
C Off-site consequential liability
Case Study Selection
The IIAR Education Committee was tasked with developing a sample Case Study for
arefrigerateddistributionfacility.ThisCaseStudyprovidesanexamplecomparison
of two of the most common ammonia and halocarbon refrigeration systems for this
type of facility application.
Page 7
Technical Paper #3 © IIAR 2008 5
Ammonia as the Sustainable Refrigerant: An Ammonia-Halocarbon Comparison
The Committee selected a 150,000 sq. ft. (13935 m2) facility as the model to be
developed for the Case Study. The system types selected for this analysis were a
central ammonia system compared to multiple split halocarbon R-507 system.
The distribution center was assumed to be new construction and the owner was to
be the occupant of the space.
The items that are included in the ownership analysis are:
• Initialconstructioncost
• Energyandoperatingcosts
• Maintenancecost
• Majorcomponentreplacementcosts
• Simplepay-back
• 20-yearlifecyclecost
The following information and analysis is the basis for the Case Study published by
the IIAR Education Committee.
Refrigeration System Selection
The refrigerated cold storage loads are calculated based upon a facility located in
Atlanta, GA and consist of the parameters in Table 1. Both the ammonia and split
halocarbon systems are sized to handle the determined loads.
Ammonia System Model
The ammonia system selected for the Case Study is a single stage economized, two
temperature central-type system with liquid over-feed, thermosyphon oil cooling and
evaporative condensing, as shown in Figures 1 and 2, that includes the following:
Page 8
6 © IIAR 2008 Technical Paper #3
2008 IIAR Ammonia Refrigeration Conference & Exhibition, Colorado Springs, Colorado
Floor Plan and Equipment Layout
• –10ºF(–23°C)Freezer:Servedbyfourairunits35TR(123kW)withthree
2 HP fans and long throw air adapter each. Total capacity of 140 TR (492 kW)
(482 sq. ft./TR, 12.7 m2/kW)
• Coolers:Eachcoolerisservedbytwoairunitsrangingfrom25.5TR(90kW)
to 19 TR (67 kW) each with two 2 HP fans and long throw air adapters. Total
capacity of 175 TR (616 kW) total coolers (385 sq. ft./TR, 10.2 m2/kW)
• ColdDock:15,000sq.ft.(1394m2) with twelve truck doors served by three
6-fan air units at 25 TR (88 kW) each. Total capacity of 75 TR (264 kW)
(200 sq. ft./TR, 5.3 m2/kW)
Block Flow Diagram
• (2)–20ºF(–29°C)screwcompressors200HPwitheconomizerportsand
thermosyphon oil cooling
• +20ºF(–6.7°C)screwcompressor263HPwithdualsuctionvalves,economizer
port when operating on low temperature and thermosyphon oil cooling
• Evaporativecondenserwiththree10HPfansandone7.5HPpumpsizedfor80°F
(27°C)ambientwetbulbtemperature
• Thermosyphon/pilotreceiver,300psi(20.7bar)design
• +20ºF(–6.7°C)liquidrecirculatorwithtwo3HPrefrigerantpumps
(100% standby), 250 psi (17.2 bar) design
• –20ºF(–29°C)liquidrecirculatorwithtwo3HPrefrigerantpumps
(100% standby), 250 psi (17.2 bar) design
• Foulgaspurger
• Letdownpressureregulator–computercontrolled
• Hotgasregulatorvalvewithcondensatefloatdrainer
• Freezer:fourairunitswithindividualvalvegroups
• Coolers:eightairunitswithindividualvalvegroups
• Glycolunderfloorheatingsystemwithhotgas,a3HPpumpservicingthefreezer
anda28ºF(–2.2°C)cooler(84,375sq.ft.(7839m2) total)
Page 9
Technical Paper #3 © IIAR 2008 7
Ammonia as the Sustainable Refrigerant: An Ammonia-Halocarbon Comparison
• Computercontrolsystem
• Compressorroomexhaustfans
• Ammoniadetectorsineachcooler(4),freezer(2),dock(1),compressorroom(2),
for a total of (9)
Halocarbon System Model
The most common types of halocarbon systems considered for the Case Study were:
• AirCooledCondensingUnitSplitCircuitSystem:Compressorsarefactory
packaged with condensers that are usually close-coupled with one or two air
units. Condensing units are normally located on the roof directly above the air
unit. Condensing units can also be located on the ground level.
• RackSystems:Severalcompressorsareconnectedtogetheronacommonsuction
accumulator, and several of these compressor racks are connected together to
serve various suction levels. Rack systems are normally skidded and pre-packaged
by an equipment manufacturer or packaging fabricators. Large air-cooled
condensers are most commonly applied to a rack system, but evaporative
condensers can also be utilized to reduce operating costs. Rack systems are most
commonly applied in grocery stores and are not common in distribution centers
due to the added equipment and piping costs when compared to air-cooled
split circuit systems. In addition, system refrigerant leaks and semi-hermetic
compressor burn-outs which can contaminate a common oil return system on a
rack arrangement can cause problems with many air units, and can affect a large
refrigerated area compared to multiple halocarbon split circuit systems.
• CentralIndustrialTypeHalocarbonSystem:Similartothecentralammonia
system previously described but generally with a 10% to 15% higher initial cost
due to requirements of larger vessels, pipes, additional insulation for cold piping
and vessels, and the substantially higher cost of refrigerant charge. The operating
power for a halocarbon system is between 2% to 20% higher than an ammonia
system depending on the type of halocarbon refrigerant utilized and the operating
temperature.
Page 10
8 © IIAR 2008 Technical Paper #3
2008 IIAR Ammonia Refrigeration Conference & Exhibition, Colorado Springs, Colorado
A system consisting of multiple roof mounted air-cooled condensing unit split
systems utilizing R-507 refrigerant, as shown in Figure 3, was selected for this Case
Study. This system type was selected because it is one of the most prevalent choices
for this type of application, driven mainly by the low first cost.
Floor Plan and Equipment Layout
• –10ºF(–23°C)Freezer:Servedbyeight17.5TR(62kW)aircooledcondensing
units with two 30 HP compressors each coupled with two air units with three 1
HPfans.Atotalofsixteenairunits.Electricdefrostisprovidedforalloftheair
units. Total capacity of 140 TR (492 kW) (482 sq. ft./TR, 12.7 m2/kW).
• Coolers:Eachcoolerhastwoaircooledcondensingunitsrangingfrom25.5TR
(90 kW) to 19 TR (67 kW) each for a total of eight total condensing units. Each
condensing unit is coupled with two air units with three 1 HP fans. A total of
sixteenairunits.Electricdefrostisprovidedforallofthecoolerspacesat
38°F(3.3°C)andbelow.Totalcapacityof175TR(616kW)(385sq.ft./TR,
10.2 m2/kW).
• ColdDock:15,000sq.ft.(1394m2) with twelve truck doors served by two 37.5
TR (132 kW) air cooled condensing units two 35 HP compressors per unit coupled
with two air units each with four 1 HP fans. A total of four evaporators. Total
capacity of 75 TR (264 kW) (200 sq. ft/TR, 5.3 m2/kW).
It should be noted that these system types are not only different in the type of
refrigerantutilizedbutaredifferentinthequalityandcomplexityoftheequipment
and controls.
Page 11
Technical Paper #3 © IIAR 2008 9
Ammonia as the Sustainable Refrigerant: An Ammonia-Halocarbon Comparison
Construction Costs
Estimated construction costs are calculated for both systems. The costs are based on
non-union labor rates for Atlanta, GA, and year 2007 material and equipment costs,
includinga6%salestax.
There are several differences to be noted between the ammonia and halocarbon
system types due to codes and industry standards. Some of these differences, such as
therequirementofanequipmentroom,underfloorheatingsystem,andrefrigerant
detectors, are shown in Table 2.
Ammonia System Construction Costs
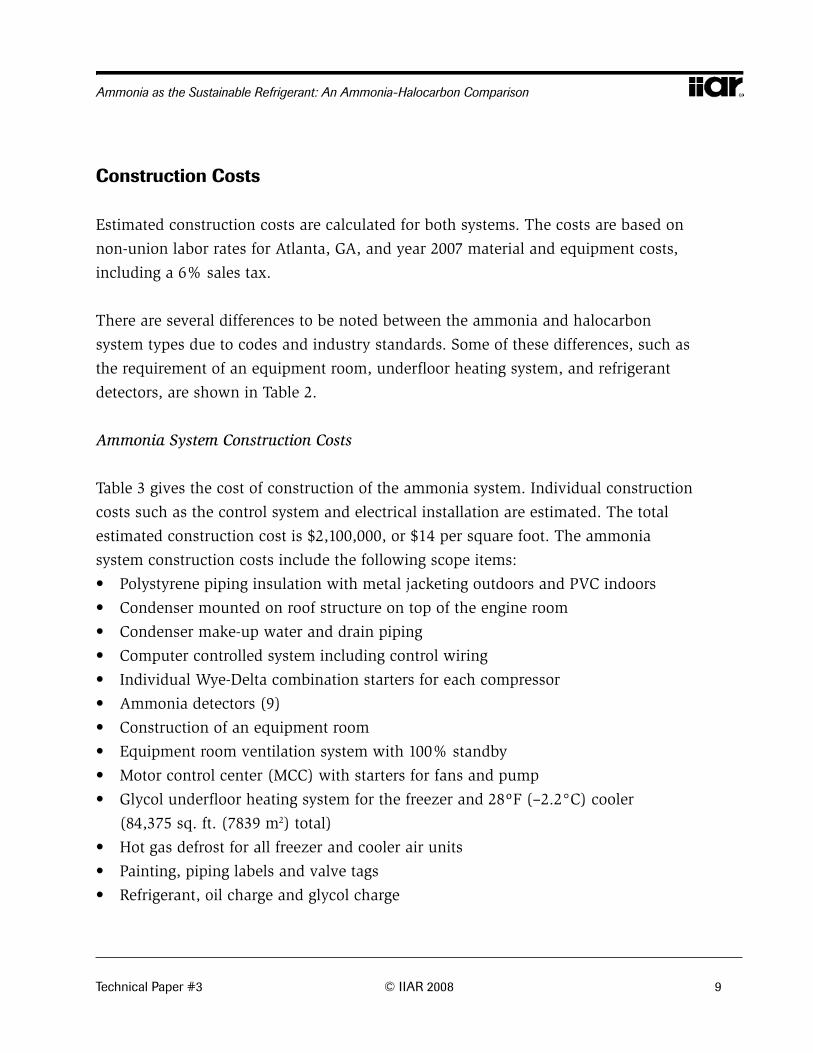
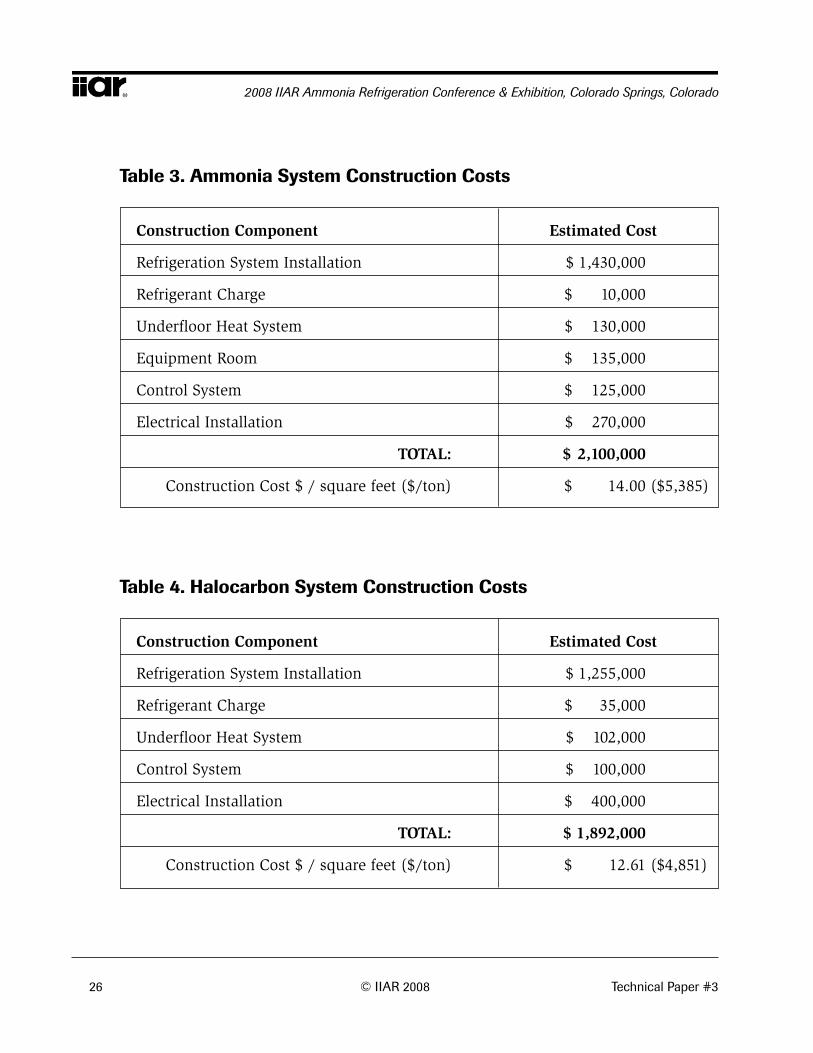
Table 3 gives the cost of construction of the ammonia system. Individual construction
costs such as the control system and electrical installation are estimated. The total
estimated construction cost is $2,100,000, or $14 per square foot. The ammonia
system construction costs include the following scope items:
• PolystyrenepipinginsulationwithmetaljacketingoutdoorsandPVCindoors
• Condensermountedonroofstructureontopoftheengineroom
• Condensermake-upwateranddrainpiping
• Computercontrolledsystemincludingcontrolwiring
• IndividualWye-Deltacombinationstartersforeachcompressor
• Ammoniadetectors(9)
• Constructionofanequipmentroom
• Equipmentroomventilationsystemwith100%standby
• Motorcontrolcenter(MCC)withstartersforfansandpump
• Glycolunderfloorheatingsystemforthefreezerand28ºF(–2.2°C)cooler
(84,375 sq. ft. (7839 m2) total)
• Hotgasdefrostforallfreezerandcoolerairunits
• Painting,pipinglabelsandvalvetags
• Refrigerant,oilchargeandglycolcharge
Page 12
10 © IIAR 2008 Technical Paper #3
2008 IIAR Ammonia Refrigeration Conference & Exhibition, Colorado Springs, Colorado
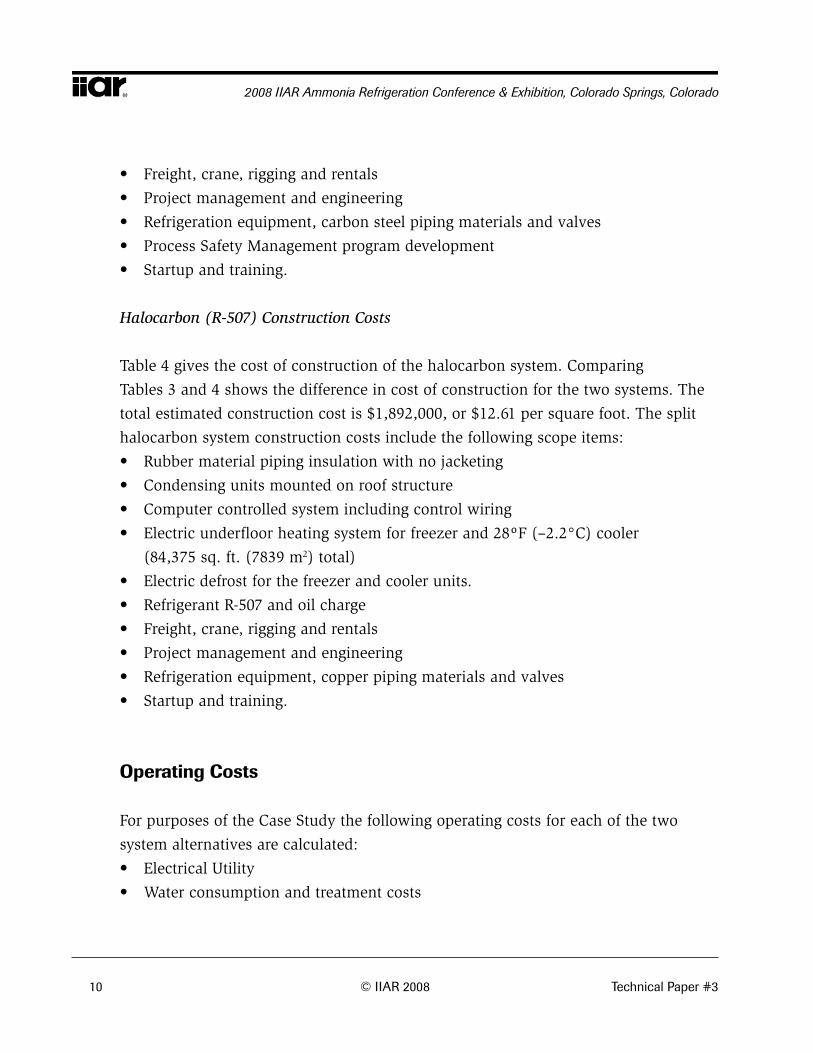
• Freight,crane,riggingandrentals
• Projectmanagementandengineering
• Refrigerationequipment,carbonsteelpipingmaterialsandvalves
• ProcessSafetyManagementprogramdevelopment
• Startupandtraining.
Halocarbon (R-507) Construction Costs
Table 4 gives the cost of construction of the halocarbon system. Comparing
Tables 3 and 4 shows the difference in cost of construction for the two systems. The
total estimated construction cost is $1,892,000, or $12.61 per square foot. The split
halocarbon system construction costs include the following scope items:
• Rubbermaterialpipinginsulationwithnojacketing
• Condensingunitsmountedonroofstructure
• Computercontrolledsystemincludingcontrolwiring
• Electricunderfloorheatingsystemforfreezerand28ºF(–2.2°C)cooler
(84,375 sq. ft. (7839 m2) total)
• Electricdefrostforthefreezerandcoolerunits.
• RefrigerantR-507andoilcharge
• Freight,crane,riggingandrentals
• Projectmanagementandengineering
• Refrigerationequipment,copperpipingmaterialsandvalves
• Startupandtraining.
Operating Costs
For purposes of the Case Study the following operating costs for each of the two
system alternatives are calculated:
• ElectricalUtility
• Waterconsumptionandtreatmentcosts
Page 13
Technical Paper #3 © IIAR 2008 11
Ammonia as the Sustainable Refrigerant: An Ammonia-Halocarbon Comparison
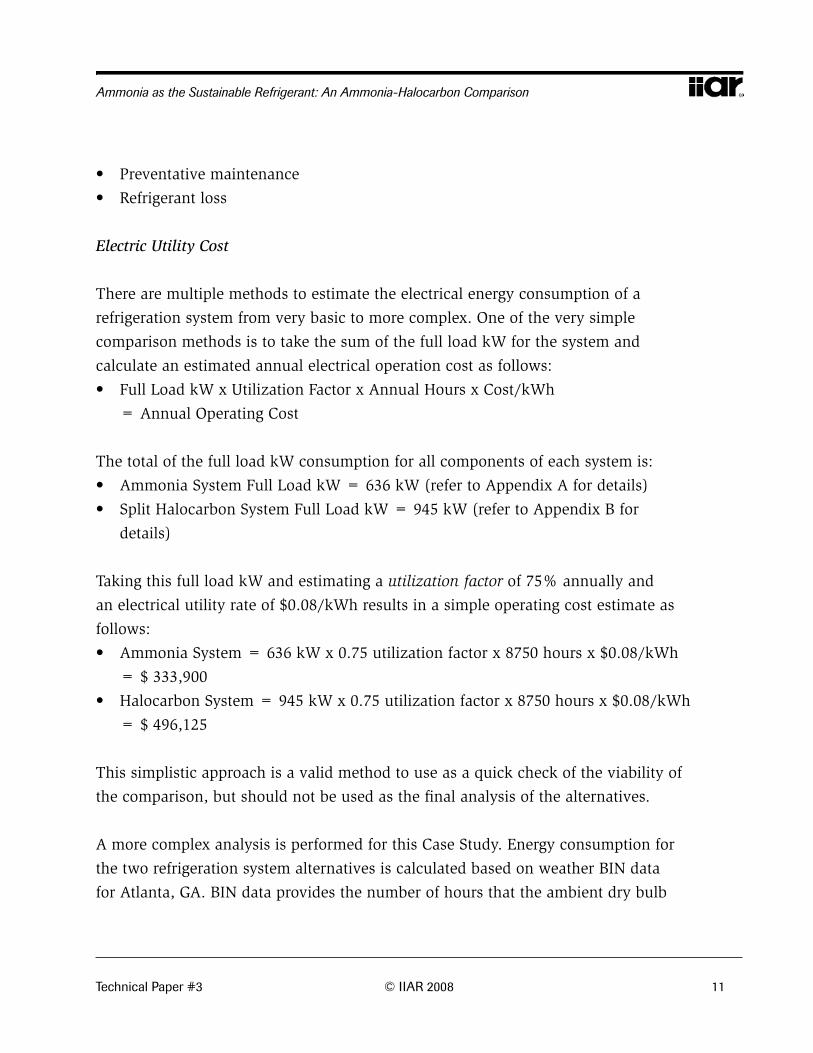
• Preventativemaintenance
• Refrigerantloss
Electric Utility Cost
There are multiple methods to estimate the electrical energy consumption of a
refrigerationsystemfromverybasictomorecomplex.Oneoftheverysimple
comparison methods is to take the sum of the full load kW for the system and
calculate an estimated annual electrical operation cost as follows:
• FullLoadkWxUtilizationFactorxAnnualHoursxCost/kWh
= Annual Operating Cost
The total of the full load kW consumption for all components of each system is:
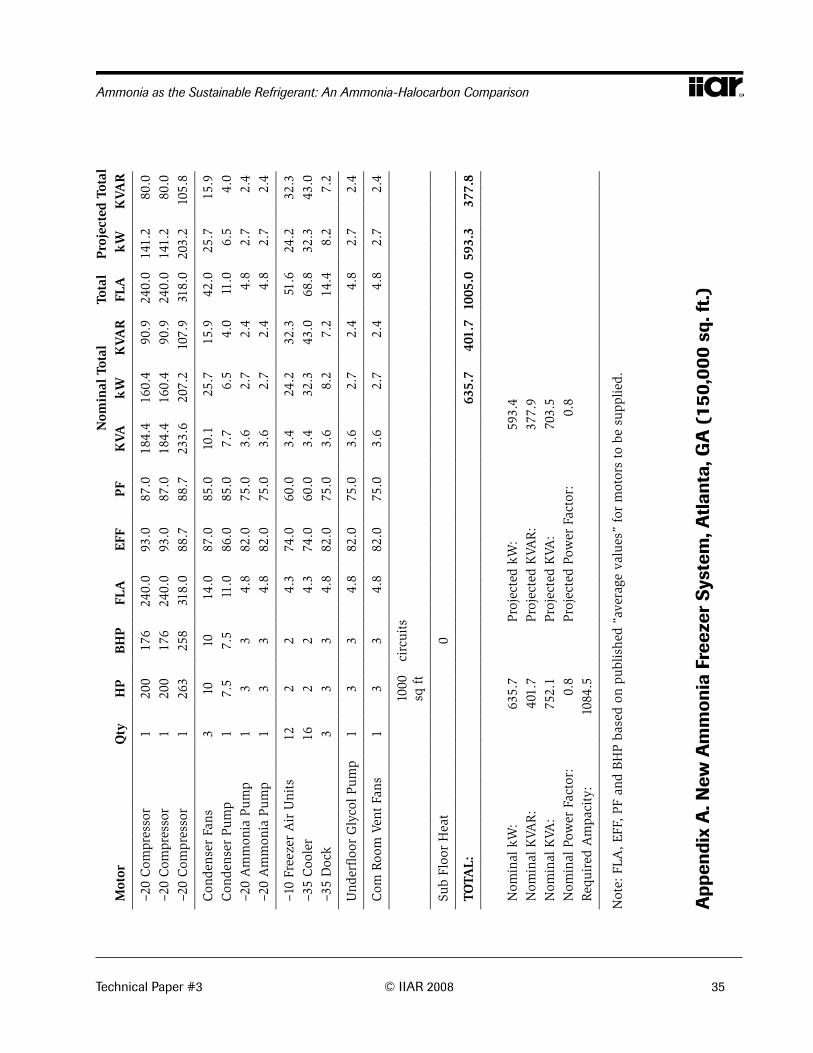
• AmmoniaSystemFullLoadkW=636kW(refertoAppendixAfordetails)
• SplitHalocarbonSystemFullLoadkW=945kW(refertoAppendixBfor
details)
Taking this full load kW and estimating a utilization factor of 75% annually and
an electrical utility rate of $0.08/kWh results in a simple operating cost estimate as
follows:
• AmmoniaSystem=636kWx0.75utilizationfactorx8750hoursx$0.08/kWh
= $ 333,900
• HalocarbonSystem=945kWx0.75utilizationfactorx8750hoursx$0.08/kWh
= $ 496,125
This simplistic approach is a valid method to use as a quick check of the viability of
the comparison, but should not be used as the final analysis of the alternatives.
AmorecomplexanalysisisperformedforthisCaseStudy.Energyconsumptionfor
thetworefrigerationsystemalternativesiscalculatedbasedonweatherBINdata
forAtlanta,GA.BINdataprovidesthenumberofhoursthattheambientdrybulb
Page 14
12 © IIAR 2008 Technical Paper #3
2008 IIAR Ammonia Refrigeration Conference & Exhibition, Colorado Springs, Colorado
temperature occurred within a five degree range. This data is used to establish the
load placed on the refrigeration system as well as the kW/TR consumption of the
equipment.
Load Profiles
The load profiles shown in Figures 4, 5 and 6 are used for each space, based on 25%
ambient related loads for the cooler and freezer, and 70% ambient related load for
theloadingdock.ThemaximumloadiscalculatedfortheweatherBINof95to99°F
(35to37°C).
Equipment Performance Data
Full load and part load kW/TR efficiencies are estimated for each system using
equipment performance data for an air-cooled halocarbon system and an evaporative
cooled ammonia system.
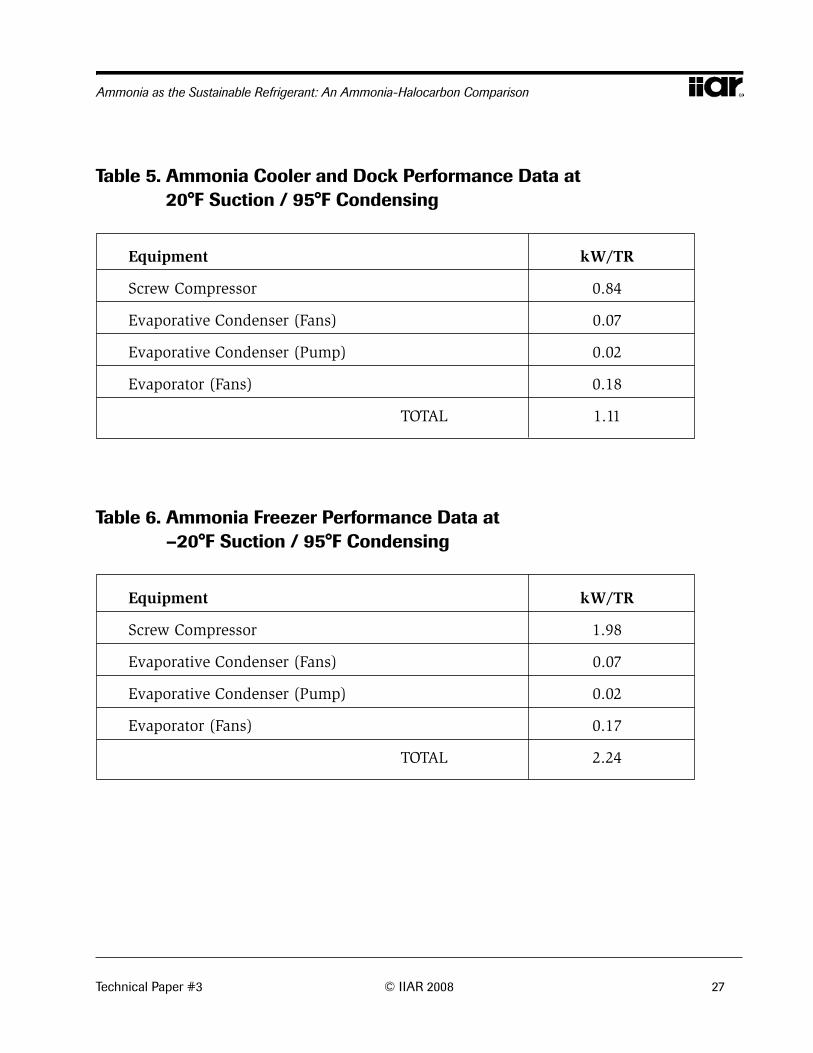
Evaporative Cooled Ammonia System Performance
Tables5and6listtheperformancedatafortheammoniasystematthemaximum
operatingconditionof95°F(35°C)condensingtemperature(80°F(27°C)wetbulb).
ThekW/TRperformanceisthencalculatedforeachweatherBINusing:
• ConstantkW/TRperformanceforcondenserandevaporatoratallconditions
• Screwcompressorenergyconsumptionbasedupon1psi(0.07bar)suctionand
discharge line pressure losses, suction and discharge valve losses, 100% slide
valvepositionforambienttemperaturegreaterthan89°F(32°C)and80%slide
valve position for all other ambient conditions.
Page 15
Technical Paper #3 © IIAR 2008 13
Ammonia as the Sustainable Refrigerant: An Ammonia-Halocarbon Comparison
Table7showsperformancedatafortheammoniasystematvariousBINs.Pleasenote
that for the Case Study the energy consumption of the equipment room continuous
exhaustfanortherefrigerantpumpsarenotincluded.
Air-Cooled Halocarbon System Performance
Tables8and9listtheperformancedataforthehalocarbonsystematthemaximum
operatingconditionof105°F(41°C)ambienttemperature.Actualconditionson
theroofinthesummermayexceedthe105°F(41°C)conditionbutthesehigher
conditions were not used in this analysis. Table 10 shows performance data for the
halocarbonsystematvariousBINs.
The minimum condensing pressure for the air-cooled halocarbon system is based
upontherequiredminimumoperatingpressureforadirectexpansionR-507
systemof180psig(12.4barg),whichisassociatedwith80°F(27°C)condensing
temperature.Thisminimumisestablishedforproperthermalexpansionvalve
operation and is controlled by the condensing unit head pressure controls.
Constant kW/TR performance for the evaporator and air-cooled condenser fans is
used at all load conditions to match the ammonia system calculation.
System Energy Consumption
UtilizingtheequipmentperformancedataandweatherBINdata,thetotalannual
system energy consumption is calculated as shown in Tables 11 and 12. The
underfloorheatconsumptionisbaseduponaninstallationon4ftcentersandis
assumed to operate 35% of the time. The total estimated annual energy consumption
for the ammonia refrigeration system is $296,063 which includes both the
refrigerationandunderfloorheatenergyconsumption.Theunderfloorelectricheat
consumption is based upon an installation on 8 ft centers and is assumed to operate
65%ofthetime.Thespacesincludedarethe–10°F(–23°C)freezerandthe28to
34°F(–2.2to1.1°C)cooler.
Page 16
14 © IIAR 2008 Technical Paper #3
2008 IIAR Ammonia Refrigeration Conference & Exhibition, Colorado Springs, Colorado
Thedefrostisbaseduponallunitsinthe–10°F(–23°C)freezerandthe28to34°F
(–2.2to1.1°C)coolerrequiringdefrosttwiceaday.Theunitsinthe34to36°F
(1.2to2.2°C)coolerwillrequireadefrost,buttheyhavenotbeenincludedinthis
analysis.
The total estimated annual energy consumption for the split halocarbon system is
$443,203whichincludestherefrigeration,electricdefrostandunderfloorheatenergy
consumption.
Water Consumption, Sewer and Treatment Costs
The ammonia system model utilizes an evaporative condenser. In order to properly
evaluate the operating cost of the system, the cost of water consumption and
treatment is required.
Water Consumption: The estimated evaporation rate for the condenser is 12 gpm
(2.7 m3/h). Using a bleed off rate of 3 gpm (0.7 m3/h) will maintain a 4:1
concentrationlevelforatotalmaximumwaterconsumptionof15gpm(3.4m3/h).
Using this rate, operating 50% of the time calculates to be 324,000 gallons (1226 m3)
per month. The cost for water in Atlanta, GA is $2.80/1000 gallons ($2.80/3.79 m3)
plus a $20.00/month meter fee. The total cost for the water calculates to be $11,126
annually.
Sewer Costs: The 3 gpm (0.7 m3/h) bleed-off rate and the 50% operating time results
inamonthlywaterflowtothesewerof64,800gallons/month(245m3/month).
Using an estimated sewer charge of $2.75/1000 gallons ($2.75/3.79 m3), the monthly
sewer charge would be around $178.00/month or $2,136 annually.
Water Treatment: The estimated cost for water treatment is $900 per month for a total
of $10,800 annually.
Page 17
Technical Paper #3 © IIAR 2008 15
Ammonia as the Sustainable Refrigerant: An Ammonia-Halocarbon Comparison
Thetotalcostassociatedwithwaterusageoftheevaporativecondenseris$11,126+
$2,136+$10,800=$24,062.
Preventative Maintenance
Allrepairsoffailedcomponentshavebeenexcludedforthisanalysis.Itshouldbe
noted that there are a significantly higher number of components that can fail for the
split halocarbon system model.
There are multiple levels of preventative maintenance that an owner can implement.
For this system comparison the following has been included.
Ammonia System: The recommended preventative maintenance for the ammonia
system includes:
Screw compressors:
• Vibrationandoilanalysis(every6months)
• Changeoilfilters,cleansuction,liquidandoilscreens,checkandcalibrate
controls (including safeties) and check electrical connections (every 12 months)
• Greasemotors(every3months)
Evaporative condenser:
• Cleanwaterbasinandwaterdistributionnozzles(every12months)
• Greasemotorsandcheckbelttension(every3months)
Ammonia detection:
• Testingandcalibration(every6months)
Vessels:
• Testingofhighlevelcut-outs(every12months)
Estimated annual maintenance cost = $ 9,000
Page 18
16 © IIAR 2008 Technical Paper #3
2008 IIAR Ammonia Refrigeration Conference & Exhibition, Colorado Springs, Colorado
Split Halocarbon System: The recommended preventative maintenance for the model
halocarbon system includes:
Air-cooled condensing units:
• Cleaningofair-cooledcondensercoils(every6months)
• Checkrefrigerantoperatingpressures,checkandcalibratecontrolsandcheck
electrical connections (every 12 months)
Estimated annual maintenance cost = $ 8,700
All maintenance labor was estimated at a rate of $80/hour.
Refrigerant Loss
Boththeammoniaandhalocarbonsystemwillexperiencefugitivelossesof
refrigerant on an annual basis. There is a separate debate on which of the selected
system types would have a higher or lower refrigerant loss rate. Many feel that the
ammoniasystemwillexperienceamuchlowerleakrateasthesystemisconstructed
of welded carbon steel with a fewer number of evaporator connections. For this
evaluation, it is assumed that the percentage of losses is the same.
Estimated Ammonia System Charge = 14000 lbs (6350 kg)
Annual leak rate = 5% = 700 lbs (318 kg)
Annualcost=700lbs.x$1.00/lb.=$700
Estimated Split Halocarbon System Charge = 4400 lbs (1996 kg)
Annual leak rate = 5% = 220 lbs (100 kg)
Annualcost=220lbs.x$8.00/lb.=$1760
Refrigerant costs are based on a purchase of 100 lbs (45 kg).
Page 19
Technical Paper #3 © IIAR 2008 17
Ammonia as the Sustainable Refrigerant: An Ammonia-Halocarbon Comparison
Financial Analysis
Simple Pay-Back
The simple pay-back is calculated by dividing the difference in initial construction
costs by the operational cost difference as follows:
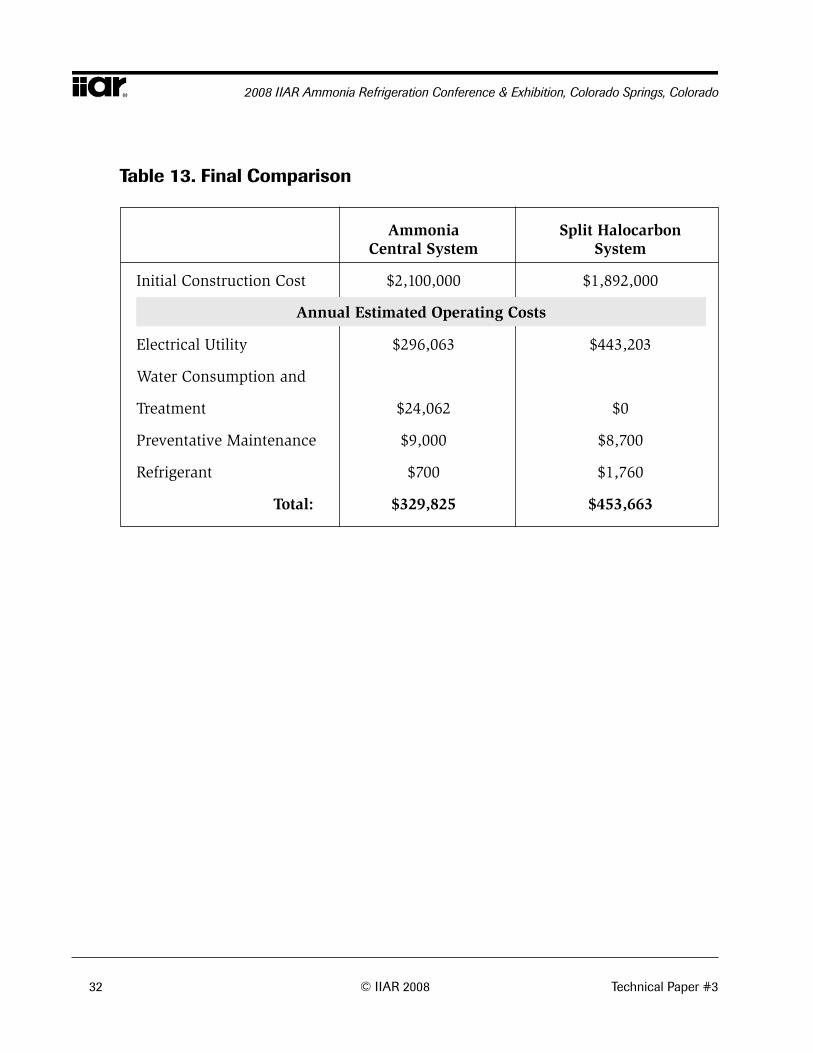
Initialcostdifference=$2,100,000–$1,892,000=$208,000
OperationalCostDifference=$453,663–$329,825=$123,838
Simple Pay-Back = $ 208,000 first cost difference / $ 123,838 annual savings =
1.68 years
20 Year Life Cycle
A more detailed financial analysis method is to perform a life cycle cost analysis. For
this Case Study, a term of 20 years is selected. This analysis is shown in Tables 14
and 15. All costs are escalated at a rate of 5% per year from the year 2007 baseline.
Component replacement costs are included based on traditional equipment service
life.Notincludedintheanalysisisanycostassociatedwithfinancingtheinitial
capital investment.
The replacement costs include replacement of the screw compressor with a
remanufactured compressor during years 11, 12 and 13 and the replacement of
theevaporativecondenserinyear18.Noothercomponentreplacementcostsare
included,becausealloftheothermajorsystemcomponentsareexpectedtohave
a service life of 20 years or greater. Minor component replacement costs are not
included in this analysis.
The Process Safety Management (PSM) costs include a mechanical integrity audit
and replacement of the relief valves every five years. Yearly PSM administrative costs
were not included because there are annual administrative costs associated with
halocarbon refrigerants as well.
Page 20
18 © IIAR 2008 Technical Paper #3
2008 IIAR Ammonia Refrigeration Conference & Exhibition, Colorado Springs, Colorado
Component replacement costs include replacement of two of the compressors every
other year starting at year 6 and ending at 14. During years 16 and 17 the complete
replacement of 12 of the 18 air-cooled condensing units is included (6 per year).
Noothercomponentreplacementcostsareincludedbecausealloftheothermajor
systemcomponentsareexpectedtohaveaservicelifeof20yearsorgreater.Minor
component replacement costs are not included in this analysis.
20 Year Life Cycle Comparison
• InitialConstructionCostDifference:
$2,100,000(Ammonia)–$1,892,000(Halocarbon)=$ 208,000
• Total20YearOperationalCostDifference:
$11,282,147(Ammonia)–$16,161,757(Halocarbon)=–$ 4,880,610
Investinganextra$208,000inconstructioncostswillresultina$4,880,610savings
over 20 years.
Sustainable Benefits
Notonlydoesammoniaholdthelifecyclecostadvantage,butthereareother
sustainable benefits to utilizing ammonia as the refrigerant of choice.
• Naturallyoccurringgreen substance
• Nopotentialforozonedepletion(OzoneDepletionPotential=0)
• Nopotentialfordirectglobalwarmingimpact(GlobalWarmingPotential=0)
• Requireslessprimaryenergytoproduceagivenrefrigerationeffectthanother
common refrigerants (highest coefficient of performance)
• Lowreplacementcost
• Self-alarmingodorhelpstodetectleaksandminimizeemissions.
Page 21
Technical Paper #3 © IIAR 2008 19
Ammonia as the Sustainable Refrigerant: An Ammonia-Halocarbon Comparison
Conclusion
When contemplating the question Should our facility utilize an ammonia or
halocarbon refrigeration system? an owner should perform a detailed financial
analysis of the two systems. The first cost difference of the two systems may be
easily returned via the savings in operating costs and the long term benefits can be
significant.
Fortheexample,thisCaseStudyoriginalinvestmentof$208,000foranammonia
system resulted in a simple pay-back of about 1.7 years, and a total savings of about
$4.9 million over 20 years.
In general, the following rules of thumb apply for a distribution facility application:
• Lessthan50,000sq.ft.(4645m2) refrigerated space: halocarbon split circuit
systems are normally accepted.
• 50,000to200,000sq.ft.(4645to18580m2) refrigerated space: both halocarbon
split circuit systems and a central ammonia system are common. The owner’s
priorities must be considered. A life cycle cost analysis should be performed, such
as the one outlined in this paper.
• Over200,000sq.ft.(18580m2) refrigerated space: central ammonia refrigeration
systems are most common.
NOTE: The dollar amounts listed in this paper are for a specific model, location
and time period. Construction and operating costs will vary, as prices are
constantly changing and should therefore be adjusted to represent other models and
circumstances.
Page 22
20 © IIAR 2008 Technical Paper #3
2008 IIAR Ammonia Refrigeration Conference & Exhibition, Colorado Springs, Colorado
Figure 1. Central Ammonia System, 150,000 sq. ft. Refrigerated Area, Floor Plan
Page 23
Technical Paper #3 © IIAR 2008 21
Ammonia as the Sustainable Refrigerant: An Ammonia-Halocarbon Comparison
Figure 2. Central Ammonia System, 150,000 sq. ft. Refrigerated Area, Block Flow Diagram
Page 24
22 © IIAR 2008 Technical Paper #3
2008 IIAR Ammonia Refrigeration Conference & Exhibition, Colorado Springs, Colorado
Figure 3. Split Halocarbon Systems, 150,000 sq. ft. Refrigerated Area, Floor Plan
Page 25
Technical Paper #3 © IIAR 2008 23
Ammonia as the Sustainable Refrigerant: An Ammonia-Halocarbon Comparison
Figure 4. R-507 Freezer Load Profile
Figure 5. R-507 Cooler Load Profile
Page 26
24 © IIAR 2008 Technical Paper #3
2008 IIAR Ammonia Refrigeration Conference & Exhibition, Colorado Springs, Colorado
Figure 6. R-507 Dock Load Profile
Page 27
Technical Paper #3 © IIAR 2008 25
Ammonia as the Sustainable Refrigerant: An Ammonia-Halocarbon Comparison
Table 1. System Parameters
Area Size Capacity Sq. Ft. / TR
–10ºFFreezer 67,500ft2 140 TR 482
Coolers* 67,500 ft2 175 TR 385
38ºFDock 15,000ft2 75 TR 200
Totals 150,000 ft2
Note:TR=tonsofrefrigeration
*TheCoolersarecomprisedoffour16,875squarefootindependentcoolersoperatingat28–34°F, 36–36°F,38–40°Fand40–45°Frespectively(SeeFigures1and3).
Table 2. Comparison of System Types
Ammonia System Split Halocarbon System
Control System Computer Control Computer Control
RefrigerantDetection Yes No
CompressorRoom Yes No
Equipment Room/ VentilationSystem Yes No
UnderfloorHeating System Glycol Electric
Insulation Rigid polystyrene Rubber material with withjacketing nojacketing
WaterTreatment Yes No
Page 28
26 © IIAR 2008 Technical Paper #3
2008 IIAR Ammonia Refrigeration Conference & Exhibition, Colorado Springs, Colorado
Construction Component Estimated Cost
Refrigeration System Installation $ 1,430,000
Refrigerant Charge $ 10,000
UnderfloorHeatSystem $130,000
Equipment Room $ 135,000
Control System $ 125,000
Electrical Installation $ 270,000
TOTAL: $ 2,100,000
Construction Cost $ / square feet ($/ton) $ 14.00 ($5,385)
Table 3. Ammonia System Construction Costs
Construction Component Estimated Cost
Refrigeration System Installation $ 1,255,000
Refrigerant Charge $ 35,000
UnderfloorHeatSystem $102,000
Control System $ 100,000
Electrical Installation $ 400,000
TOTAL: $ 1,892,000
Construction Cost $ / square feet ($/ton) $ 12.61 ($4,851)
Table 4. Halocarbon System Construction Costs
Page 29
Technical Paper #3 © IIAR 2008 27
Ammonia as the Sustainable Refrigerant: An Ammonia-Halocarbon Comparison
Table 5. Ammonia Cooler and Dock Performance Data at 20°F Suction / 95°F Condensing
Equipment kW/TR
Screw Compressor 0.84
Evaporative Condenser (Fans) 0.07
Evaporative Condenser (Pump) 0.02
Evaporator (Fans) 0.18
TOTAL 1.11
Table 6. Ammonia Freezer Performance Data at –20°F Suction / 95°F Condensing
Equipment kW/TR
Screw Compressor 1.98
Evaporative Condenser (Fans) 0.07
Evaporative Condenser (Pump) 0.02
Evaporator (Fans) 0.17
TOTAL 2.24
Page 30
28 © IIAR 2008 Technical Paper #3
2008 IIAR Ammonia Refrigeration Conference & Exhibition, Colorado Springs, Colorado
Air Temperature Condensing Cooler & Dock Freezer (°F) Temperature* (°F) kW/TR kW/TR
99–95 95 1.11 2.24
94–90 93 1.08 2.18
89–85 91 1.08 2.29
84–80 88 1.04 2.23
79–75 86 1.00 2.14
74–70 84 0.92 2.00
69–65 80 0.86 1.87
<64 70 0.79 1.78
Table 7. Evaporative Cooled Ammonia System Performance (kW/TR) at Various Weather BINs
*Evaporative condenser performance is determined by ambient wet bulb conditions, but for this comparison the condensing pressure is associated with a dry bulb temperature as a representation ofreductionstoambientconditions.TheactualwetbulbBINswereanalyzedandthetotaloperatinghours at the various conditions were similar to the dry bulb conditions used for this analysis.
Table 8. Halocarbon Cooler and Dock Performance Data at 20°F Suction / 105°F Ambient
Equipment kW/TR
Air Cooled Condensing Unit 1.76
Evaporative (Fans) 0.25
TOTAL 2.01
Page 31
Technical Paper #3 © IIAR 2008 29
Ammonia as the Sustainable Refrigerant: An Ammonia-Halocarbon Comparison
Table 9. Halocarbon Freezer Performance Data at –20°F Suction / 105°F Ambient
Equipment kW/TR
Air Cooled Condensing Unit 2.87
Evaporative (Fans) 0.29
TOTAL 3.16
Air Temperature Condensing Unit Cooler & Dock Freezer (°F) Ambient (°F) kW/TR kW/TR
99–95 105 2.01 3.16
94–90 100 1.87 2.96
89–85 95 1.75 2.78
84–80 85 1.54 2.48
79–75 80 1.45 2.33
<75 75 1.36 2.21
Table 10. Air Cooled Halocarbon System Performance (kW/TR) at Various Weather BINs
Page 32
30 © IIAR 2008 Technical Paper #3
2008 IIAR Ammonia Refrigeration Conference & Exhibition, Colorado Springs, Colorado
W
eath
er B
IN D
ata
Free
zer
Coo
ler
Load
ing
Doc
k__
____
____
____
____
____
____
____
____
____
____
____
____
____
____
____
____
____
____
____
____
____
____
____
____
____
____
____
____
____
____
____
____
____
____
____
____
–10F
35F
Lo
adin
g
MA
X
Hou
rs
–10F
Fr
eeze
r
35
F Fr
eeze
r
Lo
adin
g D
ock
D
B
@ D
B
Free
zer
Ton
C
oole
r To
n
Doc
k
Ton
(5F
Ran
ge)
Ran
ge
Ton
s x
Hrs
. k
W/T
R
kW
h
Ton
s x
Hrs
.
kW
/TR
k
Wh
To
ns
x H
rs.
kW
/TR
k
Wh
____
____
____
____
____
____
____
____
____
____
____
____
____
____
____
____
____
____
____
____
____
____
____
____
____
____
____
____
____
____
____
____
____
____
____
____
__
99
15
140
2,10
0.0
2.24
4,
704
175
2,62
5.0
1.11
2,
914
75
1,12
5.0
1.11
1,
249
94
15
3 13
8.2
21,1
49.5
2.
18
46,1
06
171.
6 26
,252
.1
1.08
28
,352
70
.9
10,8
47.5
1.
08
11,7
15
89
37
2 13
6.5
50,7
64.8
2.
29
116,
252
168.
2 62
,557
.0
1.08
67
,562
66
.8
24,8
48.4
1.
08
26,8
36
84
61
5 13
4.7
82,8
38.6
2.
23
184,
730
164.
7 10
1,31
8.8
1.04
10
5,37
2 62
.7
38,5
57.6
1.
04
40,1
00
79
96
3 13
2.9
128,
010.
9 2.
14
273,
943
161.
3 15
5,35
9.0
1.00
15
5,35
9 58
.6
56,4
25.8
1.
00
56,4
26
74
11
49
131.
2 15
0,70
4.7
2.00
30
1,40
9 15
7.9
181,
438.
8 0.
92
166,
924
54.5
62
,611
.5
0.92
57
,603
69
99
6 12
9.4
128,
876.
4 1.
87
240,
999
154.
5 15
3,87
4.2
0.86
13
2,33
2 50
.4
50,1
89.1
0.
86
43,1
63
64
83
4 12
7.6
106,
440.
3 1.
78
189,
464
151.
1 12
5,99
5.9
0.79
99
,537
46
.3
38,6
05.1
0.
79
30,4
98
59
81
0 12
5.9
101,
945.
5 1.
78
181,
463
147.
7 11
9,60
1.6
0.79
94
,485
42
.2
34,1
71.9
0.
79
26,9
96
54
90
0 12
4.1
111,
681.
8 1.
78
198,
794
144.
2 12
9,81
4.5
0.79
10
2,55
3 38
.1
34,2
77.3
0.
79
27,0
79
49
61
2 12
2.3
74,8
61.8
1.
78
133,
254
140.
8 86
,182
.0
0.79
68
,084
34
.0
20,7
98.4
0.
79
16,4
31
44
58
5 12
0.6
70,5
25.0
1.
78
125,
535
137.
4 80
,380
.4
0.79
63
,500
29
.9
17,4
81.4
0.
79
13,8
10
39
42
0 11
8.8
49,8
90.9
1.
78
88,8
06
134.
0 56
,273
.4
0.79
44
,456
25
.8
10,8
28.1
0.
79
8,55
4
34
21
3 11
7.0
24,9
25.3
1.
78
44,3
67
130.
6 27
,810
.6
0.79
21
,970
21
.7
4,61
7.8
0.79
3,
648
29
10
8 11
5.3
12,4
47.3
1.
78
22,1
56
130.
6 14
,104
.8
0.79
11
,143
0.
0 0.
0 0.
79
0
24
33
11
3.5
3,74
5.0
1.78
6,
666
130.
6 4,
309.
8 0.
79
3,40
5 0.
0 0.
0 0.
79
0
19
6
111.
7 67
0.3
1.78
1,
193
130.
6 78
3.6
0.79
61
9 0.
0 0.
0 0.
79
0
14
0
109.
9 0.
0 1.
78
0 13
0.6
0.0
0.79
0
0.0
0.0
0.79
0
9
0 10
8.2
0.0
1.78
0
130.
6 0.
0 0.
79
0 0.
0 0.
0 0.
79
0__
____
____
____
____
____
____
____
____
____
____
____
____
____
____
____
____
____
____
____
____
____
____
____
____
____
____
____
____
____
____
____
____
____
____
____
____
To
ns =
25%
am
bien
t re
late
d To
ns =
25%
am
bien
t re
late
d
Tons
= 7
0% a
mbi
ent
rela
ted
REFR
IGER
AT
ION
ELE
CT
RIC
AL
CO
NSU
MP
TIO
N
To
tal
kW
h
$/k
Wh
A
nn
ual
$
Free
zer
2,15
9,84
0 0.
08
$ 17
2,78
7
Coo
ler
1,16
8,56
6 0.
08
$ 93
,485
Lo
adin
g D
ock
364,
107
0.08
$
29,1
29
$
295,
401
UN
DER
FLO
OR
HEA
T E
LEC
TR
ICA
L C
ON
SUM
PT
ION
P
um
p H
P
Pu
mp
kW
H
ours
k
Wh
$/
kW
h
An
nu
al $
3
2.
7
3,06
3 8,
270
$
0 .0
8
$ 66
1.61
Tabl
e 11
. Am
mon
ia S
yste
m E
nerg
y C
alcu
lati
on
Page 33
Technical Paper #3 © IIAR 2008 31
Ammonia as the Sustainable Refrigerant: An Ammonia-Halocarbon Comparison
Tabl
e 12
. R-5
07A
Spl
it S
yste
m E
nerg
y C
alcu
lati
on
W
eath
er B
IN D
ata
Free
zer
Coo
ler
Load
ing
Doc
k__
____
____
____
____
____
____
____
____
____
____
____
____
____
____
____
____
____
____
____
____
____
____
____
____
____
____
____
____
____
____
____
____
____
____
____
____
–10F
35F
Lo
adin
g
MA
X
Hou
rs
–10F
Fr
eeze
r
35
F Fr
eeze
r
Lo
adin
g D
ock
D
B
@ D
B
Free
zer
Ton
C
oole
r To
n
Doc
k
Ton
(5F
Ran
ge)
Ran
ge
Ton
s x
Hrs
. k
W/T
R
kW
h
Ton
s x
Hrs
.
kW
/TR
k
Wh
To
ns
x H
rs.
kW
/TR
k
Wh
____
____
____
____
____
____
____
____
____
____
____
____
____
____
____
____
____
____
____
____
____
____
____
____
____
____
____
____
____
____
____
____
____
____
____
____
__
99
15
140
2,10
0.0
3.16
6,
636
175
2,62
5.0
2.01
5,
276
75
1,12
5.0
2.01
2,
261
94
15
3 13
8.2
21,1
49.5
2.
96
62,6
03
171.
6 26
,252
.1
1.87
49
,091
70
.9
10,8
47.5
1.
87
20,2
85
89
372
136.
5 50
,764
.8
2.78
14
1,12
6 16
8.2
62,5
57.0
1.
75
109,
475
66.8
24
,848
.4
1.75
43
,485
84
61
5 13
4.7
82,8
38.6
2.
48
205,
440
164.
7 10
1,31
8.8
1.54
15
6,03
1 62
.7
38,5
57.6
1.
54
59,3
79
79
963
132.
9 12
8,01
0.9
2.33
29
8,26
5 16
1.3
155,
359.
0 1.
45
225,
271
58.6
56
,425
.8
1.45
81
,817
74
11
49
131.
2 15
0,70
4.7
2.21
33
3,05
7 15
7.9
181,
438.
8 1.
36
246,
757
54.5
62
,611
.5
1.36
85
,152
69
99
6 12
9.4
128,
876.
4 2.
21
284,
817
154.
5 15
3,87
4.2
1.36
20
9,26
9 50
.4
50,1
89.1
1.
36
68,2
57
64
834
127.
6 10
6,44
0.3
2.21
23
5,23
3 15
1.1
125,
995.
9 1.
36
171,
354
46.3
38
,605
.1
1.36
52
,503
59
81
0 12
5.9
101,
945.
5 2.
21
225,
299
147.
7 11
9,60
1.6
1.36
16
2,65
8 42
.2
34,1
71.9
1.
36
46,4
74
54
900
124.
1 11
1,68
1.8
2.21
24
6,81
7 14
4.2
129,
814.
5 1.
36
176,
548
38.1
34
,277
.3
1.36
46
,617
49
61
2 12
2.3
74,8
61.8
2.
21
165,
445
140.
8 86
,182
.0
1.36
11
7,20
8 34
.0
20,7
98.4
1.
36
28,2
86
44
585
120.
6 70
,525
.0
2.21
15
5,86
0 13
7.4
80,3
80.4
1.
36
109,
317
29.9
17
,481
.4
1.36
23
,775
39
42
0 11
8.8
49,8
90.9
2.
21
110,
259
134.
0 56
,273
.4
1.36
76
,532
25
.8
10,8
28.1
1.
36
14,7
26
34
213
117.
0 24
,925
.3
2.21
55
,085
13
0.6
27,8
10.6
1.
36
37,8
22
21.7
4,
617.
8 1.
36
6,28
0
29
108
115.
3 12
,447
.3
2.21
27
,508
13
0.6
14,1
04.8
1.
36
19,1
83
0.0
0.0
1.36
0
24
33
11
3.5
3,74
5.0
2.21
8,
276
130.
6 4,
309.
8 1.
36
5,86
1 0.
0 0.
0 1.
36
0
19
6 11
1.7
670.
3 2.
21
1,48
1 13
0.6
783.
6 1.
36
1,06
6 0.
0 0.
0 1.
36
0
14
0 10
9.9
0.0
2.21
0
130.
6 0.
0 1.
36
0 0.
0 0.
0 1.
36
0
9 0
108.
2 0.
0 2.
33
0 13
0.6
0.0
1.36
0
0.0
0.0
1.36
0
____
____
____
____
____
____
____
____
____
____
____
____
____
____
____
____
____
____
____
____
____
____
____
____
____
____
____
____
____
____
____
____
____
____
____
____
__
Tons
= 2
5% a
mbi
ent
rela
ted
Tons
= 2
5% a
mbi
ent
rela
ted
To
ns =
70%
am
bien
t re
late
d
REFR
IGER
AT
ION
ELE
CT
RIC
AL
CO
NSU
MP
TIO
N
To
tal
kW
h
$/k
Wh
A
nn
ual
$
Free
zer
2,56
3,20
9 0.
08
$ 20
5,05
7
Coo
ler
1,87
8,71
9 0.
08
$ 15
0,29
7
Load
ing
Doc
k 57
9,29
7 0.
08
$ 46
,344
$ 40
1,69
8
FREEZ
ER
DEFR
OST
ELE
CT
RIC
AL
CO
NSU
MP
TIO
N W
atts
/ H
eate
r U
nit
s to
Def
rost
To
tal
Wat
ts
Hou
rs /
Day
/ U
nit
To
tal
kW
h
$/k
Wh
$
/ ye
ar
27,0
00
20
540,
000
1.2
236,
520
0.08
$1
8,92
2
UN
DER
FLO
OR
HEA
T E
LEC
TR
ICA
L C
ON
SUM
PT
ION
Free
zer
&
Btu
h/
sq. ft
. C
oole
r sq
. ft
.
Btu
h
wat
ts
% u
tili
zati
on
kW
h
$/k
Wh
$
/ ye
ar
2
84,3
75
168,
750
49
,632
65
28
2,28
4,00
7
0.08
$2
2,58
3
Page 34
32 © IIAR 2008 Technical Paper #3
2008 IIAR Ammonia Refrigeration Conference & Exhibition, Colorado Springs, Colorado
Table 13. Final Comparison
Ammonia Split Halocarbon Central System System
Initial Construction Cost $2,100,000 $1,892,000
Electrical Utility $296,063 $443,203
Water Consumption and
Treatment $24,062 $0
Preventative Maintenance $9,000 $8,700
Refrigerant $700 $1,760
Total: $329,825 $453,663
Annual Estimated Operating Costs
Page 35
Technical Paper #3 © IIAR 2008 33
Ammonia as the Sustainable Refrigerant: An Ammonia-Halocarbon Comparison
Electric Water, Maintenance Annual Component Utility Sewer, Contract Refrigerant PSM Replacement Year Cost Treatment Cost Cost Cost Costs
1 $296,063 $24,062 $9,000 $700
2 $310,866 $25,265 $9,450 $735
3 $326,409 $26,528 $9,923 $772
4 $342,730 $27,855 $10,419 $810
5 $359,866 $29,248 $10,940 $851 $18,233
6 $377,860 $30,710 $11,487 $893
7 $396,753 $32,245 $12,061 $938
8 $416,590 $33,858 $12,664 $985
9 $437,420 $35,551 $13,297 $1,034
10 $459,291 $37,328 $13,962 $1,086 $23,270
11 $482,255 $39,194 $14,660 $1,140 $26,551
12 $506,368 $41,154 $15,393 $1,197 $27,879
13 $531,687 $43,212 $16,163 $1,257 $29,272
14 $558,271 $45,372 $16,971 $1,320
15 $586,184 $47,641 $17,819 $1,386 $29,699
16 $615,494 $50,023 $18,710 $1,455
17 $646,268 $52,524 $19,646 $1,528
18 $678,582 $55,151 $20,628 $1,604 $183,361
19 $712,511 $57,908 $21,660 $1,685
20 $748,136 $60,803 $22,743 $1,769 $37,904
Total: $9,789,606 $795,633 $297,594 $23,146 $109,106 $267,063
Table 14. Ammonia System 20-Year Costs
Total 20-Year Life Cycle Cost (Ammonia System) = $11,282,147
Page 36
34 © IIAR 2008 Technical Paper #3
2008 IIAR Ammonia Refrigeration Conference & Exhibition, Colorado Springs, Colorado
Electric Maintenance Annual Component Utility Contract Refrigerant Replacement Year Cost Cost Cost Costs
1 $443,203 $8,700 $1,760
2 $465,363 $9,135 $1,848
3 $488,631 $9,592 $1,940
4 $513,063 $10,071 $2,037
5 $538,716 $10,575 $2,139
6 $565,652 $11,104 $2,246 $23,866
7 $593,934 $11,659 $2,359
8 $623,631 $12,242 $2,476 $26,313
9 $654,813 $12,854 $2,600
10 $687,553 $13,497 $2,730 $29,010
11 $721,931 $14,171 $2,867
12 $758,028 $14,880 $3,010 $31,983
13 $795,929 $15,624 $3,161
14 $835,725 $16,405 $3,319 $35,262
15 $877,512 $17,225 $3,485
16 $921,387 $18,087 $3,659 $495,377
17 $967,457 $18,991 $3,842 $520,146
18 $1,015,829 $19,941 $4,034
19 $1,066,621 $20,938 $4,236
20 $1,119,952 $21,984 $4,447
Total: $14,654,930 $287,674 $58,196 $1,161,957
Table 15. Halocarbon System 20-Year Costs
Total 20-Year Life Cycle Cost (Split Halocarbon System) = $16,162,757
Page 37
Technical Paper #3 © IIAR 2008 35
Ammonia as the Sustainable Refrigerant: An Ammonia-Halocarbon Comparison
Nom
inal
Tot
al
To
tal
P
roje
cted
Tot
al
Mot
or
Qty
H
P
BH
P
FLA
E
FF
PF
KVA
k
W
KVA
R
FLA
k
W
KVA
R__
____
____
____
____
____
____
____
____
____
____
____
____
____
____
____
____
____
____
____
____
____
____
____
____
____
____
____
_
–20
Com
pres
sor
120
017
624
0.0
93.0
87
.0
184.
416
0.4
90.9
24
0.0
141.
280
.0
–20
Com
pres
sor
120
017
624
0.0
93.0
87
.0
184.
416
0.4
90.9
24
0.0
141.
280
.0
–20
Com
pres
sor
126
325
831
8.0
88.7
88
.7
233.
620
7.2
107.
931
8.0
203.
210
5.8
____
____
____
____
____
____
____
____
____
____
____
____
____
____
____
____
____
____
____
____
____
____
____
____
____
____
____
___
C
onde
nser
Fan
s 3
10
10
14.0
87
.0
85.0
10
.1
25.7
15
.9
42.0
25
.7
15.9
C
onde
nser
Pum
p 1
7.5
7.5
11.0
86
.0
85.0
7.
7 6.
5 4.
0 11
.0
6.5
4.0
–2
0A
mm
onia
Pum
p1
33
4.8
82.0
75
.0
3.6
2.7
2.4
4.8
2.7
2.4
–2
0A
mm
onia
Pum
p1
33
4.8
82.0
75
.0
3.6
2.7
2.4
4.8
2.7
2.4
____
____
____
____
____
____
____
____
____
____
____
____
____
____
____
____
____
____
____
____
____
____
____
____
____
____
____
___
–1
0Fr
eeze
rA
irU
nits
12
2
24.
374
.0
60.0
3.
424
.2
32.3
51
.6
24.2
32
.3
–35
Coo
ler
16
22
4.3
74.0
60
.0
3.4
32.3
43
.0
68.8
32
.3
43.0
–3
5D
ock
33
34.
882
.0
75.0
3.
68.
27.
214
.4
8.2
7.2
____
____
____
____
____
____
____
____
____
____
____
____
____
____
____
____
____
____
____
____
____
____
____
____
____
____
____
___
U
nder
floo
rG
lyco
lPum
p1
33
4.8
82.0
75
.0
3.6
2.7
2.4
4.8
2.7
2.4
____
____
____
____
____
____
____
____
____
____
____
____
____
____
____
____
____
____
____
____
____
____
____
____
____
____
____
___
C
omR
oom
Ven
tFa
ns
13
34.
882
.0
75.0
3.
62.
72.
44.
82.
72.
4__
____
____
____
____
____
____
____
____
____
____
____
____
____
____
____
____
____
____
____
____
____
____
____
____
____
____
____
_
1000
ci
rcui
ts
sq
ft
____
____
____
____
____
____
____
____
____
____
____
____
____
____
____
____
____
____
____
____
____
____
____
____
____
____
____
___
Su
b Fl
oor
Hea
t
0
____
____
____
____
____
____
____
____
____
____
____
____
____
____
____
____
____
____
____
____
____
____
____
____
____
____
____
___
T
OTA
L:
63
5.7
401.
7 10
05.0
59
3.3
377.
8__
____
____
____
____
____
____
____
____
____
____
____
____
____
____
____
____
____
____
____
____
____
____
____
____
____
____
____
_
N
omin
alk
W:
635.
7Pr
ojec
ted
kW:
593.
4
Nom
inal
KVA
R:
401.
7Pr
ojec
ted
KVA
R:
377.
9
Nom
inal
KVA
:75
2.1
Proj
ecte
dK
VA:
703.
5
Nom
inal
Pow
erF
acto
r:
0.8
Proj
ecte
dPo
wer
Fac
tor:
0.
8
Req
uire
d A
mpa
city
: 10
84.5
____
____
____
____
____
____
____
____
____
____
____
____
____
____
____
____
____
____
____
____
____
____
____
____
____
____
____
___
Not
e:F
LA,
EFF,
PF
and
BH
Pba
sed
onp
ublis
hed
“ave
rage
val
ues”
for
mot
ors
tob
esu
pplie
d.
App
endi
x A
. New
Am
mon
ia F
reez
er S
yste
m, A
tlan
ta, G
A (
150,
000
sq. f
t.)
Page 38
36 © IIAR 2008 Technical Paper #3
2008 IIAR Ammonia Refrigeration Conference & Exhibition, Colorado Springs, Colorado
1.ProjectlocatedinAtlanta,GAarea 2.Equipmentselectedfor115°Fambientcapacityand105°Fambientpower 3. Refrigerant R-507 4. Rubber material insulation for suction and condensate drain piping 5.Firstyearlaborwarrantyexcluded 6. 20 ft of piping for suction and liquid on each circuit 7. Liquid line velocity <300 fpm 8. Suction line velocity <3000 fpm 9. Condensate drains piped to hub below evaporator10. Thermostat control wired by others11.Nounderfloorheatingsystem12. Power wiring by others13. Room sizing and Temperatures:
Total Freezer Temp Cooler Temp Dock Temp 150,000 67,500 –10°F 16,875 28°F 15,000 38°F 16,875 34°F 16,875 38°F 16,875 40°F14. Split system equipment count: Number of Number of Location Condensing Units Evaporators –10°Ffreezer 8 16 28°Fcooler 2 4 34°Fcooler 2 4 38°Fcooler 2 4 40°Fcooler 2 4 38°Fdock 2 4
15. System kW: Number of Number of Location Condensing Units Evaporators Total kW –10°Ffreezer 8 16 442.4 28°Fcooler 2 4 97.2 34°Fcooler 2 4 101.4 38°Fcooler 2 4 81.3 40°Fcooler 2 4 72.4 38°Fdock 2 4 150.2 System Total: 944.9
Appendix B. Split Halocarbon System Estimate Basis
Page 39
Technical Paper #3 © IIAR 2008 37
Ammonia as the Sustainable Refrigerant: An Ammonia-Halocarbon Comparison
Appendix B. Split Halocarbon System Estimate Basis (continued)
16. System tonnage: Number of Number of Location Condensing Units Evaporators Total TR –10°Ffreezer 8 16 140 28°Fcooler 2 4 46 34°Fcooler 2 4 51 38°Fcooler 2 4 40 40°Fcooler 2 4 38 38°Fdock 2 4 75 System Total: 390
17. Room load: Number of Number of Location Condensing Units Evaporators Sq ft/TR –10°Ffreezer 8 16 482 28°Fcooler 2 4 367 34°Fcooler 2 4 331 38°Fcooler 2 4 422 40°Fcooler 2 4 440 38°Fdock 2 4 200
Page 40
Notes:
38 © IIAR 2008 Technical Paper #3
2008 IIAR Ammonia Refrigeration Conference & Exhibition, Colorado Springs, Colorado