34
Interim financial statements for the period ended 31 December 2017

Interim Financial Statements for the period ended 31 December 2017 Page 1
Inte
rim
fin
an
cia
l sta
tem
ents
for
the
per
iod
en
ded
31
Dec
emb
er 2
017

Page 2 MyBucks Integrated Report 2017.
Table of contents.
The reports and statements set out below comprise the consolidated interim financial statements presented to the shareholders:
Chief Executive Report 4
Consolidated Statement of Profit or Loss and Other Comprehensive Income 6
Consolidated Statement of Financial Position 8
Consolidated Statement of Changes in Equity 10
Consolidated Statement of Cash Flow 12
Notes to the Consolidated Financial Statements 13
Interim Financial Statements for the period ended 31 December 2017 Page 3

Page 4 MyBucks S.A.
Chief Executive report.
The state of the world and Artificial Intelligence (AI)
Younger, tech-savvy consumers demand transparent and efficient service at their fingertips. Why is this relevant? Because millennials will very soon be occupying the driving seat in most sectors of the world economy, their needs will drive growth. Digitally-driven consumers demand a personalised service at their fingertips, wherever and whenever they want it. In order to retain a competitive advantage in this rapidly evolving Fourth Industrial Revolution, companies will need teams of tech innovators that keep these demands in mind. In order to satisfy these needs, blockchain, Machine Learning (ML) and AI have transformed the digital transformation space into one that is not only efficient and fast, but also fun and relevant.
Global trends in AI point to a rapidly evolving world, where learning, decision-making and deep neural networks are able to interact and predict in near real-time. Not only are consumers thus rapidly becoming used to interacting with AI but companies are increasingly realising that they need to be at the leading edge of AI development, in order to pioneer the new age of technology. AI has forever changed the inherent delays and human-driven red tape that slowed and inhibited all sectors of the economy, not least the paper-driven world of traditional banking.
MyBucks poised on the leading edge of innovation
MyBucks is continually pushing the envelope of innovation, which has driven its rapid growth in market segments that have, until now, been out of reach of brick-and-mortar banks. MyBucks understands that the tech-savvy consumer wants efficient service,
wherever and whenever, and appreciates that most younger people are used to interacting with AI. MyBucks, a FinTech company with innovation in its DNA, also understands that AI and ML provide immense possibilities for optimising operations, from supporting various divisions of its business to minimising credit risk arising from repayment of loans (collections).
MyBucks has deployed AI to all aspects of its business. MyBucks currently uses AI for credit scoring, fraud detection and to predict when potential clients are going to drop-off its website, using behavioural characteristics. Two of the latest uses of AI are to interpret natural language queries through MyBucks’ TExt-based virtual aSSistant (TESS) and to improve collections using a self-learning collections system.
AI across the MyBucks business
TESS will be integrated into all aspects of the MyBucks business, including but not limited to collections; lending; banking; insurance; customer service; and customer on-boarding. In the aforementioned areas, TESS will engage with customers and assist with claims, sales, quotations and general queries.
The first notable application of TESS is in instant messaging, where MyBucks launched WhatsApp-based lending. In the USA, young people (aged 18 to 24) send an average of 67 text messages a day, according to businessinsider.com. The average text response time is 90 seconds, as opposed to the 90-minute turnaround time for email. A fascinating insight, which is highly relevant to a business wishing to communicate with its clients, is that in excess of 97% of text messages are opened, compared to 22% of emails. If efficiency and immediacy are your calling card, consider that 90% of all

Interim Financial Statements for the period ended 31 December 2017 Page 5
text messages are read within three minutes of delivery. The MyBucks self-learning collections system will use AI to predict which clients have a high probability of missing a payment and, based on these predictions, will prepare bespoke messages and determine the correct time and appropriate channel to pre-emptively communicate with these clients. MyBucks expects this innovation to lead to higher customer satisfaction rates and lower default rates.
MyBucks and blockchain
Blockchain can be regarded as the new internet. What does this mean? While the internet allows for the transfer of data between a network of devices, blockchain allows for the transfer of value between parties without a centralised third party to validate transactions. Blockchain provides transparency of transactions and is immutable, which characteristics provide almost infinite uses for this technology. Just as early surfers figured out what the internet was for in the 1990s, the world is currently figuring out what to do with blockchain.
MyBucks is currently investigating numerous use cases of blockchain technology throughout its technology ecosystem and, since MyBucks operates in 13 countries on three continents, it can utilise its existing infrastructure to launch innovations that improve the lives of its customers.
Financials
MyBucks turned its financial results around in the first half of the financial year and the MyBucks Group recorded a positive profit before tax of € 66.6k, compared to a full-year loss before tax of €7.7m as at 30
June 2017. This recovery was on the back of revenues in the amount of approximately €29.0m and a slight improvement in the Impairment to Revenue Ratio, from 22.4% to 21.4%. The Operational Cost Ratio improved from 68.3% to approx. 60.3%, significantly contributing to the enhanced performance.
The key contributor to the improved results was the successful turnaround strategy implemented at the banks operated under the Opportunity Bank brand. The banking operations exceeded expectations by delivering an €8.2m contribution to Profit Before Tax, exceeding the full-year contribution from the previous financial year. In addition to the above, the Group recorded a €2.1m Profit Before Tax from its Southern African Lending Operations.
Contrary to the above, the Eastern-African Operations incurred a loss of approx. €0.5m. The Group’s technology division suffered a Loss Before Tax of approx. €8.6m and that loss was driven largely by the Group’s finance costs, which remained high for the first half year at approximately €11.9m. MyBucks expects to significantly reduce finance costs through its recent private placement and by further debt refinancing measures that will be implemented in the remainder of the 2018 financial year. MyBucks expects that the ongoing banking license applications; the launch of new insurance and lending products using AI; and the further enhancement of its UX (user experience) through TESS will allow the Group to enhance its product offering and position it well for future growth.
Chief Executive report. (continued)

Page 6 MyBucks S.A.
31 December 2017 30 June 2017
31 December 2016
(restated)
EUR Notes 6 months Full year 6 months
Profit and lossRevenue 3 29 007 074 53 773 404 24 564 175
Loan book impairments (6 210 249) (12 039 736) (5 863 455)
Other income 4 4 497 805 6 191 698 4 073 687
Employee costs (7 032 643) (13 907 805) (6 905 615)
Depreciation, amortisation and impairments (1 046 795) (2 520 109) (1 109 747)
Consulting and professional fees (2 034 971) (4 893 710) (2 251 804)
Operating expenses (7 432 568) (15 665 672) (7 228 475)
Operating profit 9 747 653 10 938 070 5 278 766
Investment revenue 5 2 189 349 2 683 535 858 852
Finance costs 6 (11 870 358) (21 311 705) (9 499 108)
(Loss) / Profit before taxation 66 644 (7 690 100) (3 361 490)
Income tax expense (2 209 584) (3 428 701) (2 142 651)
Loss from continuing operations (2 142 940) (11 118 801) (5 504 141)
Loss from discontinued operations (598 413) (1 895 349) (480 881)
Loss for the period (2 741 353) (13 014 150) (5 985 022)
Consolidated statement of profit and loss and other comprehensive income.

Interim Financial Statements for the period ended 31 December 2017 Page 7
31 December 2017 30 June 2017
31 December 2016
(restated)
EUR Notes 6 months Full year 6 months
Other comprehensive incomeExchange difference in translating foreign
operations (357 246) 1 319 818 1 246 212
NCI portion of exchange difference in translating
foreign operations (255 912) (322 559) 122 921
Effects of cash flow hedges - (59 601) (59 601)
Share of other comprehensive income of joint
venture Total items that may be reclassified to profit or
loss (613 158) 937 658 1 309 532
Total other comprehensive income for the period (613 158) 937 658 1 309 532
Total Comprehensive loss for the period (3 354 511) (12 076 492) (4 675 490)
Loss attributable to:
Owners of the parent
Continuing operations (3 106 833) (13 139 298) (6 568 279)
Discontinued operations (598 413) (1 895 349) (480 881)
(3 705 246) (15 034 647) (7 049 160)
Non Controlling interest
Continuing operations 963 893 2 020 497 1 064 139
Discontinued operations - - -
963 893 2 020 497 1 064 139
Total comprehensive loss attributable to:
Owners of the parent (4 062 492) (13 774 430) (5 862 550)
Non Controlling interest 707 981 1 697 938 1 187 060
(3 354 511) (12 076 492) (4 675 490)
Earnings per share
Basic loss per share from continuing operations 18 (0.27) (1.14) (0.59)
Basic loss per share from discontinuing
operations18 (0.05) (0.16) (0.04)
Diluted loss per share from continuing operations 18 (0.27) (1.14) (0.59)
Diluted loss per share from discontinuing
operations18 (0.05) (0.16) (0.04)
The 31 December 2016 results were adjusted to reflect the accounting errors identified in the prior financial year. Refer to the
consolidated combined financial statement of profit and loss and other comprehensive income for the year ended 30 June
2017 for detail on these restatements. The above consolidated statement of profit and loss and other comprehensive income
should be read in conjunction with the accompanying condensed notes.
Consolidated statement of profit and loss and other comprehensive income.

Page 8 MyBucks S.A.
31 December 2017 30 June 2017
EUR 6 months Full year
AssetsNon-Current Assets
Property and equipment 7 12 945 609 11 028 568
Goodwill 3 061 989 3 055 362
Intangible assets 8 6 254 598 6 228 262
Loans to other related parties 9 7 366 117 5 237 581
Deferred tax 2 435 665 2 374 348
Loan book 10 24 583 677 22 784 603
56 647 655 50 708 724
Current Assets
Loans to other related parties 9 12 852 453 10 204 601
Other receivables 11 22 477 641 14 654 912
Fixed cash deposits 15 657 554 19 067 384
Other financial assets 538 515 484 121
Loan book 10 49 056 188 45 742 325
Taxation paid in advance 320 116 782 115
Cash and cash equivalents 12 13 157 246 15 050 536
114 059 713 105 985 994
Total assets 170 707 368 156 694 718
EquityEquity attributable to owners of Parent
Share capital 13 11 665 612 11 665 612
Share premium 19 348 748 19 348 748
Foreign currency translation reserve (1 840 414) (1 483 168)
Other reserves (1 204 912) (1 274 763)
Accumulated loss (20 507 636) (16 802 393)
7 461 398 11 454 036
Non-Controlling interest 9 251 932 8 779 591
16 713 330 20 233 627
Consolidated statement of financial position.

Interim Financial Statements for the period ended 31 December 2017 Page 9
31 December 2017 30 June 2017
EUR 6 months Full year
LiabilitiesNon-current liabilities
Loans from other related parties 9 24 894 326 26 823 581
Other financial liabilities 14 23 903 642 19 438 852
Held for sale 1 557 927 -
Finance lease liabilities 222 103 102 468
Deferred tax 103 764 67 860
Deferred grant income 15 126 623 179 538
Deposits from customers 16 174 590 183 453
50 982 975 46 795 752
Current liabilities
Trade and other payables 18 212 516 11 529 802
Loans from shareholders 1 942 941 4 774 000
Loans from other related parties 9 13 894 738 10 348 630
Other financial liabilities 14 50 940 395 43 957 753
Finance lease liabilities 81 955 40 868
Deferred grant income 15 1 449 123 2 054 696
Current tax payable 704 893 1 282 512
Deposits from customers 16 14 799 105 11 310 110
Bank overdraft 12 985 397 4 366 968
103 011 063 89 665 339
Total Liabilities 153 994 038 136 461 091
Total Equity and liabilities 170 707 368 156 694 718
The above consolidated statement of financial position should be read in conjunction with the accompanying condensed notes.
Consolidated statement of financial position.

Page 10 MyBucks S.A.
Co
nso
lida
ted
sta
tem
ent
of
cha
ng
es in
eq
uit
y.
EUR
Tota
l sha
re
cap
ita
lS
hare
pr
emiu
m
Fore
ign
curr
ency
tr
ans
lati
on
rese
rve
Oth
er
rese
rves
Acc
umul
ate
d
loss
Tota
l att
rib
uta
ble
to
ow
ners
of
the
pare
ntN
on-C
ontr
ollin
g
inte
rest
Tota
l Eq
uity
Ba
lanc
e a
s a
t 1
July
20
16 a
s re
sta
ted
10
998
00
0
8 4
13 2
79
(2
80
2 98
6)
(1
861
08
7) (
766
30
2) 1
3 98
0 9
04
3
123
39
0
17
104
294
Loss
for
the
per
iod
--
--
(7
049
16
0)
(7
049
16
0)
1 0
64
139
(
5 98
5 0
21)
Oth
er c
omp
rehe
nsiv
e in
com
e-
- 1
24
6 2
12
(59
60
1)-
1 1
86
611
-
1 3
09
532
Tota
l com
pre
hens
ive
loss
for
the
yea
r -
-
1
24
6 2
12
(59
60
1) (
7 0
49 1
60
) (
5 8
62
549
) 1
06
4 1
39
1 1
87
06
0
Issu
e of
sha
res
150
00
0
1 8
75 0
01
--
- 2
025
00
0
- 2
025
00
0
Sha
re b
ase
d p
aym
ent
rese
rve
--
- 4
63
892
- 4
63
892
- 4
63
892
Ca
pit
al i
njec
tion
by
min
orit
y S
hare
hold
er-
--
--
-
- -
Acq
uisi
tion
of
sub
sid
iary
--
--
- -
4
220
48
3 4
220
48
3
Div
iden
ds
--
--
- -
(
111
461
) (
111
461
)
Tra
nsa
ctio
ns w
ith
NC
I-
--
--
-
- -
Tota
l con
trib
utio
ns b
y a
nd d
istr
ibut
ions
to
owne
rs o
f co
mp
any
150
00
0
1 8
75 0
01
-
46
3 89
2 -
2
48
8 8
92
4 1
09
022
6
59
7 9
14
Ba
lanc
e a
s a
t 31
Dec
embe
r 20
16 1
1 14
8 0
00
1
0 2
88
28
0
(1
556
774
) (
1 4
56 7
96)
(7
815
46
2) 1
0 6
06
24
7 8
296
551
8
419
472
Loss
for
the
per
iod
--
--
(7
985
48
7) (
7 98
5 4
87)
956
358
(4
45
48
0)
Oth
er c
omp
rehe
nsiv
e in
com
e-
- (
73 6
06
)-
- (
73 6
06
) (
322
559)
510
878
Tota
l com
pre
hens
ive
loss
for
the
yea
r -
-
(
73 6
06
) -
(
7 98
5 4
87)
(7
911
88
1) 6
33 7
99
(
7 4
01
00
3)
Issu
e of
sha
res
517
612
9
06
0 4
68
-
--
9 5
78 0
81
- 9
578
08
1
sha
re b
ase
d p
aym
ent
rese
rve
--
- 1
82
033
-
18
2 0
33
- 1
82
033
Ca
pit
al i
njec
tion
by
min
orit
y S
hare
hold
er-
--
--
-
36
8 1
83
36
8 1
83
Acq
uisi
tion
of
sub
sid
iary
--
--
- -
3
6 8
39
36
839
Div
iden
ds
--
--
- -
(4
80
578
) (4
80
578
)
Tra
nsa
ctio
ns w
ith
NC
I-
--
- (
1 0
01
44
4)
(1
00
1 4
44
) (
75 2
03)
(1
076
64
7)
Tota
l con
trib
utio
ns b
y a
nd d
istr
ibut
ions
to
owne
rs o
f co
mp
any
517
612
9
06
0 4
68
-
1
82
033
(
1 0
01
44
4)
8 7
58 6
70
(15
0 7
59)
8 6
07
911
Ba
lanc
e a
s a
t 30
Jun
e 20
17 1
1 6
65
612
19
34
8 7
48
(
1 4
83
168
) (
1 27
4 7
63)
(16
80
2 39
3) 1
1 4
54 0
36
8 7
79 5
91
20
233
627
The
ab
ove
cons
olid
ate
d s
tate
men
t of
cha
nges
in e
qui
ty s
houl
d b
e re
ad
in c
onju
ncti
on w
ith
the
acc
omp
any
ing
con
den
sed
no
tes.

Interim Financial Statements for the period ended 31 December 2017 Page 11
Co
nso
lida
ted
sta
tem
ent
of
cha
ng
es in
eq
uit
y.
EUR
Tota
l sha
re
cap
ita
lS
hare
pr
emiu
mFo
reig
n cu
rren
cy
tra
nsla
tion
res
erve
Oth
er
rese
rves
Acc
umul
ate
d
loss
Tota
l att
rib
uta
ble
to
ow
ners
of
the
pare
ntN
on-C
ontr
ollin
g
inte
rest
Tota
l Eq
uity
--
--
--
-
Loss
for
the
per
iod
--
--
(3
705
246
) (
3 70
5 24
6)
96
3 89
3 (
2 74
1 35
3)
Oth
er c
omp
rehe
nsiv
e in
com
e-
- (
357
246
)-
- (
357
246
) (
255
912
) (6
13 1
58)
Tota
l com
pre
hens
ive
loss
for
the
yea
r -
-
(
357
246
) -
(
3 70
5 24
6)
(4 0
62
492)
70
7 98
1 (
3 35
4 5
11)
Issu
e of
sha
res
--
--
- -
-
-
Sha
re b
ase
d p
aym
ent
rese
rve
--
- 6
9 8
54
- 6
9 8
54
- 6
9 8
54
Ca
pit
al i
njec
tion
by
min
orit
y
Sha
reho
lder
--
--
- -
-
-
Acq
uisi
tion
of
sub
sid
iary
--
--
- -
-
-
Div
iden
ds
--
--
- -
(
235
64
0)
(23
5 6
40
)
Tra
nsa
ctio
ns w
ith
NC
I-
--
--
-
- -
Tota
l con
trib
utio
ns b
y a
nd
dis
trib
utio
ns t
o o
wne
rs o
f
com
pa
ny
-
-
-
69
854
-
6
9 8
54
(23
5 6
40
) (
165
786
)
Ba
lanc
e a
t 31
Dec
embe
r 20
17 1
1 6
65
612
19
34
8 7
48
(
1 8
40
414
) (
1 20
4 9
09
) (
20 5
07
639
) 7
461
398
9
251
932
1
6 7
13 3
30
The
ab
ove
cons
olid
ate
d s
tate
men
t of
cha
nges
in e
qui
ty s
houl
d b
e re
ad
in c
onju
ncti
on w
ith
the
acc
omp
any
ing
con
den
sed
no
tes.
Page 12 MyBucks S.A.
Notes
31 December
2017
30 June
2017
31 December
2016(restated)
EUR 6 months Full year 6 months
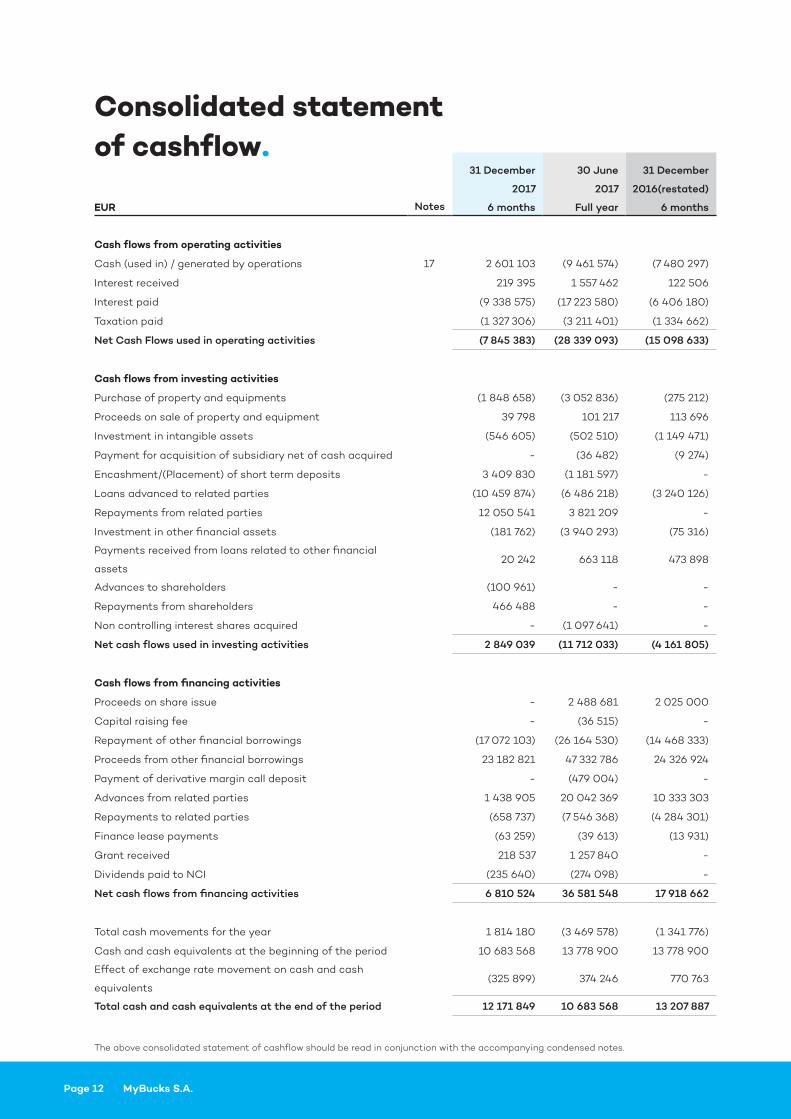
Cash flows from operating activities
Cash (used in) / generated by operations 17 2 601 103 (9 461 574) (7 480 297)
Interest received 219 395 1 557 462 122 506
Interest paid (9 338 575) (17 223 580) (6 406 180)
Taxation paid (1 327 306) (3 211 401) (1 334 662)
Net Cash Flows used in operating activities (7 845 383) (28 339 093) (15 098 633)
Cash flows from investing activities
Purchase of property and equipments (1 848 658) (3 052 836) (275 212)
Proceeds on sale of property and equipment 39 798 101 217 113 696
Investment in intangible assets (546 605) (502 510) (1 149 471)
Payment for acquisition of subsidiary net of cash acquired - (36 482) (9 274)
Encashment/(Placement) of short term deposits 3 409 830 (1 181 597) -
Loans advanced to related parties (10 459 874) (6 486 218) (3 240 126)
Repayments from related parties 12 050 541 3 821 209 -
Investment in other financial assets (181 762) (3 940 293) (75 316)
Payments received from loans related to other financial
assets 20 242 663 118 473 898
Advances to shareholders (100 961) - -
Repayments from shareholders 466 488 - -
Non controlling interest shares acquired - (1 097 641) -
Net cash flows used in investing activities 2 849 039 (11 712 033) (4 161 805)
Cash flows from financing activities
Proceeds on share issue - 2 488 681 2 025 000
Capital raising fee - (36 515) -
Repayment of other financial borrowings (17 072 103) (26 164 530) (14 468 333)
Proceeds from other financial borrowings 23 182 821 47 332 786 24 326 924
Payment of derivative margin call deposit - (479 004) -
Advances from related parties 1 438 905 20 042 369 10 333 303
Repayments to related parties (658 737) (7 546 368) (4 284 301)
Finance lease payments (63 259) (39 613) (13 931)
Grant received 218 537 1 257 840 -
Dividends paid to NCI (235 640) (274 098) -
Net cash flows from financing activities 6 810 524 36 581 548 17 918 662
Total cash movements for the year 1 814 180 (3 469 578) (1 341 776)
Cash and cash equivalents at the beginning of the period 10 683 568 13 778 900 13 778 900
Effect of exchange rate movement on cash and cash
equivalents (325 899) 374 246 770 763
Total cash and cash equivalents at the end of the period 12 171 849 10 683 568 13 207 887
The above consolidated statement of cashflow should be read in conjunction with the accompanying condensed notes.
Consolidated statement of cashflow.

Interim Financial Statements for the period ended 31 December 2017 Page 13
1. General information.
MyBucks is a FinTech company that embraces technology as a means to provide financial products and services to our customers. The Group’s current primary activities are micro-lending as well as providing customers with banking services. The group provides various lending products, from short term (1 week) to long term (60 months). The loan products are a combination of deduction at source collections and normal repayment by customer through either direct debit or deposits. The Group focusses on developing advanced technology to deliver efficient and customer-oriented service to our customers. MyBucks S.a.r.l. was incorporated as a holding company with interest in the financial services industry on 7 August 2015 in Luxembourg and obtained its certificate to commence business (B199543) on the same day. The group operates in Sub-Saharan Africa, Australia and Europe with a registered head office at 14, Rue Steichen, L-2540, Luxembourg. The Company changed its legal form from a Société á responsabilité limitée into a Société Anonyme. It was resolved by the Shareholders’ Meeting on 12 January 2016.
2. Summary of significant accounting policies. 2.1 Basis of preparation These condensed interim financial statements for the six months ended 31 December 2017 have been prepared in accordance with IAS 34 interim financial
reporting. The condensed interim financial statements should be read in conjunction with the annual financial statements for the year ended 30 June 2017, which have been prepared in accordance with International Financial Reporting Standards as adopted by the EU. The accounting policies adopted are consistent with those of the previous financial year except as described below, and are not repeated in this condensed interim report. Taxes on income in the interim periods are accrued using the tax rate that would be applicable to the expected total annual profit or loss. The interim period income taxes for the six months perioded ended 31 December 2017 have been accrued based on the various operating countries effective tax rates. The preparation of financial statements pursuant to IFRS requires management to make critical accounting estimates. The application of the Company’s accounting policies also requires that management makes assumptions and exercises its judgement in the process of applying the Groups accounting policies. These assumptions and estimates affect the amounts reported of assets and liabilities, income and expenses. Actual results may diverge from these estimates. In preparing this set of financial statements, the material judgments made by management in applying the Group’s accounting policies and the key sources of estimation uncertainty were the same as those applied to the consolidated combined financial statements for the year ended 30 June 2017. 2.2 Impairment of financial assets At each reporting date the group assesses all financial assets, other than those at fair value through profit or loss, to determine whether
Notes to the consolidated financial statements.

Page 14 MyBucks S.A.
there is objective evidence that a financial asset or group of financial assets have been impaired. An emergence period concept is applied to ensure that only impairments that exist at the reporting date are captured. The emergence period is defined as the time lapse between the occurrence of a trigger event (unidentified impairment) and the impairment being identified at an individual account level (identified impairment).
A financial asset or a group of financial assets are impaired and impairment losses are incurred only if there is objective evidence of impairment as a result of one or more events that occurred after the initial recognition of the asset (a ‘loss event’) and that loss event (or events) has an impact on the estimated future cash flows of the financial asset or group of financial assets that can be reliably estimated.
Criteria that are used by the group in determining whether there is objective evidence of impairment include:.• a breach of contract, such as default or
delinquency in interest and/or principal payments; it becoming probable that the borrower will enter bankruptcy
• concessions granted from the lender to the borrower that the lender would not have considered normally
If there is objective evidence that an impairment loss on loans and receivables
has been incurred, the amount of the loss is measured as the difference between the asset’s carrying amount and the present value of estimated future cash flows (excluding future credit losses that have not been incurred) discounted at the financial asset’s original effective interest rate. The carrying amount of the loan is reduced through the use of an allowance for credit losses account and the loss is recognised as a credit impairment charge in the consolidated Statement of Profit or Loss.
If the group determines that no objective evidence of impairment exists for an individually assessed loan, whether significant or not, it includes the loan in a group of financial loans with similar credit risk characteristics and collectively assesses for impairment. Loans that are individually assessed for impairment and for which an impairment loss is recognised are not included in a collective assessment for impairment. In order to provide for latent losses in a group of loans that have not yet been identified as specifically impaired, a credit impairment for incurred but not reported losses is recognised based on historic loss patterns and estimated emergence periods (time period between the loss trigger events and the date on which the group identifies the losses).
Notes to the consolidated financial statements.

Interim Financial Statements for the period ended 31 December 2017 Page 15
EUR
31 December
2017
30 June
2017
31 December
2016 (restated)
Interest income 23 169 202 42 335 262 19 591 289
Fee income 1 671 635 3 455 420 1 449 188
Commission on insurance policies 4 166 237 7 982 722 3 523 698
29 007 074 53 773 404 24 564 175
3. Revenue.
EUR
31 December
2017
30 June
2017
31 December
2016 (restated)
Gain on bargain purchase in a business combination - 2 850 600 2 850 600
Gain on sale of Malawian loan book 2 255 473 - -
Grant income 876 996 1 725 766 861 613
Bad debts recovered 322 248 565 984 139 935
Other income 1 043 088 1 049 348 221 539
4 497 805 6 191 698 4 073 687
4. Other income.
EUR
31 December
2017
30 June
2017
31 December
2016 (restated)
Interest on bank and other cash - 18 954 -
Interest on loans 2 189 349 2 664 581 858 852
2 189 349 2 683 535 858 852
5. Investment revenue.
EUR
31 December
2017
30 June
2017
31 December
2016 (restated)
Interest on all financial borrowings (10 951 594) (17 254 816) (8 697 262)
Net foreign exchange (losses)/gain on foreign currency
borrowings (392 621) (1 075 218) 448 975
Funding origination costs (414 960) (2 678 692) (1 379 682)
Other interest expense (111 183) (302 979) 128 861
(11 870 358) (21 311 705) (9 499 108)
6. Finance cost.
Notes to the consolidated financial statements.

Page 16 MyBucks S.A.
7. P
rop
erty
an
d e
qu
ipm
ent.
EU
R31
Dec
embe
r 20
17O
peni
ng
bala
nce
Ad
dit
ions
Dis
posa
lsFo
reig
n ex
cha
nge
mov
emen
tsO
ther
cha
nges
(r
ecla
ssifi
cati
on)
Dep
reci
ati
on
Clo
sing
b
ala
nce
Land
1 8
10 8
85
- -
2
354
1
20 0
00
-
1
933
239
Bui
ldin
gs
6 4
66
532
1
355
26
8
-
3 5
80
(
120
00
0)
(5
64
3) 7
69
9 7
37
Furn
itur
e a
nd fi
xtur
es 5
18 2
20
29
0 2
31
(73
813
) (
22 0
75)
- (
136
836
) 5
75 7
27
Mo
tor
vehi
cles
4
87
030
2
30 0
14
(32
834
) (
15 7
46
)-
(8
2 33
4)
58
6 1
30
Offi
ce e
qui
pm
ent
1 0
17 8
23
71
80
9
(7
08
4)
(20
36
4)
- (
71 7
39)
99
0 4
45
IT e
qui
pm
ent
40
7 33
0
70
4 9
91
(76
26
6)
(37
757
)-
(20
1 37
4)
796
924
Lea
seho
ld im
pro
vem
ents
320
74
8
88
99
1 (
19 5
04
) (
5 72
7)-
(21
10
1) 3
63
40
7
11
028
56
8
2 7
41
304
(
209
50
1) (
95 7
35)
-
(51
9 0
27)
12
945
60
9
30 J
une
2017
Ope
ning
ba
lanc
eA
dd
itio
ns
Ad
dit
ions
th
roug
h b
usin
ess
com
bin
ati
onD
ispo
sals
Fore
ign
exch
ang
e m
ovem
ents
Oth
er c
hang
es
(rec
lass
ifica
tion
)D
epre
cia
tion
In
tere
st
cap
ita
lised
Clo
sing
b
ala
nce
Land
-
1 2
40
422
6
14 1
63
-
(44
39
0)
69
0
-
-
1 8
10 8
85
Bui
ldin
gs
64
1 52
3 4
723
833
8
60
46
0
-
15
119
-
(
37 2
86
) 2
62
88
3 6
46
6 5
32
Furn
itur
e a
nd fi
xtur
es 3
75 7
75
95
06
6
189
89
1 (
12 4
89)
3 2
55
29
069
(
162
347)
-
518
220
Mo
tor
vehi
cles
2
59 2
96
97
90
1 3
36 3
57
(13
74
3) (
2 28
4)
-
(19
0 4
97)
-
48
7 0
30
Offi
ce e
qui
pm
ent
96
735
4
39 5
48
6
50 4
00
(
9 7
88
) (
16 0
96)
66
04
3 (
209
019
) -
1
017
823
IT e
qui
pm
ent
158
276
2
49
733
2
32 5
21
(17
198
) (
18 3
05)
11
984
(
209
68
1) -
4
07
330
Lea
seho
ld im
pro
vem
ents
155
811
1
62
576
3
21 9
36
(79
89
3) (
5 12
4)
(10
7 78
6)
(12
6 7
72)
-
320
74
8
1 6
87
416
7
00
9 0
79
3 2
05
728
(
133
111)
(67
825
) -
(
935
60
2) 2
62
88
3 1
1 0
28 5
68
No
tes
to t
he
co
nso
lida
ted
fin
an
cia
l sta
tem
ents
.

Interim Financial Statements for the period ended 31 December 2017 Page 17
8. I
nta
ng
ible
ass
ets.
EU
R31
Dec
embe
r 20
17O
peni
ng
bala
nce
Ad
dit
ions
Fore
ign
exch
ang
e m
ovem
ents
Am
orti
sati
onC
losi
ng
bala
nce
Tra
dem
ark
s 1
60
1 8
65
- -
(6
0 4
48
) 1
54
1 4
17
Com
put
er s
oftw
are
,
inte
rna
lly g
ener
ate
d 2
150
273
5
53 4
96
(56
359
) (
296
396
) 2
351
014
Com
put
er s
oftw
are
, oth
er 1
98 0
77
10
2 4
04
(
14 7
34)
(76
670
) 2
09
077
Cus
tom
er r
ela
tion
ship
s 2
224
774
-
5 6
27
(12
4 4
57)
2 1
05
944
Cor
e d
epos
its
53
273
--
(6 1
27)
47
146
6 2
28 2
62
655
90
0
(65
46
6)
(56
4 0
98)
6 2
54 5
98
30 J
une
2017
Ope
ning
ba
lanc
eA
dd
itio
ns
Ad
dit
ions
th
roug
h b
usin
ess
com
bin
ati
onD
ispo
sals
Fore
ign
exch
ang
e m
ovem
ents
Oth
er c
hang
es
(rec
lass
ifica
tion
)A
mor
tisa
tion
Impa
irm
ent
Clo
sing
b
ala
nce
Tra
dem
ark
s -
1
692
537
-
-
-
-
(
90
672
) -
1
60
1 8
65
Com
put
er s
oftw
are
,
inte
rna
lly g
ener
ate
d 1
54
6 8
11
99
1 51
5 2
47
68
5 (
32 4
55)
23
632
(
32 0
10)
(59
4 9
05)
-
2 1
50 2
73
Com
put
er s
oftw
are
, oth
er 1
17 0
12
9 4
57
167
29
3 (
17 9
85)
1 7
76
32
010
(
70 5
92)
(40
894
) 1
98 0
77
Cus
tom
er r
ela
tion
ship
s 7
37 0
81
-
1 7
01
790
-
68
319
-
(
282
416
) -
2
224
774
Cor
e d
epos
its
-
-
85
237
- -
-
(
31 9
64
) -
5
3 27
3
2 4
00
90
4
2 6
93
509
2
20
2 0
05
(50
44
0)
93
727
-
(1
070
549
) (4
0 8
94)
6 2
28 2
62
No
tes
to t
he
co
nso
lida
ted
fin
an
cia
l sta
tem
ents
.

Page 18 MyBucks S.A.
EUR 31 December 2017 30 June 2017
Amounts due from Related party Non-Current Current Non-Current Current
Ecsponent Group 4 490 003 4 504 277 4 372 429 3 967 518
MHMK - 3 193 619 - 3 229 943
Stella Walsh 460 168 - 456 305 -
Serengeti Capital 84 404 - 91 349 -
Botswana Teachers Union - 200 832 250 088 -
Mike Hodgekiss - 15 697 - 16 318
Brainworks Capital Management Group 67 418 2 670 592 67 410 2 990 822
Instaloan Securitation (SA) 2 264 124 - - -
Fintech Campus - 562 398 - -
Team Geek (Pty) Ltd - 267 162 - -
Available-for-sale assets - 1 437 876 - -
7 366 117 12 852 453 5 237 581 10 204 601
EUR 31 December 2017 30 June 2017
Amounts due to Related party Non-Current Current Non-Current Current
Ecsponent Group 16 531 045 13 776 438 17 440 899 4 997 314
Opporutnity Internanial Inc Group - - 41 222 685 952
Bridge Port 089 - - 500 478 -
Carcharias Holdings - - 51 988 -
Wheatfields Proprietary Limited - 111 378 - 282 461
Vanguard Holdings lImited - 6 922 - 6 382
RBC CEES Trustee Limited 8 363 281 - 8 788 994 4 376 521
24 894 326 13 894 738 26 823 581 10 348 630
9. Other related party loans.
Notes to the consolidated financial statements.

Interim Financial Statements for the period ended 31 December 2017 Page 19
EUR 31 December 2017 30 June 2017
Gross loan advances 91 334 786 85 837 293
Provision for impairment (17 694 921) (17 310 365)
73 639 865 68 526 928
Current portion 49 056 188 45 742 325
Non-Current portion 24 583 677 22 784 603
73 639 865 68 526 928
Reconciliation of provision for impairment of loan book
Opening balance 17 310 365 11 508 450
Amounts written off as uncollectable (3 951 384) (6 826 209)
Additional impairment recognised 4 417 356 8 857 289
Foreign currency translation impact (81 416) (118 787)
Acquired through business combinations - 3 889 622
17 694 921 17 310 365
10. Loan book.
Notes to the consolidated financial statements.

Page 20 MyBucks S.A.
EUR 31 December 2017 30 June 2017
Prepayments 4 492 356 5 162 913
Deposits 176 770 201 621
Insurance receivable 606 300 386 490
Government payroll receivable 3 701 802 4 042 552
Vendor finance receivable 1 215 1 205
Indirect taxes 2 321 839 2 047 439
Other receivables 11 177 359 2 812 692
22 477 641 14 654 912
In previous periods the fixed cash deposits were included in other receivables, these are now presented seperately.
Subsequent to December 2017, the group has canceled the transaction entered into during October 2016 with
Opportunity International Inc. Through this transaction the group aquired access to the Opportunity Trademark for
14 years, access to the Opportunity network for 14 years as well as a prepayment was made for a fund raising
commitment from Opportunity International.
Carrying value 31 December 2017 30 June 2017 At acquisition
Trademark acquired 1 541 418 1 601 865 1 692 537
Prepayment on network fees 175 530 186 885 197 463
Prepayment on fund raising fees 2 835 000 2 835 000 2 835 000
4 551 948 4 623 750 4 725 000
The cancellation will result in the amortisation charges incurred associated with the trademark and the network fee
to be reversed. As well as the shares issued as payment for the transactions.
12. Cash and cash equivalents.
EUR 31 December 2017 30 June 2017
Bank balances 13 157 246 13 912 638
Cash in transit - 1 137 898
Bank overdraft (985 397) (4 366 968)
12 171 849 10 683 568
Current asset 13 157 246 15 050 536
Current liability (985 397) (4 366 968)
12 171 849 10 683 568
11. Other receivables.
Notes to the consolidated financial statements.

Interim Financial Statements for the period ended 31 December 2017 Page 21
EUR 31 December 2017 30 June 2017
Share capital
Authorised
15 998 000 ordinary par value shares 15 998 000 15 998 000
Reconciliation of number of shares issued:
Opening balance 11 665 612 10 998 000
Issue of shares - ordinary shares - 667 612
11 665 612 11 665 612
Issued
11 665 612 par value shares of €1 11 665 612 11 665 612
On 9 February 2018 the group issued 1.3 million shares at a premium of €8 per share with a private placement.
This increase in the share capital resulted in an increase in the share premium of €10.4 million.
13. Share capital.
31 December 2017 30 June 2017
EUR Non-Current Current Non-Current Current
Financial Institutions 7 603 051 13 271 156 5 353 628 16 059 988
Open Markets 13 745 222 9 979 657 10 477 099 4 542 867
Individuals 30 836 1 619 384 28 298 2 449 794
Other 2 524 533 26 070 198 3 579 827 20 905 104
23 903 642 50 940 395 19 438 852 43 957 753
All liabilities are fair value level 3, except the open market liabilities which are level 2. Refer to the consolidated
combined financial statement of 30 June 2017 for detail on the measurement criteria.
14. Other liabilities.
Notes to the consolidated financial statements.

Page 22 MyBucks S.A.
EUR 31 December 2017 30 June 2017
Opening balance 2 234 234 -
Acquired through Business combination - 3 064 978
Grants received - 1 257 840
Other movement - (252 791)
Grants realised in the profit and loss (876 996) (1 725 766)
Foreign exchange impact 218 508 (110 027)
Carrying value at the end of the period 1 575 746 2 234 234
Current portion 1 449 123 2 054 696
Non-Current portion 126 623 179 538
1 575 746 2 234 234
15. Deferred grant.
EUR 31 December 2017 30 June 2017
Large corporate customers
Term deposit 3 285 118 1 367 314
Current account 841 897 423 167
4 127 015 1 790 481
Small medium customers
Term deposit 133 845 1 096 912
Current account 1 134 985 183 959
1 268 830 1 280 871
Retail customers
Term deposit 2 199 834 1 287 669
Current accounts 7 173 939 6 888 281
Interest payable 204 077 246 261
9 577 850 8 422 211
14 973 695 11 493 563
Current portion 14 799 105 11 310 110
Non-current portion 174 590 183 453
14 973 695 11 493 563
16. Deposits from customers.
Notes to the consolidated financial statements.

Interim Financial Statements for the period ended 31 December 2017 Page 23
EUR31 December
2017
30 June
2017
31 December
2016 (restated)
Profit / (Loss) before taxation (648 883) (9 244 724) (3 451 490)
Adjustments for:
Depreciation and amortisation 1 046 795 2 006 151 1 214 169
Non cash portion of expenses 698 435 (396 148) (589 632)
Loss on disposal 552 111 303 50 540
Investment revenue (2 189 349) (2 683 535) (858 902)
Finance costs 11 598 035 20 236 487 7 745 676
Goodwill and other impairments 9 486 513 961 513 958
Loan impairments 6 820 248 13 151 759 4 462 794
Employee share option plan 125 545 645 925 21 150
Gain on bargain purchase - (2 850 600) (2 850 600)
Gain on loan book sold (2 255 473) - -
Grant amortisation (876 996) (1 725 766) (861 613)
Loss/(gain) on foreign exchange 392 621 1 075 218 (448 975)
14 721 016 20 840 031 4 947 075
Changes in working capital
Loan book (12 102 439) (20 911 114) (8 500 366)
Other receivables (11 294 640) (11 306 533) (4 357 156)
Deposits from customers 3 480 131 2 678 785 689 118
Trade and other payables 7 797 035 (762 743) (258 968)
2 601 103 (9 461 574) (7 480 297)
17. Cash used in operations.
Notes to the consolidated financial statements.
Page 24 MyBucks S.A.
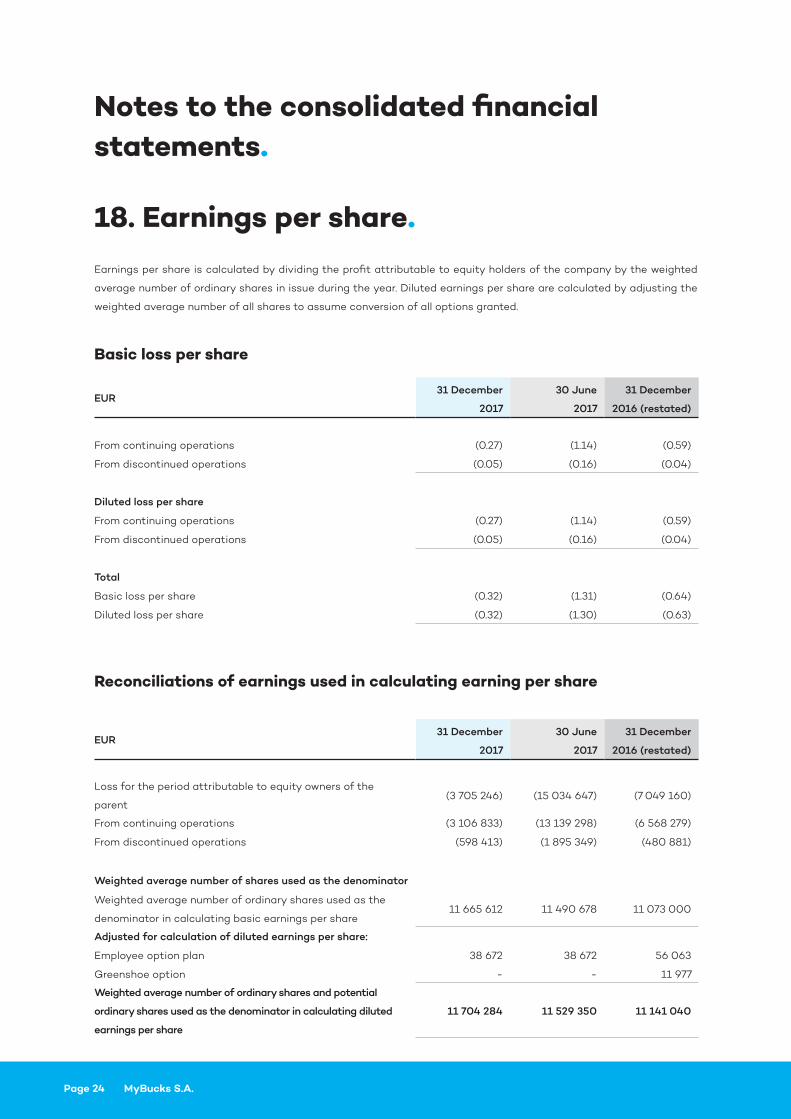
18. Earnings per share.Earnings per share is calculated by dividing the profit attributable to equity holders of the company by the weighted
average number of ordinary shares in issue during the year. Diluted earnings per share are calculated by adjusting the
weighted average number of all shares to assume conversion of all options granted.
EUR31 December
2017
30 June
2017
31 December
2016 (restated)
From continuing operations (0.27) (1.14) (0.59)
From discontinued operations (0.05) (0.16) (0.04)
Diluted loss per share
From continuing operations (0.27) (1.14) (0.59)
From discontinued operations (0.05) (0.16) (0.04)
Total
Basic loss per share (0.32) (1.31) (0.64)
Diluted loss per share (0.32) (1.30) (0.63)
Basic loss per share
EUR31 December
2017
30 June
2017
31 December
2016 (restated)
Loss for the period attributable to equity owners of the
parent (3 705 246) (15 034 647) (7 049 160)
From continuing operations (3 106 833) (13 139 298) (6 568 279)
From discontinued operations (598 413) (1 895 349) (480 881)
Weighted average number of shares used as the denominator
Weighted average number of ordinary shares used as the
denominator in calculating basic earnings per share 11 665 612 11 490 678 11 073 000
Adjusted for calculation of diluted earnings per share:
Employee option plan 38 672 38 672 56 063
Greenshoe option - - 11 977
Weighted average number of ordinary shares and potential
ordinary shares used as the denominator in calculating diluted
earnings per share
11 704 284 11 529 350 11 141 040
Reconciliations of earnings used in calculating earning per share
Notes to the consolidated financial statements.

Interim Financial Statements for the period ended 31 December 2017 Page 25
EU
R31
Dec
embe
r 20
17 B
ank
ing
N
on-B
ank
ing
Ea
ster
n A
fric
a
Non
-Ba
nkin
g
Sou
ther
n A
fric
a
Non
-Ba
nkin
g
Oth
er
Tec
h E
limin
ati
ons
Con
tinu
ed
oper
ati
ons
Dis
cont
inue
d
Ope
rati
ons
Gro
up T
ota
l
Rev
enue
15
168
538
2
224
319
1
0 5
54 1
68
2
071
96
6
(15
655
) -
3
0 0
03
336
2
71 6
52
30
274
98
8
Imp
air
men
t ch
arg
e (
1 0
27 9
23)
(92
6 0
68
) (
3 6
08
06
5) (6
48
194
) -
-
(6
210
24
9) (6
09
99
9) (6
820
24
8)
Oth
er in
com
e 2
222
90
2 1
7 28
0
1 0
29 2
01
232
031
-
-
3
50
1 4
14
31
591
3 5
33 0
04
Em
plo
yee
cost
s (
3 32
3 9
11)
(429
930
) (
554
473
) (
855
06
2) (
2 31
7 56
9) -
(
7 4
80
94
4)
(15
2 9
93)
(7
633
937
)
Pro
fess
iona
l fee
s (4
84
216
) (
187
46
3) (4
81
68
2) (
146
60
9) (6
71 7
76)
-
(1
971
74
6)
(1
60
6)
(1
973
351
)
Dep
reci
ati
on a
nd
am
orit
sati
on (
315
749)
(8
0 4
56)
(13
5 4
64
) (
53 4
37)
(39
0 2
59)
(61
940
) (
1 0
37 3
05)
(1
010
) (
1 0
38 3
15)
Oth
er o
per
ati
ng
exp
ense
s (4
039
70
9) (
396
34
8)
(1
189
270
) (6
13 2
47)
(49
5 6
62)
(22
0 7
31)
(6 9
54 9
66
) (
243
134
) (
7 19
8 1
01)
Op
era
ting
pro
fit
8 1
99
932
2
21 3
34
5 6
14 4
15
(12
552
) (
3 89
0 9
20)
(28
2 67
1) 9
849
539
(
705
500
) 9
14
4 0
39
Inve
stm
ent
reve
nue
596
371
2
9 5
37
88
0 8
36
-
68
2 6
05
-
2 1
89 3
49
-
2
189
34
9
Fina
nce
cost
s (
1 32
6 1
64
) (
793
869
) (4
419
70
3) (
234
86
2) (
5 32
8 5
52)
130
86
6
(11
972
28
5) (
9 9
87)
(11
98
2 27
1)
Pro
fit
bef
ore
taxa
tion
7 4
70 1
39
(54
2 9
98)
2 0
75 5
48
(
247
414
) (
8 5
36 8
67)
(15
1 8
05)
66
60
4
(71
5 4
87)
(64
8 8
83)
Taxa
tion
(1
756
18
8)
(1
115)
(37
2 70
5) (
1 28
6)
(78
24
8)
-
(2
209
54
2) 1
17 0
74
(2
092
46
8)
(Pro
fit)
/Los
s af
ter t
axat
ion
5 7
13 9
51
(54
4 1
13)
1 7
02
84
3 (
248
70
0)
(8
615
115
) (
151
80
5) (
2 14
2 9
38)
(59
8 4
13)
(2
741
351)
Loan
Boo
k 4
0 4
30 0
12
3 5
53 4
83
24
325
94
9
5 3
64
933
-
(
34 5
13)
73
639
86
4
(0)
73
639
86
4
Tota
l Ass
ets
71
80
6 5
36
8 2
61 4
85
62
06
6 1
18
6 1
97
48
5 8
9 2
56 6
51
(62
735
386
) 1
74 8
52 8
90
1
9 5
48
1
74 8
72 4
38
Tota
l Lia
bilit
ies
43
64
0 2
49
8
232
689
5
3 31
0 9
70
4 4
73 5
85
81
48
6 9
57
(36
99
1 50
5) 1
54 1
52 9
45
4 0
06
16
0
158
159
10
4
19. S
egm
enta
l rep
ort
ing
.Th
e g
roup
ha
s id
enti
fied
its
rep
orta
ble
seg
men
ts b
ase
d o
n th
e si
gni
fica
nce
of t
he b
usin
ess
op
era
tion
s. T
hese
seg
men
ts a
lso
refl
ect
how
the
Gro
up's
bus
ines
ses
are
ma
nag
ed a
re r
epor
ted
to t
he C
hief
Op
era
ting
Dec
isio
n M
ake
r. Th
e C
OD
M p
rim
ari
ly u
ses
the
net
pro
fit
aft
er t
ax
to a
sses
s th
e p
erfo
rma
nce
of t
he o
per
ati
ng s
egm
ents
. The
seg
men
ts c
onsi
st o
f th
e fo
llow
ing
3 m
ain
cate
gor
ies:
Ba
nkin
g is
ma
nag
ed b
y a
Gro
up B
ank
ing
ma
nag
er, w
here
as
the
Non
-Ba
nkin
g e
ntit
ies
are
ma
nag
ed b
y re
gio
nal m
ana
ger
s fo
r E
ast
ern
Afr
ica
, So
uthe
rn A
fric
a a
nd o
ther
.
The
non-
ba
nkin
g s
egm
ent,
is m
ana
gem
ent
by r
egio
nal m
ana
ger
s a
ltho
ugh
it is
rev
iew
ed a
s a
sin
gle
seg
men
t, t
he r
egio
n m
ana
ger
s re
por
t to
the
Ste
erin
g C
omm
itte
e.
No
tes
to t
he
co
nso
lida
ted
fin
an
cia
l sta
tem
ents
.

Page 26 MyBucks S.A.
EU
R30
Jun
e 20
17 B
ank
ing
N
on-B
ank
ing
Ea
ster
n A
fric
a
Non
-Ba
nkin
g
Sou
ther
n A
fric
a
Non
-Ba
nkin
g
Oth
er
Tec
h E
limin
ati
ons
Con
tinu
ed
oper
ati
ons
Dis
cont
inue
d
Ope
rati
ons
Gro
up T
ota
l
Rev
enue
27
748
422
5
327
018
1
8 5
21 7
55
2 0
96 8
48
(
71 0
34)
50
225
5
3 67
3 23
4
374
90
9
54
04
8 1
43
Imp
air
men
t ch
arg
e (
1 59
4 8
06
) (
5 36
6 4
57)
(4 4
70 2
25)
(427
54
5) -
2
12 2
74
(11
64
6 7
61)
(1
504
998
) (
13 1
51 7
59)
Oth
er in
com
e 1
856
425
3
89 6
30
6 1
09
557
1
55 2
71
9 5
95
941
(12
125
58
8)
5 9
81
236
1
2 5
98
1 24
8
Em
plo
yee
cost
s (
5 0
64
069
) (
1 29
2 11
0)
(6 3
96 7
03)
(1
016
867
) (
316
69
0)
430
48
7 (
13 6
55 9
52)
(423
970
) (
14 0
79 9
23)
Pro
fess
iona
l fee
s (
703
174
) (
345
976
) (
918
779
) (
217
241)
(2
389
161
) 6
3 8
64
(4
510
46
8)
(8
2 79
3) (4
59
3 26
1)
Dep
reci
ati
on a
nd
am
orit
sati
on (6
11 6
61)
(20
0 8
75)
(48
2 75
0)
(57
26
0)
(48
6 3
10)
(16
7 94
7) (
2 0
06
80
3) (
3 17
2) (
2 0
09
975
)
Oth
er o
per
ati
ng
exp
ense
s (
11 3
49
578
) (
1 8
53 3
36)
(7
899
954
) (
528
435
) (
10 4
28 6
63)
15
64
1 23
7 (
16 4
18 7
29)
(39
2 34
8)
(16
811
077
)
Op
era
ting
pro
fit
10
28
1 55
7 (
3 34
2 10
7) 4
46
2 9
01
4 7
72
(4 0
95 9
17)
4 1
04
551
1
1 4
15 7
58
(2
032
361
) 9
38
3 39
7
Inve
stm
ent
reve
nue
1 0
18 2
52
452
016
7
49
44
9
650
672
6
621
975
(6
80
8 8
30)
2 6
83
535
51
2 6
83
586
Fina
nce
cost
s (6
74
5 61
9) (
2 76
1 26
9) (
5 32
1 4
04
) (6
48
373
) (
11 6
36 6
12)
5 9
00
69
7 (
21 2
12 5
79)
(9
9 1
24)
(21
311
70
4)
Pro
fit
bef
ore
taxa
tion
4 5
54 1
91
(5
651
36
0)
(10
9 0
54)
7 0
72
(9
110
553
) 3
196
418
(
7 11
3 28
6)
(2
131
434
) (
9 2
44
721
)
Taxa
tion
(1
657
30
4)
(456
54
1) (4
49
869
) (
27 4
39)
(77
8 7
63)
(20
5 10
0)
(3
575
016
) (
194
412
) (
3 76
9 4
28)
(Pro
fit)
/Los
s af
ter t
axat
ion
2 8
96 8
87
(6 1
07
90
1) (
558
923
) (
20 3
67)
(9
889
316
) 2
99
1 31
8
(10
68
8 3
02)
(2
325
84
6)
(13
014
149
)
Loa
n B
ook
38
78
1 52
8
5 1
98 4
34
20
454
079
3
90
3 35
5 -
(
34 5
13)
68
30
2 8
84
2
24 0
44
6
8 5
26 9
27
Tota
l Ass
ets
68
79
3 52
8
14
530
84
4
54
153
851
6
524
58
4
88
476
431
(
76 3
41
174
) 1
56 1
38 0
66
5
56 6
52
156
694
718
Tota
l Lia
bili
ties
45
64
9 1
74
17
144
10
4
48
352
74
6
4 7
14 5
18
70
189
631
(
53 5
05
44
4)
132
54
4 7
29
3 9
16 3
62
136
461
09
1
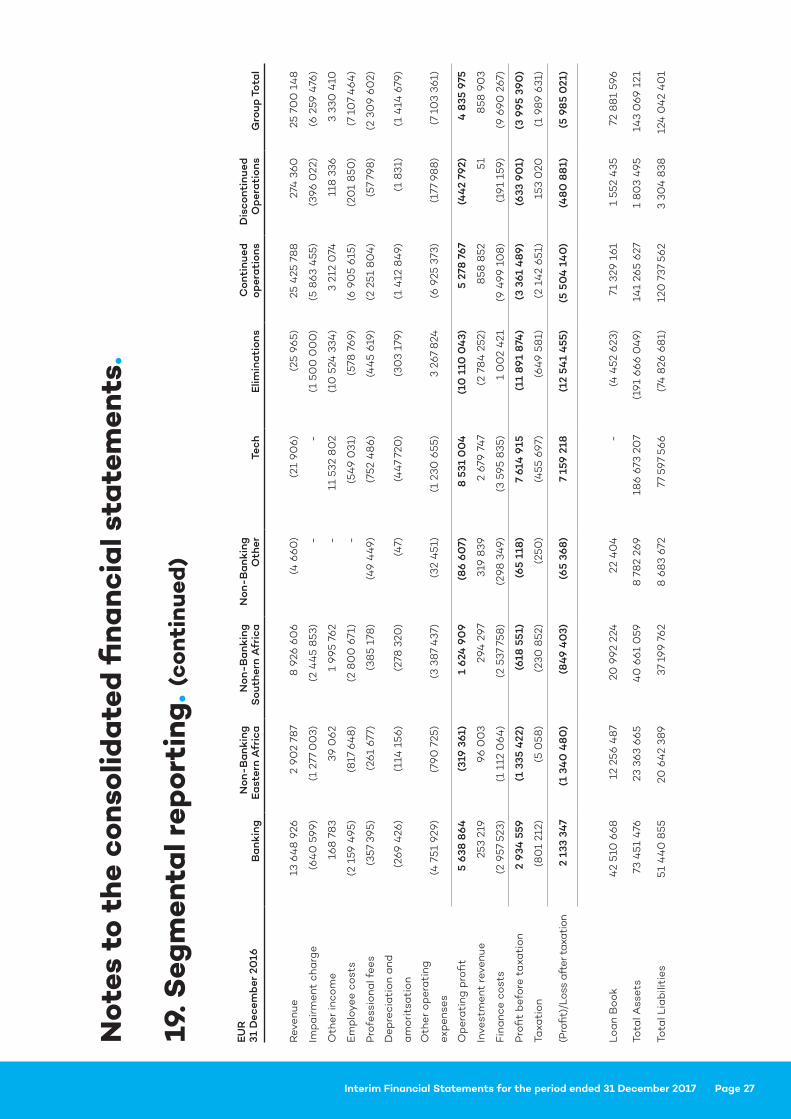
19. S
egm
enta
l rep
ort
ing
. (c
on
tin
ued
)
No
tes
to t
he
co
nso
lida
ted
fin
an
cia
l sta
tem
ents
.
Interim Financial Statements for the period ended 31 December 2017 Page 27
EU
R31
Dec
embe
r 20
16 B
ank
ing
N
on-B
ank
ing
Ea
ster
n A
fric
a
Non
-Ba
nkin
g
Sou
ther
n A
fric
a
Non
-Ba
nkin
g
Oth
er
Tec
h E
limin
ati
ons
Con
tinu
ed
oper
ati
ons
Dis
cont
inue
d
Ope
rati
ons
Gro
up T
ota
l
Rev
enue
13
64
8 9
26
2 9
02
787
8 9
26 6
06
(4
66
0)
(21
90
6)
(25
96
5) 2
5 4
25 7
88
2
74 3
60
2
5 70
0 1
48
Imp
air
men
t ch
arg
e (6
40
59
9) (
1 27
7 0
03)
(2
44
5 8
53)
-
-
(1
500
00
0)
(5
86
3 4
55)
(39
6 0
22)
(6 2
59 4
76)
Oth
er in
com
e 1
68
78
3 3
9 0
62
1 9
95
762
-
11
532
80
2 (
10 5
24 3
34)
3 2
12 0
74
118
336
3
330
410
Em
plo
yee
cost
s (
2 15
9 4
95)
(8
17 6
48
) (
2 8
00
671
) -
(
549
031
) (
578
769
) (6
90
5 61
5) (
201
850
) (
7 10
7 4
64
)
Pro
fess
iona
l fee
s (
357
395)
(26
1 67
7) (
385
178
) (4
9 4
49)
(75
2 4
86
) (4
45
619)
(2
251
80
4)
(57
798
) (
2 30
9 6
02)
Dep
reci
ati
on a
nd
am
orit
sati
on (
269
426
) (
114
156
) (
278
320
) (4
7) (4
47
720
) (
303
179)
(1
412
84
9) (
1 8
31)
(1
414
679
)
Oth
er o
per
ati
ng
exp
ense
s (4
751
929
) (
790
725
) (
3 38
7 4
37)
(32
451
) (
1 23
0 6
55)
3 2
67 8
24
(6 9
25 3
73)
(17
7 98
8)
(7
103
361)
Op
era
ting
pro
fit
5 6
38 8
64
(
319
361
) 1
624
90
9
(8
6 6
07)
8 5
31 0
04
(
10 1
10 0
43)
5 2
78 7
67
(44
2 79
2) 4
835
975
Inve
stm
ent
reve
nue
253
219
9
6 0
03
294
29
7 3
19 8
39
2 6
79 7
47
(2
784
252
) 8
58 8
52
51
858
90
3
Fina
nce
cost
s (
2 9
57 5
23)
(1
112
06
4)
(2
537
758
) (
298
34
9) (
3 59
5 8
35)
1 0
02
421
(
9 4
99
10
8)
(19
1 15
9) (
9 6
90
267
)
Pro
fit
bef
ore
taxa
tion
2 9
34 5
59
(1
335
422
) (6
18 5
51)
(65
118
) 7
614
915
(
11 8
91
874
) (
3 36
1 4
89)
(633
90
1) (
3 9
95 3
90
)
Taxa
tion
(8
01
212)
(5
058
) (
230
852
) (
250
) (4
55 6
97)
(64
9 5
81)
(2
142
651
) 1
53 0
20
(1
989
631
)
(Pro
fit)
/Los
s af
ter t
axat
ion
2 1
33 3
47
(1
340
48
0)
(8
49 4
03)
(65
368
) 7
159
218
(
12 5
41
455
) (
5 50
4 1
40
) (4
80
88
1) (
5 98
5 0
21)
Loa
n B
ook
42
510
66
8
12
256
48
7 2
0 9
92 2
24
22
40
4
-
(4 4
52 6
23)
71
329
161
1
552
435
7
2 8
81
596
Tota
l Ass
ets
73
451
476
2
3 36
3 6
65
40
661
059
8
78
2 26
9
18
6 6
73 2
07
(19
1 6
66
04
9) 1
41
265
627
1
80
3 4
95
14
3 0
69 1
21
Tota
l Lia
bili
ties
51
44
0 8
55
20
64
2 38
9
37
199
76
2 8
68
3 67
2 7
7 59
7 56
6
(74
826
68
1) 1
20 7
37 5
62
3 3
04
838
1
24 0
42
40
1
19. S
egm
enta
l rep
ort
ing
. (c
on
tin
ued
)
No
tes
to t
he
co
nso
lida
ted
fin
an
cia
l sta
tem
ents
.
Page 28 MyBucks S.A.
20. Risk management policies.
The risk management policies are designed to identify
and analyses risks the group are challenged with. These
risks are addressed through setting appropriate limits
and controls, and to monitor the risk through reliable and
up-to-date information systems. Risk management is
carried out by management, under policies approved by
the board. The Board approves principles for overall risk
management as well as policies covering specific areas,
such as foreign exchange risk, interest rate risk, credit
risk, use of derivative financial instruments and non-
derivative financial instruments. The most important
types of risk are credit risk, liquidity risk and market risk.
Market risk includes currency risk and interest rate risk.
The executive management of the group’s subsidiaries
are responsible to identify, monitor and mitigate risk at
all business levels under the policies approved by the
Group’s Board.
The full risk exposure of the group is monitored on a
monthly basis, however for the 31 December 2017 only
the Credit risk is being disclosed, with specific reference
to customer provisions, as this is the most significant
risk the group is challenged with. For all other risk related
disclosures refer to the 30 June 2017 consolidated
combined financial statements.
Credit risk
Credit risk is the risk of financial loss to the Group if
a customer or counterparty to a financial instrument
fails to meet its contractual obligations and arises
principally from the Group’s loans and advances to
customers. For risk management reporting purposes,
the Group considers and consolidates all elements of
credit risk exposure (such as individual obligor default
risk, employer default risk and country risk).
The provision of unsecured loans to formally employed
individuals is the main activity of the Group’s business.
As such, exposure to credit risk and the management of
this risk is a key consideration.
Customer credit risk is mitigated by the utilisation of
payroll collection models. Employment of customers by
vetted employers effectively serve as security for loans
provided to such customers, since the employer recovers
the loan installment directly from the customer’s salary.
All cash and cash equivalent assets are placed with
reputable banks. If the banks credit rating recedes
the risk will be assessed and action taken. The group
analyses the return versus risk in these instances as
some banks may offer a higher return with a significant
risk component. The group utilises hard currency
deposits as security to borrow local currency funding to
limit foreign exchange losses.
In extending loans to related parties, shareholders
and third parties the Group completes a full credit
assessment. The Group reviews the financial statements,
operations, legal and tax status of the borrower. The
group also limits the tenure and size of the debt in which
it never poses a material risk to the Group. All loans are
interest- bearing and recorded at fair value at initial
recognition. The Group bases its credit risk policies on
the customers it serves, their employers and method of
collection.
Impairment assessment
Customers of the Group are segmented into five rating
classes. The Group’s rating scale, which is shown below,
reflects the range of default probabilities defined
for each rating class. This means that, in principle,
exposures migrate between classes as the assessment
of their probability of default changes. The rating tools
are kept under review and upgraded as necessary.
Notes to the consolidated financial statements.

Interim Financial Statements for the period ended 31 December 2017 Page 29
Categories used to identify specific impairments for
the group:
• Category of default 0: Loans that are not past
due and are within the contract term.
• Category of default 1: Loans that have missed one
contractual payment.
• Category of default 2: Loans that have missed two
contractual payments.
• Category of default 3: Loans that have missed
three contractual payments.
• Category of default 4: Loans that have missed
more than three contractual payments. This is also
defined as the Default state.
The impairments at year-end are derived from each of
the five internal rating grades. Loans and advances are
considered impaired if, and only if, there is objective
evidence of impairment resulting from events that
occurred after initial asset recognition (known as loss
events) and these loss events have an adverse impact
on the assets estimated future cash flows that can
be measured reliably. The internal rating tool assists
management to determine whether objective evidence
of impairment exists based on the following criteria set
out by the Group:
• Downgrading below “Performing” level
• Historical loss experience of groups of financial
assets with similar repayment terms
• Data indicating that there is a measurable
decrease in the estimated future cash flows
from a group of financial assets since the initial
recognition of those assets, although the decrease
cannot yet be identified with the individual
financial assets in the group including
• Adverse changes in the payment status of
borrowers in the group; or
• National or local economic conditions that
correlate with defaults on the assets in the group
• In determining whether a loss event has occurred,
loans and advances are subjected to regular
evaluations of the following:
• Overall client risk profile and payments record
• Downgrading below “Performing” level.
• Delinquency in contractual payments of principal
or interest;
• Cash flow difficulties experienced by the borrower;
• Initiation of bankruptcy proceedings;
The group assesses the probability of default by
referring to historical collection data. The historical
collection data is reviewed quarterly to reduce the
difference between the impairment allowance estimate
and actual loss experience
The historical loss experience is adjusted based on
observable data to reflect the effects of current
conditions that did not affect the period on which the
historical loss experience is based and to remove the
effects of conditions in the historical period that do not
currently exist.
On a collective basis, the Group assesses whether
objective evidence of impairment exists for groups of
financial assets with similar repayment terms. If there
is objective evidence that an impairment loss on loans
and advances has been incurred, the amount of the
loss is measured as the difference between the assets’
carrying amounts and the present value of estimated
future cash flows discounted at the respective
financial assets’ original effective interest rates (the
recoverable amount).
• Loans and advances within the Group comprises
many small, homogeneous assets. Statistical
techniques are used to calculate impairment
allowances collectively, based on historical default
and recovery rates. These statistical analyses use
20. Risk management policies. (continued)
Notes to the consolidated financial statements.

Page 30 MyBucks S.A.
as primary inputs the extent to which accounts
in the portfolio are in arrears and historical loss
experience on the eventual losses encountered
from similar delinquent portfolios.
• Models contain both judgmental and non-
judgmental inputs. The extent of judgment utilised
in models developed for new loan products is
greater than that for older products, given the
limited historical experience available for the new
products.
• In outline, the statistical analyses are performed
on a portfolio basis as follows:
• The Probability of Default (PD) for each CD
category is determined by means of historic
statistical analysis of the observed payment
behavior. This is achieved by constructing
transition matrices that track how loans have
migrated between CD states. These movements
produce a pattern over time that is used to predict
a Probability of Default (reaching CD4).
• The Loss Given Default (LGD) represents the
portion of a loan’s balance, at the point of default,
that is expected to be unrecoverable/written off.
• These derived statistics, based on actual
experience, are used in determining the
impairment value of each loan by multiplying the
outstanding balance (EAD) at reporting date with
PD and LGD.
• Clients in arrears by more than 90 days
are handed over to external debt collectors.
Recoveries from short-term loans are regarded
as negligible as collateral is not required for the
granting of advances in the current product
range. The estimated recoveries on longer-term
loans discounted at the contractual rates are
recognised in gross loans and advances.
In addition to the impairment estimated for assets
with recognised objective evidence of impairment,
an estimate is made for impairments associated with
those assets in the balance sheet that are impaired, but
for which objective evidence is not yet available.
The impairment calculation utilises the results of the
statistical analyses referred to above to estimate the
proportion of assets in each portfolio that are likely to
be unrecoverable and written off.
In considering the occurrence of a loss event over the
life of a loan, it is assumed that there is a constant risk
of the loss event occurring at any point in the life of
the loan.
The methodology and assumptions used for estimating
future cash flows are reviewed annually to reduce
differences between loss estimates and actual loss
experience. All impaired loans and advances are
reviewed monthly and any changes to the amount and
timing of the expected future cash flows compared to
previous estimates will result in a change to the charges
for impairment of loans and advances. Customers (and
the related impairment allowance accounts) are written
off once a loan has made no payment for more than
365 days.
20. Risk management policies. (continued)
Notes to the consolidated financial statements.
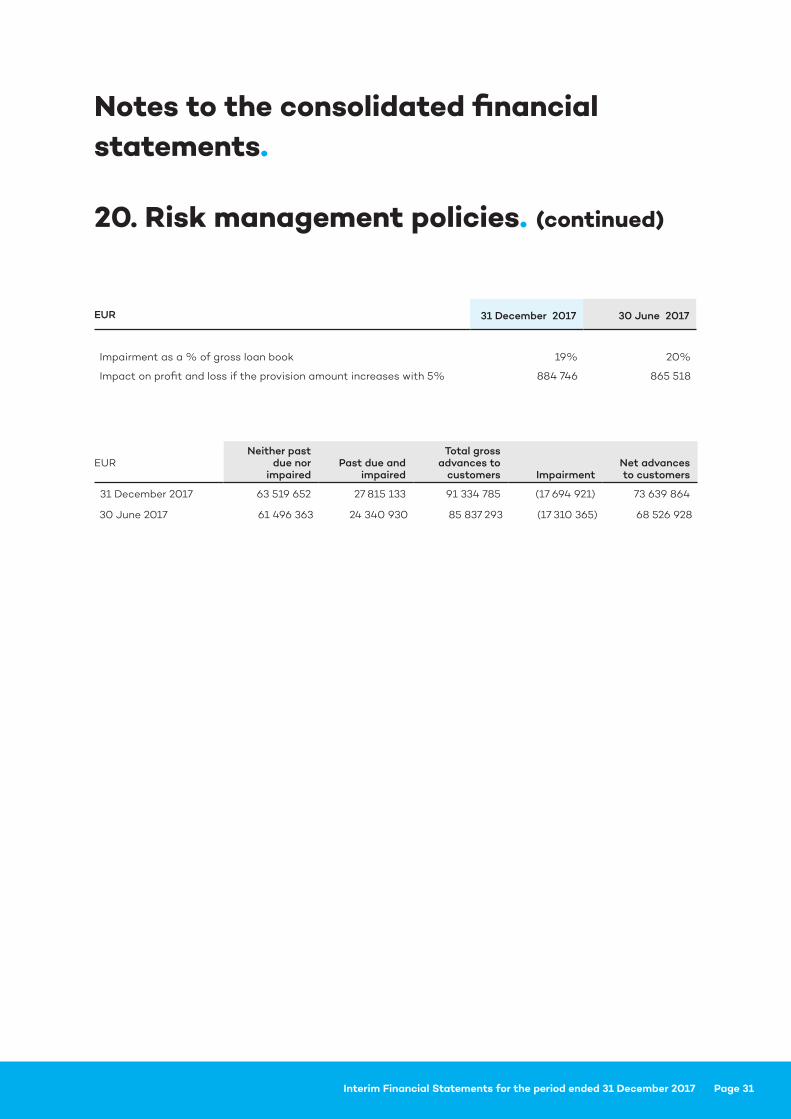
Interim Financial Statements for the period ended 31 December 2017 Page 31
EUR 31 December 2017 30 June 2017
Impairment as a % of gross loan book 19% 20%
Impact on profit and loss if the provision amount increases with 5% 884 746 865 518
EURNeither past
due nor impaired
Past due and impaired
Total gross advances to
customers ImpairmentNet advances to customers
31 December 2017 63 519 652 27 815 133 91 334 785 (17 694 921) 73 639 864
30 June 2017 61 496 363 24 340 930 85 837 293 (17 310 365) 68 526 928
Notes to the consolidated financial statements.
20. Risk management policies. (continued)
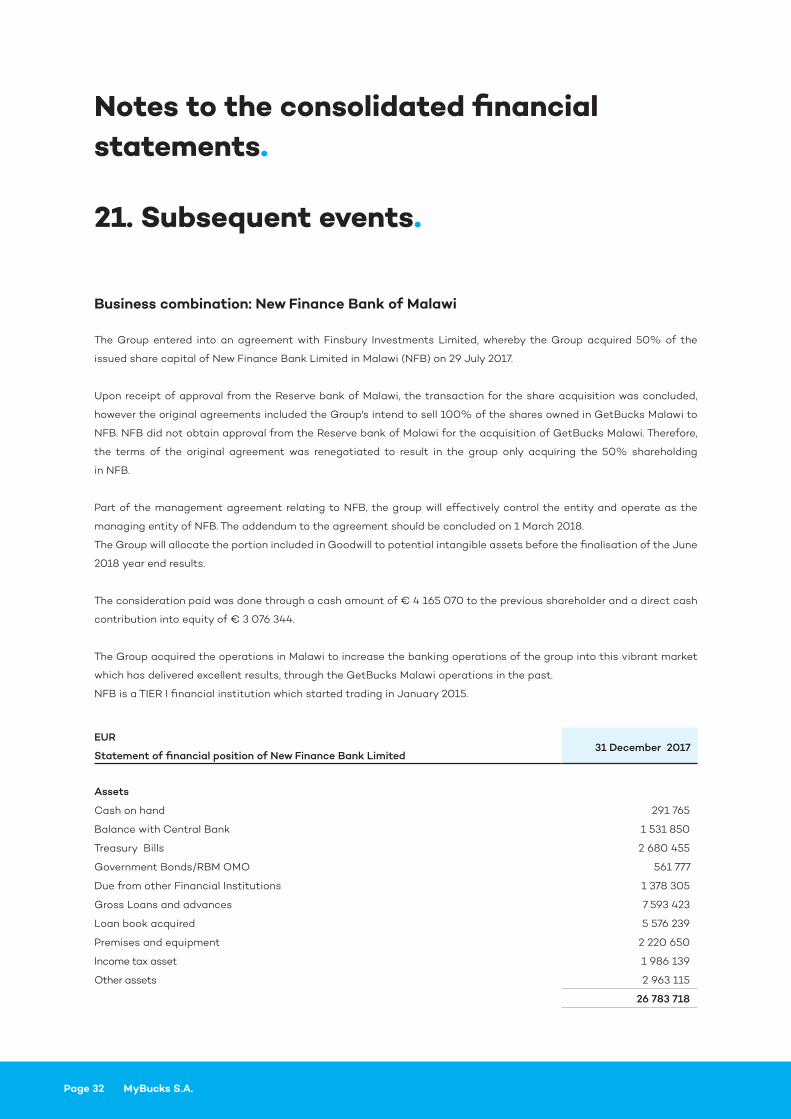
Page 32 MyBucks S.A.
EUR
Statement of financial position of New Finance Bank Limited31 December 2017
Assets
Cash on hand 291 765
Balance with Central Bank 1 531 850
Treasury Bills 2 680 455
Government Bonds/RBM OMO 561 777
Due from other Financial Institutions 1 378 305
Gross Loans and advances 7 593 423
Loan book acquired 5 576 239
Premises and equipment 2 220 650
Income tax asset 1 986 139
Other assets 2 963 115
26 783 718
21. Subsequent events.
Business combination: New Finance Bank of Malawi
The Group entered into an agreement with Finsbury Investments Limited, whereby the Group acquired 50% of the
issued share capital of New Finance Bank Limited in Malawi (NFB) on 29 July 2017.
Upon receipt of approval from the Reserve bank of Malawi, the transaction for the share acquisition was concluded,
however the original agreements included the Group's intend to sell 100% of the shares owned in GetBucks Malawi to
NFB. NFB did not obtain approval from the Reserve bank of Malawi for the acquisition of GetBucks Malawi. Therefore,
the terms of the original agreement was renegotiated to result in the group only acquiring the 50% shareholding
in NFB.
Part of the management agreement relating to NFB, the group will effectively control the entity and operate as the
managing entity of NFB. The addendum to the agreement should be concluded on 1 March 2018.
The Group will allocate the portion included in Goodwill to potential intangible assets before the finalisation of the June
2018 year end results.
The consideration paid was done through a cash amount of € 4 165 070 to the previous shareholder and a direct cash
contribution into equity of € 3 076 344.
The Group acquired the operations in Malawi to increase the banking operations of the group into this vibrant market
which has delivered excellent results, through the GetBucks Malawi operations in the past.
NFB is a TIER I financial institution which started trading in January 2015.
Notes to the consolidated financial statements.

Interim Financial Statements for the period ended 31 December 2017 Page 33
The information included in this report will be updated in the 30 June 2018 results. The Goodwill/Intangible assets will
be allocated by 30 June 2018.
EUR 31 December 2017
Liabilities
Customer deposits 20 152 319
Due to Central Bank - RBM OMO -
Due to other Banks & Institutions 746 434
Loan Loss Provision 249 668
Other liabilities 783 760
21 932 181
Net Assets 4 851 537
Proportion of the group's ownership 50%
Non-Controlling Interest Portion 2 425 769
Consideration paid in cash 7 241 414
Intangible asset/Goodwill based on December 2017 accounts 4 815 646
21. Subsequent events. (continued)
Notes to the consolidated financial statements.

Page 34 MyBucks S.A.


