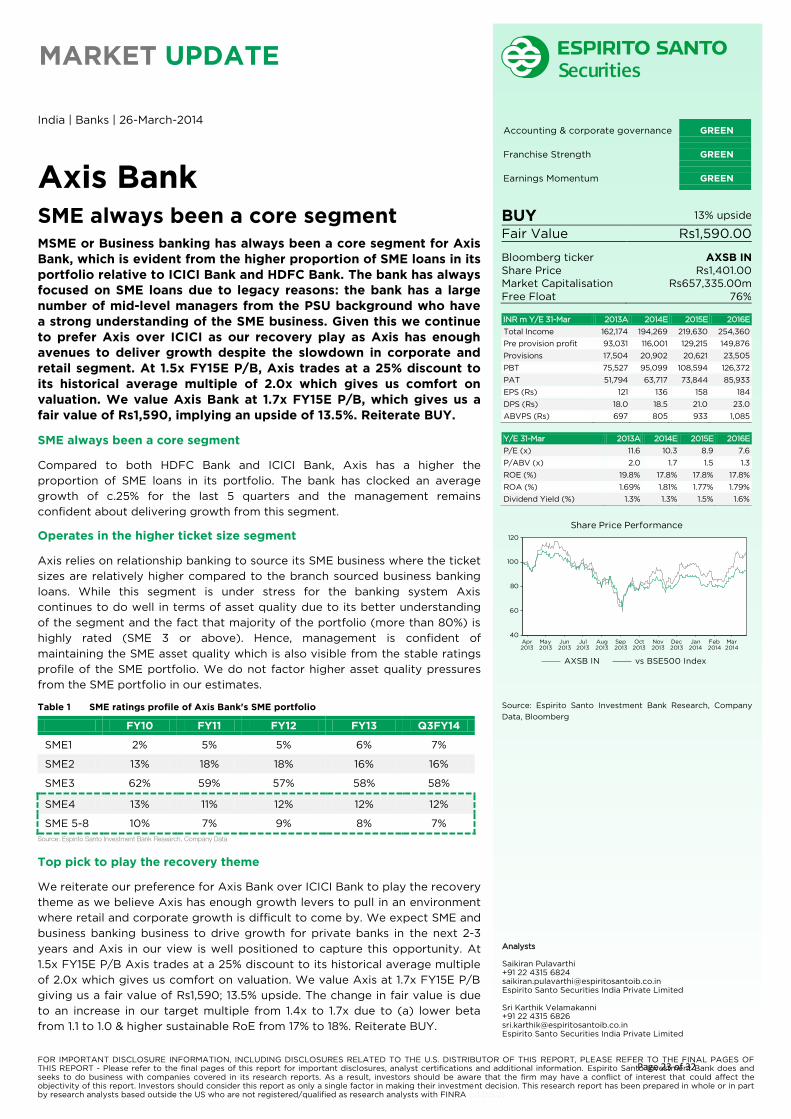
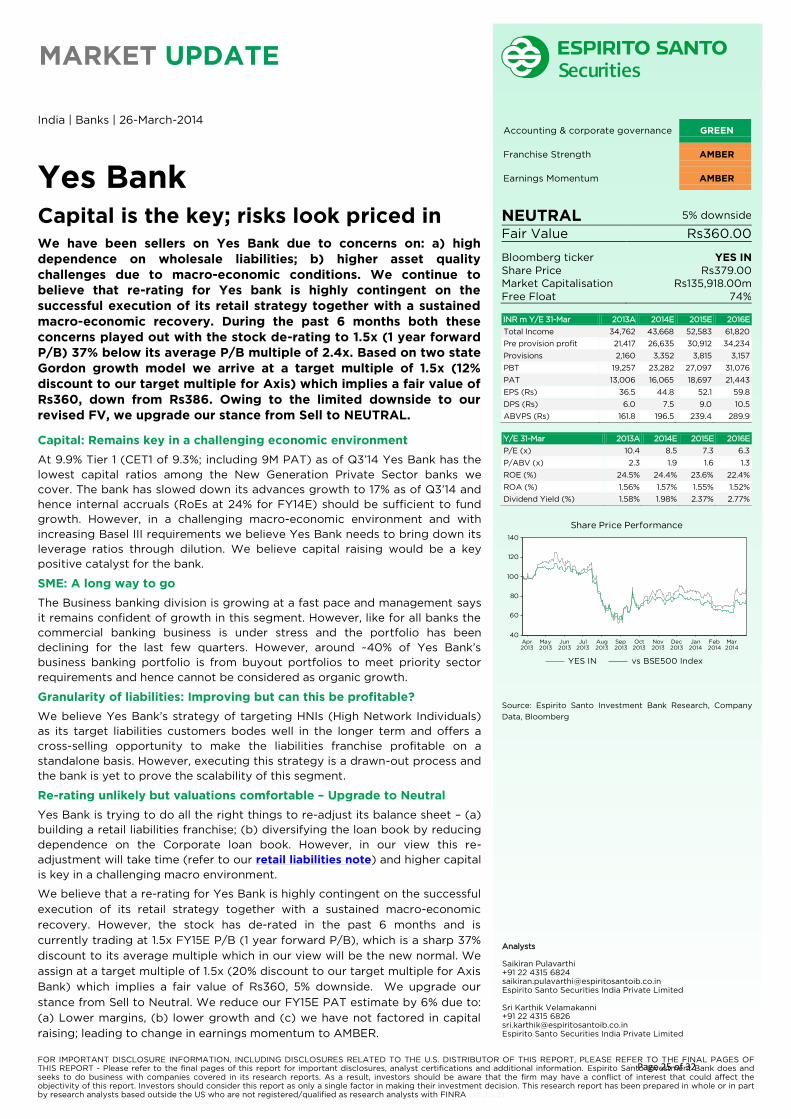
FOR IMPORTANT DISCLOSURE INFORMATION, INCLUDING DISCLOSURES RELATED TO THE U.S. DISTRIBUTOR OF THIS REPORT, PLEASE REFER TO THE FINAL PAGES OF THIS REPORT - Please refer to the final pages of this report for important disclosures, analyst certifications and additional information. Espirito Santo Investment Bank does and seeks to do business with companies covered in its research reports. As a result, investors should be aware that the firm may have a conflict of interest that could affect the objectivity of this report. Investors should consider this report as only a single factor in making their investment decision. This research report has been prepared in whole or in part by research analysts based outside the US who are not registered/qualified as research analysts with FINRA (v1.0.5.2) THEMATIC India | Banks | 26-March-2014 Private Sector Banks SME is the new "Retail" Private banks have rallied over the past one month anticipating a recovery. However, with strong competition eroding profitability in the retail segment and corporate recovery still some time away where will growth come from for private banks? We think the MSME (Micro, Small and Medium Enterprise) segment could plug this gap for private banks in the next leg of growth as they grab market share from PSU banks (76% of MSME market share vs 20% for pvt banks). The MSME segment offers high growth potential and is performing well on the asset quality front despite the macro headwinds. It is already one of the most profitable divisions for the likes of HDFC Bank and Axis while ICICI seems to be struggling to get its strategy in place. We reiterate our BUY recommendation on HDFC Bank and Axis Bank but downgrade ICICI to SELL as post the recent rally we are not comfortable with its valuation. We upgrade Yes Bank to Neutral (from SELL) with a revised fair value of Rs360 as we believe most of the risks are priced at the current valuation. With retail slowing, MSME will drive the next leg of growth Growth in retail credit, especially in the high profit segments like credit cards and auto loans, has tapered down. Also, increased competition in the home loans segment has forced private banks to guide for lower growth from retail going forward. With previously lucrative segments slowing down, where’s growth going to come from? We believe MSME or business banking will spur the next leg of growth for private banks as capital constraints weigh down PSU banks. MSME segment remains highly underpenetrated and underserved With nearly 45mn MSMEs the segment accounts for nearly 15% of India’s GDP. However, only 1.6mn or c.5% of the total MSMEs are registered with various industry bodies or forums and a majority of them are unregistered. As per the Nachiket Mor Committee Report only c.4% of these MSMEs have access to institutional sources of credit like banks and NFBCs with the remaining 96% relying on self-financing or non-institutional sources of credit. PSU banks control majority of the market share (c.76%) while private banks have c.20% market share; this presents a huge growth opportunity for private banks in an underpenetrated segment. Huge growth and fee income opportunity for private banks In addition to the growth opportunity the MSME segment also offers strong fee income and cross-sell opportunity for private banks. For example, the strong retail FX fee income growth for a number of private banks including HDFC Bank and IndusInd is a result of these banks offering FX services to their MSME customers via the banks’ branches. Recommendations HDFC Bank (HDFCB IN, BUY, FV:Rs 850): Ahead of the curve Axis Bank (AXSB IN, BUY, FV:Rs 1,590): SME always been a core segment ICICI Bank (ICICIBC IN, SELL, FV:Rs 1,080): No more valuation comfort Yes Bank (YES IN, Neutral, FV:Rs 360): Capital is key; risks look priced in. ICICI Bank SELL 14% downside Fair Value Rs1,080.00 Bloomberg ticker ICICIBC IN Share Price Rs1,253.00 Market Capitalisation Rs1,450,109.00m Free Float 100% HDFC Bank BUY 13% upside Fair Value Rs850.00 Bloomberg ticker HDFCB IN Share Price Rs750.00 Market Capitalisation Rs1,795,950.00m Free Float 77% Axis Bank BUY 13% upside Fair Value Rs1,590.00 Bloomberg ticker AXSB IN Share Price Rs1,401.00 Market Capitalisation Rs657,335.00m Free Float 76% Yes Bank NEUTRAL 5% downside Fair Value Rs360.00 Bloomberg ticker YES IN Share Price Rs379.00 Market Capitalisation Rs135,918.00m Free Float 74% Source: Espirito Santo Investment Bank Research, Company Data, Bloomberg Analysts Saikiran Pulavarthi +91 22 4315 6824 [email protected]Espirito Santo Securities India Private Limited Sri Karthik Velamakanni +91 22 4315 6826 [email protected]Espirito Santo Securities India Private Limited
Transcript
FOR IMPORTANT DISCLOSURE INFORMATION, INCLUDING DISCLOSURES RELATED TO THE U.S. DISTRIBUTOR OF THIS REPORT, PLEASE REFER TO THE FINAL PAGES OF THIS REPORT - Please refer to the final pages of this report for important disclosures, analyst certifications and additional information. Espirito Santo Investment Bank does and seeks to do business with companies covered in its research reports. As a result, investors should be aware that the firm may have a conflict of interest that could affect the objectivity of this report. Investors should consider this report as only a single factor in making their investment decision. This research report has been prepared in whole or in part by research analysts based outside the US who are not registered/qualified as research analysts with FINRA (v1.0.5.2)
THEMATIC
India | Banks | 26-March-2014
Private Sector Banks
SME is the new "Retail"
Private banks have rallied over the past one month anticipating a
recovery. However, with strong competition eroding profitability in
the retail segment and corporate recovery still some time away
where will growth come from for private banks? We think the MSME
(Micro, Small and Medium Enterprise) segment could plug this gap
for private banks in the next leg of growth as they grab market
share from PSU banks (76% of MSME market share vs 20% for pvt
banks). The MSME segment offers high growth potential and is
performing well on the asset quality front despite the macro
headwinds. It is already one of the most profitable divisions for the
likes of HDFC Bank and Axis while ICICI seems to be struggling to
get its strategy in place. We reiterate our BUY recommendation on
HDFC Bank and Axis Bank but downgrade ICICI to SELL as post the
recent rally we are not comfortable with its valuation. We upgrade
Yes Bank to Neutral (from SELL) with a revised fair value of Rs360
as we believe most of the risks are priced at the current valuation.
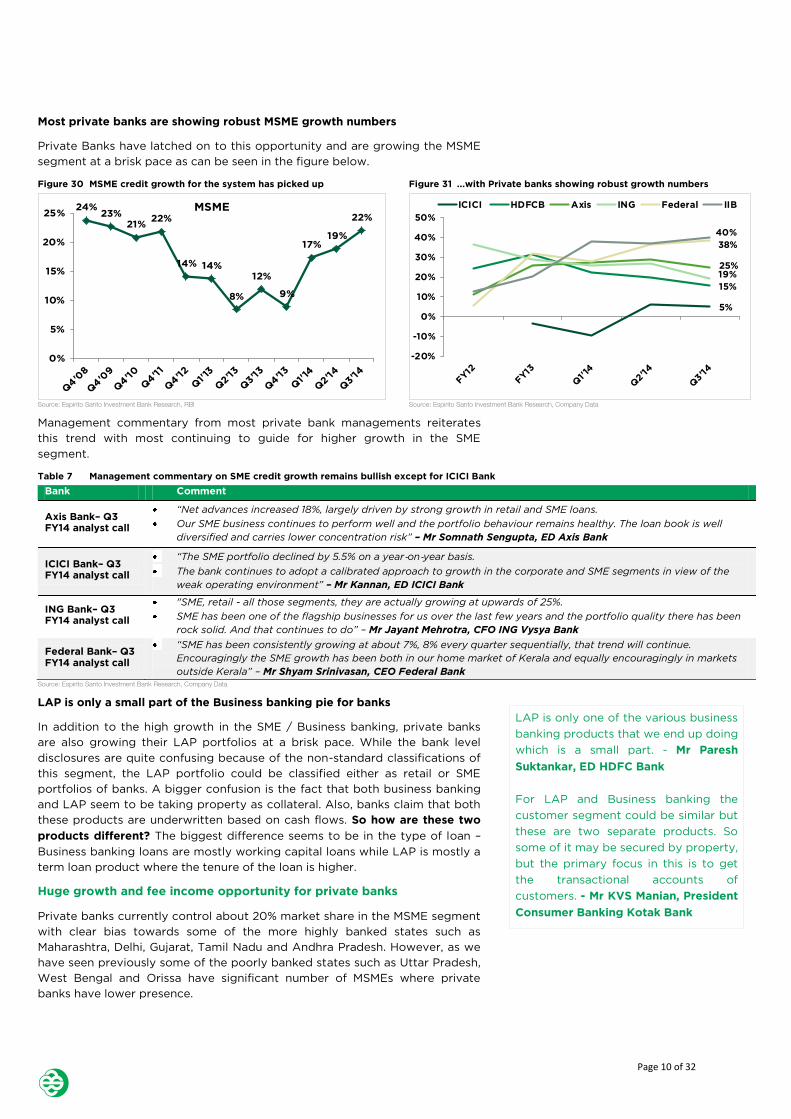
With retail slowing, MSME will drive the next leg of growth
Growth in retail credit, especially in the high profit segments like credit cards
and auto loans, has tapered down. Also, increased competition in the home
loans segment has forced private banks to guide for lower growth from retail
going forward. With previously lucrative segments slowing down, where’s
growth going to come from? We believe MSME or business banking will spur
the next leg of growth for private banks as capital constraints weigh down
PSU banks.
MSME segment remains highly underpenetrated and underserved
With nearly 45mn MSMEs the segment accounts for nearly 15% of India’s GDP.
However, only 1.6mn or c.5% of the total MSMEs are registered with various
industry bodies or forums and a majority of them are unregistered. As per the
Nachiket Mor Committee Report only c.4% of these MSMEs have access to
institutional sources of credit like banks and NFBCs with the remaining 96%
relying on self-financing or non-institutional sources of credit. PSU banks
control majority of the market share (c.76%) while private banks have c.20%
market share; this presents a huge growth opportunity for private banks in an
underpenetrated segment.
Huge growth and fee income opportunity for private banks
In addition to the growth opportunity the MSME segment also offers strong
fee income and cross-sell opportunity for private banks. For example, the
strong retail FX fee income growth for a number of private banks including
HDFC Bank and IndusInd is a result of these banks offering FX services to their
MSME customers via the banks’ branches.
Recommendations
HDFC Bank (HDFCB IN, BUY, FV:Rs 850): Ahead of the curve
Axis Bank (AXSB IN, BUY, FV:Rs 1,590): SME always been a core segment
ICICI Bank (ICICIBC IN, SELL, FV:Rs 1,080): No more valuation comfort
Yes Bank (YES IN, Neutral, FV:Rs 360): Capital is key; risks look priced in.
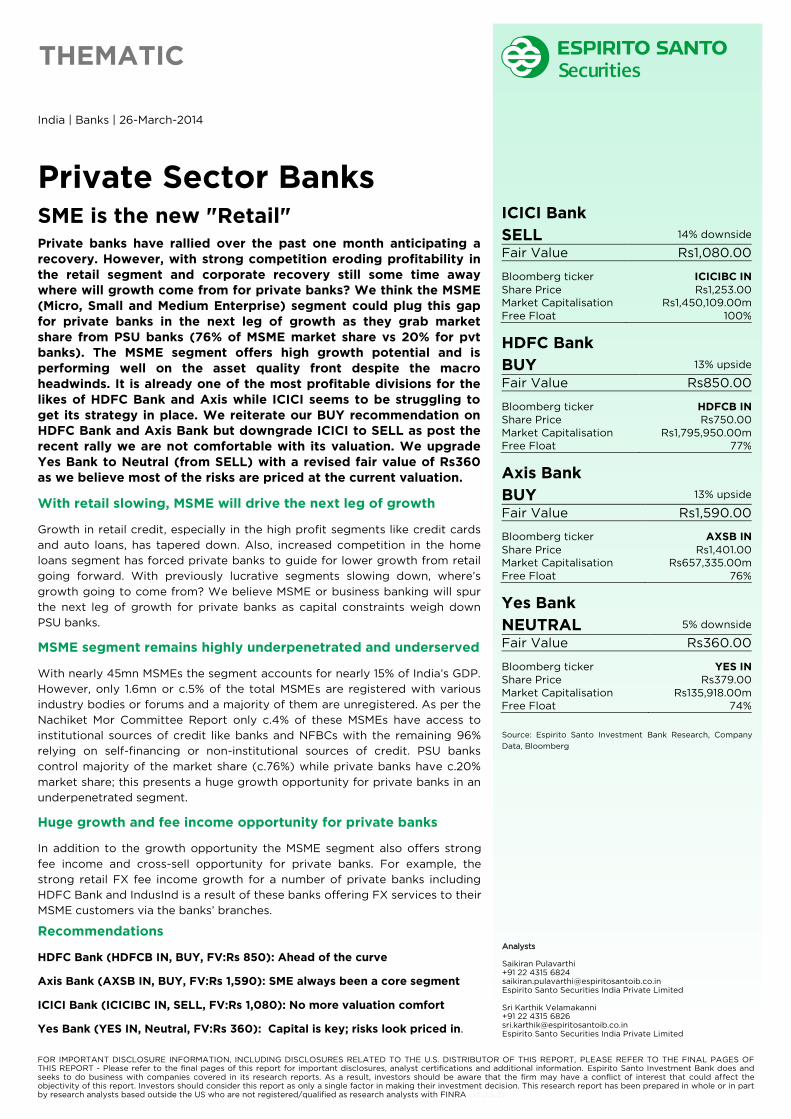
ICICI Bank
SELL 14% downside
Fair Value Rs1,080.00
Bloomberg ticker ICICIBC IN
Share Price Rs1,253.00
Market Capitalisation Rs1,450,109.00m
Free Float 100%
HDFC Bank
BUY 13% upside
Fair Value Rs850.00
Bloomberg ticker HDFCB IN
Share Price Rs750.00
Market Capitalisation Rs1,795,950.00m
Free Float 77%
Axis Bank
BUY 13% upside
Fair Value Rs1,590.00
Bloomberg ticker AXSB IN
Share Price Rs1,401.00
Market Capitalisation Rs657,335.00m
Free Float 76%
Yes Bank
NEUTRAL 5% downside
Fair Value Rs360.00
Bloomberg ticker YES IN
Share Price Rs379.00
Market Capitalisation Rs135,918.00m
Free Float 74%
Source: Espirito Santo Investment Bank Research, Company
Data, Bloomberg
Analysts Saikiran Pulavarthi +91 22 4315 6824 [email protected] Espirito Santo Securities India Private Limited Sri Karthik Velamakanni +91 22 4315 6826 [email protected] Espirito Santo Securities India Private Limited
Page 2 of 22
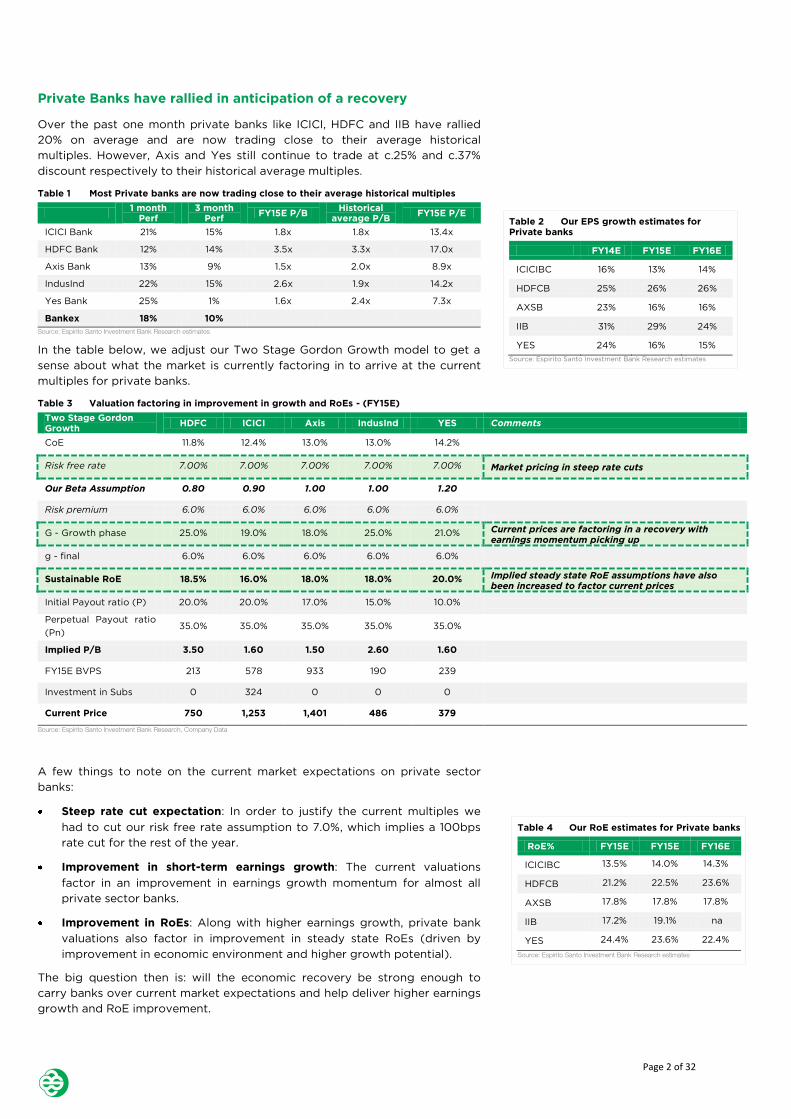
Table 2 Our EPS growth estimates for
Private banks
FY14E FY15E FY16E
ICICIBC 16% 13% 14%
HDFCB 25% 26% 26%
AXSB 23% 16% 16%
IIB 31% 29% 24%
YES 24% 16% 15%
Source: Espirito Santo Investment Bank Research estimates
Table 4 Our RoE estimates for Private banks
RoE% FY15E FY15E FY16E
ICICIBC 13.5% 14.0% 14.3%
HDFCB 21.2% 22.5% 23.6%
AXSB 17.8% 17.8% 17.8%
IIB 17.2% 19.1% na
YES 24.4% 23.6% 22.4%
Source: Espirito Santo Investment Bank Research estimates
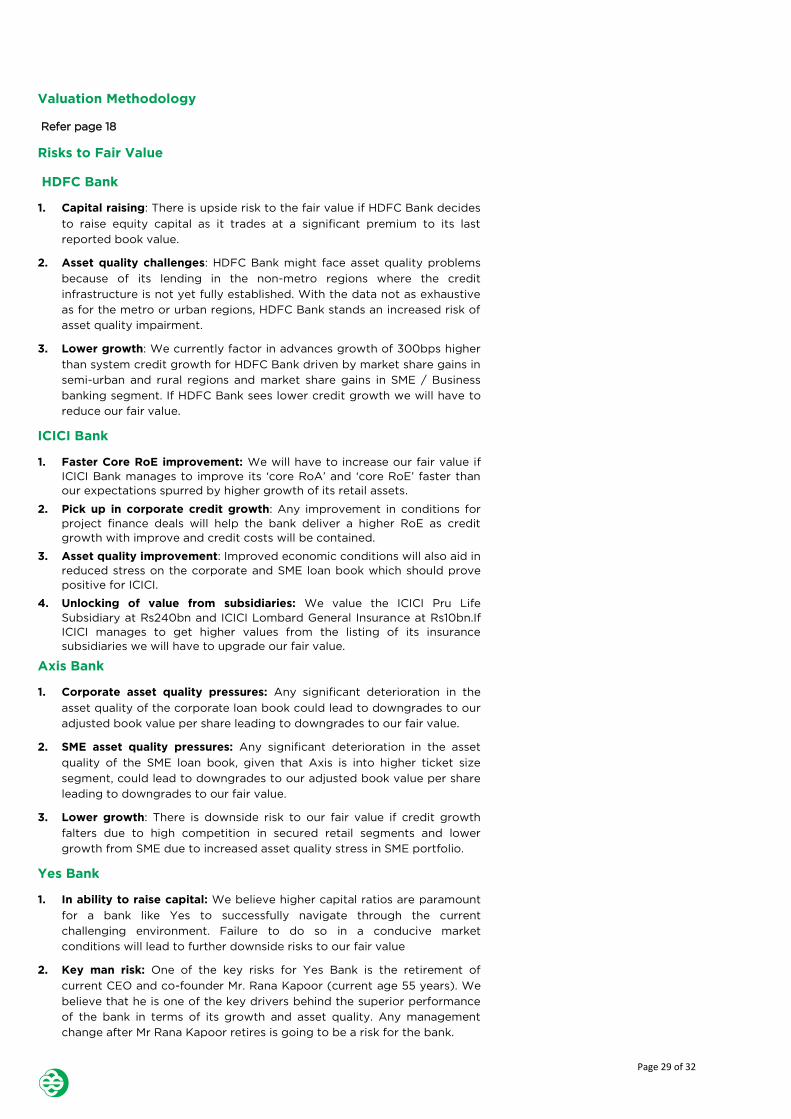
Private Banks have rallied in anticipation of a recovery
Over the past one month private banks like ICICI, HDFC and IIB have rallied
20% on average and are now trading close to their average historical
multiples. However, Axis and Yes still continue to trade at c.25% and c.37%
discount respectively to their historical average multiples.
In the table below, we adjust our Two Stage Gordon Growth model to get a
sense about what the market is currently factoring in to arrive at the current
multiples for private banks.
A few things to note on the current market expectations on private sector
banks:
Steep rate cut expectation: In order to justify the current multiples we
had to cut our risk free rate assumption to 7.0%, which implies a 100bps
rate cut for the rest of the year.
Improvement in short-term earnings growth: The current valuations
factor in an improvement in earnings growth momentum for almost all
private sector banks.
Improvement in RoEs: Along with higher earnings growth, private bank
valuations also factor in improvement in steady state RoEs (driven by
improvement in economic environment and higher growth potential).
The big question then is: will the economic recovery be strong enough to
carry banks over current market expectations and help deliver higher earnings
growth and RoE improvement.
Table 1 Most Private banks are now trading close to their average historical multiples
1 month
Perf
3 month
Perf FY15E P/B
Historical
average P/B FY15E P/E
ICICI Bank 21% 15% 1.8x 1.8x 13.4x
HDFC Bank 12% 14% 3.5x 3.3x 17.0x
Axis Bank 13% 9% 1.5x 2.0x 8.9x
IndusInd 22% 15% 2.6x 1.9x 14.2x
Yes Bank 25% 1% 1.6x 2.4x 7.3x
Bankex 18% 10%
Source: Espirito Santo Investment Bank Research estimates
Table 3 Valuation factoring in improvement in growth and RoEs - (FY15E)
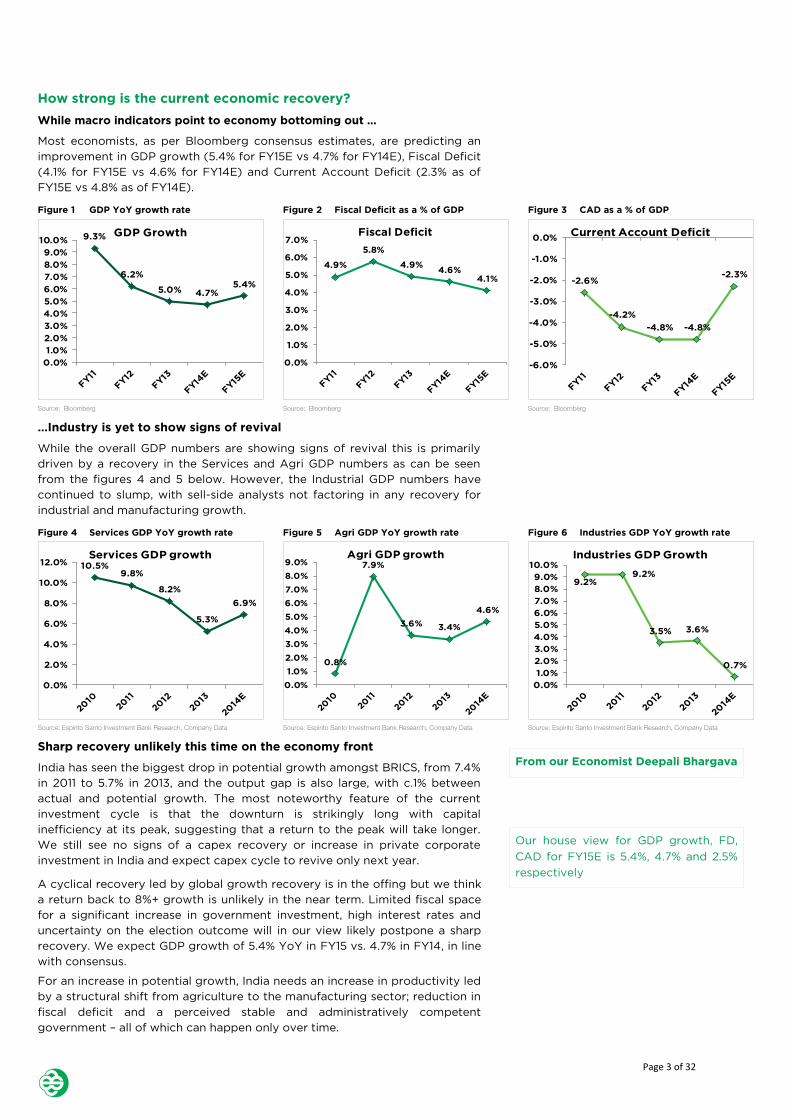
While the overall GDP numbers are showing signs of revival this is primarily
driven by a recovery in the Services and Agri GDP numbers as can be seen
from the figures 4 and 5 below. However, the Industrial GDP numbers have
continued to slump, with sell-side analysts not factoring in any recovery for
industrial and manufacturing growth.
Figure 4 Services GDP YoY growth rate Figure 5 Agri GDP YoY growth rate Figure 6 Industries GDP YoY growth rate
Source: Espirito Santo Investment Bank Research, Company Data Source: Espirito Santo Investment Bank Research, Company Data Source: Espirito Santo Investment Bank Research, Company Data
Sharp recovery unlikely this time on the economy front
India has seen the biggest drop in potential growth amongst BRICS, from 7.4%
in 2011 to 5.7% in 2013, and the output gap is also large, with c.1% between
actual and potential growth. The most noteworthy feature of the current
investment cycle is that the downturn is strikingly long with capital
inefficiency at its peak, suggesting that a return to the peak will take longer.
We still see no signs of a capex recovery or increase in private corporate
investment in India and expect capex cycle to revive only next year.
A cyclical recovery led by global growth recovery is in the offing but we think
a return back to 8%+ growth is unlikely in the near term. Limited fiscal space
for a significant increase in government investment, high interest rates and
uncertainty on the election outcome will in our view likely postpone a sharp
recovery. We expect GDP growth of 5.4% YoY in FY15 vs. 4.7% in FY14, in line
with consensus.
For an increase in potential growth, India needs an increase in productivity led
by a structural shift from agriculture to the manufacturing sector; reduction in
fiscal deficit and a perceived stable and administratively competent
government – all of which can happen only over time.
9.3%
6.2%
5.0% 4.7%5.4%
0.0%
1.0%
2.0%
3.0%
4.0%
5.0%
6.0%
7.0%
8.0%
9.0%
10.0%GDP Growth
4.9%
5.8%
4.9%4.6%
4.1%
0.0%
1.0%
2.0%
3.0%
4.0%
5.0%
6.0%
7.0%Fiscal Deficit
-2.6%
-4.2%
-4.8% -4.8%
-2.3%
-6.0%
-5.0%
-4.0%
-3.0%
-2.0%
-1.0%
0.0%Current Account Deficit
10.5%9.8%
8.2%
5.3%
6.9%
0.0%
2.0%
4.0%
6.0%
8.0%
10.0%
12.0%Services GDP growth
0.8%
7.9%
3.6% 3.4%
4.6%
0.0%
1.0%
2.0%
3.0%
4.0%
5.0%
6.0%
7.0%
8.0%
9.0%Agri GDP growth
9.2%9.2%
3.5% 3.6%
0.7%
0.0%
1.0%
2.0%
3.0%
4.0%
5.0%
6.0%
7.0%
8.0%
9.0%
10.0%Industries GDP Growth
Page 3 of 32
Page 4 of 22
If this is the base case scenario –
where will additional growth for
private banks come from?
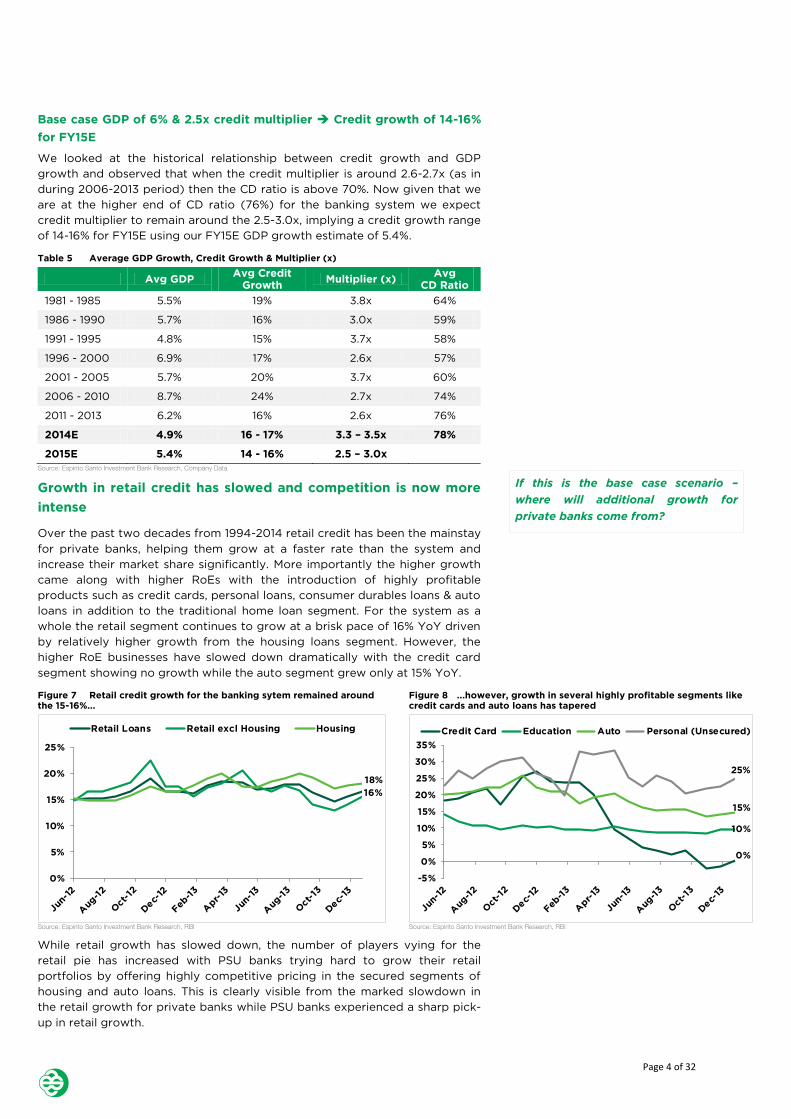
Base case GDP of 6% & 2.5x credit multiplier Credit growth of 14-16%
for FY15E
We looked at the historical relationship between credit growth and GDP
growth and observed that when the credit multiplier is around 2.6-2.7x (as in
during 2006-2013 period) then the CD ratio is above 70%. Now given that we
are at the higher end of CD ratio (76%) for the banking system we expect
credit multiplier to remain around the 2.5-3.0x, implying a credit growth range
of 14-16% for FY15E using our FY15E GDP growth estimate of 5.4%.
Table 5 Average GDP Growth, Credit Growth & Multiplier (x)
Avg GDP Avg Credit
Growth Multiplier (x)
Avg
CD Ratio
1981 - 1985 5.5% 19% 3.8x 64%
1986 - 1990 5.7% 16% 3.0x 59%
1991 - 1995 4.8% 15% 3.7x 58%
1996 - 2000 6.9% 17% 2.6x 57%
2001 - 2005 5.7% 20% 3.7x 60%
2006 - 2010 8.7% 24% 2.7x 74%
2011 - 2013 6.2% 16% 2.6x 76%
2014E 4.9% 16 - 17% 3.3 – 3.5x 78%
2015E 5.4% 14 - 16% 2.5 – 3.0x
Source: Espirito Santo Investment Bank Research, Company Data
Growth in retail credit has slowed and competition is now more
intense
Over the past two decades from 1994-2014 retail credit has been the mainstay
for private banks, helping them grow at a faster rate than the system and
increase their market share significantly. More importantly the higher growth
came along with higher RoEs with the introduction of highly profitable
products such as credit cards, personal loans, consumer durables loans & auto
loans in addition to the traditional home loan segment. For the system as a
whole the retail segment continues to grow at a brisk pace of 16% YoY driven
by relatively higher growth from the housing loans segment. However, the
higher RoE businesses have slowed down dramatically with the credit card
segment showing no growth while the auto segment grew only at 15% YoY.
Figure 7 Retail credit growth for the banking sytem remained around
the 15-16%...
Figure 8 ...however, growth in several highly profitable segments like
credit cards and auto loans has tapered
Source: Espirito Santo Investment Bank Research, RBI Source: Espirito Santo Investment Bank Research, RBI
While retail growth has slowed down, the number of players vying for the
retail pie has increased with PSU banks trying hard to grow their retail
portfolios by offering highly competitive pricing in the secured segments of
housing and auto loans. This is clearly visible from the marked slowdown in
the retail growth for private banks while PSU banks experienced a sharp pick-
up in retail growth.
16%
18%
0%
5%
10%
15%
20%
25%
Retail Loans Retail excl Housing Housing
0%
10%
15%
25%
-5%
0%
5%
10%
15%
20%
25%
30%
35%
Credit Card Education Auto Personal (Unsecured)
Page 4 of 32
Page 5 of 22
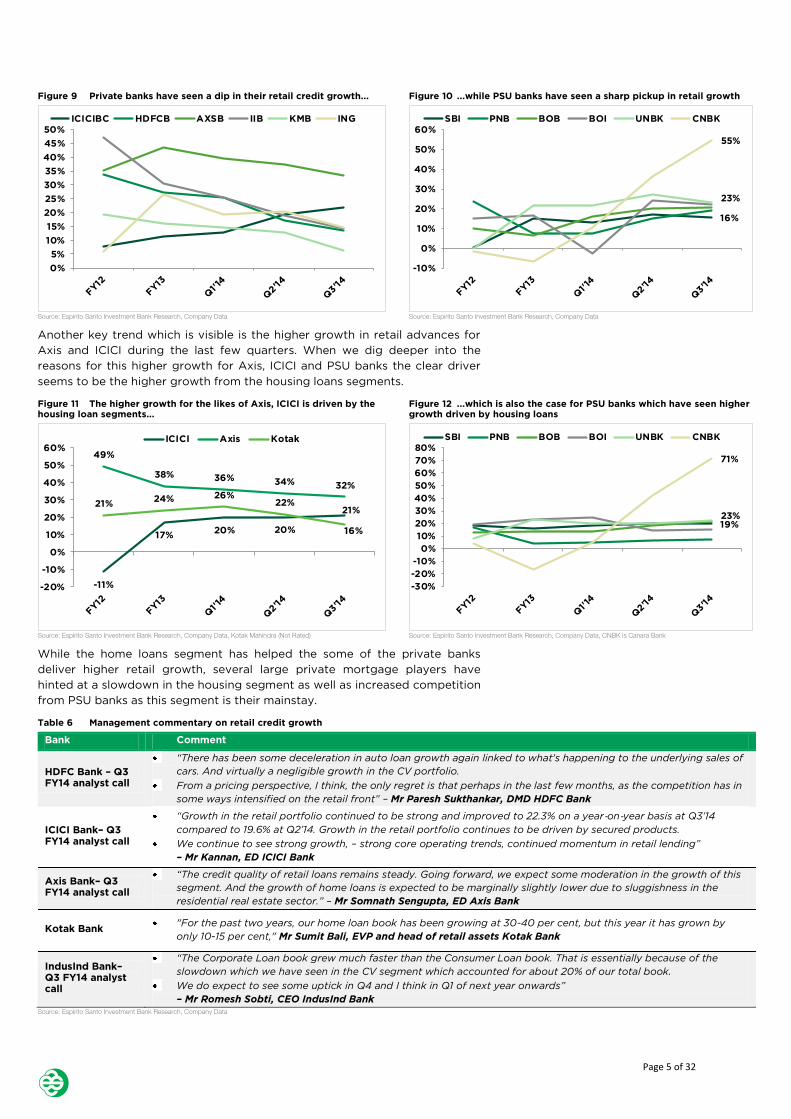
Figure 9 Private banks have seen a dip in their retail credit growth... Figure 10 ...while PSU banks have seen a sharp pickup in retail growth
Source: Espirito Santo Investment Bank Research, Company Data Source: Espirito Santo Investment Bank Research, Company Data
Another key trend which is visible is the higher growth in retail advances for
Axis and ICICI during the last few quarters. When we dig deeper into the
reasons for this higher growth for Axis, ICICI and PSU banks the clear driver
seems to be the higher growth from the housing loans segments.
Figure 11 The higher growth for the likes of Axis, ICICI is driven by the
housing loan segments...
Figure 12 ...which is also the case for PSU banks which have seen higher
growth driven by housing loans
Source: Espirito Santo Investment Bank Research, Company Data, Kotak Mahindra (Not Rated) Source: Espirito Santo Investment Bank Research, Company Data, CNBK is Canara Bank
While the home loans segment has helped the some of the private banks
deliver higher retail growth, several large private mortgage players have
hinted at a slowdown in the housing segment as well as increased competition
from PSU banks as this segment is their mainstay.
Table 6 Management commentary on retail credit growth
Bank Comment
HDFC Bank – Q3 FY14 analyst call
“There has been some deceleration in auto loan growth again linked to what's happening to the underlying sales of
cars. And virtually a negligible growth in the CV portfolio.
From a pricing perspective, I think, the only regret is that perhaps in the last few months, as the competition has in
some ways intensified on the retail front” – Mr Paresh Sukthankar, DMD HDFC Bank
ICICI Bank– Q3
FY14 analyst call
“Growth in the retail portfolio continued to be strong and improved to 22.3% on a year‐on‐year basis at Q3’14
compared to 19.6% at Q2’14. Growth in the retail portfolio continues to be driven by secured products.
We continue to see strong growth, – strong core operating trends, continued momentum in retail lending”
– Mr Kannan, ED ICICI Bank
Axis Bank– Q3 FY14 analyst call
“The credit quality of retail loans remains steady. Going forward, we expect some moderation in the growth of this
segment. And the growth of home loans is expected to be marginally slightly lower due to sluggishness in the
residential real estate sector.” – Mr Somnath Sengupta, ED Axis Bank
Kotak Bank "For the past two years, our home loan book has been growing at 30-40 per cent, but this year it has grown by
only 10-15 per cent," Mr Sumit Bali, EVP and head of retail assets Kotak Bank
IndusInd Bank–
Q3 FY14 analyst call
“The Corporate Loan book grew much faster than the Consumer Loan book. That is essentially because of the
slowdown which we have seen in the CV segment which accounted for about 20% of our total book.
We do expect to see some uptick in Q4 and I think in Q1 of next year onwards”
– Mr Romesh Sobti, CEO IndusInd Bank
Source: Espirito Santo Investment Bank Research, Company Data
0%
5%
10%
15%
20%
25%
30%
35%
40%
45%
50%
ICICIBC HDFCB AXSB IIB KMB ING
16%
23%
55%
-10%
0%
10%
20%
30%
40%
50%
60%
SBI PNB BOB BOI UNBK CNBK
-11%
17%20% 20%
21%
49%
38% 36% 34% 32%
21%24% 26%
22%
16%
-20%
-10%
0%
10%
20%
30%
40%
50%
60%ICICI Axis Kotak
19%23%
71%
-30%
-20%
-10%
0%
10%
20%
30%
40%
50%
60%
70%
80%
SBI PNB BOB BOI UNBK CNBK
Page 5 of 32
Page 6 of 22
To conclude
a) Growth in higher RoE retail segments has declined.
b) Banks driving retail growth through higher growth from housing loan
segment.
c) HDFC Bank has acknowledged the increased competition in the retail
segment.
d) Private banks like Axis, Kotak and HDFC Bank have hinted at lower
growth from retail.
So with previously lucrative segments slowing down, where’s growth going to
come from? The answer we believe is newer product segments. As growth in
retail credit slows private banks will foray into hitherto PSU strongholds to
drive growth and PSU banks constrained by capital requirements could falter.
Page 6 of 32
Page 7 of 22
MSME still remains largely untapped
Newer product segments will drive the next leg of growth
In addition to the slower growth and increased competition in the retail
segment banks also need to deal with the additional challenge of subdued
growth from the corporate segment which is already reeling from asset quality
stress and over-leverage.
In the following sections, we look at which product segments are going to
drive market share gains for Private Banks in the next 3-4 years. This is
especially important since the growth in retail credit has slowed down for
private banks in the last 3 quarters. In order to deliver higher growth we see
private banks foraying into MSME or business banking.
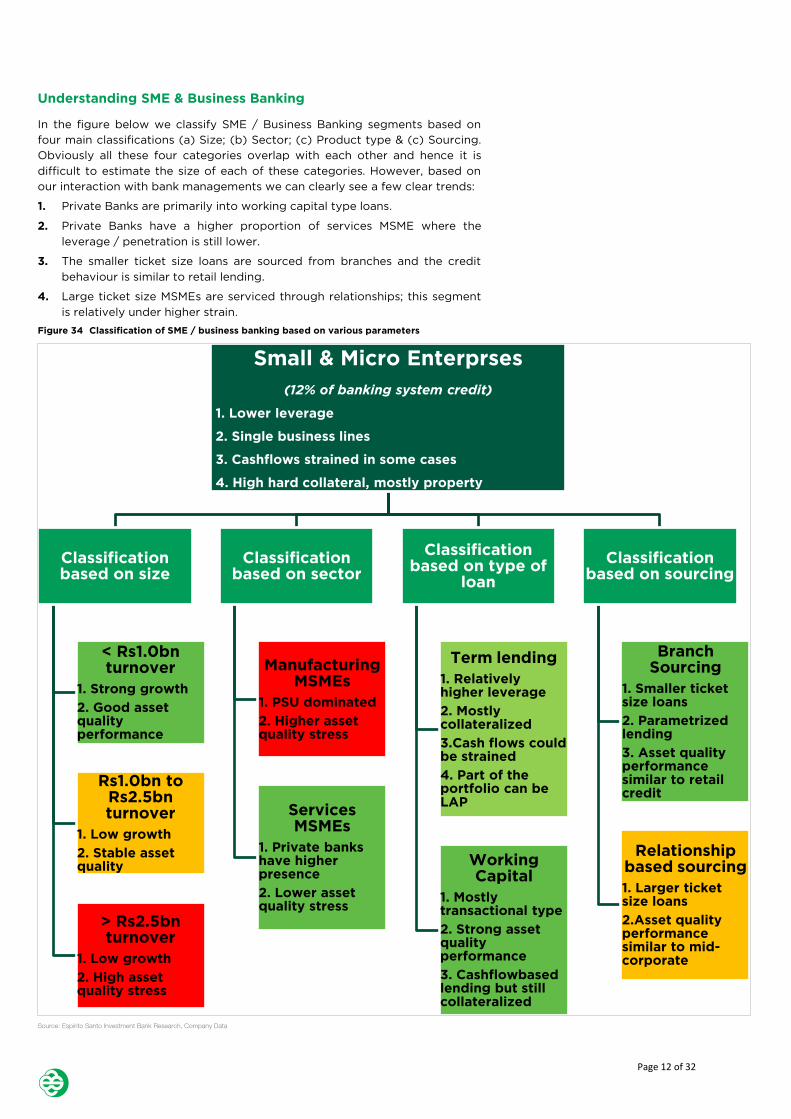
MSME / Business Banking / LAP – what’s in the name?
The Micro, Small and Medium Enterprise (MSME) is one of the main sectors
contributing to nearly 15% of Indian GDP and plays a crucial role in providing
large employment opportunities. As of FY12 there were nearly 45million MSME
units in India providing employment to nearly 101mn people. However, only
1.6mn or 4% of the total MSME are registered with various industry bodies or
forums with a majority of them still remaining unregistered.
Figure 13 Number of MSMEs
Figure 14 MSME provides large scale
employment...
Figure 15 ...however, most MSME still remain
unregistered (Mn)
Source: Ministry of MSMEs - FY13 Annual report Source: Ministry of MSMEs - FY13 Annual report Source: Ministry of MSMEs - FY13 Annual report
As a vast majority of MSME remains unregistered most of them do not have
access to institutional sources of financing. As can be seen from the figure
below, nearly 93% of MSME rely on self-financing, which is in line with the
proportion of MSME unregistered. This is also evident in the low Credit to GDP
ratio of the MSME sector relative to the Indian banking system.
Figure 16 Since most MSMEs remain unregistered, their access to
institution financing is olny 5%...
Figure 17 …because of which their Credit to GDP for MSMEs is lower
than banking system average
Source: Ministry of MSMEs Source: Ministry of MSMEs
36 3839
4143
45
0
5
10
15
20
25
30
35
40
45
50
No of Working MSMEs (Mn)
81 84 8892
97101
0
20
40
60
80
100
120
No of people employed (Mn)
1.6, 4%
34.6,
96%
Registered vs unregistered MSME
Registered Un-registered
93%
5%
2% Self Finance /
no Finance
Institutional
Sources
Non-
Institutional
Sources 25%
43%36%
52%56%
101%
0%
20%
40%
60%
80%
100%
120%
MSME -
Services
Large -
Services
Agri Total MSME -
Industry
Large -
Industry
Credit to GDP
Page 7 of 32
Page 8 of 22
Nearly 56% of MSMEs are in the rural
and semi-urban regions and nearly 70%
of them are in the services sector
where the Credit to GDP ratio is only
25%.
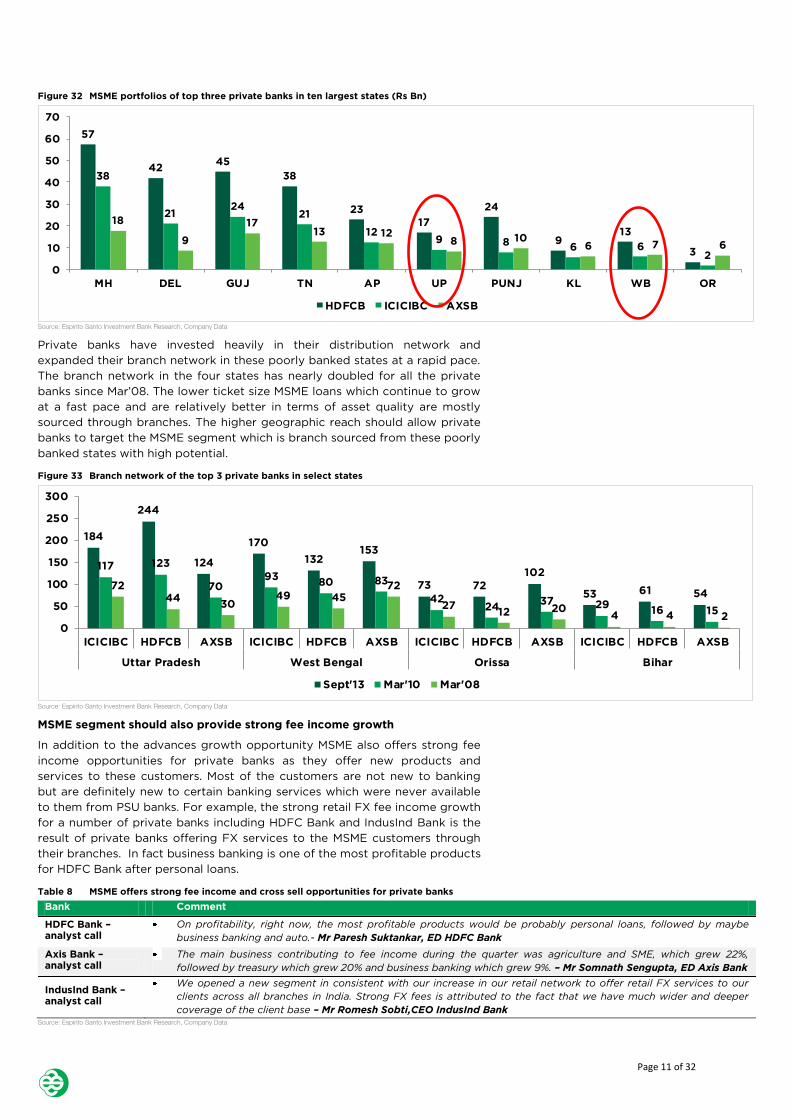
Industry MSMEs appear to have 56% financial depth (Credit to GDP ratio),
while Service MSMEs have a much lower at 25%. The Nachiket Mor Committee
revealed that even though 70% of MSMEs have a bank account, only 5% have
access to term loans and a mere 1% has access to working capital loans from
banks. A large number of MSMEs are present in states such as UP and WB
where credit penetration is one of the lowest in the country. Refer to state
figure 32 for state wise portfolio split of top 3 private banks.
Figure 18 MSMEs present in near equal
proportion in both urban & rural regions
Figure 19 A majority of MSMEs are in the
services sector
Figure 20 However, credit to Services-MSMEs
is lower than Mfg-MSMEs (Rs Bn)
Source: Ministry of MSMEs Source: Ministry of MSMEs Source: Ministry of MSMEs
Figure 21 MSMEs are present through out
India without any regional bias
Figure 22 Even in terms of employement
generation the distribution seems very even
Figure 23 Retail trade and repairs is the
lergest industry segment following by textiles
Source: Ministry of MSMEs Source: Ministry of MSMEs Source: Ministry of MSMEs
Figure 24 States like UP, WB which have large proportion of MSMEs
have low credit penetration as per CRISIL Inclusix...
Figure 25 ...which is also visible from the low CD ratio of the respective
states as of FY13
Source: CRISIL Source: Espirito Santo Investment Bank Research, RBI
44%
56%
Area wise share of MSMEs
Urban Rural
30%
70%
Activity wise share of MSMEs
Manufacturing Services
5,105
10,979
2,843 2,779
0
2,000
4,000
6,000
8,000
10,000
12,000
MSME - Mfg MSME - Services
GDP Credit
UP, 4.4
WB,
3.7
TN, 3.3
MH, 6.1
AP,
2.6
KL,
2.2GJ, 2.2
KTKT,
2.0
MP, 1.9
RAJ,
1.7Others,
6.1
State wise distribution of MSME (Mn)
UP, 9.2
WB,
8.6
TN, 8.1
AP, 7.1
MH,
7.0KL,
5.0
GJ,
4.8KTKT,
4.7
MP, 3.4
OR, 3.3
Others,
19.4
State wise employement in MSMEs (Mn)
Retail
Trade & Repairs,
40%
Textile,
11%
Food &
Bev, 7%
Hotels,
4%
Auto &
Fuel, 4%
Furnitur
e, 3%
Metal &
Machinery, 2%
Other
Servies, 29%
Leading industries in MSME
30%
42%45%
55%58%
68% 70% 70%
0%
10%
20%
30%
40%
50%
60%
70%
80%
BH UP OR MP WB KTK KL GJ
State CD ratio
Page 8 of 32
Page 9 of 22
PSU banks still control majority of MSME market share
Relative to retail credit where Private and Foreign banks now control majority
of the banking system market share, in the MSME segment it’s PSU banks that
still control majority of the market with private banks having only c.20% of
market share compared to c.45% in retail credit. We believe private sector
banks are nicely placed to increase their market share in this segment.
Figure 26 Private banks hold majority market share in retail credit Figure 27 ...while PSU banks continue to dominate the MSME segment
Source: Espirito Santo Investment Bank Research, RBI Source: Ministry of MSMEs
In our previous note on PSU Bank “Climbing the FY16Ecliff” we have
discussed in detail as to why the past trend of PSU banks losing market share
to private sector banks will only accelerate in the next few years with private
bank gaining significant foothold in the rural and semi-urban regions. We have
presented three key reasons: (a) Reason 1: Capital constraints; (b) Reason 2:
FOR IMPORTANT DISCLOSURE INFORMATION, INCLUDING DISCLOSURES RELATED TO THE U.S. DISTRIBUTOR OF THIS REPORT, PLEASE REFER TO THE FINAL PAGES OF THIS REPORT - Please refer to the final pages of this report for important disclosures, analyst certifications and additional information. Espirito Santo Investment Bank does and seeks to do business with companies covered in its research reports. As a result, investors should be aware that the firm may have a conflict of interest that could affect the objectivity of this report. Investors should consider this report as only a single factor in making their investment decision. This research report has been prepared in whole or in part by research analysts based outside the US who are not registered/qualified as research analysts with FINRA (v1.0.5.2)
MARKET UPDATE
India | Banks | 26-March-2014
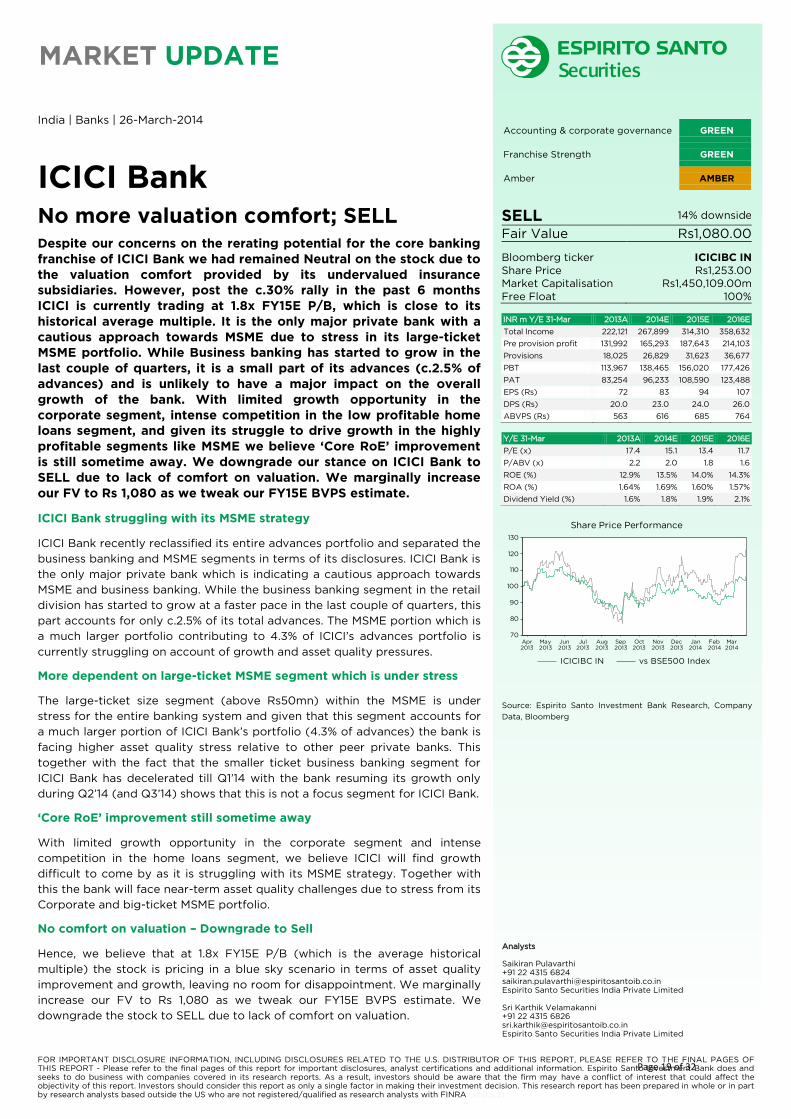
ICICI Bank
No more valuation comfort; SELL
Despite our concerns on the rerating potential for the core banking
franchise of ICICI Bank we had remained Neutral on the stock due to
the valuation comfort provided by its undervalued insurance
subsidiaries. However, post the c.30% rally in the past 6 months
ICICI is currently trading at 1.8x FY15E P/B, which is close to its
historical average multiple. It is the only major private bank with a
cautious approach towards MSME due to stress in its large-ticket
MSME portfolio. While Business banking has started to grow in the
last couple of quarters, it is a small part of its advances (c.2.5% of
advances) and is unlikely to have a major impact on the overall
growth of the bank. With limited growth opportunity in the
corporate segment, intense competition in the low profitable home
loans segment, and given its struggle to drive growth in the highly
profitable segments like MSME we believe ‘Core RoE’ improvement
is still sometime away. We downgrade our stance on ICICI Bank to
SELL due to lack of comfort on valuation. We marginally increase
our FV to Rs 1,080 as we tweak our FY15E BVPS estimate.
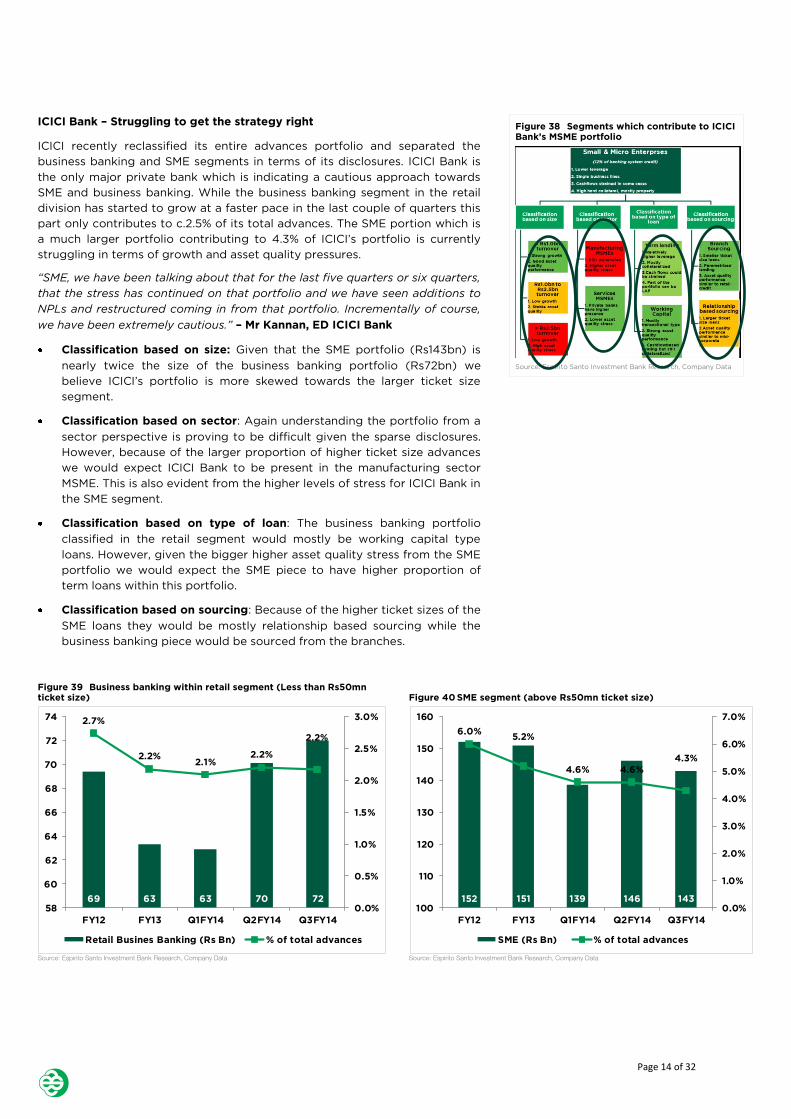
ICICI Bank struggling with its MSME strategy
ICICI Bank recently reclassified its entire advances portfolio and separated the
business banking and MSME segments in terms of its disclosures. ICICI Bank is
the only major private bank which is indicating a cautious approach towards
MSME and business banking. While the business banking segment in the retail
division has started to grow at a faster pace in the last couple of quarters, this
part accounts for only c.2.5% of its total advances. The MSME portion which is
a much larger portfolio contributing to 4.3% of ICICI’s advances portfolio is
currently struggling on account of growth and asset quality pressures.
More dependent on large-ticket MSME segment which is under stress
The large-ticket size segment (above Rs50mn) within the MSME is under
stress for the entire banking system and given that this segment accounts for
a much larger portion of ICICI Bank’s portfolio (4.3% of advances) the bank is
facing higher asset quality stress relative to other peer private banks. This
together with the fact that the smaller ticket business banking segment for
ICICI Bank has decelerated till Q1’14 with the bank resuming its growth only
during Q2’14 (and Q3’14) shows that this is not a focus segment for ICICI Bank.
‘Core RoE’ improvement still sometime away
With limited growth opportunity in the corporate segment and intense
competition in the home loans segment, we believe ICICI will find growth
difficult to come by as it is struggling with its MSME strategy. Together with
this the bank will face near-term asset quality challenges due to stress from its
Corporate and big-ticket MSME portfolio.
No comfort on valuation – Downgrade to Sell
Hence, we believe that at 1.8x FY15E P/B (which is the average historical
multiple) the stock is pricing in a blue sky scenario in terms of asset quality
improvement and growth, leaving no room for disappointment. We marginally
increase our FV to Rs 1,080 as we tweak our FY15E BVPS estimate. We
downgrade the stock to SELL due to lack of comfort on valuation.
Accounting & corporate governance GREEN
Franchise Strength GREEN
Amber AMBER
SELL 14% downside
Fair Value Rs1,080.00
Bloomberg ticker ICICIBC IN
Share Price Rs1,253.00
Market Capitalisation Rs1,450,109.00m
Free Float 100%
INR m Y/E 31-Mar 2013A 2014E 2015E 2016E
Total Income 222,121 267,899 314,310 358,632
Pre provision profit 131,992 165,293 187,643 214,103
Provisions 18,025 26,829 31,623 36,677
PBT 113,967 138,465 156,020 177,426
PAT 83,254 96,233 108,590 123,488
EPS (Rs) 72 83 94 107
DPS (Rs) 20.0 23.0 24.0 26.0
ABVPS (Rs) 563 616 685 764
Y/E 31-Mar 2013A 2014E 2015E 2016E
P/E (x) 17.4 15.1 13.4 11.7
P/ABV (x) 2.2 2.0 1.8 1.6
ROE (%) 12.9% 13.5% 14.0% 14.3%
ROA (%) 1.64% 1.69% 1.60% 1.57%
Dividend Yield (%) 1.6% 1.8% 1.9% 2.1%
Source: Espirito Santo Investment Bank Research, Company
Data, Bloomberg
70
80
90
100
110
120
130
Apr 2013
May 2013
Jun 2013
Jul 2013
Aug 2013
Sep 2013
Oct 2013
Nov 2013
Dec 2013
Jan 2014
Feb 2014
Mar 2014
ICICIBC IN vs BSE500 Index
Share Price Performance
Analysts Saikiran Pulavarthi +91 22 4315 6824 [email protected] Espirito Santo Securities India Private Limited Sri Karthik Velamakanni +91 22 4315 6826 [email protected] Espirito Santo Securities India Private Limited
Page 19 of 32
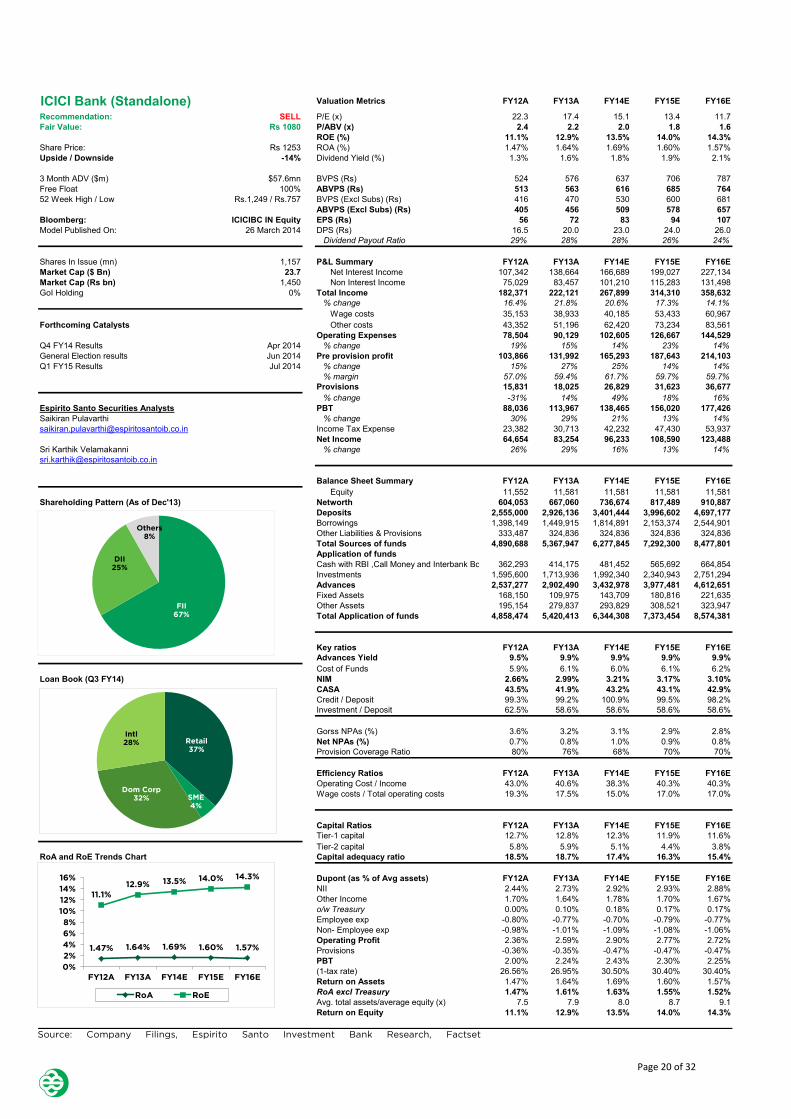
Page 2 of 5
Source: Company Filings, Espirito Santo Investment Bank Research, Factset
Avg. total assets/average equity (x) 7.5 7.9 8.0 8.7 9.1
Return on Equity 11.1% 12.9% 13.5% 14.0% 14.3%
FY16EFY15EFY14EICICI Bank (Standalone) Valuation Metrics FY12A FY13A
FII
67%
DII
25%
Others
8%
Retail
37%
SME
4%
Dom Corp
32%
Intl
28%
1.47% 1.64% 1.69% 1.60% 1.57%
11.1%
12.9% 13.5% 14.0% 14.3%
0%
2%
4%
6%
8%
10%
12%
14%
16%
FY12A FY13A FY14E FY15E FY16E
RoA RoE
Page 20 of 32
FOR IMPORTANT DISCLOSURE INFORMATION, INCLUDING DISCLOSURES RELATED TO THE U.S. DISTRIBUTOR OF THIS REPORT, PLEASE REFER TO THE FINAL PAGES OF THIS REPORT - Please refer to the final pages of this report for important disclosures, analyst certifications and additional information. Espirito Santo Investment Bank does and seeks to do business with companies covered in its research reports. As a result, investors should be aware that the firm may have a conflict of interest that could affect the objectivity of this report. Investors should consider this report as only a single factor in making their investment decision. This research report has been prepared in whole or in part by research analysts based outside the US who are not registered/qualified as research analysts with FINRA (v1.0.5.2)
MARKET UPDATE
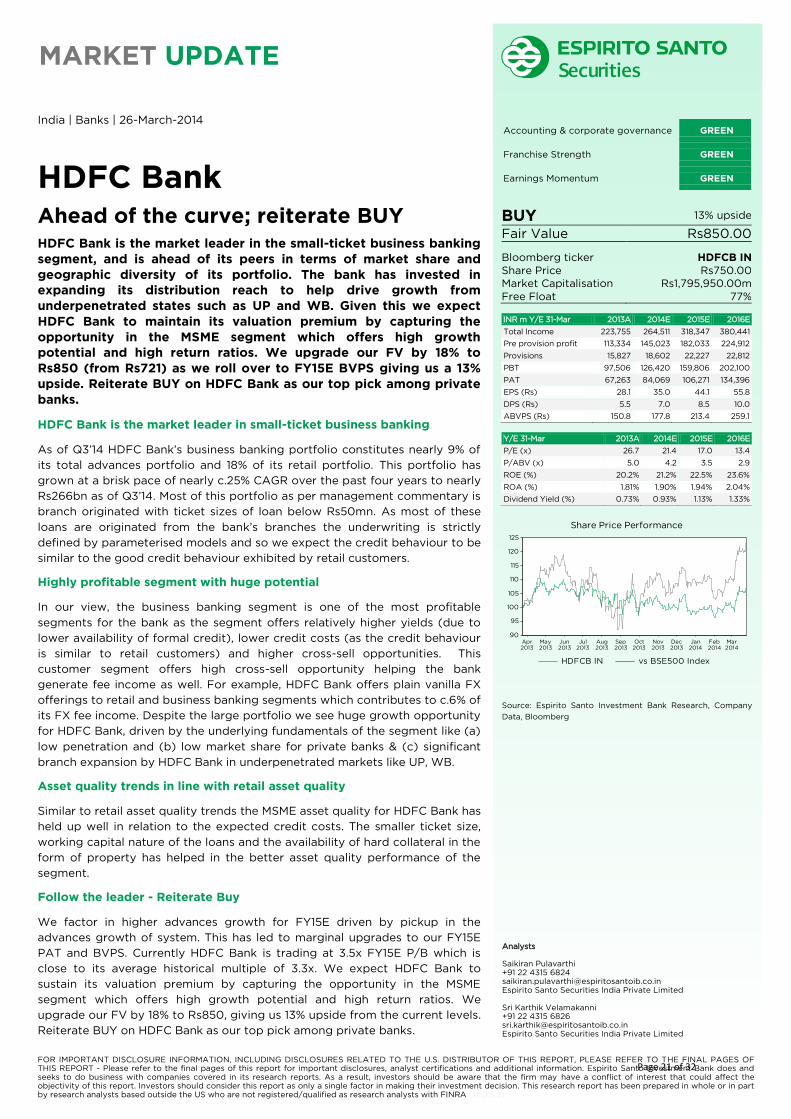
India | Banks | 26-March-2014
HDFC Bank
Ahead of the curve; reiterate BUY
HDFC Bank is the market leader in the small-ticket business banking
segment, and is ahead of its peers in terms of market share and
geographic diversity of its portfolio. The bank has invested in
expanding its distribution reach to help drive growth from
underpenetrated states such as UP and WB. Given this we expect
HDFC Bank to maintain its valuation premium by capturing the
opportunity in the MSME segment which offers high growth
potential and high return ratios. We upgrade our FV by 18% to
Rs850 (from Rs721) as we roll over to FY15E BVPS giving us a 13%
upside. Reiterate BUY on HDFC Bank as our top pick among private
banks.
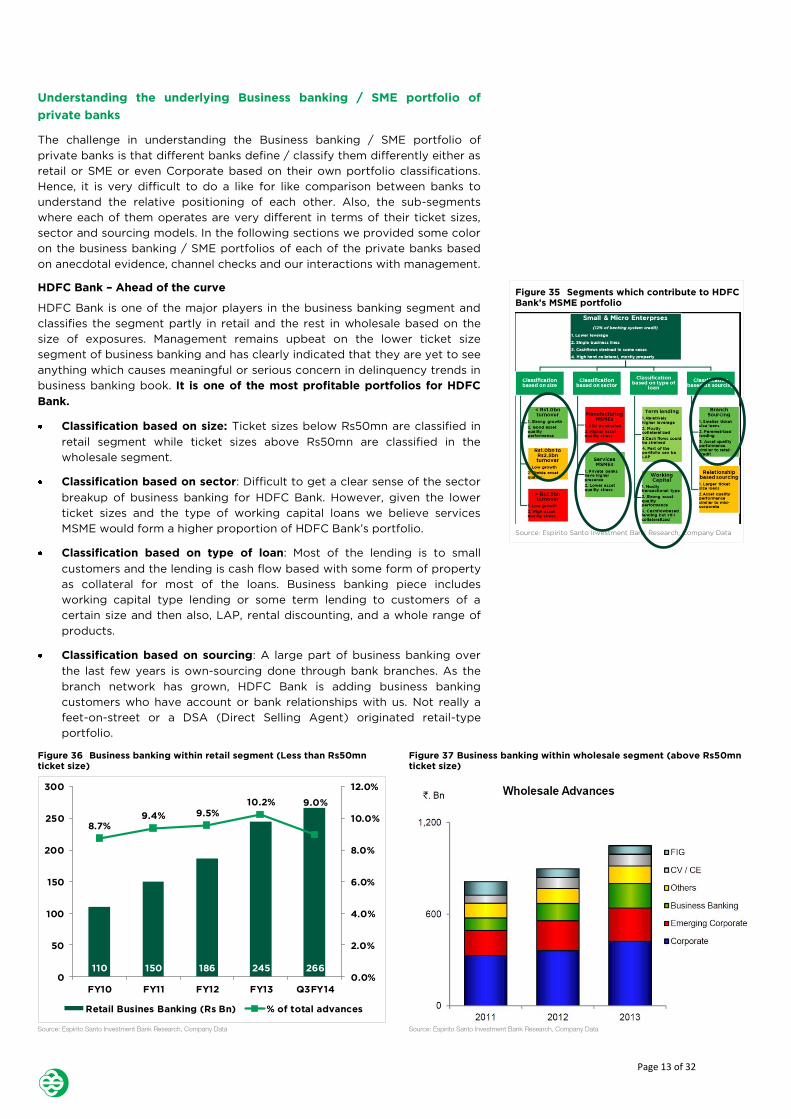
HDFC Bank is the market leader in small-ticket business banking
As of Q3’14 HDFC Bank’s business banking portfolio constitutes nearly 9% of
its total advances portfolio and 18% of its retail portfolio. This portfolio has
grown at a brisk pace of nearly c.25% CAGR over the past four years to nearly
Rs266bn as of Q3’14. Most of this portfolio as per management commentary is
branch originated with ticket sizes of loan below Rs50mn. As most of these
loans are originated from the bank’s branches the underwriting is strictly
defined by parameterised models and so we expect the credit behaviour to be
similar to the good credit behaviour exhibited by retail customers.
Highly profitable segment with huge potential
In our view, the business banking segment is one of the most profitable
segments for the bank as the segment offers relatively higher yields (due to
lower availability of formal credit), lower credit costs (as the credit behaviour
is similar to retail customers) and higher cross-sell opportunities. This
customer segment offers high cross-sell opportunity helping the bank
generate fee income as well. For example, HDFC Bank offers plain vanilla FX
offerings to retail and business banking segments which contributes to c.6% of
its FX fee income. Despite the large portfolio we see huge growth opportunity
for HDFC Bank, driven by the underlying fundamentals of the segment like (a)
low penetration and (b) low market share for private banks & (c) significant
branch expansion by HDFC Bank in underpenetrated markets like UP, WB.
Asset quality trends in line with retail asset quality
Similar to retail asset quality trends the MSME asset quality for HDFC Bank has
held up well in relation to the expected credit costs. The smaller ticket size,
working capital nature of the loans and the availability of hard collateral in the
form of property has helped in the better asset quality performance of the
segment.
Follow the leader - Reiterate Buy
We factor in higher advances growth for FY15E driven by pickup in the
advances growth of system. This has led to marginal upgrades to our FY15E
PAT and BVPS. Currently HDFC Bank is trading at 3.5x FY15E P/B which is
close to its average historical multiple of 3.3x. We expect HDFC Bank to
sustain its valuation premium by capturing the opportunity in the MSME
segment which offers high growth potential and high return ratios. We
upgrade our FV by 18% to Rs850, giving us 13% upside from the current levels.
Reiterate BUY on HDFC Bank as our top pick among private banks.
Accounting & corporate governance GREEN
Franchise Strength GREEN
Earnings Momentum GREEN
BUY 13% upside
Fair Value Rs850.00
Bloomberg ticker HDFCB IN
Share Price Rs750.00
Market Capitalisation Rs1,795,950.00m
Free Float 77%
INR m Y/E 31-Mar 2013A 2014E 2015E 2016E
Total Income 223,755 264,511 318,347 380,441
Pre provision profit 113,334 145,023 182,033 224,912
Provisions 15,827 18,602 22,227 22,812
PBT 97,506 126,420 159,806 202,100
PAT 67,263 84,069 106,271 134,396
EPS (Rs) 28.1 35.0 44.1 55.8
DPS (Rs) 5.5 7.0 8.5 10.0
ABVPS (Rs) 150.8 177.8 213.4 259.1
Y/E 31-Mar 2013A 2014E 2015E 2016E
P/E (x) 26.7 21.4 17.0 13.4
P/ABV (x) 5.0 4.2 3.5 2.9
ROE (%) 20.2% 21.2% 22.5% 23.6%
ROA (%) 1.81% 1.90% 1.94% 2.04%
Dividend Yield (%) 0.73% 0.93% 1.13% 1.33%
Source: Espirito Santo Investment Bank Research, Company
Data, Bloomberg
90
95
100
105
110
115
120
125
Apr 2013
May 2013
Jun 2013
Jul 2013
Aug 2013
Sep 2013
Oct 2013
Nov 2013
Dec 2013
Jan 2014
Feb 2014
Mar 2014
HDFCB IN vs BSE500 Index
Share Price Performance
Analysts Saikiran Pulavarthi +91 22 4315 6824 [email protected] Espirito Santo Securities India Private Limited Sri Karthik Velamakanni +91 22 4315 6826 [email protected] Espirito Santo Securities India Private Limited
Page 21 of 32
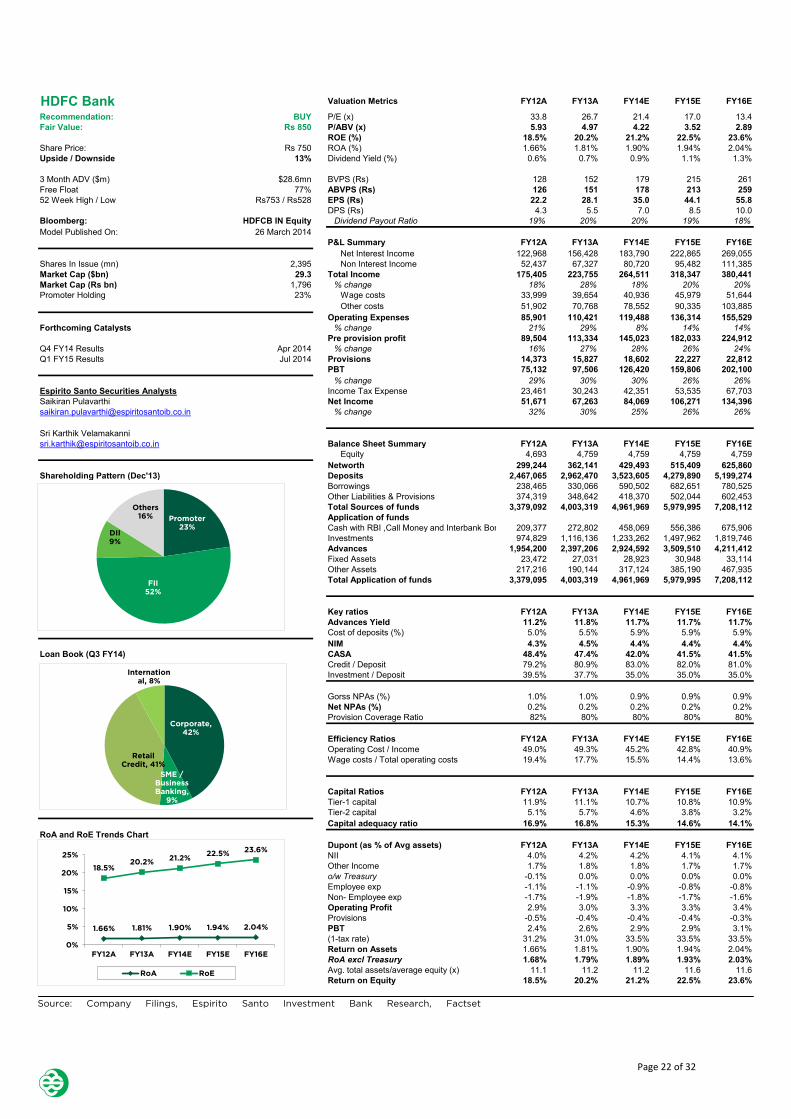
Page 2 of 5
Source: Company Filings, Espirito Santo Investment Bank Research, Factset
FY14E FY15E FY16EHDFC Bank Valuation Metrics FY12A FY13A
Promoter
23%
FII
52%
DII
9%
Others
16%
Corporate,
42%
SME /
Business
Banking,
9%
Retail
Credit, 41%
Internation
al, 8%
1.66% 1.81% 1.90% 1.94% 2.04%
18.5%20.2%
21.2%22.5%
23.6%
0%
5%
10%
15%
20%
25%
FY12A FY13A FY14E FY15E FY16E
RoA RoE
Page 22 of 32
FOR IMPORTANT DISCLOSURE INFORMATION, INCLUDING DISCLOSURES RELATED TO THE U.S. DISTRIBUTOR OF THIS REPORT, PLEASE REFER TO THE FINAL PAGES OF THIS REPORT - Please refer to the final pages of this report for important disclosures, analyst certifications and additional information. Espirito Santo Investment Bank does and seeks to do business with companies covered in its research reports. As a result, investors should be aware that the firm may have a conflict of interest that could affect the objectivity of this report. Investors should consider this report as only a single factor in making their investment decision. This research report has been prepared in whole or in part by research analysts based outside the US who are not registered/qualified as research analysts with FINRA (v1.0.5.2)
MARKET UPDATE
India | Banks | 26-March-2014
Axis Bank
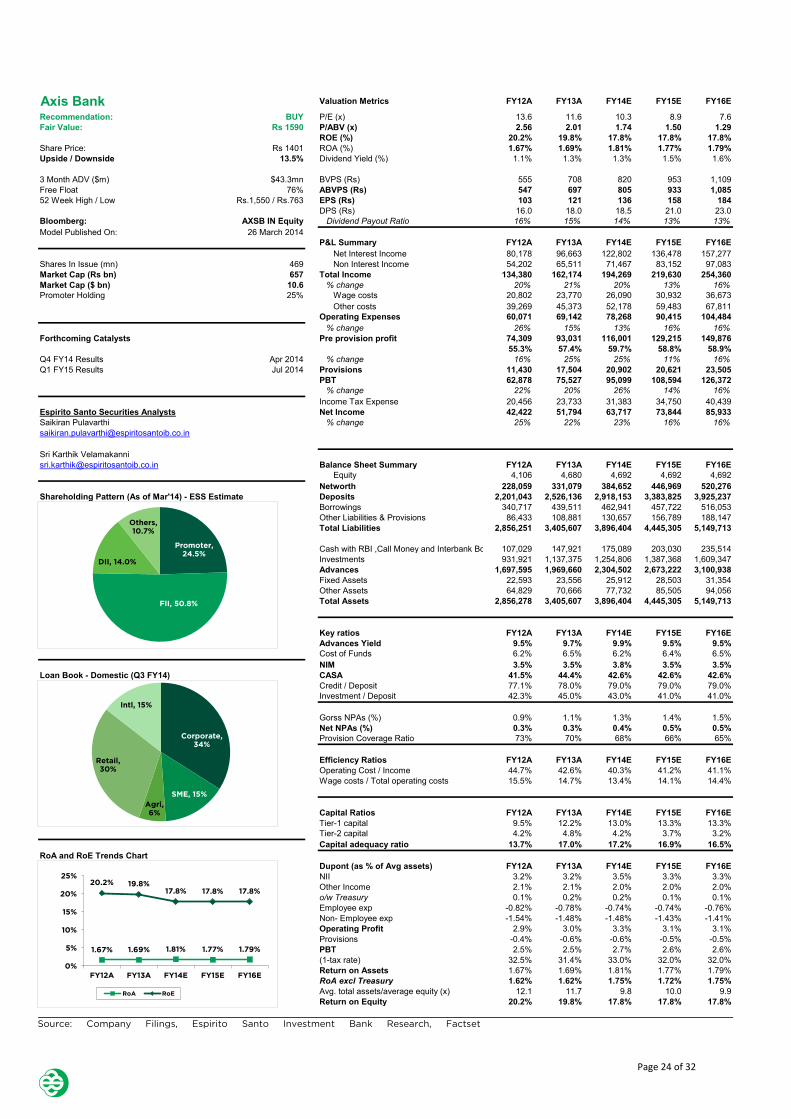
SME always been a core segment
MSME or Business banking has always been a core segment for Axis
Bank, which is evident from the higher proportion of SME loans in its
portfolio relative to ICICI Bank and HDFC Bank. The bank has always
focused on SME loans due to legacy reasons: the bank has a large
number of mid-level managers from the PSU background who have
a strong understanding of the SME business. Given this we continue
to prefer Axis over ICICI as our recovery play as Axis has enough
avenues to deliver growth despite the slowdown in corporate and
retail segment. At 1.5x FY15E P/B, Axis trades at a 25% discount to
its historical average multiple of 2.0x which gives us comfort on
valuation. We value Axis Bank at 1.7x FY15E P/B, which gives us a
fair value of Rs1,590, implying an upside of 13.5%. Reiterate BUY.
SME always been a core segment
Compared to both HDFC Bank and ICICI Bank, Axis has a higher the
proportion of SME loans in its portfolio. The bank has clocked an average
growth of c.25% for the last 5 quarters and the management remains
confident about delivering growth from this segment.
Operates in the higher ticket size segment
Axis relies on relationship banking to source its SME business where the ticket
sizes are relatively higher compared to the branch sourced business banking
loans. While this segment is under stress for the banking system Axis
continues to do well in terms of asset quality due to its better understanding
of the segment and the fact that majority of the portfolio (more than 80%) is
highly rated (SME 3 or above). Hence, management is confident of
maintaining the SME asset quality which is also visible from the stable ratings
profile of the SME portfolio. We do not factor higher asset quality pressures
from the SME portfolio in our estimates.
Table 1 SME ratings profile of Axis Bank's SME portfolio
FY10 FY11 FY12 FY13 Q3FY14
SME1 2% 5% 5% 6% 7%
SME2 13% 18% 18% 16% 16%
SME3 62% 59% 57% 58% 58%
SME4 13% 11% 12% 12% 12%
SME 5-8 10% 7% 9% 8% 7%
Source: Espirito Santo Investment Bank Research, Company Data
Top pick to play the recovery theme
We reiterate our preference for Axis Bank over ICICI Bank to play the recovery
theme as we believe Axis has enough growth levers to pull in an environment
where retail and corporate growth is difficult to come by. We expect SME and
business banking business to drive growth for private banks in the next 2-3
years and Axis in our view is well positioned to capture this opportunity. At
1.5x FY15E P/B Axis trades at a 25% discount to its historical average multiple
of 2.0x which gives us comfort on valuation. We value Axis at 1.7x FY15E P/B
giving us a fair value of Rs1,590; 13.5% upside. The change in fair value is due
to an increase in our target multiple from 1.4x to 1.7x due to (a) lower beta
from 1.1 to 1.0 & higher sustainable RoE from 17% to 18%. Reiterate BUY.
Accounting & corporate governance GREEN
Franchise Strength GREEN
Earnings Momentum GREEN
BUY 13% upside
Fair Value Rs1,590.00
Bloomberg ticker AXSB IN
Share Price Rs1,401.00
Market Capitalisation Rs657,335.00m
Free Float 76%
INR m Y/E 31-Mar 2013A 2014E 2015E 2016E
Total Income 162,174 194,269 219,630 254,360
Pre provision profit 93,031 116,001 129,215 149,876
Provisions 17,504 20,902 20,621 23,505
PBT 75,527 95,099 108,594 126,372
PAT 51,794 63,717 73,844 85,933
EPS (Rs) 121 136 158 184
DPS (Rs) 18.0 18.5 21.0 23.0
ABVPS (Rs) 697 805 933 1,085
Y/E 31-Mar 2013A 2014E 2015E 2016E
P/E (x) 11.6 10.3 8.9 7.6
P/ABV (x) 2.0 1.7 1.5 1.3
ROE (%) 19.8% 17.8% 17.8% 17.8%
ROA (%) 1.69% 1.81% 1.77% 1.79%
Dividend Yield (%) 1.3% 1.3% 1.5% 1.6%
Source: Espirito Santo Investment Bank Research, Company
Data, Bloomberg
40
60
80
100
120
Apr 2013
May 2013
Jun 2013
Jul 2013
Aug 2013
Sep 2013
Oct 2013
Nov 2013
Dec 2013
Jan 2014
Feb 2014
Mar 2014
AXSB IN vs BSE500 Index
Share Price Performance
Analysts Saikiran Pulavarthi +91 22 4315 6824 [email protected] Espirito Santo Securities India Private Limited Sri Karthik Velamakanni +91 22 4315 6826 [email protected] Espirito Santo Securities India Private Limited
Page 23 of 32
Page 2 of 5
Source: Company Filings, Espirito Santo Investment Bank Research, Factset
Avg. total assets/average equity (x) 12.1 11.7 9.8 10.0 9.9
Return on Equity 20.2% 19.8% 17.8% 17.8% 17.8%
FY16EFY15EFY14EAxis Bank Valuation Metrics FY12A FY13A
Promoter,
24.5%
FII, 50.8%
DII, 14.0%
Others,
10.7%
Corporate,
34%
SME, 15%
Agri,
6%
Retail,
30%
Intl, 15%
1.67% 1.69% 1.81% 1.77% 1.79%
20.2% 19.8%17.8% 17.8% 17.8%
0%
5%
10%
15%
20%
25%
FY12A FY13A FY14E FY15E FY16E
RoA RoE
Page 24 of 32
FOR IMPORTANT DISCLOSURE INFORMATION, INCLUDING DISCLOSURES RELATED TO THE U.S. DISTRIBUTOR OF THIS REPORT, PLEASE REFER TO THE FINAL PAGES OF THIS REPORT - Please refer to the final pages of this report for important disclosures, analyst certifications and additional information. Espirito Santo Investment Bank does and seeks to do business with companies covered in its research reports. As a result, investors should be aware that the firm may have a conflict of interest that could affect the objectivity of this report. Investors should consider this report as only a single factor in making their investment decision. This research report has been prepared in whole or in part by research analysts based outside the US who are not registered/qualified as research analysts with FINRA (v1.0.5.2)
MARKET UPDATE
India | Banks | 26-March-2014
Yes Bank
Capital is the key; risks look priced in
We have been sellers on Yes Bank due to concerns on: a) high
dependence on wholesale liabilities; b) higher asset quality
challenges due to macro-economic conditions. We continue to
believe that re-rating for Yes bank is highly contingent on the
successful execution of its retail strategy together with a sustained
macro-economic recovery. During the past 6 months both these
concerns played out with the stock de-rating to 1.5x (1 year forward
P/B) 37% below its average P/B multiple of 2.4x. Based on two state
Gordon growth model we arrive at a target multiple of 1.5x (12%
discount to our target multiple for Axis) which implies a fair value of
Rs360, down from Rs386. Owing to the limited downside to our
revised FV, we upgrade our stance from Sell to NEUTRAL.
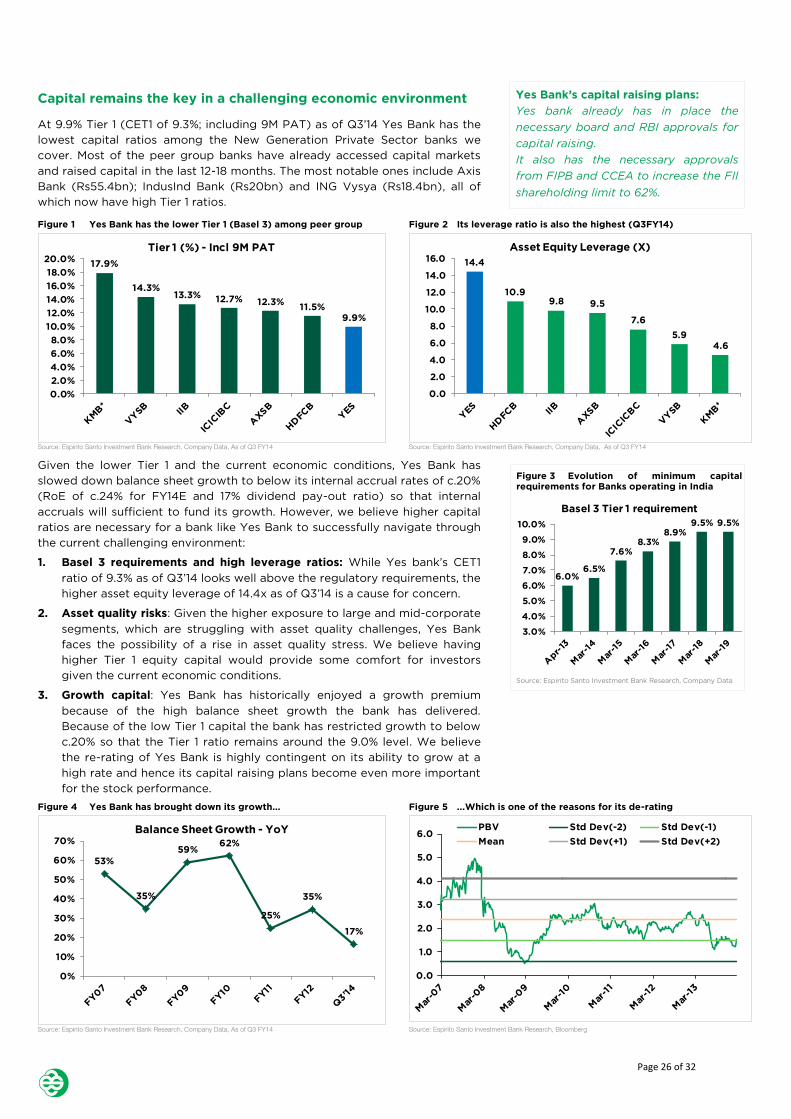
Capital: Remains key in a challenging economic environment
At 9.9% Tier 1 (CET1 of 9.3%; including 9M PAT) as of Q3’14 Yes Bank has the
lowest capital ratios among the New Generation Private Sector banks we
cover. The bank has slowed down its advances growth to 17% as of Q3’14 and
hence internal accruals (RoEs at 24% for FY14E) should be sufficient to fund
growth. However, in a challenging macro-economic environment and with
increasing Basel III requirements we believe Yes Bank needs to bring down its
leverage ratios through dilution. We believe capital raising would be a key
positive catalyst for the bank.
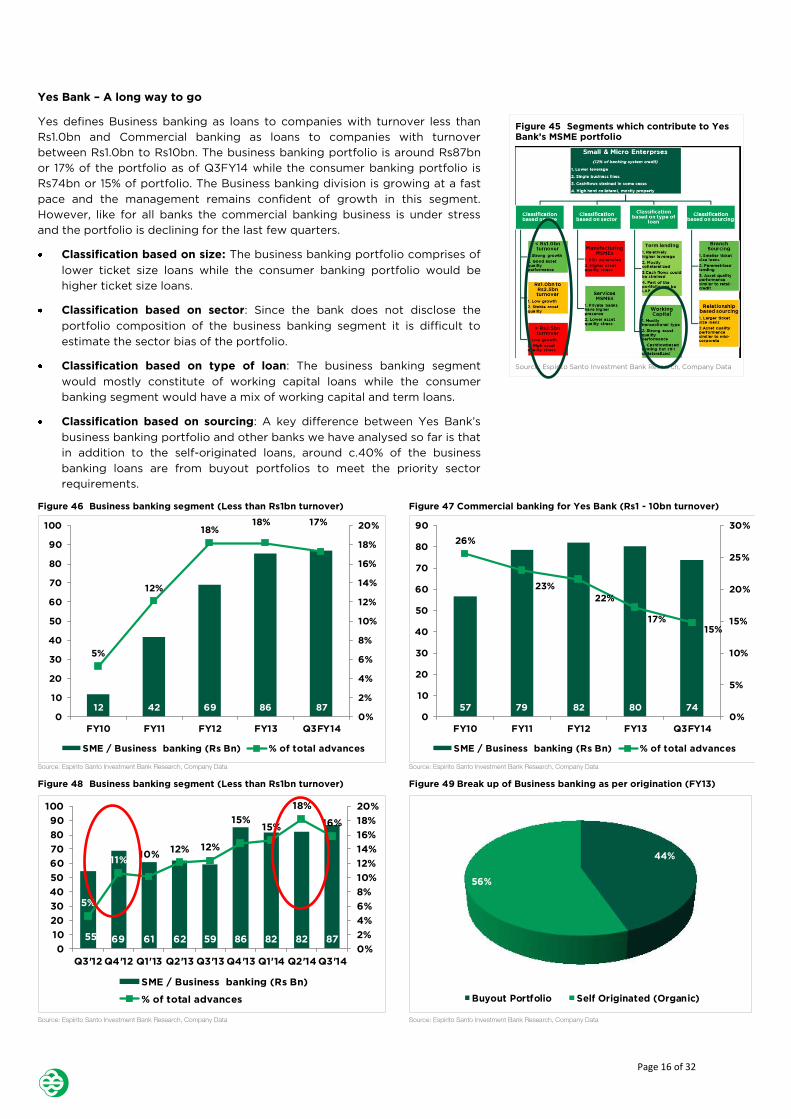
SME: A long way to go
The Business banking division is growing at a fast pace and management says
it remains confident of growth in this segment. However, like for all banks the
commercial banking business is under stress and the portfolio has been
declining for the last few quarters. However, around ~40% of Yes Bank’s
business banking portfolio is from buyout portfolios to meet priority sector
requirements and hence cannot be considered as organic growth.
Granularity of liabilities: Improving but can this be profitable?
We believe Yes Bank’s strategy of targeting HNIs (High Network Individuals)
as its target liabilities customers bodes well in the longer term and offers a
cross-selling opportunity to make the liabilities franchise profitable on a
standalone basis. However, executing this strategy is a drawn-out process and
the bank is yet to prove the scalability of this segment.
Re-rating unlikely but valuations comfortable – Upgrade to Neutral
Yes Bank is trying to do all the right things to re-adjust its balance sheet – (a)
building a retail liabilities franchise; (b) diversifying the loan book by reducing
dependence on the Corporate loan book. However, in our view this re-
adjustment will take time (refer to our retail liabilities note) and higher capital
is key in a challenging macro environment.
We believe that a re-rating for Yes Bank is highly contingent on the successful
execution of its retail strategy together with a sustained macro-economic
recovery. However, the stock has de-rated in the past 6 months and is
currently trading at 1.5x FY15E P/B (1 year forward P/B), which is a sharp 37%
discount to its average multiple which in our view will be the new normal. We
assign at a target multiple of 1.5x (20% discount to our target multiple for Axis
Bank) which implies a fair value of Rs360, 5% downside. We upgrade our
stance from Sell to Neutral. We reduce our FY15E PAT estimate by 6% due to:
(a) Lower margins, (b) lower growth and (c) we have not factored in capital
raising; leading to change in earnings momentum to AMBER.
Accounting & corporate governance GREEN
Franchise Strength AMBER
Earnings Momentum AMBER
NEUTRAL 5% downside
Fair Value Rs360.00
Bloomberg ticker YES IN
Share Price Rs379.00
Market Capitalisation Rs135,918.00m
Free Float 74%
INR m Y/E 31-Mar 2013A 2014E 2015E 2016E
Total Income 34,762 43,668 52,583 61,820
Pre provision profit 21,417 26,635 30,912 34,234
Provisions 2,160 3,352 3,815 3,157
PBT 19,257 23,282 27,097 31,076
PAT 13,006 16,065 18,697 21,443
EPS (Rs) 36.5 44.8 52.1 59.8
DPS (Rs) 6.0 7.5 9.0 10.5
ABVPS (Rs) 161.8 196.5 239.4 289.9
Y/E 31-Mar 2013A 2014E 2015E 2016E
P/E (x) 10.4 8.5 7.3 6.3
P/ABV (x) 2.3 1.9 1.6 1.3
ROE (%) 24.5% 24.4% 23.6% 22.4%
ROA (%) 1.56% 1.57% 1.55% 1.52%
Dividend Yield (%) 1.58% 1.98% 2.37% 2.77%
Source: Espirito Santo Investment Bank Research, Company
Data, Bloomberg
40
60
80
100
120
140
Apr 2013
May 2013
Jun 2013
Jul 2013
Aug 2013
Sep 2013
Oct 2013
Nov 2013
Dec 2013
Jan 2014
Feb 2014
Mar 2014
YES IN vs BSE500 Index
Share Price Performance
Analysts Saikiran Pulavarthi +91 22 4315 6824 [email protected] Espirito Santo Securities India Private Limited Sri Karthik Velamakanni +91 22 4315 6826 [email protected] Espirito Santo Securities India Private Limited
Source: Espirito Santo Investment Bank Research, Company Data
6.0%6.5%
7.6%8.3%
8.9%9.5% 9.5%
3.0%
4.0%
5.0%
6.0%
7.0%
8.0%
9.0%
10.0%
Basel 3 Tier 1 requirement
Capital remains the key in a challenging economic environment
At 9.9% Tier 1 (CET1 of 9.3%; including 9M PAT) as of Q3’14 Yes Bank has the
lowest capital ratios among the New Generation Private Sector banks we
cover. Most of the peer group banks have already accessed capital markets
and raised capital in the last 12-18 months. The most notable ones include Axis
Bank (Rs55.4bn); IndusInd Bank (Rs20bn) and ING Vysya (Rs18.4bn), all of
which now have high Tier 1 ratios.
Figure 1 Yes Bank has the lower Tier 1 (Basel 3) among peer group Figure 2 Its leverage ratio is also the highest (Q3FY14)
Source: Espirito Santo Investment Bank Research, Company Data, As of Q3 FY14 Source: Espirito Santo Investment Bank Research, Company Data, As of Q3 FY14
Given the lower Tier 1 and the current economic conditions, Yes Bank has
slowed down balance sheet growth to below its internal accrual rates of c.20%
(RoE of c.24% for FY14E and 17% dividend pay-out ratio) so that internal
accruals will sufficient to fund its growth. However, we believe higher capital
ratios are necessary for a bank like Yes Bank to successfully navigate through
the current challenging environment:
1. Basel 3 requirements and high leverage ratios: While Yes bank’s CET1
ratio of 9.3% as of Q3’14 looks well above the regulatory requirements, the
higher asset equity leverage of 14.4x as of Q3’14 is a cause for concern.
2. Asset quality risks: Given the higher exposure to large and mid-corporate
segments, which are struggling with asset quality challenges, Yes Bank
faces the possibility of a rise in asset quality stress. We believe having
higher Tier 1 equity capital would provide some comfort for investors
given the current economic conditions.
3. Growth capital: Yes Bank has historically enjoyed a growth premium
because of the high balance sheet growth the bank has delivered.
Because of the low Tier 1 capital the bank has restricted growth to below
c.20% so that the Tier 1 ratio remains around the 9.0% level. We believe
the re-rating of Yes Bank is highly contingent on its ability to grow at a
high rate and hence its capital raising plans become even more important
for the stock performance.
Figure 4 Yes Bank has brought down its growth... Figure 5 ...Which is one of the reasons for its de-rating
Source: Espirito Santo Investment Bank Research, Company Data, As of Q3 FY14 Source: Espirito Santo Investment Bank Research, Bloomberg
17.9%
14.3%13.3% 12.7% 12.3%
11.5%
9.9%
0.0%
2.0%
4.0%
6.0%
8.0%
10.0%
12.0%
14.0%
16.0%
18.0%
20.0%
Tier 1 (%) - Incl 9M PAT
14.4
10.99.8 9.5
7.6
5.9
4.6
0.0
2.0
4.0
6.0
8.0
10.0
12.0
14.0
16.0
Asset Equity Leverage (X)
53%
35%
59%62%
25%
35%
17%
0%
10%
20%
30%
40%
50%
60%
70%
Balance Sheet Growth - YoY
0.0
1.0
2.0
3.0
4.0
5.0
6.0PBV Std Dev(-2) Std Dev(-1)
Mean Std Dev(+1) Std Dev(+2)
Page 26 of 32
Page 3 of 7
According to Yes Bank’s management,
the bank can afford to offer higher SA
rates until the proportion of SA
deposits reaches around 25-30% of
deposits post which management
would think about reducing savings
deposits rates.
Granularity of liabilities: Improving but can this be profitable?
Since the deregulation of saving deposit rate during Oct’11 (Q3’12) Yes Bank
has managed to more than triple its savings deposits, increasing the SA ratio
(% of SA in total deposits) from a mere 5% to nearly 11% as of Q3’14. During
this period, Yes Bank’s outstanding debit cards (which we use as a proxy for
the number of accounts) have increased nearly 3x, taking the number of debit
cards outstanding to more than 0.5m. There was a sharp jump in the average
SA balance per debit card from Rs51,000 as of Q2’12 to Rs142,000 as of Q3’14.
Figure 6 Yes has seen a significant improvement in the SA ratio Figure 7 Yes has seen consistent additions to no. of debit cards
Source: Espirito Santo Investment Bank Research, Company Data, As of Q3 FY14 Source: Espirito Santo Investment Bank Research, Company Data
However, a distinct feature of Yes’s SA story has been the higher average
balances; significantly higher than the other peer group banks IndusInd (IIB)
and Kotak Mahindra (KMB). This is clearly visible from the higher average SA
balance per debit card for Yes compared to IIB and KMB.
Figure 8 Yes has the highest avg SA balance,
As of Nov'13
Figure 9 Still behind peer banks in no. of
debit cards, as of Nov'13
Figure 10 In absolute terms, SA deposit match
peers, As of Q3'14
Source: Espirito Santo Investment Bank Research, Bloomberg Source: Espirito Santo Investment Bank Research, Bloomberg Source: Espirito Santo Investment Bank Research, Bloomberg
Our interactions with management suggest that this is in line with Yes’s overall
liabilities strategy of targeting High Net Worth Individuals (HNIs) as their
target liabilities customer base. This decision was taken keeping in mind the
future profitability and cross-selling potential of the target customer base.
Can Yes bank extract value from the customer base?
However, Yes Bank does not look to be able to continue to offer higher SA
rates even in an environment when term deposit rates come down (some time
in the future). We believe it is necessary for Yes Bank to make the liabilities
customer franchise profitable on a standalone basis and we believe making
this franchise profitable is highly contingent on the bank’s ability to cross-sell
other products to customers. This is where we agree with management’s
strategy to acquire HNI customers where the cross sell potential is relatively
higher. Yes Bank has made all the necessary investments in terms of people,
processes, products and technology in order to improve the cross sell to its
liabilities customers which is visible in the uptick in the number of debit
transactions by its customers. The improvement in cross sell is also seen from
the pickup in 3rd
party distribution fees (proxy for cross sell) which is growing.
825 30 39 49 60 65 70 76
2%
5%6%
7%
9% 9%
10% 10%11%
0%
2%
4%
6%
8%
10%
12%
0
10
20
30
40
50
60
70
80
90
Savings Deposits SA Ratio
174147 163
186
253296
349392
417458
505537
0
100
200
300
400
500
600
No of Debit Cards ('000)
142
63
85
0
20
40
60
80
100
120
140
160
Yes IIB Kotak
Avg SA balance (Rs '000)
537
1,463
1,069
0
200
400
600
800
1,000
1,200
1,400
1,600
Yes IIB Kotak
Number of Debit Cards ('000)
76
93 91
0
10
20
30
40
50
60
70
80
90
100
Yes IIB Kotak
SA Deposits (Rs Mn)
Page 27 of 32
Page 4 of 7
Source: Espirito Santo Investment Bank Research, Reuters, Bloomberg, Company Data
This report was prepared by Espírito Santo Investment Bank Research, a global brand name for the equity research teams of Banco Espírito Santo de Investimento, S.A., with headquarters in Lisbon, Portugal, of its Branches in Spain and Poland and of its affiliates BES Securities do Brasil, S.A – Corretora de Câmbio e Valores Mobiliários, in Brazil, Execution Noble Limited, in the United Kingdom, and Espirito Santo Securities India Private Limited, in India, all authorized to engage in securities activities according to each domestic legislation. All of these entities are included within the perimeter of the Financial Group controlled by Espírito Santo Financial Group S.A. (“Banco Espírito Santo Group”).
Analyst Certification
Each research analyst primarily responsible for the content of this research report, in whole or in part, certifies that with respect to each security or issuer that the analyst covered in this report: (1) all of the views expressed accurately reflect his or her personal views about those securities or issuers; the issuers were not previously informed about the content of the recommendation included in this research report and the assumptions were not validated by the issuers; (2) no part of his or her compensation is directly or indirectly related to: (a) the specific recommendations or views expressed by that research analyst in the research report; and/or (b) any services provided or to be provided by Banco Espírito Santo de Investimento, S.A. and/or by any of its affiliates to the issuer of the securities under recommendation. Moreover, each of the analysts hereby certifies that he or she has no economic or financial interest whatsoever in the companies subject to his or her opinion and does not own or trade any securities issued by the latter.
Ratings Distribution
Espirito Santo Investment Bank Research hereby provides the distribution of the equity research ratings in relation to the total Issuers covered and to the investment banking clients as of end of December 2013.
Explanation of Rating System Ratings Distribution
12-MONTH RATING DEFINITION
BUY Analyst expects at least 10% upside potential to fair value, which should be realized in the next 12 months
NEUTRAL Analyst expects upside/downside potential of between +10% and -10% to fair value, which should be realized in the next 12 months
SELL Analyst expects at least 10% downside potential to fair value, which should be realized in the next 12 months
As at end December 2013 Total ESIB Research
Total Investment Banking Clients (IBC)
Recommendation Count % of Total Count % of IBC % of Total
12 Month Rating:
Buy 204 47.9% 26 72.2% 6.1%
Neutral 127 29.8% 7 19.4% 1.6%
Sell 92 21.6% 1 2.8% 0.2%
Restricted 2 0.5% 2 5.6% 0.5%
Under Review 1 0.2% 0 0.0% 0.0%
TRADING RATING DEFINITION
TRADING BUY Analyst expects a positive short-term movement in the share price (max duration 2 months from the time Trading Buy is announced) and may move out of line with the fair value estimate during that period
TRADING SELL Analyst expects a negative short-term movement in the share price (max duration 2 months from time Trading Sell is announced) and may move out of line with the fair value estimate during that period
Trading Rating:
Trading Buy 0 0.0% 0 0.0% 0.0%
Trading Sell 0 0.0% 0 0.0% 0.0%
Total recommendations 426 100% 36 100% 8.5%
For further information on Rating System please see “Definitions and distribution of ratings” on: http://www.espiritosantoib-research.com.
Share Prices
Share prices are as at the close of business on the day preceding publication, unless otherwise specified.
Coverage Policy
Espírito Santo Investment Bank Research reserves the right to choose the securities it expresses opinions on. The main criteria to choose such securities are: 1) markets in which they trade 2) market capitalisation 3) liquidity, 4) sector suitability. Espírito Santo Investment Bank Research has no specific policy regarding the frequency in which opinions and investment recommendations are released.
Representation to Investors
Espírito Santo Investment Bank Research has issued this report for information purposes only. This material constitutes "investment research" for the purposes of the Markets in Financial Instruments Directive and as such contains an objective or independent explanation of the matters contained in the material.
Any recommendations contained in this document must not be relied upon as investment advice based on the recipient's personal circumstances. This report is not, and should not be construed as an offer or a solicitation to buy or sell any securities or related financial instruments. The investment discussed or recommended in this report may be unsuitable for investors depending on their specific investment objectives and financial position. The material in this research report is general information intended for recipients who understand the risks associated with investment. It does not take account of whether an investment, course of action, or associated risks are suitable for the recipient. This research report does not purport to be comprehensive or to contain all the information on which a prospective investor may need in order to make an investment decision and the recipient of this report must make its own independent assessment and decisions regarding any securities or financial instruments mentioned herein. In the event that further clarification is required on the words or phrases used in this material, the recipient is strongly recommended to seek independent legal or financial advice. Where an investment is denominated in a currency other than the investor’s currency, changes in rates of exchange may have an adverse effect on the value, price of, or income derived from the investment. Past performance is not necessarily a guide to future performance. Income from investments may fluctuate. The price or value of the investments to which this report relates, either directly or indirectly, may fall or rise against the interest of investors. Any recommendation and opinion contained in this report may become outdated as a consequence of changes in the environment in which the issuer of the securities under analysis operates, in addition to changes in the estimates and forecasts, assumptions and valuation methodology used herein. The securities mentioned in this publication may not be eligible for sale in some states or countries.
All the information contained herein is based upon information available to the public and has been obtained from sources believed to be reliable. However, Espírito Santo Investment Bank Research does not guarantee the accuracy or completeness of the information contained in this report. The opinions expressed herein are Espírito Santo Investment Bank Research present opinions only, and are subject to change without prior notice. Espírito Santo Investment Bank Research is not under any obligation to update or keep current the information and the opinions expressed herein nor to provide the recipient with access to any additional information.
Espírito Santo Investment Bank Research has not entered into any agreement with the issuer relating to production of this report. Espírito Santo Investment Bank Research does not accept any form of liability for losses or damages which may arise from the use of this report or its contents.
Ownership and Material Conflicts of Interest
Banco Espírito Santo de Investimento, S.A. and/or its Affiliates (including all entities within Espírito Santo Investment Bank Research) and/or their directors, officers and employees, may have, or have had, interests or qualified holdings on issuers mentioned in this report. Banco Espírito Santo de Investimento, S.A. and/or its Affiliates may have, or have had, business relationships with the companies mentioned in this report. However, the research analysts may not purchase or sell securities or have any interest whatsoever in companies subject to their opinion.
Banco Espírito Santo Group has a qualified shareholding (1% or more) in Providência. Bradesco has an indirect qualified shareholding (4.8%) in Banco Espírito Santo, S.A. and a direct qualified shareholding (20%) in BES Investimento do Brasil, S.A., the parent company of BES Securities do Brasil S.A. CCVM.
Pursuant to Polish Ministry of Finance regulations, we inform that Banco Espírito Santo Group companies and/or Banco Espírito Santo de Investimento, S.A. Branch in Poland do not have a qualified shareholding in the Polish Securities Issuers mentioned in this report higher than 5% of its total share capital.
The Chief Executive Officer of Banco Espírito Santo de Investimento, S.A., Mr. José Maria Ricciardi, is a member of EDP’s General and Supervisory Board. Mr. Rafael Valverde, a member of the board of Banco Espírito Santo de Investimento, S.A., is a non-executive board member of EDP Renováveis. Mr. Ricardo Abecassis Espírito Santo Silva, a member of the board of Banco Espírito Santo de Investimento, S.A., is a board member of Brazil Hospitality Group.
Banco Espírito Santo de Investimento, S.A and/or its subsidiaries are liquidity providers or market makers for Altri, Usiminas and Vale.
Banco Espírito Santo de Investimento, S.A. and/or its subsidiaries participate or have participated as a syndicate member in share offerings of Brazil Hospitality Group, Capital Park, CTT, Iguatemi, Just Retirement, Klabin, Mota-Engil, Sports Direct and Zon Optimus in the last 12 months.
Banco Espírito Santo de Investimento, S.A. and/or its subsidiaries participate or have participated as a syndicate member in the bond issues of the following companies: Abengoa, Altri, EDP, Galp Energia, Globe Trade Centre, Kredyt Inkaso, Mota-Engil and Sonae in the last 12 months.
Banco Espírito Santo de Investimento, S.A. and/or its subsidiaries provided investment banking services to the following companies: 4imprint, Abengoa, Altri, Brazil Hospitality Group, Burford Capital, Capital Park, Casino Guichard, EDP, EDP Renovaveis, Ence, Galp Energia, Globe Trade Centre, Godrej Consumer Products, Iguatemi, IQE, Just Retirement, Kcom Group, Klabin, Kredyt Inkaso, Kruk, Laird, Mota-Engil, Novae Group Plc, REN, Rovi, Semapa, Sonae, Sports Direct, SVG Capital, Ted Baker, Xchanging and Zon Optimus in the last 12 months.
Banco Espírito Santo Group has been a partner to Mota-Engil in the infrastructure business in Portugal and other countries. Mota-Engil and Banco Espírito Santo Group, through ES Concessões, S.G.P.S., S.A., have created a joint holding company – Ascendi – for all stakes in transportation infrastructure concessions, in Portugal and abroad. Banco Espírito Santo de Investimento, S.A. provided, or continues to provide, investment banking services to Ascendi.
Banco Espírito Santo de Investimento, S.A. and/or its subsidiaries do and seek to provide investment banking or other services to the companies referred to in this research report. As a result, investors should be aware that a conflict of interest may exist.
Market Making UK
Execution Noble Limited is a Market Maker in companies covered and may sell to or buy from customers as principal in certain financial instruments listed or admitted to listing on the London Stock Exchange. For information on Companies to which Execution Noble Limited is a Market Maker please see “Execution Noble Limited UK Market Making” on http://www.espiritosantoib-research.com.
Confidentiality
This report cannot be reproduced, in whole or in part, in any form or by any means, without Espírito Santo Investment Bank Research’s specific written authorization. This report is confidential and is intended solely for the designated addressee. Therefore any disclosure, replication, distribution or any action taken in reliance on it, is prohibited and unlawful. Receipt and/or review of this research report constitutes your agreement not to redistribute, retransmit, or disclose to others the contents, opinions, conclusion, or information contained in this report (including any investment recommendations, estimates or price targets without first obtaining express permission from an authorized officer of Banco Espírito Santo de Investimento, S.A.
Regulatory Authorities
For information on the identity of the Regulatory Authorities that supervise the entities included within Espírito Santo Investment Bank Research please see http://www.espiritosantoib-research.com.
IMPORTANT DISCLOSURES FOR U.S. PERSONS
This report was prepared by Espírito Santo Investment Bank Research, a global brand name for the equity research teams of Banco Espírito Santo de Investimento, S.A., with headquarters in Lisbon, Portugal, of its Branches in Spain and Poland and of its affiliates BES Securities do Brasil, S.A – Corretora de Câmbio e Valores Mobiliários, in Brazil, Execution Noble Limited, in the United Kingdom, and Espirito Santo Securities India Private Limited, in India, all authorized to engage in securities activities according to each domestic legislation. Neither Banco Espírito Santo de Investimento, S.A. nor these affiliates are registered as a broker-dealer in the United States and therefore, is not subject to U.S. rules regarding the preparation of research reports and the independence of research analysts. This report is provided for distribution to U.S. institutional investors in reliance upon the exemption from registration provided by Rule 15a-6 of the U.S. Securities Exchange Act of 1934, as amended.
This report is confidential and not intended for distribution to, or use by, persons other than the addressee and its employees, agents and advisors.
E.S. Financial Services, Inc. is the U.S. distributor of this report. E.S. Financial Services, Inc. accepts responsibility for the contents of this report, subject to the terms set out below, to the extent that it is delivered to a U.S. person other than a major U.S. institutional investor. Any U.S. person receiving this report and wishing to effect securities transactions in any security discussed in the report should do so only through E.S. Financial Services, Inc.
Contact Information
Garreth Hodgson Senior Managing Director / Head of Sales (212) 351-6054 [email protected]
E.S. Financial Services, Inc. New York Branch 340 Madison Avenue, 12th Floor New York, N.Y. 10173
Each analyst whose name appears in this report certifies the following, with respect to each security or issuer that the analyst covers in this report: (1) that all of the views expressed in this report accurately reflect the personal views of the analyst about those securities and issuers; and (2) that no part of the compensation of the analyst was, is, or will be, directly or indirectly, related to the specific recommendations or views expressed by the analyst in this report.
The analysts whose names appear in this report are not registered or qualified as research analysts with the Financial Industry Regulatory Authority ("FINRA") and may not be associated persons of E.S. Financial Services, Inc. and therefore may not be subject to the applicable restrictions under FINRA Rules on communications with a subject company, public appearances and trading securities held by a research analyst account.
Ownership and Material Conflicts of Interest
Banco Espírito Santo de Investimento, S.A. and/or its Affiliates and/or their directors, officers and employees, may have, or have had, interests or qualified holdings on issuers mentioned in this report. Banco Espírito Santo de Investimento, S.A. and/or its Affiliates may have, or have had, business relationships with the companies mentioned in this report.
For a complete list of the covered Issuers in which Banco Espírito Santo de Investimento, S.A. or its Affiliates hold stakes in excess of 1% and for information on possible material conflicts of interest arising from investment banking activities please see “Important disclosures for US persons” on http://www.espiritosantoib-research.com.
Receipt of Compensation
For information on Receipt of Compensation from subject Issuers please see “Important disclosures for US persons” on http://www.espiritosantoib-research.com.
Representation to Investors
Espírito Santo Investment Bank Research has issued this report for information purposes only. All the information contained therein is based upon information available to the public and has been obtained from sources believed to be reliable. However, Espírito Santo Investment Bank Research does not guarantee the accuracy or completeness of the information contained in this report. The opinions expressed herein are our present opinions only, and are subject to change without prior notice. Espírito Santo Investment Bank Research is not under any obligation to update or keep current the information and the opinions expressed herein. This report is not, and should not be construed as an offer or a solicitation to buy or sell any securities or related financial instruments. The investment discussed or recommended in this report may be unsuitable for investors depending on their specific investment objectives and financial position. Where an investment is denominated in a currency other than the investor’s currency, changes in rates of exchange may have an adverse effect on the value, price of, or income derived from the investment. Past performance is not necessarily a guide to future performance. Income from investments may fluctuate. The price or value of the investments to which this report relates, either directly or indirectly, may fall or rise against the interest of investors. Any recommendation and opinion contained in this report may become outdated as a consequence of changes in the environment in which the issuer of the securities under analysis operates, in addition to changes in the estimates and forecasts, assumptions and valuation methodology used herein. The securities mentioned in this publication may not be eligible for sale in some states or countries. Espírito Santo Investment Bank Research does not accept any form of liability for losses or damages which may arise from the use of this report. Please note that investing in any non-U.S. securities or related financial instruments discussed in this research report may present certain risks. The securities of non-U.S. issuers may not be registered with the U.S. Securities and Exchange Commission or subject to regulation in the United States. Information on such non-U.S. securities or related financial instruments may be limited. Foreign companies may not be subject to audit and reporting standards and regulatory requirements comparable to those in the United States.