203
• • •
| Date post: | 02-May-2017 |
| Category: |
Documents |
| Upload: | h-man-sharif |
| View: | 212 times |
| Download: | 0 times |

Durham E-Theses
E�ciency evaluation and improvement guidelines forcommunity colleges of Connecticut:: a data
envelopment analysis (DEA) approach
Mills, Joseph J.
How to cite:
Mills, Joseph J. (2004) E�ciency evaluation and improvement guidelines for community colleges ofConnecticut:: a data envelopment analysis (DEA) approach, Durham theses, Durham University. Availableat Durham E-Theses Online: http://etheses.dur.ac.uk/3122/
Use policy
The full-text may be used and/or reproduced, and given to third parties in any format or medium, without prior permission orcharge, for personal research or study, educational, or not-for-pro�t purposes provided that:
• a full bibliographic reference is made to the original source
• a link is made to the metadata record in Durham E-Theses
• the full-text is not changed in any way
The full-text must not be sold in any format or medium without the formal permission of the copyright holders.
Please consult the full Durham E-Theses policy for further details.

Academic Support O�ce, Durham University, University O�ce, Old Elvet, Durham DH1 3HPe-mail: [email protected] Tel: +44 0191 334 6107
http://etheses.dur.ac.uk
2
Abstract Title: Efficiency Evaluation and Improvement Guidelines for
Community Colleges of Connecticut: A Data Envelopment Analysis (DEA) Approach.
Joseph Mills, BSc., MSc.
(_Dissertation submitted for the degree of Doctor of Education (EDD) to the
School ofEducation at University of Durham
Study directed by: Dr. Robert Coe and Prof. Peter Tymms
Tertiary education at Connecticut's Community Colleges, in the United States, is facing a
public outcry for a higher level of accountability for the resources appropriated to higher
education. This study utilized Data Envelopment Analysis (DEA) to determine the
technical efficiency of and provide Improvement guidelines to these twelve Community
Colleges.
Three research questions were used to direct this study:
Question # 1 : How do institutions of the Community College System of Connecticut
compare to each other regarding their levels of Efficiency?
Question #2: What conditions may account for the differences in the level of success
within similarly efficient colleges?
Question #3: What factors or constraints create the varying score among the inefficient
colleges?
Data for eleven variables, seven inputs and four output, were collected on each of the
twelve Community Colleges, but due to the high level of correlation that existed between
the variables only three inputs and four outputs were used to characterize each college in
the model.
The analysis indicated that seven colleges were being run efficiently and five had
less than l 00% et1iciency. However, the small numbers of colleges in the study
handicapped the DEA procedure, since the number of colleges could not be changed the
number of variables was decreased. This resulted in a decrease in the efficient units.
The study concluded that DEA was, in principle, well suited for the performance
assessment of the colleges. However, the validity of the model is compromised if only a
small number of colleges can be entered into the analysis; either a very small number of
variables can be considered (which violates one's conception of the ways colleges are to

be judged, and the numberof independent variables that can be considered), or the
requirements of the model are violated (which necessarily produces the result that a large
number of colleges are spuriously designated as 100% efficient)
May 2004
A copyright of this thesis rests with the author. No quotation from it should be published without his prior written consent and information derived from it should be acknowledged.
TITLE
Efficiency Evaluation and Improvement Guidelines for Community Colleges of Connecticut: A Data Envelopment Analysis (DEA) Approach

Tab ne of Contents
a. Abstract b. Title c List of Figures
Chapter 1: introduction Scope of the study
Background
1.1 Concept ofthe Community Colleges in the United States 1.2 Introduction to the Community College Sy~em of
Connecticut 1.3 Purpose of the study 1.4 Significance of the study 1.5 Delimitation ofthe study
Chapter 2: Review of Related Research
2.1 Research Questions 2.2 Measures ofEfficiency:
Ratio Regression Analysis Data Envelopment Analysis
2.3 Review of past DEA studies
Chapter 3: Design of the Study
3.1 Methodology ofDEA 3.2 Mathematical Formulation ofthe DEA 3.3 College Accreditation ..... leveling the playing field 3.4 Input- Output Studies 3.5 Outputs to the study 3.6 Inputs to the study 3. 7 Non-categorical Variables 3.8 Relationship of study results to study questions
4
5
Chapter 4: Anuniysis of Data
4.1 Description ofDEA (Frontier Analysis) Model 4.2 Analysis of Model Data 4.3 Analysis of Model Results 4.4 Efficient Reference Set 4.5 Analysis of individual Efficient and Inefficient colleges 4.6 Improving the efficiency rating of Inefficient colleges 4. 7 Sensitivity - Validation Analysis of the Model Results
Chapter 5: Summa:ry and Conclusion, 5.1 Summary 5.2 Conclusion 5.3 Policy recommendation and implications 5.4 Closing remarks
Glossmry: Meaning of terms
Reference

6
APPENDICES
A. How Data Envelopment Analysis (DEA) works
B. Input/output data sheet for the Community College System of Connecticut
C. Degrees and Cettificates awarded in 1999-2000 year in the Community College
system of Connecticut.
D. DEA model input data sheet.
E. I 00 top Associate Degree producers, 1999-2000.
F. BCC Model Run.

List of Tables
3.1 Output Variables used to characterize the Community Colleges of the System
3.2 Input Variables used to characterize the Community Colleges of the System.
4.1 XY Correlations between Input Variables
4.1.1 Comparison of Efficiency Sores with different number of variables
4.2 Efficient Colleges
4.3 Comparison of the Efficient Colleges
4.11 Comparison of in efficient units
4.12 Summary of Sensitivity Analysis
4.13 Efficiency Scores Sensitiv.ity (ESS) Analysis
4.14 ESS as per model variables
4.15 ESS as per variables values
4.16 Summary ofDEA Model Results
7
List of Figures
2.2 Pareto-Koopmans Plot
4.1 Production Frontier Line for CCR Model.
4.2 · Production frontier Lines for BCC Model
4.15 W orkforce Analysis
8

9
@ The copyright of this dissertation rests with the author. No quotation from it should be published without their prior written consent and information derived from it should be acknowledged.
Scope of the studly
Chapter 1 INTRODUCTION
10
One of the most significant problem areas for executive decision at institutions of higher
learning deals with the allocation of available resources. Resources such as space and
staff as well as budgeted funds all bear on the issue of achieving institutional goals.
Methods that were used to evaluate what was currently being achieved as well as how
resources might best be arranged, along with the attendant consequences, were needed for
this purpose. Such methods as were available from budgetary analyses and cost
accounting practices did not deal adequately with many aspects of the problem. These
aspects were the best utilization of fixed resources and the ability to deal with many
outputs and inputs variables of the education function, that interact in a variety of
unknown and unpredictable ways (Bessent, 1983).
The aim of this study was to perform an efficiency evaluation and provide
improvement guidelines for the twelve community colleges of Com1ecticut using a
Mathematical Linear Programming derived tool called Data Envelopment Analysis
(DEA) in a computer model. The DEA model has the ability to handle multiple inputs
and outputs of the operation of any given organization (without a prior knowledge of the
production function between the inputs and outputs), particularly the not-for-profit
institutions such as colleges and universities. And so, DEA is considered a superior tool
to the Ratio and Multiple Regression Analysis methods previously used to detem1ine a
measure of efficiency of these institutions (.Sexton, 1986)

11
The study aimed to answer the following research questions:
A) How do institutions ofthe Community College System of Connecticut
compare to each other regarding their levels of Efficiency? In other words,
based on the variables (inputs and outputs) selected to characterize the
community colleges, what is the mathematically determined efficiency of
each college.
B) What conditions may account for the differences in the level of success within
similarly efficient colleges? The differences amongst the efficient units were
determined by comparison of the weighting of the input and output variables
of these efficient units.
C) What factors or constraints created the varying scores among inefficient
colleges? This question was answered directly from the results of the
model. All the inefficient units were supplied with the specific
shortcomings of the input/output variables as guidelines to increase the
level of efficiency of each unit.
To determine the efficiency and the best practice guidelines of the operations of
the Community Colleges (Decision Making Units, DMU's as they are called in the
study) using DEA, the study develops a working knowledge ofthe nuances of the
operation of the System of Connecticut Community Colleges and DEA. Initially, the
study developed the theory and mission of the Junior Colleges (the first name given to the

Community College) in the United States, which was followed by a historical
development ofthe Community Colleges System of Connecticut.
12
The previous methods utilized to determine the efficiency of colleges, namely the
Ratio Method and the Multiple Regression Analysis Methods were discussed. Similarly,
the study showed the origin and mathematical development of DEA. In the Design of the
Study, the bulk of the knowledge acquired on the Community Colleges and the DEA
method were intertwined to detem1ine the best way to use DEA to make an efficiency
assessment on these institutions.
The model had a wide variety of input and output variables, for which data was
collected, to make the efficiency determination. However, because of the obviously high
level of correlation that existed between the variables of the operation of a community
college, only seven variables were extracted from the following list of:
a) Total number of student contact hours.
b) Total instructional area footage
c) Full Time Equivalent Instructors.
d) Total direct instructional expenditure
e) Physical Plant expenditures (Grounds, Building Maintenance and
Custodial Services)
f) Overhead expenditure for Administration and Academic Services
g) Student services Expenditure
h) Revenue (Tuition, Fees, Government Funding and Credit Free Programs)
i) Total number of Graduates
j) Employer and Admission Office Satisfaction Factor

k) Total credit awarding grades (A ... D .. P)
I) Percentage of credit awarding grades given.
Apart from the drawback of the correlating variables, the model had a second handicap
concerning the number of inputs and outputs used to analyze a given number of units.
The Linear Programming make up of the Model would not allow the product of the
number of inputs and outputs to be greater than the number of units (Colleges) in the
model since the Connecticut Community College System comprises of twelve colleges,
the maximum allowable total number of inputs and outputs was seven (Three input and
four outputs) .
Background
13
1.1 Concept of the Community College in the United States
Throughout much of the nineteenth century, the belief that the United States was a nation
blessed with unique opportunities for individual advancement was widespread among
Americans and Europeans alike, as evidenced by the massive influx of Western
Europeans; Italians, Irish and Portuguese into the United States for this period. The
cornerstone ofthis belief was the relatively wide distribution of property (generally
limited, to be sure, to adult white males) and apparently abundant opportunities in
commerce and agriculture to accumulate more. But with the rise of the mammoth
corporations and the conquest of the frontier in the decades after the Civil War, the fate of
the "self made man " -that heroic figure who, though of modest origins, and had
triumphed in the competitive marketplace through sheer skill and determination-

14
eventually was challenged by new technology and knowledge system. In particular, the
fundamental changes then occurring in American economy - the growth of huge industrial
enterprises, the concentration of property less workers in the nation's cities, and the
emergence of monopolies- made the image of the hardworking stock boy who rose to the
top seem more and more like a relic of a vanished era (Brint and Karabel, 1989).
Hence, to adhere to the American dream of individual advancement, which then
existed under dramatically, changed economic and social conditions of the nineteenth
century, new routes to success had to be formulated. Andrew Carnegie ( Wyllie, 1954 ), a
steel magnate and a very rich and influential person of that era, was convinced that with
the appearance of the giant corporations, it became more and more difficult for a young
man to rise from rags to riches. He( Carnegie) never bought into the concept of the
redistribution of wealth for the reconciliation of the rich and the poor. In concert with
other philanthropist of the times, Carnegie advanced the idea to the businessmen and the
population at large, that ordinary Common School training would provide the skills
necessary for economic development. As quoted by Wyllie (1954) in the Self-Made Man
in America, as much as 84 % of the prominent businessmen in 1900 had not been
educated beyond a high school level. Thus, getting ahead in America in the 1900s
depended highly on the skills in the marketplace than that in the classroom.
Higher Education during the early nineteenth century was in a very dismal state,
the loose array of students who attended high schools, colleges, universities and
professional schools beyond elementary schools did not comprise a system. There was no
sequential order of attending higher education as exists today. And so, many times the
professional schools competed with high schools for students and vice versa. Moreover,

15
the Common School education, which supposed to have been equipping the citizenry with
tools for economic success, was educating the students for life in a democratic society (
Brent and Karabel, 1989). Hence, the business sector became very disdainful of the
diplomas awarded from these institutions (Common Schools), they thought that this
training was hannful to young men and unfit for the rigors of the practical world of
commerce and industry. Still by 1920, despite the chaotic and relatively undifferentiated
state of the American education, outlines of a very orderly and stratified education system
were becoming very visible. The development of a hierarchically differentiated education
system appealing to the needs of the labor market provided a pathway to success in the
competitive market. This formation of the means of upward mobility through education
gave new life to the American ideology of equality of opportunity at the very moment
when fundamental changes in the economy threatened to destroy it. As quoted by Brint
and Karabel (1989), America's large and open educational system now provided an
alternative means of getting ahead. Vast in equalities of wealth, status and power, though
there might be, the ladders of opportunity created by new education system, helped the
United States retain its national identity as a land of unparalleled opportunities for
individual advancement. The concept of upward mobility through education, and more so,
higher education was thereinafter taken for granted. However, when compared to Japan,
Canada and even Sweden, statistics show that the United States sends more young people
to college and universities than these countries.
Fundamental to this system of American Higher Education was the two-year
junior college or the community college as it came to be called. This institution began at
the time the American Education system was being transformed to provide the upward
16
mobility, as mentioned in the previous section. In a nutshell, one can abbreviate the
mission of the two-year colleges by saying that these institutions provided the egalitarian
promise (equal access, etc.) ofthe world's first modem democracy and the constraints of
its dynamic capitalist economy. From an enrollment often thousand in 1920, the
community colleges have provided an education for as many as five million students irr
1990 and because of their overwhelming success, the two-year colleges have spread
beyond the United States and have been opened for business in Japan, Canada, Yugoslavia
and the Caribbean.
Over the period of their existence, the Community Colleges had attempted many
tasks for which they were not very equipped, but did a praiseworthy job, anyway. Among
these many functions were a) to extend opportunity and to serve as agent to educational
and social selection, b) to promote social equality and to increase economic efficiency, c)
to provide the students with a common cultural heritage and to soli them into specialized
curriculum, d) to respond to the demands of subordinate groups for equal education, e) to
answer pressures of employers and State planners for differentiated education, t) to
prqvide a general education for citizens in a democratic society and technical training for
workers in an advanced industrial economy. Said in short term, the fundamental mission
of the Community Colleges had been to democratize the playfield of American Higher
education, by providing to those formerly excluded an opportunity to attend college.
The Junior Colleges as the Community Colleges were initially called, gained their
high level of popularity and credibility due to their direct link or transferability of the
academic work, they forged with the four-year institutions. As quoted by Brint and
Karabel ( 1989), students who attended the two-year institutions did so on the basis of their

17
claim to be" real" college students. The only way this was validated was by the
completion of the Liberal Arts courses that would in fact receive academic credits at the
four-year colleges and universities. However, many researchers of the role ofthe Junior
Colleges in the scheme of Higher Education postulated that the administrators of the four
year colleges, who gave the Junior Colleges their footing in the beginning, had a totally
different motive to the development of the two-year institutions. Their aim was to divert
the masses of under prepared students, reaching out for a higher education, from their
doorstep.
Another contradictory pressure the Junior College faced was a more natural one;
all the graduates from the four-year institutions were being prepared to perform the tasks
of managers and administrators oflndustry and Commerce. There was an insufficient
quantity of the managerial jobs available for the potential number of graduates, and so, the
graduates of the two-year colleges were forced to compete with the graduates of the four
year colleges for the non-managerial jobs that were initially intended for the junior college
graduates. This situation was a quite natural result of the democratization of the American
Higher Education- the education and occupation aspiration of the students outran the
objective possibilities by a substantial margin (Russel, 1908). The United States being the
class -stratified society that it was had something threatening the status quo by developing
an educational system, which aroused high hopes, but merely destroyed them at a later
date.
The idea of a "REAL" education as defined by the four-year colleges, and
something that the two-year institutions wanted to embrace, to maintain their status and
transferability to the four-year colleges, had to be abandoned for a differentiated

18
education. This new model was able to fit students to their different vocation futures.
Researchers of higher education clearly stated that if mass education were to realize the
promise of democracy, separate vocational tracks had to be created. The logic behind the
vocationalization of the Junior College System was quite sound - if a society generated
more ambition for upward mobility than the actual opportunity available, vocationalizing
both at the secondary and higher education level was very necessary. As a result of this
vocationalization, the student population at the Junior Colleges dropped because of the
change in the students' perception of the quality and transferability to the four-year
colleges and universities. However, toward the latter half of the 20th century ( 1960-
1999), this viewpoint of a decreased quality of higher education because of
vocationalization, had changed. And so today, more than 42% ofthe students attending an
institution of higher education in America, started at the Community Colleges

19
L2 introdiUJction to tlhe Community ColBege System of Connecticut
The Community College System of Connecticut comprises twelve two-year public
institution of higher education that share a common mission to make educational
excellence and the opportunity for life long learning affordable and accessible to all
citizens of the State of Connecticut. As a secondary mission, the colleges of the System
seek to enrich the intellectual, cultural and social environment of the communities they
serve. The colleges also support the economic growth of the state with programs that
provide business and industry with skilled well-trained workforce. As outlined by Cox's
(2001), the colleges' primary responsibilities are to provide:
(I) Occupational, vocational, technical, and career education designed as
training for immediate employment job training, or upgrading of skills to
meet individual, community, and state workforce needs;
(11) Programs of general study, including remediation, general and adult
education;
( Ill) Programs of study for college transfer, representing the tirst two years of
the baccalaureate education;
(IV) Community service programs, including educational, cultural,
recreational, and community-directed programs; and
(V) Student support services such as admissions, counseling, testing,
placement, individualized instruction, and instruction for students with
special needs.

20
In 1946 the Cmmecticut Engineering Institute was opened to develop competent
technicians to meet the needs of the manufacturing industry. Later in 1955, the first
technical college, Hartford State Technical College was given the charter to grant two
year degrees. Within ten years, four more technical colleges were opened; Norwalk,
Norwich, New Haven and Waterbury. Soon after, the five institutes were incorporated
into a system of two years higher education, with a separate board of trustees, and named
the State Technical Colleges.
In umson with the development of the State Technical Colleges, the General
Assembly of the State of Connecticut established a system of two- year community
colleges in response to the recommendations by a special study commission that
advocated making higher education available to all citizens of Connecticut. In 1965, two
community colleges (Manchester and Norwalk) were opened for business and within
seven years, ten more colleges were operational. After an in-depth examination of the
two systems, the state legislation consolidated these two separate systems of twelve
community colleges and five technical colleges under the administration of a single board
of trustees and renamed the system the Community- Technical College System. In 1992
the merger was completed that resulted in twelve Community- Technical Colleges, five
community colleges combined with five technical colleges respectively and the
remaining seven were given the pem1ission to develop programs of study that were
previously offered at the technical colleges. Since then, the colleges have learnt to serve a
new and diverse student population to meet the common commitment to access and
opportunity through affordable and accessible higher education.

21
Following the national model for two-year comprehensive colleges, the board of
trustees that oversees the administration of the twelve Community- Technical Colleges
changed in 1999 the name of each college to Community College. The Community
Colleges award associate degrees and certificates in over one hundred career areas. Each
degree program requires a core curriculum and the general education courses, making the
Community College Education the combination of career training and liberal mis that is
essential in today's complex and changing society. Moreover, the General Studies
programs allow students the flexibility to work for a college degree and personal
emichment, to achieve individual education goals, or to meet transfer requirements for
specialized majors at four-year institutions of higher learning.

22
1.3 Purpose of the study
The problem of limited resources has always plagued Institutions of Higher
Education and even to a larger extent the Primary and Secondary Education Systems of
Connecticut. However, as we b.egin the 21st century, we have found ourselves facing
many controversial issues that could lead to the removal or dismantling of many needed
programs on the college campuses. today. The State Legislature faced with diminishing
revenue base, and with the responsibility for funding the community colleges in
Connecticut is requiring that funding should be tied to some operational efficiency
indices.
The Community College System of Connecticut has recently received a list of the
measures of efficiency from the State Commission on Higher Education. The intention of
this governing body was to ensure that these measures be met by the various member
institutions of this System. To address these measures, there is a need to develop a
comprehensive method to determine the level of efficiency at which these colleges are
perfonning, compared to each other or to colleges within a similar system of Higher
Learning. Banathy (1991) and Athanassopoulos and Shale (1997). both researchers in the
United States and the United Kingdom, were convinced that the performance
accountability of the Community Colleges was very difficult to measure, because of the
variety of methods postulated to deal with the variations in the goals in the determination
of efficiency at the Community Colleges.

23
In previOus similar determinations, the Regression Analysis Method has been
used extensively in determining which parameters would affect certain required outcomes
in an efficiently or inefficiently operated institution. This method of determination of
efficiency is a far cry from the true efficiency determination as utilized by the
Engineering and Economics discipline. Engineers and Economists make a comparrson
between the Inputs and Outputs of any process in determining its efficiency. Hence, it is
necessary for Education Researchers at the Community College System of Connecticut to
develop a list of Inputs and Outputs that would characterize the Mission of the
Community Colleges and use these lists to calculate efficiency markers (as engineers and
economists do) for the individual colleges within the System. The purpose of this study
was to determine the efficiency of the individual community colleges, as compared to
each other, and to use the results of the analysis to provide guidelines for the educational
improvement of the colleges.

24
1.4 Significance of the Study
This research addressed the issues of efficiency, and the results of the study that
provided distinct policy prescription to improve the overall learning environment at the
Community Colleges of Connecticut. Potentially, the most valuable outcome was the
identification of sources of efficiency and the estimation of the amounts of inefficiencies.
The augmentation of outputs as well as the conservation of resources was obviously of
interest in the matters of public management and policy. Hence, there was interest in the
methods used for evaluating the efficiency of the units of the Community College
System.
In the search of a reliable method for calculating the efficiency of the community
colleges, a recently developed (less than fifty years) method called Data Envelopment
Analysis (DEA) Method was designed specifically to examine the efficiency of not-for
profit institutions such as colleges and universities in a multiple input- multiple output
setting. This algorithm is a direct outcrop from the procedures of Mathematical Linear
Programming as used in Operations Research and System Analysis, and so, it can be
considered a procedure well grounded in the rigors of mathematics.
The significance of the study can be outlined in the following ways:
a) The study identified a peer set of efficient colleges (with similar outputs and
resources level), which served as examples for the resource allocation decisions
and the achievement target ofthe less efficient colleges.

25
b) The study supplied the data on the utilization of the college resources, which
assisted the decision makers in the reallocation of resources.
c) The study developed managerial information on the output augmentation level
and the resource conservation levels that could make an inefficient unit into an
efficient one.
d) The study pinpointed the specific inputs, which were causing the college to have
an inefficient rating, and so, the strategic planners of the college should focus on
these inputs for educational improvements.
In reflective thought, I hoped the study made some contribution to the qnderstanding of
the operation of a community college, as it played a vital role in the realization of the
educational goals of ordinary people.

26
1.5 Delimitation of the study
1. This study was done to analyze the level of performance of the Community Colleges of
Connecticut as compared to each other. and at no instance should the results of this study
be used to characterize the behavior of the community colleges throughout the United
States or the United Kingdom. The main limitations were as follows:
1. The operational variables of the study, the inputs and the outputs were best selected
on the basis of availability of data on the twelve Community Colleges of the System
for the academic year 1999 - 2000. Although there are variables that can be selected
that would further describe the perfonnance of these institutions, data has not been
collected to support their inclusion into the study.
2. These Community Colleges may have a common mission as mandated by the Central
Office, however, a level of autonomy is still left to the individual colleges, and so, the
tasks of the mission are approached differently, with stress placed on programs for the
specific community (Service Area) in which a college is placed. Hence, a proposal to
correct inefficiencies obtained from the overall study may or may not work at a
specific institution. Applications should be done with caution.
3. Apart from the shmicomings of the entire study, there are inherent defects in the DEA
procedure. The DEA model requires the analyst to specify and measure all the inputs
and outputs for the study. If any valid inputs or outputs are omitted the results of the
study can be biased against efficient consumers of input resources or efficient

27
producers the outputs. The incorrect input or output causes some DMUs to be given
higher efficiency standing than they really are. ·
4. DEA procedure takes for granted that each unit of an input or output is identical to all
other units of the same type. That is, within any input or output vector the units of
measure should be the same. I believe that this is a potential discrepancy of the
database and not of the DEA procedure and could appear in all methods of efficiency
measure.
5. DEA assumes that for proportional changes in the input levels, there are
correspondingly propm1ional changes in the output levels. This is referred to as the
'Constant Return to Scale.' This allows all DMUs to be compared and scaled to a unit
isoquant and so all the DMUs are evaluated on the same envelopment surface.
Similarly, if the Ratio or the Regression method selects a linear surface they will face
the same Constant return to Scale drawback. However, the software used in this study
that was developed by Banxia Software Ltd of Glasgow, UK can select a varying
return to scale, which is most appropriate for the evaluation of educational system.
6. The weights selected by the model for the input and output variables cannot -be
interpreted as values in the economic sense, like costs and prices, although they share
the same mathematical representation as the maximizing factors for a Linear
Programming Model.
7. Because the DEA procedure has its roots in Mathematical Linear Programming
(MLP), DEA shares a very prevalent shortcoming with MLP. The product of the
number of input variables and the number of output variables should not exceed

28
the number of Units being analyzed. This stems from the matrix method used to
calculate the efficiency of the DMUs.
8. Because the DEA Model yields a relative efficiency score based on the best
producer of the group of DMUs, all the efficiency scores developed cannot be
considered independent of each other, and so, it would be invalid to use these
scores as input variables to a Regression Analysis when the confidence interval of
the scores are determined. Hence, it is necessary to use a " Bootstrap Method" to
avoid this drawback of data dependence.

29
Chapter 2
Review of Related Research
2.1 Research Questions
The following questions served as the core around which this entire study was developed
and provided a nucleus for the generation of the literature review for this efficiency
assessment analysis of community colleges.
Question #1: How do institutions of the Community College System of Connecticut
compare to each other regarding their levels of Efficiency?
Question #2: What conditions may account for the differences in the level of success
within similarly efficient colleges'?
Question #3: What factors or constraints create the varying score among the
inefficient colleges

30
2.2 Measures of Efficiency
To measure the true strength of the DEA method, a comparison between the DEA and
the existing procedures used for the determination of the relative efficiency of various
organizations should be made. There were two procedures that warrant mentioning as this
comparison was made, namely, the Ratio Analysis and Multiple Regression Analysis,
and so, I chose to describe these two before I undergo a thorough in-depth analysis of the
dynamics of the DEA procedure.
Ratio Analysis: This method promotes the determination of the efficiency of a
system using the ratio of a single output to a single input. For example, the ratio of the
cost of instruction (both full time and part time faculty) in a given department to the
number of students graduating from that department is a measure of how efficiently the
department converts instructional dollars into graduates. However, this method is
woefully lacking in details of the true efficiency of this department of the college. There
are many other variables to be considered within the operation of the department, before
a correct determination of the efficiency of the conversion of all the inputs to the outputs
of the department under consideration, is made. If this Ratio Method Efficiency, as
detem1ined above, is used to compare other departments within the college, very
misleading results can emerge from this analysis. The ratio treats all the departments as if
they were all the same. There is a definite need to include all the contributing variables,
inputs and outputs to develop a true efficiency figure, and this cannot be done with this
type of ratio analysis. To account for the multi-inputs and multi-outputs nature of
departments within institutions of education, various ratios of eniciency would be
calculated simultaneously using different pairs of input and output. Collectively these

31
ratios tend to present a slough of numbers that give no clear indication of true efficiency
(Sexton, 1981 ).
Multiple Regression. This method produces a single output level of performance
of an organization based on contributing inputs. This method develops a relationship or
function that can be used to calculate the predicted output level of a DMU, given its
levels of input. The efficient DMU's lie above this relationship, which means they
produce more output than the model allows with the inputs provided. In opposition, those
that lie below the relationship produce less output with their inputs and are considered
inefficient. Hence, relative efficiency is reflected in the residuals, where positive
residuals indicate relative efficiency and the negative residuals show an inefficient
operation. Further comments can be made about this method.
a) ·The parametric approach ( as is Multiple Regression Analysis) to efficiency
determination typically uses the stochastic frontier method developed by
Aiger(l977). This entails the estimation of a stochastic production frontier, where
the output of a unit is a function of a set of inputs, the inefficiency and random
error. The drawback of this technique is that it demands an explicit functional
fonn and distribution assumption on the data as opposed to DEA which does not
impose an assumption about functional form and so, less prone to mis
specification. In addition DEA is a non-parametric method that does not account
for random error. However, since DEA cannot account for such statistical nise ,
the efficiency estimates may be biased if the production process is highly
dominated by stochastic elements.

32
b) Multiple Regression Analysis determines efficiency relative to average
performance as opposed to the best performance. Hence, it provides a negligible
amount of direct information concerning the magnitudes of efficiency
improvements that were possible at various DMUs in any given group.
The next section showed a description of the Data Envelopment Analysis method
selected to determine the relative efficiency of the member colleges of Connecticut
Community College System.
Data Envelopment Analysis (DEA)
In order to avoid any reiteration of the description of the DEA, the reader is
directed to Section 3.1 of this study, where a more detailed and in depth description of the
dynamics of the DEA and selection of the weights are considered.

2.3 JRevnew of Past DIEA stun dines
The basic nature of this research is one of an application of an existing theory and
model to determine the efficiency and reasons for differences in performance of the
twelve Community Colleges within the system of Higher Education of the State of
Connecticut. As a result, I do not think that there was the need to analyze and critique the
latest development in Data Envelopment Analysis (DEA) theory as is required in research
work that deals with the mechanism or theoretical rationale of DEA. However, in the
application of DEA, there have been improvements and extensions that have been made
to the original methodology of the technique that need to be embraced or analyzed.
Hence, I have selected to review only the previous analyses that have lent significant
insight to the applications of DEA to Decision Making Units (DMU's), like Institutions
of Higher Learning, in Higher Education .
The origin of Data Envelopment Analysis (DEA) stems from the two qualitative
analysis works done by Pareto and Koopmans (1927, 1951 ). The Pareto-Koopmans
efficiency referred to Wilfredo Pareto and Tjalling Koopmans. Pareto was concerned
with welfare economics, where he formulated the Pareto condition of welfare
maximization by noting that such a function could only be a maximum if it was possible
to increase one of its components without worsening other components of such a
function. He postulated that as a criterion, any proposed social policy should be adopted
if it made some individuals better off without decreasing the welfare of other individuals.
Tjalling Koopmans, on the other hand, applied these above- mentioned concepts to
production, which he referred to as Activity Analysis. He considered whether it was

34
possible to increase an output without aggravating some other output under constraints
allowed by factors of labor, capital and raw material (inputs).
These two researchers did not have any empirical data collected to confirm their
early philosophy until the appearance an article written by M. J. Farrell (1956). This
article demonstrated how the postulates of Pare to and Koopmans could be applied to data
to make determinations on relative efficiency on systems from which this data came.
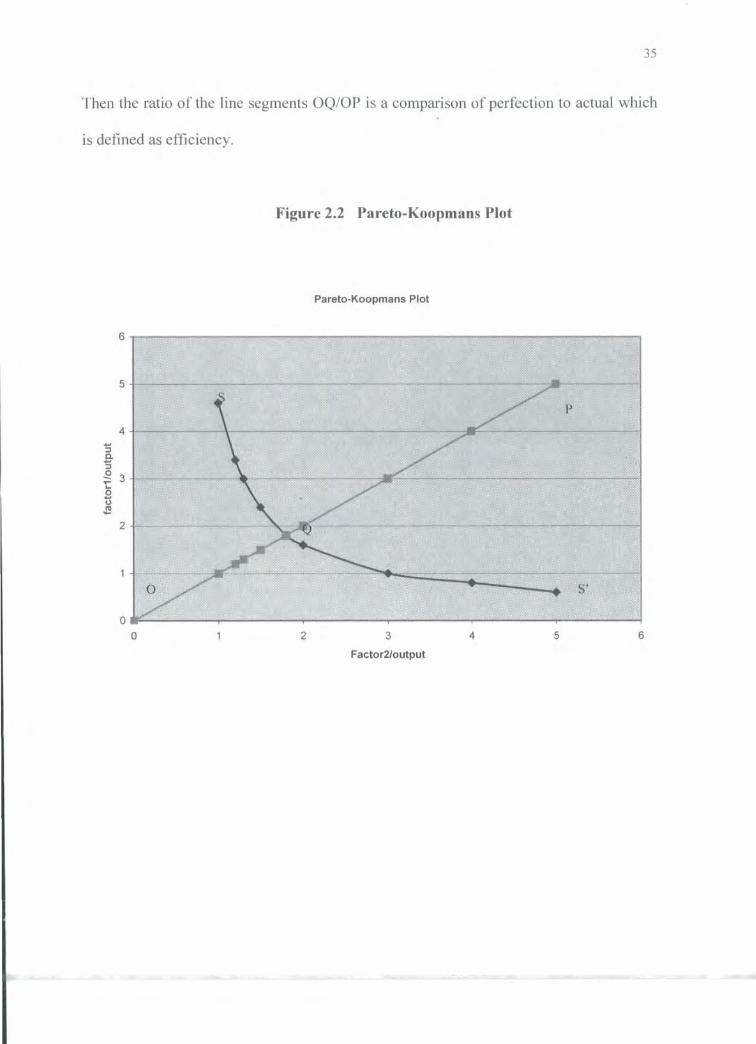
Farrell considered in his simplest case a company using two factors to produce one
product. On a coordinate system of axes ( Figure 2.2), the Y -axis represented the first
factor per unit output and the X -axis represented the second factor per unit output. He
placed a point P in the first quadrant of this coordinate system to represent the production
of the company in question, and so, a line, OP, from the origin, 0 to P represented the
various combinations of production of the company. He also inse1ted on the above
defined coordinate system, a line segment, SS', that was asymptotic to both X and Y axes
in the first quadrant, this line segment represented various combinations of the two
factors that a perfectly efficient firm might use to produce the unit output. The line OP
crossed SS' at Q, hence, the point Q was said to represent an efficient firm using the two
factors in the same ratio as P. It could be seen the Q produced the same output as P only
using a fraction OQ/OP as much of each factor. Farrell defined the ratio OQ/OP as the
technical efficiency of the firm P. This is demonstrated, quite clearly, in the graph that
follows. It is evident that if the line segment SS' represents the production line of a
perfectly efficient firm, then it leads to reason that the point Q on SS' represents an
efficient unit and if Q is also on line OP, it represents an efficient production of tim1 P.
35
Then the ratio of the line segments OQ/OP is a comparison of perfection to actual which
is defined as efficiency.
6
~%?
5
4 -~ Q.
'5 ~ 3 .... ... 0 -(.)
,f!
2
0
Figure 2.2 Pareto-Koopmans Plot
2
Pareto-Koopmans Plot
··~
3
Factor2/output
4 5 6

36
This article was considered the cornerstone or the best precursor for the studies
that led to the development of the DEA method. As the number of variables
(input/output) increased, to achieve some quantitative results on the methods of Activity
Analysis, Farrell had to wrestle with a series of massive matrix inversions, which was
very time consuming, to say the least.
At approximately the same time in 1957, when Hoffman (1957) pointed out to
Farrell the ease with which the Activity Analysis computations can be done using Linear
Programming, Chames and. Cooper (1978) article cemented the relationship between the
Activity Analysis and Linear Programming, and henceforth, most managerial efficiency
calculations were done using Mathematical Linear Programming.
Two articles written by Charnes, Cooper and Rhodes ( 1978 and 1981) were mainly
responsible for the modem day concept of Data Envelopment Analysis (DEA). The first
paper introduced the ratio form of the DEA and because of similarities to the definitions
of efficiency used in the Engineering and Science disciplines, it had some enhanced
interpretative powers, and so, was quickly embraced by some quantitative researchers in
the field of Management Science. The second paper coined the name "Data Envelopment
Analysis ( DEA )" and used the duality relations and computational power of Linear
Programming to develop the CCR model and its projections to evaluate programs such as
the landmark " Program Follow Through." The analysis of this program initiated the
identification of the difference between Program Efficiency and the way a program is

37
managed, that is, the distinction between Program and Managerial Efficiencies. This
program was a large-scale social experiment in public schools education, it was a
Federally sponsored program that was charged with providing remedial assistance to
educationally disadvantaged primary school students The design was to test the
advantages of Program Follow Through (PFT) students relative to the designated NFT
(Non Follow Through) counterparts in various parts in the United States. The intentions
of this program was to provide a general set of concepts and methods that can be applied
to a variety of public programs where profit, cost and like considerations were not
directly applicable. The suggested superiority of the PFT failed to be validated in the
illustrative application. However, the DEA approach pointed to the need for the
additional possibility of new approaches obtained from a PFT-NFT combination, which
may be superior to either of them alone. This study did not achieve its intended aim, but
merely laid the foundations for further work using the newly developed DEA procedure.
In fact, upon in depth scrutiny of the paper, I am left to believe that more time and energy
were spent on the set up of definition of terms for the further understanding of the DEA
and the efficiency determination, than on the application of the principle and procedure.
The researchers of this landmark study collected data on 11 outputs but used only 3 and
further had information on 25 inputs but used 5 in the study. Seventy sites were examined
in this study and from the rule of thumb, that was used later in this study to determine the
number of input/output variables that were suitable for a number of units investigated, the
study was not handicapped by a limited number of DMU's for the 3 outputs and 5 inputs
selected for the study. Adequate data was collected to thoroughly characterize the cohort

38
of third grade young children but too little of this data was used in the model which lead
to a suspicious shadow to be casted on the results of the study.
Actually, the study did not achieve the goal or test the hypothesis it had set out to
prove. I strongly believe that an analysis of the sensitivity of the results to changing input
and output variables should have been undertaken. The researchers would have found the
most effective 5 inputs among the 25 for which data was collected and the most sensitive
3 outputs from the 11 outputs. These selected input/output variables would have given the
study better results. Another issue could have factored in the inability of the model to
achieve its goals was that of the subjectivity ofthe researchers. The strong public scrutiny
under which this study was placed gave the researchers the proverbial cold feet in
reporting or finger-pointing the potential ills of the Elementary School System. Who was
directly or indirectly funding this research was a very poignant question to be asked when
a critical perspective of the study was taken. This study was Federally funded, which
meant that the study had no allegiance to any particular State and was free to report all
the findings and results without any potential reprisal from any State agency. However,
the magnitude of this study and the importance and the applicability of the results should
have been sufficient to force the researclwrs to '' Bite the Bullet" and include all the
potent input/output variables and analyze the results without any biases. It was my belief
that the researchers were reluctant to pinpoint waste and administrative inefficiencies in
the system run by the people who sponsored the research. They ( the researchers) were
more interested in maintaining good relations with the Department of Elementary
Education and continuing their development of efficiency analysis. This is opposite to the

39
case where a dissertation is written and the student is directed to discuss all the results of
the study .
. Thorogood (1983) in a dissertation on the application and utilization of DEA for
decision support in the administration of instructional programming for an urban
community college, analyzed twenty-two (22) community colleges using the DEA to
analyze Occupational Instructional Program. The aim of the study was to address the
problems found in urban community colleges where occupational instructional programs
produced different quantities of identified outputs and consumed varying quantities of
inputs. To do this study he used: student contact hours, number of fulltime instructional
staff members, square footage allocated to facilities and expenditure as the input
variables and selected revenue earned, number of student completers employed directly
in career areas in which they were trained and employer satisfaction with the program as
output variables. He found 8 efficient units and 14 inefficient ones. The highest
grouping of efficient units was in the business content area, while the highest number of
inefficient units were in the Health related, Engineering and Industrial Technologies
areas. Six new proposed programs were analyzed and from the results the college
administration opted to close some existing programs to start up the new programs. DEA
provided a strong decision making tool for the Administrators. This research was
completed very similar to the present study unde11aken. The major difference between
Thorogood's work and the present study was that Thorogood used Occupational
Instructional Programs as the DMU's as opposed to individual colleges as DMU's in the
present study. There were minor differences in the input/output variables list but overall

40
Thoro good's analysis gave the present study a level of validity and endorsement because
of its similarity in research environment. Thoro good's research was free of any outside
influences that might have hindered the objective reporting of all the results because it
was completed at the University of Texas, School ofDEA and Cybernetics.
Later in 1986, Desai produced a dissertation that measured efficiency with an
application of educational productivity. The thrust of this work was devoted to program
evaluation on policy issues on compensatory education programs in elementary schools.
Desai used DEA to develop indices of relative effectiveness and resource utilization
efficiency of schools of the Philadelphia District. Desai used these indices in the study to
overcome problems. resulting from the use of Regression Analysis, in the measurement
of marginal improvement, in particular, the effects of intervention of a comP,ensatory
education program. Apart from the application aspect of the study, Desai developed new
methodologies. The first was a development of non-radial measure of relative efficiency,
the second contributed to a test for the correct partition of data into homogeneous or non
homogeneous groups and the third methodological change was in a reformulation of the
DEA mathematical program to allow for random variations in data. Desai explained that
in order to obtain a stochastic fommlation of the problem there is first need to obtain the
data distribution and showed that the lognom1al distribution provides a good
approximation to the distribution of the ratio of two normal variables. The entire study
represented a good number of extensions to existing methodology that furthered the
applications of DEA. However, at the writing of this dissertation none of these
improvements to existing methodology had surfaced to the top to be included as new
methodology for DEA. This was very unfortunate, because the three improvements in the

41
methodology of DEA that were postulated by Desai could have helped to increase the
span of applicability of this new tool for the efficiency determination in education and
industry as well. A suggested reason for Desai's work not catching the eyes of
educational and industrial researchers was that the study did not have the blessings of the
DEA gurus at the University of Texas. As subjective as one may think this reason was,
this had been the main reason for the selection of many directions in various research
work.
At the same time, Justinger(l986) developed an efficiency analysis study for an Ed.D
Dissertation. This work was concerned about the level of efficiency with which New
York State Community Colleges administer the recommended necessary services for
adult students participati-on. The study using two outputs: 25 and over FTE's divided by
total FTE and 25 and over graduates divided by the total graduates and four inputs:
counselors per student, tutor hours available to student, child care hours per adult student
and special organizations available per student, was focused on 23 community colleges,
where six were found efficient, two rated between 90% to 99%, four between 80% ·to
89%, one between 70% to 79%, two between 60% to 69%, and the remaining had ratings
below 60% efficiency. Recommendations were made on those inefficient colleges, those
having slack(excesses in Input or Output variables), to be reexamined and reassessed on
the slack areas to improve efficiency. As an EdD dissertation, this study was free of the
biases of sponsor or governing bodies where the study was done. It is my opinion that
outputs could have been better selected to measure the level of efficiency with which the
Community Colleges of New York State administered the recommended necessary

42
services for adult participation. Maybe these two ratios used as output variables merely
hinted to the level of efficiency but were very nebulous. This work demonstrated the
applicability of DEA to the efficiency determination within the community college
setting but identify the poor selection of output variables.
Harrison (1988) conducted a study for the Ph.D. dissertation on nineteen universities
of the State of California University System. The aim of the study was to detennine the
technical efficiency and quality of these universities and in doing so, Harrison found that
because of the ability of the DEA procedure to handle multiple inputs and outputs
variables in the determination of the efficiency of a unit, the method provided a better
measure of efficiency than the single input /single output Ratio Analysis most often used
to describe university efficiency. the results showed that DEA could be used to evaluate
performance of universities along the dimension of technical efficiency and quality, as
total performance measurement tools. These results also indicated that all the efficiency
scores were nearly equal and the inefficient universities had considerable slack in the
faculty input variable of the model. This study added a most attractive dimension of
quality to the efficiency detennination of the universities. This was never done by any
other researcher and I consider this study as a good precursor for efficiency determination
studies in higher education ..

43
Ray (1991) analyzed Data on Cmmecticut Public Schools using DEA to determine
Resource Use Efficiency. This work combined DEA with Regression Analysis to
determine the relative efficiency of the Public Schools. The results showed that
efficiency in utilization of school resource inputs varies with the socioeconomic
characteristics of the town. The average level of managerial inefficiency was 12.64
percent. The study concluded· that this 12.64 percent measure provides a frame of
reference for improvement in the levels of utilization/achievement from existing
resources through improved management. This 12.64 percent of managerial inefficiency
was low but was very characteristic of the Public Schools in Connecticut at the time of
the writing of this dissetiation. With the demand for higher levels of accountability by the
State Legislature and other endowments that provided funding for special educational
projects, the schools were forced to improve.
Later in the same year Banathy ( 1991 ) wrote a Ph.D dissertation on performance
in Community Colleges using Data Envelopment Analysis. This study postulated that the
performance accountability in community colleges is complex because of their diversity
and searched for another method to account for the variations in goals and institutional
uniqueness in the determination of performance in these community colleges. To
alleviate the degree of complexity at these institutions, the evolution and shaping factors
of the community colleges were closely examined. In making this analysis, Banathy
employed DEA to: (a) take multiple goals into account, (b) categorize educational units
into peer groups for comparison and (c) identify the strengths and weakness of individual
units relative to their peers. This study highlighted the computational difficulties when

44
using multiple inputs and outputs in the determination of the performance efficiency at
the community colleges. It validated the need for a DEA -like procedure to handle the
multiple input and outputs and other calculation characteristics of those that could have
been handled only by DEA.
W. Puttakul (1994) wrote a PhD dissertation on the applicability of DEA to· the
measurement of the efficiency of 43 Area Vocational Teclmical Schools (AVT).
Seventeen schools were found efficient and twenty- six were determined inefficient. On
an average, the inefficient schools needed to increase the outputs by approximately 24%
and decrease the inputs by 7% from the current amounts in order to achieve efficiency.
The following conclusions were drawn about the efficiency of the ATV's and the
DEA procedure.
1. For specified Output and Inputs, the A VI's performed at a 90% efficiency level.
2. School improvement policies and plans can be directed by DEA findings.
3. DEA results sufficiently inform individual schools "where they are" relative to
the others and where to go in terms of output and input improvement but not
sufficiently enough as to help them how to get there.
This research demonstrated the use of the DEA procedure with no hidden agenda by
the researchers. The results were direct findings of the study.
In 1994, Lovell, Waiters and Wood wrote an article on the Stratified Models of
Education Production using Modified DEA and Regression Analysis that addressed
non-discretionary input data that is so often omitted in many education analyses. The

45
models fail to show any relationship between student outcomes and variablesas per
student expenditure teacher/pupil ratio, teacher education, teacher experience and
teacher salaries.
Among all the studies that contributed considerably to the application of the DEA
procedure to the efficiency evaluation of institution of higher education, the work by
C. Kao in 1994, Evaluation of Junior Colleges of Technology -The Taiwan Case,
was validated by a separate study perfonned by the Government. This study analyzed
the departments of Industrial Engineering and Management of eleven Junior Colleges
of Technology in Taiwan, under the five categories of: educational goal, instructors,
curriculum, equipment and administration. A quantitative method called the Pareto
Optimization, a simpler version of DEA was used to calculate the efficiency of the
various programs. The author outlined that there was no surprise that the
determinations made in this study coincided with those of the Government of Taiwan,
primarily because of the accuracy, reality and the multiple inputs/outputs usage of the
DEA method.
So far, most of this review of the literature had concentrated on the dissertations
that were developed on the universities campuses in the United States. These
dissertations considered were mainly studies done on efficiency evaluations on units
ofthe community colleges using the DEA procedure. However, the use of the DEA
method for the detennination of efficiency had caught on in other works by
researchers in higher education in the UK. Johnes and Johnes (1995) produced a
paper to use DEA to investigate the technical efficiency of U.K. university
46
departments of Economics as producers of research. As outlined in its abstract,
particular attention was paid to the role of external funding of research as an input to
the research process. The data set used was an extended version of the one which
informed the 1989 Universities Funding Council (UFC) peer review and the results of
Johnes and Johnes' study were compared to those obtained by the Council. The study
examined the Economics Departments of 36 universities and colleges where the
outputs: papers in academic journals and letters in academic journals were used as
measures of research and the only input was the persons-months ofteaching and
research faculty employed over the five year period of the study. These input and
output variables produced only 2 universities on the efficient line, namely Liverpool
and London (Birkbeck). An important feature was deduced from the study. When the
value of the 'external research grants per faculty member' was introduced as a second
input, the number of efficient institutions jumped to 9, namely : Aberdeen, Bristol
City, Liverpool, London (Birkbeck), London (UCL), Reading and York universities.
By adding a second input variable, teaching, to the first run of the model, 7
universities/colleges remained on the efficient frontier line, they were: Bristol,
Cambridge, Liverpool, London (Birkbeck), Reading, Warwick and York universities.
The author pointed out from the above observation that if all possible inputs were
included in the analysis, all the departments of the respective institutions would likely
appear to be teclmically efficient. The paper went on to say that in assessing the
relative efficiency of departments it would be prudent to control for inter institutional
differences in inputs which could be easily varied in the short nm, like grants and
teaching load, but not for those that could not adjust. Hence the study developed a

47
measure ofteclmical efficiency, which provided information about the standards a
given department could expect to sustain given that it had the same level of
transferable resources as every other department. The writers concluded that from the
variation in the number of efficient units as additional inputs were introduced in the
study, that checks for the robustness of the results of a DEA study were very essential
and that DEA has a positive contribution to make in the development of meaningful
indicators of university performance.
In addition to these studies that have employed the DEA methodology, there is a
number of others that have critiqued the DEA procedure.
Sexton et al ( 1986) produced a very informative piece of research, which stressed
some shortcomings ofthe DEA but also suggested some extensions ofthe procedure
to meet the needs of multiple objective functions.
As in most organizations, the price for raw materials and services and other price
related questions are always in the forefront of managerial decisions. Although DEA
can be used to rank DMU's as far as their technical efficiency, DEA cannot be used
to comment on the Price Efficiency of the DMU's. That is," DEA cannot say
whether the DMU's are producing the socially optimum (most highly valued) output
mix using the least- cost technologies (Sexton et al pg 28). This research went on to
say that Farrell (1957) considered the distinction between technical efficiency and
price efficiency and showed that DMU' s can be technically efficient but price
inefficient. Also, while it was clearly important for organizations to operate in
productive efficient manner by maximizing the outputs from given inputs, it was
often of more immediate concern for the typical non-for-profit organization that it

produced socially beneficial outputs using ever shrinking and increasingly
constrained financial resources. In essence, the price efficiency could be more
important than the technical efficiency.
48
Another salient feature of this research was the extension suggested for the DEA
procedure when several competing objective functions are present in an analysis. For
example, consider a firm that wished to simultaneously maximize profit, minimize the
need for expansion investment and control employment. These were considered multiple
goals and the normal linear programming procedure was to select one goal to be the
objective function and place the remaining goals in the constraint set, where a minimum ,
a maximum or a targeted level were imposed. However, the postulated goal
programming procedure placed all the goals into the constraint set and proposed a new
objective function which was the weighted sum of the deviations of each goal from its
maximum, minimum and targeted level. Hence, the solution obtained did not maximize
profit, minimize the need for expansion investment, or keep employment constant, but
achieved a compromise among the goals based on weights attached to the deviation.
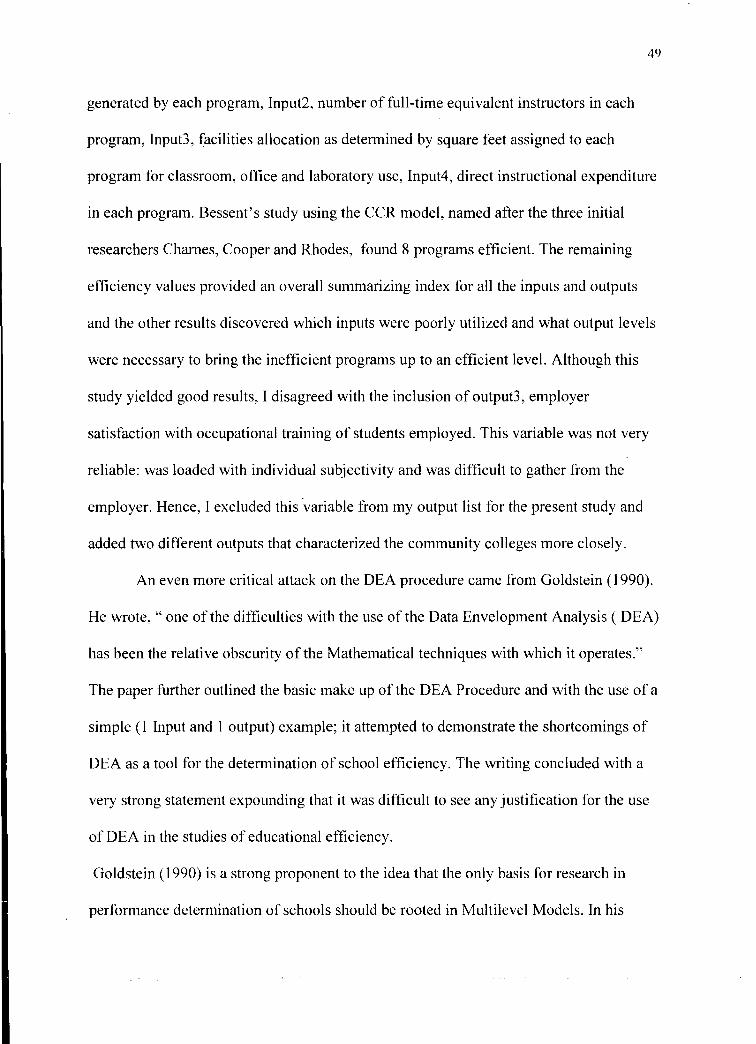
The work by Bessent ( 1983) served as a source of input and output variables used
in this present study. Bessent analyzed 28 Occupational Technical Programs at San
Antonio College. Twenty-two of these programs represented decision-making units for
administration. Each such unit had an administrative head responsible for supervising
teaching staff, curriculum and expenditures. This study had 3 outputs: Output 1, revenue
earned by contact hours through state funding formula, Output2, the number of students
completing programs, and Output3, Employer satisfaction with occupational training of
students employed. There were four input variables: Inputl, student contact hours
49
generated by each program, Input2, number of full-time equivalent instructors in each
program, Input3, facilities allocation as detem1ined by square feet assigned to each
program for classroom, office and laboratory use, Input4, direct instructional expenditure
in each program. Bessent's study using the CCR model, named after the three initial
researchers Charnes, Cooper and Rhodes, found 8 programs efficient. The remaining
efficiency values provided an overall summarizing index for all the inputs and outputs
and the other results discovered which inputs were poorly utilized and what output levels
were necessary to bring the inefficient programs up to an efficient level. Although this
study yielded good results, I disagreed with the inclusion of output3, employer
satisfaction with occupational training of students employed. This variable was not very
reliable: was loaded with individual subjectivity and was difficult to gather from the
employer. Hence, I excluded this ·variable from my output list for the present study and
added two different outputs that characterized the community colleges more closely.
An even more critical attack on the DEA procedure came from Goldstein (1990).
He wrote," one of the difficulties with the use of the Data Envelopment Analysis ( DEA)
has been the relative obscurity of the Mathematical teclmiques with which it operates."
The paper further outlined the basic make up of the DEA Procedure and with the use of a
simple (1 Input and 1 output) example; it attempted to demonstrate the shortcomings of
DEA as a tool for the determination of school efficiency. The writing concluded with a
very strong statement expounding that it was difficult to see any justification for the use
ofDEA in the studies of educational efficiency.
Goldstein ( 1990) is a strong proponent to the idea that the only basis for research in
performance determination of schools should be rooted in Multilevel Models. In his

50
critique of the DEA procedure he insisted that there was a need for a functional one to
one relationship between the Input and Output variables before the efficiency of a system
could be defined. This was opposite to the main tenet of the DEA procedure particularly
in the performance assessment of educational institution where the functional relation
between resources and products are unknown.
Goldstein's attempt to demonstrate the mechanism ofthe DEA by using a single
input and a single output example was an unfair attack with an oversimplified
characterization of DEA which failed to recognize the true applicability of the procedure.
One must bear in mind that the DEA procedure was designed for the use of multiple
inputs and multiple outputs system without prior knowledge of any functional
relationship between the input/output variables. Also, the procedure was rooted in
Mathematical Linear Programming, in particular, the Simplex Method with procedures
and principles that are widely accepted by the researchers of Operations Research and are
therefore both well known (i.e. could hardly be described as depending on techniques of
"relative obscurity") and relatively uncontroversial. From Dr. Goldstein shallow and
unfounded statements, I strongly believe that he did not make his case with the example
he used.
Although the fundamental DEA models (CCR and BCC, to be discussed in the
following chapter) have undergone a number of improvements in recent years [see
Lovell (1993) and Seiford ( 1996)]. one of the main criticism faced by researchers using
non-parametric methods is the ditliculty of drawing statistical inferences.
However, as shown by Grosskoft (1996) more recent researchers have published
evidence that they have been relatively successful in finding ways to overcome this

51
problem. One of the first methods recommended to solve this problem was Regression
Analysis. The basic method, which has come to be known as the "Two Step" technique,
was to treat the efficiency scores as data or indices and use linear regression to explain
the variation ofthese scores. However, if the variables that are used in the specifying the
original efficiency are correlated with the explanatory variables used in the second stage,
then the second stage determination will be inconsistent and biased [Deprins and Simar
(1989): Simar, Lovell and Vanden Eeckaut (1994)]. Bhattacharyya et al.(1997)postulated
that when employing regression analysis in the second step to explain the variation of the
efficiency scores, it is likely that the included explanatory variables fail to explain the
entire variation in the calculated efficiency and unexplained variation mixes with the
regression residuals, adversely affecting statistical inference.
Xue and Harker (1999) have pointed out that the efficiency scores developed by
DEA models are clearly dependent on each other in the statistical sense. The reason for
this dependency is the well-known fact that the DEA efficiency score is a relative
efficiency index, and not an absolute one. Since there is this inherent dependency among
efficiency scores, the basic required assumption by regression analysis of independence
within the sample, is violated. Hence this development renders the conventional
procedure outlined in the literature to be invalid. For this problem these researchers
recommended a bootstrap procedure to overcome the problem. This bootstrap is a
computer based technique for assigning measures of accuracy to statistical estimates ..
Simar (1992) was the first to introduce the bootstrap technique for computing confidence
interval for efficiency scores developed from non-parametric frontier methods. Since this
bootstrap method has been used to develop an empirical distribution of efficiency scores

52
for each observation in the sample: to derive the confidence interval and a measure of
bias for DEA efficiency scores, and further to develop the sensitivity of efficiency scores
to the sampling variations of the estimated frontier (Simar and Wilson, 1995)
From 1990 to present, DEA has expanded not only as a tool of educational research, for
which it was initially intended, but has founded considerable applicability in various
fields of Economics, Social Sciences and Engineering (Cooper, Lewin and Seiford,
1994). The DEA procedure has been acclaimed and will continue to be a valuable
educational research tool.

CllnaptteJr 3
De§ign ([))f tllne §tl!Hlly
53
Part of the controversy surrounding the subject of performance measurement m
Higher Education focuses on the methods of analysis used. Historically, the assessment
of institutions of higher education has relied on statistical methods for the development of
performance indicators. This has attracted criticism from both academics and
administrators (Athanassopoulos & Shale, 1997). Researchers in education are skeptical
of any new methodology for measuring the efficiency of colleges, universities,
organizations or agencies, which does not explicitly set forth the same assumption
requirements as the traditional methodologies. This natural skepticism requires us to
closely scrutinize any proposed methodology. The instant any methodology moves from
the laboratory to the field, where it is applied in a policy analytic context, the need for
thorough inspection becomes urgent. This was the case with Data Envelopment Analysis
(DEA), a linear programming technique that was advanced by Chames, Cooper, and
Rhodes (1978, 1981 ). Irrespective of the in-depth examination done, numerous
researchers (Johnes and Johnes, 1995 and Bessent et al, 1983) have found benefits in
using DEA methodology for the efficiency determination of not-for-profit organizations
like those institutions of higher learning.
The DEA is a multi-input and multi-output linear programming based system
used to calculate the relative efficiency of organizations, agencies, and public or private
not-for-profit institutions of higher education called Decision Making Units (DMU's). As

54
per the classical definition of efficiency, DEA uses a ratio of a weighted output to a
weighted input and permits each DMU to select any weights it wants to use for each input
and output. The weights must fulfill the following two conditions for them to be
satisfactory for the model. First, none of the weights can be negative. Secondly, the
weights must be universal; by that, I mean any DMU, within a given system, should be
able to use the same set of weights to determine its own ratio of weighted outputs to
weighted inputs. It was generally expected that DMU's will allocate heavier weights on
the inputs that were used least often in the analysis and on the outputs that produce most
(Sexton, 1981 ). Because these inputs and outputs are not traded on the market, they do not
have any costs and prices, and so, these weights should not be confused with economic
indicators of value. They are merely a weighting scheme that maximizes the efficiency of
the DMU in a Mathematical Linear Programming model.
The efficiency, as determined by DEA, is identical to the Productivity Index as used in
the field of Engineering and Economics, and as such, uses the inputs and outputs of a
DMU to calculate the level ofperformance of the DMU being considered.
The model for a DMU can be formulated as a linear fractional program, which
can be easily transformed into an equivalent linear program in which the DMU input and
output weights are the decision variables. For each DMU a linear program must be solved
which provides the set of weights and the measure of the relative efficiency.
As shown by most of the commercial microcomputer software for DEA or
Frontier Analysis, as it is referred to in other studies, many more helpful managerial tools
evolve from the analysis.

55
In the determination of the efficiency of a DMU relative to other DMU's within a
system, for example, a college within a system of institutions of higher learning, each
DMU would use a number of different Inputs (common to each college) to produce an
assortment of different Outputs (common to each college). The manner in which the
DMU converts the inputs to outputs is not critical to the DEA system and so, there is no
error incurred in the selection or even the consideration of a production function between
inputs and outputs of a selected DMU. The natural cost and prices of selected inputs and
outputs to the DMU may be non-existent for some or all (inputs/outputs), especially when
considering public and not-for-profit organizations like institutions of higher learning,
where input measures like parental education and socioeconomic status are not traded at a
market. and so, do not have costs and prices. While these measures are scarce, and hence
of value to society, relative to each other and to other goods and services, their values are
unknown and immeasurable. (Sexton, 1981)
Data Envelopment Analysis defines the Relative Efficiency of any DMU as the
ratio of the total weighted output to its total weighted input. However, the selection of the
weights, for the weighting of the input and output variables, creates a serious problem,
since no weight values can be assigned to the inputs or the outputs. The assignment of
these weights was the central theme of this method. Each DMU was allowed to select any
weights that it wanted for each input and output, on the condition that they (the weights)
satisfied certain requirements that have been outlined above.

56
Before I can put the above discussion into mathematical equations representation,
there are certain Linear Programming concepts I must present to bring about a thorough
understanding of application of DEA for the determination of efficiency and its use as a
managerial tool at various organizations.
It must be understood, from Linear Programming Theory, that each DMU
analyzed by a Linear Programming Model produces a Primal Model, and a corresponding
Dual Model. An understanding of the relationship between the Primal and Dual
specifications of a Linear Programming problem is essential. The Primal Model
maximizes the object function and yields a level of relative efficiency of each DMU
participating in the study. The Dual Model constructs a completely different set of
variables, has its own set of constraints and its own objective function defined in terms of
the input /output variables of the DMUs. The DMU with a relative efficiency of I is
considered efficient and the inefficient ones have a value less than one. Because this is a
relative efficiency based on the performance of the other members of the group, an
inetlicient DMU can strive toward an efficiency level of I by using a linear combination
of the input and output levels from a Reference Set of efficient DMUs, to calculate a
hypothetical efficient DMU. However, the coefficients of the linear combinations must
be found.
If a DMU is efficient, then its Optimal Dual solution will have all dual variables
equal to zero except the dual variable corresponding to the DMU itself and an extra
variable, both equal to one. However, in the event that a DMU is inefficient, the extra
dual variable is equal to the efficiency of that DMU and the other dual variables are the

57
coefficients of the linear combination mentioned in the above. It must be noted that some
of the dual variables are equal to zero, and in fact, only efficient DMUs have positive
dual variables. Hence, the DMUs to which positive Dual variables are assigned represent
the Reference Set, which members are to be used to calculate the hypothetical efficient
cousin of the inefficient DMUs. In simpler language, dual variables identify the efficient
reference set for any inefficient DMU and also provide the multipliers (coefficient)
needed to produce the input and output levels of the hypothetical efficient DMU. The
dual variables facilitate the construction of a hypothetical DMU that is perfectly efficient
from a previously inefficient DMU (say DMUj, j =1 ... N, where N represents the number
of units ). This hypothetically efficient DMU is a linear combination of the members of
the efficient Reference Set for DMUj. Thus, the dual variables produce a managerial tool
that tell the analyst how an inefficient DMU should be adjusted to become an efficient
one.
From the above description of the Optimal and Dual Model of a Linear
Programming System, it is relatively simple to obtain answers for the three research
questions of this study. The Optimal and Dual Variables for each DMU would not only
provide the efficiency figure of the each DMU but would also determine the variables
responsible for the level of inef1iciency of the DMU and the actions that can be taken to
improve a poorly run DMU.
According to Hussain and Brightman (2000) of the Banxia Software Limited,
organizations such as banks, hospitals, airlines, government agencies, local authorities
and education institutions, all that have branches that perform the same tasks, use this
DEA method to determine the following:

58
i) Resources allocation
i i) Identification of the "Best Practice"
iii) Identification of the "Poor Practices"
iv) Setting Targets
v) Monitoring efficiency changes over time
vi) Rewards for good performance
vii) Planning site location

59
3.2 Mathematical Formulation of the DEA
This section describes the mathematical formulation of the DEA as developed by
Chames, Cooper, and Rhodes, 1987; Bessent and Bessent, 1980). The CCR model is
developed by Chames, Cooper, and Rhodes and explains the output application side and
an input reduction side of the model. The CCR input model is presented below:
Suppose that there are n Decision Making Units (DMUs) to be analyzed, each of which
uses m inputs to produce s outputs:
measurement of rth value output for decision
making unit j; r = 1, ... s, j = 1, ... n
x .. IJ measurement of ith value for decision
making unit j; i = 1, ... m, j = L ... n
weight for output r to be calculated from the
analysis for unit k.
weight for input i to be calculated from the
analysis for unit k
the efficiency value sought for DMU k.
The objective function is the ratio of the total weighted output of DMUk divided by its
total weighted input.

60
s
L UrkYrk r=l
Maximize hk
s
I V rk Y lj r=l
Subject to: < 1
Ill
I VikXu i=l
j = 1 , ... , k, ... , n
Urk > 0; r = 1, ... , s
vik > 0; = 1, ... ,m
This ratio model is then transformed into a linear programming model with both Primal
and Dual forms:

61
Primal model:
s
L U rk Y rk
Maximize hk = r = 1
Subject to: = 1
s
L V rk Yrj Ill
I VikXif r=l - i=l :SO
j = l , ... , k, ... , 11
- U rk :::; - E ; r = l , ... , s
- Vik :S-E; i = } , ... , m
Where E > 0 is a non-Archimedian (infinitesimal) quantity

62
Dual ModeB:
s
I Minimize zk = 8k- E r = I
+ S rk
11
z:A,,y,., Subject to: i=l +Srk Yrk
r=l, ... ,s
i=l, ... ,m
Where:
zk =reciprocal ofhk = 1/hk
..t j = weight for j th DMU calculated from analysis
+ Sr = slack for r th output
-s1 = slack fori th input

63
In the event we wanted to also consider the increasing or decreasing retums to scale, we
would employ the BCC model (Banker, Chames, and Cooper, 1984 ).
Primal modell:
.I
I Maximize hk = r=l Urk Yrk- Wk
Subject to: 1
j = 1 , ... , k, ... , n
U ::;-E·r-1 s - rk ' - ' · · ·'
- vik ::; - E; i = 1, ... , m
where E > 0 is a non-Archimedian (infinitesimal) quantity

64
Dual Model:
~ Ul
Minimize Zk I + I r=l Srk - E i=l sik
Subject to:
r = 1, ... , s
11
I J=l A. X - S·
J IJ I,; 0
i = 1, ... ,m
11
I j=l A.
J
Where:
Z~; = reciprocal of h~; = 1 /h~;
A .i = weight for j th DMU calculated from analysis
+sr = slack for r th output
·s1 = slack for i th input

65
3.3 College Accreditation
Before the Community Colleges of this System can be evaluated, that is, g1ven a
performance assessment rating compared to their peers, it is very important to ensure that
these institutions are provided with the necessary resources to educate students and to
create the crucial factors that would foster a good learning environment for these
students. This process would place all the colleges on an economically equal scale (equal
playing field), and so, the efficiency level determined from this study would yield a true
measure of the managerial and technical skill of each individual college.
To ascertain that this is done, the Community Colleges of Connecticut are placed
under the scrutiny of the New England Association of Schools and Colleges (NEASC).
This association is one of the six educational accrediting bodies in the United States, it is
a voluntary, non-profit, self-governing organization having as its primary purpose the
accreditation of educational institutions. The NEASC team developed the Standards for
Accreditation. This team consisted of members of various educational institution as well
as· prominent members of the public. Hence, these standards· represented the combined
knowledge of more than two hundred colleges and universities, concerning the crucial
elements of institutional quality, and they offer a viewpoint that emphasizes the public
purpose of higher education. The NEASC Commission evaluates on a regular basis the
effectiveness of its standards and its processes for applying them, and makes the
necessary changes as conditions warrant.

66
Each college of the system acquire its accreditation from NEASC through its
Commission on Institutions of Higher Education by demonstrating that it has met the
Commission's Standards for Accreditation and comply with its policies. As indicated by
the preamble of these Standards; the Standards for Accreditation establish minimum
criteria for institutional quality. All colleges are encouraged by the Commission to work
toward improving their quality, increasing their effectiveness and continually striving
toward excellence. The evaluative processes are designed to establish such improvement.
NEASC uses the following eleven standards as principal areas of institutional
activities:
a) Mission and Purposes
b) Planning and Evaluation
c) Organization and Governance
d) Programs and Instruction
e) Faculty
f) Student Services
g) Library and Information Resources
h) Physical Resources
i) Financial Resources
j) Public Disclosure
k) Integrity

67
The college which meets the Standards (i) has clearly defined purposes appropriate to an
institution of higher learning, (ii) has assembled and organized those resources necessary
to achieve its purposes, (iii) achieving its purposes and (iv) has the ability to continue
achieve its purposes. Further, it must be understood that the Standards are not developed
to exclude perceptive and imaginative philosophies that are directed to increasing the
effectiveness of higher education. As quoted in NEASC 1992, "Institutions whose
policies, practices, or resources differ significantly from those described in the Standards
for Accreditation must present evidence that are appropriate to higher education,
consistent with institutional mission and purposes, and effective in meeting the intent of
the Commission's standards. Furthermore, the existence of Collective Bargaining
Agreement in and of themselves, does not nullify institutional or faculty obligations to
comply with the standards for accreditation. "

68
3.4 Input- Output Studies
To initiate a discussion on the Input- Output variables that were used in a DEA model, it
was necessary to reiterate the most salient feature of the DEA procedure. This states that, DEA
makes it possible to deal simultaneously with multiple outputs and multiple inputs, and it does not
require prior specification of the functional forms that relate them to each other. This is especially
advantageous in the field of higher education where functional relations, such as those between
research and student input and plant facilities, are difficult to specify. Similarly, the need for prior
specification of weights and like devices is also avoided in DEA. Clearly then, the difficulties
faced when using ' total factor productivity indexes' were not encountered when DEA procedure
was used. This demonstrated the ease with which the analyst can use input and output variables in
the DEA model without having to prep the data or setup the operational variablesfor the model.
It is generally accepted by the researchers of higher education administration, that outputs
from the institutions of higher learning can be classified within the following group: ( 1) education,
(2) research and (3) community service. Although the community colleges are not directly
compensated for their research activities, their outputs are very present in the education and
community service functions. The education output is strongly measured by the total semester
credit hours generated and other secondary factors, while the provision of continuing and outreach
type of education, as well as healthcare programs and sports and related activities are all
considered as the community service output.

69
On the other hand, Ahn et al (1989) have pointed out that inputs to higher education
systems can be found in many more sources than that of the outputs. The following are eleven
variables of potential inputs to an institution: (1) Resident Instruction, (2) State Fund
Appropriations for Research, (3) General Administration, (4) General Instructional Expense, (5)
Staff Benefits, (6) Library, (7) Extensions and Public Services, (8) Physical Plant Operation and
Maintenance, (9) Special Items, ( 1 0) Major Repair Rehabilitation of building and facilities, and
(11) New Construction.
The aim of the selection of the appropriate inputs and outputs variables for the DEA
procedure was to ensure that the inputs and outputs used truly characterized the great majority of
the operations at the community college and to achieve a level of robustness of the model using the
selected variables.
One might conceptualize the fact that the input data should be information with which
the researcher cannot interfere, but as outlined by Johnes (1995), the mere ability to select the
input variables for a given system is sufficient interference. For a given period, the expenditure
portion of the input variables was constrained by the budget. For a fixed quantity of inputs, and a
fixed quantity of outputs, the after the fact question was : Was the operation efficient ?? What
variable caused it to be inefficient?? In the use of the DEA procedure the mystery lies in the
ability of the method to yield an efficiency level without prior determination of a production
function between inputs and outputs of the system in question. In the selection of the inputs, I
identified the variables that are needed not only to produce graduates but also those inputs that
create the leaming environment necessary for educating, and hence, maintaining the features of
accreditation as mandated by the accrediting body of the region. The sum of the inputs that were

70
represented by a dollar value accounted for 95.99% of the total expenditure of the System on the
community colleges. This I considered to be a relatively tight characterization of the colleges'
operations by the model and would help to validate the outcomes of the model.
In the development of the output list, there was a considerable amount of difficulty in the
characterization of the total deliverability of each community college and the availability of the
data for each variable of the output list. I believe that the colleges were given charters to deliver or
provide an education to their students, be it, the graduates as well as those who came for one
course. This was quantified by the total of the credit awarding grades given for the academic year
of 1999-2000 (Fall and Spring semesters). However, a considerable amount of instructional hours
were delivered during the winter inter-session, the summer sessions and the continuing education
credit and credit-free programs for which a log of these instructional hours or the credit awarding
grades was not possible. Hence, the only credible factor that can be used to represent this
discrepancy was the accrued revenue for these instructional services as collected by the Continuing
Education Department. These quantities were included in the Total Revenue (TOTREV) variable
output as discussed in the next section.
In the selection of input and output variables for the model, one can have an overall view
of the efficiency as the ratio of the total expenditure to the number of graduates produced as the
measure of deliverability of a college. And so, a very simplistic one to one ratio can be used to
make some comparison amongst the colleges. This could have sufficed if all the considered inputs
were expenditures and all the outputs were number of graduates. However, apart from the
expenditure aspect, there were other types of inputs, like the number of square footage of the
instructional areas of the colleges and the numbers of instructors, to be considered. The output had
71
in addition to the number of graduates, the numbers of credit awarding grades, percentages of
success and the total revenue coming into the college, hence, to determine the efficiency of any of
the colleges it was necessary to have a model that could have incorporated multi inputs and multi
outputs as the DEA system.
One of the strengths of the DEA is the ability to identify the specific site (Input or
Output variable), which is responsible for the inefficient level of operation of a given unit. Hence
by dividing the overall expenditure into its individual line items and using these line items as
inputs, the analyst can identify the specific part of the overall expenditure that needed to be
adjusted for a DMU to achieve an efficient rating. Otherwise, it would have been most prudent to
clump all expenditure into one figure.
In this study, the input variables TDIEXP (Instructional Expenditure), TOPP (Physical
Plant Expenditure), OEAS (Administrative Services Expenditure) and STUSERV (Student
Services Expenditure) were all line items of the overall expenditure figure. These line items were
of special interest to the study and their data were readily available, so were included into the list
of input variables.
Finally as pointed out by Cooper, Seiford and Tone (2000), DEA allowed both. the output
and input variables to have the property on Unit Invariance. This means that the variables of the
model could have different units without having any effect on the results of the model.

72
3.5 Outputs to the Study
In this section the origin and usefulness ofthe outputs ofthe study were identified and described ..
The first one code named TOTREV represented the revenue earned by contact hours
through the state funding formula. This total revenue received by the colleges includes tuition,
fees, credit free programs, contracts and Government Appropriations. Grouped into the
Government Appropriations are the Current Unrestricted funds from the State of Connecticut
General Fund and Operational Budget along with the Current Restricted funds, which come from
the Federal funding, State Appropriations, Private contracts and grants. This TOTREV sum is
viewed as a payment the colleges received for the services they have provided. It is the revenue
earned for contact hours (TSCHRS) through the State Funding Formula. This revenue figure was
obtained from the Connecticut Community College System Statement of Revenues, Expenditures
and other charges ( FWRREOB) for the fiscal year 2000.
T}Je second output code named TGANG was the total number of students who completed
degree and certificate programs. The aim of this output was to include also the students who have
completed enough courses to hold a job in the specific field of study. However, this type of data
was not available for the academic year of 1999-2000. This piece of data originated from the
Connecticut Community Colleges Report on the Associate Degrees and Certificates Awarded in
the period July 1, 1999 to June 30, 2000.

73
The third output carried the code name SUCPER that represented the percentage of all
courses that were taken by the students for the academic year for which they received a credit
awarding or successful grade.
The fourth and by far the most difficult to obtain output, were the total successful courses,
SUCGRDS, taught by the faculty. The figure represents the total of instructional courses for which
matriculating and non-matriculating students did receive a passing grade or a credit receiving
grade, that is, a grade from A to D- and P at each college. There were many students who attended
the community colleges and did not receive a diploma or a certificate for the courses that they
completed. Hence, they were not counted as graduates. They were merely there to take a few
courses, to sharpen their skills, change their career or increase their knowledge base. Then to truly
measure the deliverability of the colleges, the successful courses of the non-matriculating were
added to the successful courses of the matriculating students. This figure had an indication of
college/ student success on the teaching to learning interface and was extracted from the data of
the Grade Distribution Report at the respective registrars' offices at each college.
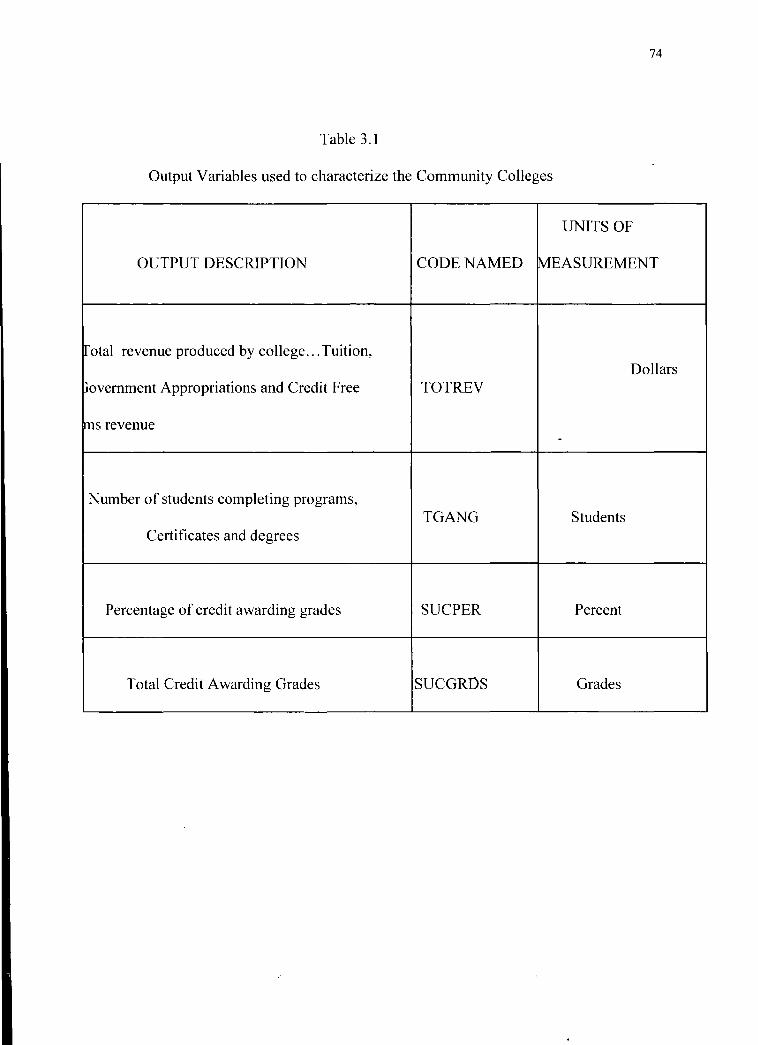
74
Table 3.1
Output Variables used to characterize the Community Colleges
UNITS OF
OUTPUT DESCRIPTION CODE NAMED MEASUREMENT
rotal revenue produced by college ... Tuition, Dollars
)overnment Appropriations and Credit Free TOTREV
ms revenue -
Number of students completing programs. TGANG Students
Certificates and degrees
Percentage of credit awarding grades SUCPER Percent
Total Credit Awarding Grades SUCGRDS Grades
75
3.6 Inputs to the Study
As mentioned in the section on the accreditation of the colleges in the system, the colleges were
encouraged to create a learning environment for the students, and in order to do this, resources
must be expended to ensure that adequate instructional area, library facilities, academic and
administrative suppm1, instructors and contact hours of instruction were made available for the
students.
In this section, described seven inputs that are used to maintain the learning
environment of the colleges.
The first one was code named TSCHRS, which represented the total student contact hours
generated by each college. This includes the lecture and laboratory (where applicable) hours for
one course per week times the number of students times the number of weeks of instruction times
the total number of courses ofiered in the academic year. This input is used in the State Funding
Fonnula and so it is audited to guarantee that only students enrolled in a course unique to a given
program are counted. This figure represents an input to the output revenue (TOTREV) generated
and number of graduates (TGANG).
FTEINST was the code name for the second input to the DEA model. This name
represented the number of Full Time Equivalent (FTE) Instructors in each college. FTE status was
based on a 12 credit hour load for part time staff members. This piece of data was the least
ambiguous and considerably easier to obtain.
76
The third input to the system was code named TISQRFF and designated the facilities
allocation of square feet assigned to each college for classrooms, offices, laboratory use and library
facilities. These are important variables that the college administrators must keep in sight in order
to maintain the respective accreditation level at each college.
The fourth input to the model was the total direct instructional expenditure, TDIEXP,
which included salaries for instructors, equipment and instructional supplies. This figure was very
simply expressed and easily obtained.
The fifth simple but important input that assisted in the characterization of the college
operation is the total operational expenditure for the physical plant, TOPP. This included the
annual cost of maintenance of the entire college buildings and grounds, custodial services and any
other miscellaneous work done on the respective facilities. It should be noted that the cost for new
buildings was not included in this variable. Although new structures were being erected on
different campuses during the 1999-2000 academic year, this was not done uniformly at all the
colleges in the system.
The sixth input was concerned with the support the students received from both the
administrative and academic sides of the college. This figure was code named OEAS that stood for
the overhead expenditure for administrative and academic support.
The seventh input to the model was code named STUSERV, which represented the total
expenditure on student services outside the regular academic and administrative student support
services. This figure entailed the resources expended on college supported student club activities,
dances, trips, expenditure on the student activity room and some cafeteria costs.

77
Table 3.2
Input variables used to characterize the Community colleges.
INPUT DESCRIPTION UNITS
CODE NAMED OF MEASURE
I. Student
contact hours generated by each college TSCHRS Hours
2. Number of full-time instructors· FTEINST Instructors
3.Total Square footage of classrooms, laboratories and TISQRFT Square feet
library
4. Direct Instructional Expenditure TDIEXP Dollars
5. Total Operational Expenditure for Physical Plant,
Grounds and Custodial Services TOPP Dollars
6. Expenditure for Academic and Admin.
Support OEAS Dollars
7. Student Services Expenditure STUSERV Dollars

78
3. 7 Non-categorical variables
It is very easy to be absorbed into the belief that once the inputs and outputs of the DEA
model characterizes all the tangible variables of the operation of a college, the efficiency results
produced by the model would be foolproof and very accurate. However, as Ray(l988) had
pointed out, that there are latent parameters hidden in the DMU (college) operations that would
hinder the DMU from showing a 100% efficiency.
Up to this point, one assumed that the manager of the DMU that was analyzed could
change all the inputs and outputs of the model at the discretion of the analyst. These variables
that could be easily varied, were referred to as Discretionary Variables. However, there were
input variables that were not or could not be manipulated by the analyst. And these were
classified as Non-Discretionary Variables. As cited by Banker and Morey(l986) , such variables
were exogenously fixed , like "the age of a store," when using DEA to evaluate the
performances of 60 DMUs in a network of fast- food restaurants. To further clarify the issue of
these phantom input variables. I considered an explanation from Ray, 1988:
If two firms from the same combination of inputs produce different volumes, the reason
has to lie in the fact that there are other inputs or external conditions relevant to the production
function which has been ignored, and which are not identical for both firn1s. The maximum
output conesponding to any specific combination of a limited number of inputs explicitly
accounted for is realized only when the most favorable configuration of the excluded influencing
factors are obtained.
The above quote acknowledged the fact that many other researchers had encountered, the
mysterious external input factor over which the analyst or manager had no control.

79
In the analysis of the twelve community colleges of the system in Cmmecticut, there
were inputs that were exogenously fixed to each college. This was demonstrated as I considered
the fact that five of the community colleges were combined with five technical colleges to form
five community-technical colleges. The other seven community colleges were merely given the
name community-technical without a technical arm. Hence, from the inception of this analysis
there were inherent difierences between these two groups of the community colleges within ·the
same system. This difierence in the basic make up, was the first potential source of non
discretionary or non-categorical inputs to affect the efficiency determination procedure using the
DEA that should be considered.
Within the group of combined colleges, for example, Greater Hattford Community
College and Hartford State Technical College combined to form what is now Capital Community
College. There were cultural differences between the individual colleges, and so, for these two
separate entities to operate under the umbrella of Capital Community College, both cultures were
adopted and satisfied. This combination introduced a considerable quantity of Non-categorical
influencing inputs that was considered when I examined the relative efficiency performance of
each colkge.
There were many more non-discretionary inputs that were considered influencing
factors on the analysis. They were as follows: (a) Geographic Jurisdiction (urban, rural,
industrial, residential). The Legislature of the State of Connecticut divided the state into
twelve regions for which each Community College had first preference for recruiting
students. DitTerent types of students come from different part of the state, (b)
Socioeconomic background of the students at each college was another difficult factor to
measure but very latent and present input to the model.

Chapter 4
Analysis of Data
4.1 Description of DEA (Frontier Analysis) Model
80
Administrators are continuously under pressure to improve the performance of their
institutions and make the best of available resources. Frontier Analysis can assist in the
determination of the relative efficiency of each organizational unit, be it a department, a
bank, a branch, a college or anything else that you manage. Frontier Analyst as the DEA
model of this study is called, is a Microsoft Windows based efficiency analysis tool,
which uses the technique of Data Envelopment Analysis (DEA) to determine the relative
efficiency of the units, which perfom1 approximately the same duties. This model is then,
best suited for use with organizations or systems like banks, hospitals, colleges, which
have various branch units perfom1ing the same tasks. As mentioned earlier in this study,
the DEA technique originated from the analysis done on not-for-profit public sector
organizations where measures other than purely financial were needed to assess
performance.
To facilitate the applicative mode of this study, actual development of computer
code for the DEA was omitted and a software package from the Banxia Software
Company of the UK was used to develop the model.
The description of this model was divided into three main parts: a) Basic data
entry, b) Structuring of the project, c) Analysis of the Results. To begin the
performance analysis of a group of units, it was necessary to identify the two main
operators (variables) within the study: namely the Inputs (resources) and the Outputs
(products). The mathematical product of model- determined Weights( as discussed in

81
previous chapters of this study) and the corresponding variables yielded the Virtual
Inputs and Vi1iual Outputs. The ratio of the sum of the Virtual Outputs to the sum of the
Virtual Inputs for each unit was determined across all the variables, which resulted in the
relative efficiency score for each ofthe units being analyzed.
A comparison between the inefficient units and the benchmark efficient units was made,
and so, any potential improvements identified for the low performing inefficient unit,
were realistic and highly achievable. The selection of the inputs and the outputs that were
used in this efficiency assessment study was extremely important because these variables
actually defined the basis on which the efficiency of the units was calculated. Hence, only
those input and output variables that are most relevant to the operation ofthe units should
be included in the study.
A) Basic Data Entry
Data can be entered into this model in three different ways: a) by pasting data from the
clipboard, b) Importing data from disk file and c) manual data entry into the data viewer.
The direct data entry into the data viewer was the simplest procedure and was the method
selected to enter the data for this study. There was a safety feature for entering data into
this model: a blank cell will appear with a pink background to indicate it is empty,
however, immediately upon entering a value for a variable the background of the cell
changes to blue, yellow or green according to the type of input or output type entered.
The Input /Output type can be one of the following:
Controlled Variable A controlled input or output variable was one which the
management of the unit has control, and so the analyst can
vary the amount of resource used or product produced.

Uncontrolled Input
Output
Text
Date
These were sometimes refened to as the Discretionary
Variables. Upon entering this variable value into a cell it
turns light green
82
An uncontrolled variable is one over which the
management has no control and so cannot change the level
of use or production. These are referred to as Exogenuously
Fixed or non-discretionary variables.
Outputs are products that result from the processing and
consumption of inputs (Resources). These can be goods,
services or even, how effectively a unit has achieved its
goal. The cell turned light blue once this type of variable
was entered.
Text tields are not analyzed. They are used to filter units
into regions or categories
Date text fields are not analyzed. They are used to filter
units by periods.
Data Envelopment Analysis did not process zeros in the data set. In the event the data
contained a zero the system will allow you to replace this zero by a very small number.
This feature for selecting to use a small number instead of a zero, is strictly optional and
not automatic, so once a zero appeared in the data set the researcher using the DEA
would know and would be able to make the necessary changes. The general editing of
data in this system followed all the rules of a spreadsheet similar to Microsoft Excel.
83
Once the model was run with a selected group of units, Input and Output
variables, the system allowed the researcher to deactivate any parameter that would alter
the results of the next run of the system. Hence, one can chose the variables that can
produce the best impact on the determination of the performance of the colleges.
However, this was only done during the sensitivity analysis section of the study.
This feature, of being able to select effective variables, gave the model the most
flexibility. It allowed the researcher to experiment with the data and get a feel for the
most important or influential variables and units for the determination of the relative
efficiency of each unit in this study.
B) Project Structuring
In this section there were two major decisions that were to be made concerning the
method by which the data of this model should be analyzed. The first was to choose
whether the model should minimize the inputs or maximize the outputs. Since DEA was
used to determine the relative efficiency of similar units, the model can do one of the
following:
a) For a given level of output of a unit one can determine by how much can the
input of the unit be decreased and still maintain the same level of output. This
process is known as Input Minimization.
b) For a given level of input of a unit, what level of output can this unit produce?
This is Output Maximization.
For this project, because of the budgeting process at an educational institution, where a
finite amount of resources was allocated to perform tasks of varying outputs, the Output
Maximization option was selected.
84
The second decision for the structuring of this project was the determination of
the type of Return to Scale that should be applied to this model. If the data suggests that
there is a linear relationship between the inputs and the outputs of the model, by that I
mean, if for a given increase of the inputs values there is a corresponding increase in the
outputs and vice versa, then there is a Constant Return to Scale of the data of the model.
This data would be best suited by the use of the CCR Model (named after Chames,
Cooper and Rhodes, 1981)
In this research the data showed the expected linearity in the relationship between the
values ofthe inputs and those of the outputs, this was evident because of the high degree
of correlation that existed between them. This suggested that a model using a
characteristic Constant Return to Scale should be used. The CCR model with the straight
frontier line, which was built on the assumption of Constant Returns to Scale, as opposed
to the BCC Model (named after Banker, Charnes and Cooper, 1981) which had its
production frontiers developed by the convex hull of the existing units, was favored for
the analysis of the data.
Figure 4.1 and Figure 4.2 below show the graphical representation of the CCR and the
BCC models each using six units (A ....... F) with one input and one output.
The straight line production frontier which connected the origin to the best performing
unit( B) in the set in figure 4.1 , represented the 100% efficiency rating. It must be noted
that in the DEA procedure, the etliciency of the units of a system is detern1ined relative
to the best performer of the system, as opposed to the comparison made to the average in
statistical methods. The line OB represented the best conversion of the input to output
within the group of units, and so the efficiency figures of all the other units were

85
determined relative to OB. The CCR model had a lesser number of efficient units as
compared to the BCC model, which used the production frontier line formed by the
convex envelope of they-axis, the units and the x-axis. Banker et al , 1984, have shown
that the assumption of the CCR or Constant Return to Scale approach is appropriate
when all the DMUs are operating at an optimal scale and factors like imperfect
competition and constraint on finance may cause a DMU not to operate at optimal scale.
As shown in the Figure 4.2, the BCC or the Variable Return to Scale method
would produce more efficient DMUs on the frontier line; however, this model has a
unique facility of being able to produce different results as the orientation from Input to
Output is varied. These two measures (input and output orientation) are the same in the
CCR Model, but do not have the same value in the BCC model. The choice of orientation
has both practical and theoretical implications. In some applications, the choice of the
orientation is clear, for example, in industries where the emphasis is on cost-control, the
natural choice would be an input orientation (Ferrier and Valdmanis, 1996). Quite a few
studies have shown an inclination to input-orientated measures because the input
quantities appear to be primary decision variables. This argument may not be valid in all
industries, because restricting attention to a particular orientation may neglect major
sources of teclmical efficiency in other direction. Nonetheless, I should point out that
output- and input-orientated models would estimate the identical frontier and identify the
same set of efficient DMUs. Only the et1iciency measures associated with the inefficient
DMUs may vary between the two models.

86
To lend a level of completeness and to expose an attractive and useful alternative to the
CCR Model of this study, I have included in the Appendix Fa DEA run on the variables
using both the input and the output orientation in the BCC model. The results of the BCC
Model were not very surprising because BCC Model uses a convex frontier line On
which many more DMUs ( as compared to the CCR Model ) were able to attain the 100
%efficiency. In this case the model had eleven efficient units and one was tagged as ·
inefficient. Northwest Community College, which was deemed inefficient with the CCR
Model, was again determined to be inefficient (92.56 %) by the BCC Model. A summary
of the results is presented in Appendix F.

Figure 4.1 Production Frontier Lines for the CCR Model
4.5
4 - - -
3.5
'$ 2.5 t-----~ Q. .. :I 0 2
1.5 --- -·-··-· ·-·
87
O~----~--~----------~----------r---------~----------~----------4 0 2 3
Input
4 5 6

88
Figure 4.2 Production Frontier Lines for the BCC model
4.5
4
3.5
3
'5 2.5 c. '5 0 2
1.5
0
C) Results of the Model
2 3
Input
4
The model yielded a considerable amount of important inJ~n11ation that assisted in
5
answering the three research questions set out by this study. from the model analysis the
following was made available:
i) Main score display- This is the efficiency scores that have been
ca lculated for each of the units. which were active in the dataset.
ii) For each active unit of the study the model calculated: Potential
Improvement, Reference Comparison, Reference Contribution and
Input/Output Contributions.
6

89
4.2 Analysis of Modi eR Data
The selection of the inputs and outputs that were used in the efficiency assessment of these
community colleges was particularly important, and it must be reiterated, that they defined the
basis on which the efficiency of these units (colleges) were assessed. Hence, only those inputs and
outputs that were most relevant to the function and characterization of the units were included in
the analysis.
In the previous chapter I recognized seven inputs, which I strongly believed,
characterized the operations of a community college of this system, from the input end. And
although all the data was collected for these input variables, as shown in the Appendix section of
this study, all were not included in the study because of the high level of correlation that existed
between these input variables. The table that followed demonstrated the level of C01Telation that
was observed between the Input variables. It was very important to acknowledge the fact that the
number of units and the number of input and output variables that could have been used,
handicapped this study. As developed by Seiford et al (2000), in the study of Statistics and other
empirical oriented procedures, there has been a problem involving the degrees of freedom, which
was compounded in DEA because of its multiple use of Linear Programming in the determination
of relative efficiency of the units. In DEA, the number of degrees of freedom increased with the
number of units and decreased with the number of inputs and outputs. A rule of' thumb that
provided rough guidance for this study was:
N :::_ max {m* s, 3(m + s)}
Where N= number of units, m = number of inputs and s = number of outputs

90
To make an efficiency determination on the twelve units of this study, the number of input/output
variables must meet or be in close proximity to the criterion set by the rule of thumb. The original
number of these variables has already been reduced due to heavy correlation that existed between
these variables ( as shown below on Table 4.1 ). Only three inputs and four outputs that merely
characterize the operation ofthe colleges were used. TheN value( 12 colleges) is fixed, and so, the
m and s values could have been varied to perfectly meet the rule of thumb requirement, but by
reducing these values the characterization of the individual college is also reduced. Hence, a
compromise must be struck. The decision to use three inputs and four outputs puts the N value
within the vicinity ( not equal to ) of the rule of thumb. As shown in the Sensitivity Analysis of
Section 4.7, the results of the study can be affected by changing the number of input/output
variables, however, the selection of the number of Input/Output variables was kept fixed for the
entire study which means that all the colleges were subjected to the same level of scrutiny.
Table 4.1 XY Correlation between Input variables
TSCHRS TISQRF TDIEXP TOPP OEAS FTEINST STUSERV
TSCHRS 1 .80 .95 .95 .94 .14 .05
TISQRF .80 1 .88 .87 .75 .53 .05
TDIEXP .95 .88 1 .87 .91 .36 .00
TOPP .95 .87 .87 1 .86 .18 .11
OEAS .94 .75 .91 .86 1 .25 .04
FTEINST .14 .53 .36 .18 .25 1 -0.16
STUSERV .05 .05 .00 .11 .04 -0.16 1

91
From the level of correlation that existed between the variables: TSCHRS, TISQRF,
TDIEXP, TOPP and OEAS as shown in the above table, the study used one variable,
TSCHRS as a surrogate for the five closely correlated input variables. This reduced the
input variables list to three: FTEINST, STUSERV and TSCHRS. The number of output
variables was the lowest at four: TOTREV, TGANG, SUCGRDS and SUCPER There
was insufficient good data to use EAS as a variable and so it was omitted. The Input and
Output variables that were not used directly in the study were very important to the study
and were used to compare units where the model was not making any direct comparisons.
These variables were carried in the tables in the Appendix to facilitate discussions on the
performance of the individual colleges.
In an effort for the DEA Mode( to adhere to the rule of thumb outlined above, the
number of variables was reduced from seven (three inputs and four outputs) to four (two
inputs and two outputs). TSCHRS the Total Student Contact Hours and FTEINST,
Number offulltime equivalent instructors were selected as inputs while, TOTREV, Total
Revenue produced by the college and TGANG, the number of students completing
degrees and certificates, were used as output variables to the model. Since the number of
units in the system was fixed at twelve, the only other alternative to bring the analysis
within the rule of thumb was to change the number of variables. By reducing the number
of variable the model further lost its ability to characterize the operations at the
community colleges.
The results showed ten colleges were inefficient and two efficient and the scores obtained
by the individual colleges are quite different. The table below shows a comparison of the

efficiency scores obtained from the model when seven variables were used versus four
variables.
Table 4.1.1 Comparison of Efficiency Scores with Different number of variables
UNITS (Colleges)
Quinebaug Valley
Asnuntuck
Middlesex
Capital
Housatonic
Manchester
Gateway
Three Rivers
Northwestern
Tunxis
Norwalk
N augatuck Valley
Score w/ seven
Variables
100.00
100.00
100.00
100.00
100.00
100.00
100.00
95.23
91.38
90.01
86.12
73.92
Score w/ four
Variables
97.34
100.00
87.43
100.00
85.81
81.10
86.29
85.00
90.66
90.01
85.62
90.66
92

4.3 Analysis of Mod en Resunts
Two separate software systems: Banxia Software Analysis and Data Envelopment
Analysis by Seiford et al, were run for this analysis. Both systems developed the same
number of efficient and inefficient units in the college system
The analysis of the results developed three phases, in which each phase provided an
answer to the following research questions of this study:
A. How do the colleges of the Community College System of Connecticut
compare to each other regarding their levels of efficiency?
93
B. What conditions may account for the differences in the level of success within
similarly efficient colleges?
C. What factors or constraints create the varying scores among inefficient?
Colleges?
The tirst research question:
How do institutions of the Community College System of Connecticut
compare to each other regarding their levels of Efficiency?
This research question was addressed directly by the results of the model, that showed
seven of the colleges had a 100% efticiency and the remaining five colleges of the system
were below the 100% efficiency level. For the period 1999- 2000 and only that period,
Quinebaug, Asnuntuck, Middlesex, Capital, Housatonic, Gateway and Manchester
Community Colleges demonstrated a performance level of 100% efficiency. This
detem1ination was based on the following variablesofthe DEA Model: Total student

94
contact hours, TSCHRS, the number of full time equivalent instructors, FTEINST, the
expenditure on student services, STUSERV, the total number of graduates, TGANG, the
total credit awarding grades, SUCGRDS, the total revenue that was generated by the
colleges, TOTREV and the percentage of credit awarding grades given at the college,
SUCPER. Based on these variables and only for the period 1999-2000, the model showed
that Northwest, Naugatuck, Tunxis, Three Rivers and Norwalk Community Colleges
demonstrated less than I 00% level of efficiency. This data is presented in Table 4.2

TABLE 4.2 EFFICIENCY SCORES
UNITS (Colleges) Score w/ seven variable
Quinebaug V alley 100.00
Asnuntuck 100.00
Middlesex 100.00
Capital 100.00
Housatonic 100.00
Manchester 100.00
Gateway 100.00
Three Rivers 95.23
Northwestern 91.38
Tunxis 90.01
Norwalk 86.12
Naugatuck Valley 73.92
Although the model was very discriminating in the selection ofthe etlicient
and less efficient units, there were many non-categorical variables that were
not parametrically quantified in the input or output lists. The socio
economic factor (which has shown, in .lesson et al, 1987, to have a direct
correlation to students' perfonnance) in the given service region for each
college varied as there were colleges. The type of the service areas (Rural
or Urban) for which the colleges provide a tertiary education was also not
facto red into the model, the colleges that resulted from the merger of the
95

Community and Technical colleges and many more non-categorical
variables of the educational process at the community colleges, were
omitted from the study, mainly due to a lack of good available data, affected
the results ofthe study.
The efficiency score for each unit was further analyzed to determine the
dependence of each unit on the input and output variables. This was a very
useful indication of which inputs and outputs were dominant in the
determination of the efficiency score for each unit. However, this did not
mean that the other variables were omitted from the study. It was noted that
at any instant, if the model had inputs and outputs that were politically
important and were not used as dominant part of the efficiency
determination of the units, then the model would have been forced to
consider these politically influenced input/output variables using a
Weighting Facility of the model
To facilitate an analysis of the input and output variables contribution to the overall
efficiency of each unit, the following subscripted letters were use to represent the
variables:
INPUTS
VI.. ........ TSCHRS-- Total Student Contact Hours.
V2 ........... FTEINST- Full time Equivalent Instructors.
V3 .......... STUSERV- Expenditure for Student Services.
96

OUPUTS
Inputs:
Slacks:
U 1 ......... TOTREV- Total Revenue form Tuition, Fees and Government Appropriations.
U2 ........... TGANG - Number of Students completing Programs.
U3 .......... SUCGRDS- Total Credit Awarding Grades given by Faculty
U4 ........... SUCPER- Percentage of Successful Grades Awarded
.85 (V1)
0
Asnuntuck College · Efficiency 100 %
.15 (V2) 0.0 (V3)
0 0
Outputs: 1.0 (U1) 0.0 (U2) 0.0 (U3) 0.0 (U4)
Slacks: 0 0 0 0
97
Asnuntuck College had an et1iciency rating of 1 00 % and in order to achieve this level of
performance, the college relied on 85 %of the 'total student contact hours' and 15 %of
the number of 'fulltime equivalent instructors.' This performance also accounted for
100% ofthe 'total revenue from tuition, fees and government appropriations' output.
This result was quite understandable and reasonable because of the heavy dependence of
the Government Appropriations on the student contact hours
. This does not mean that if the other variables were eliminated the same level of
performance would be obtained for the unit.

Inputs: 1.00 (V1)
Slacks: 0.0
Outputs: 1.00 (U1)
Slacks: 0.0
CapitaD Community CoiRege Efficiency 100%
0.0 (V2)
0.0
0.0 (U2)
0.0
98
0.0 (V3)
0.0
0.0 (U3) 0.0 (U4)
0.0 0.0
The 100 % efficiency of Capital ~ommunity College was accounted for by 100 % of the
'total student contact hours' input and 100 % of the 'total revenue from tuition, fees and
Government appropriations' output variable. It should be noted that although Capital
Community acquired an efficient rating it did so using slightly different spread or mix of
the input and output variables, as was demonstrated by all the efficient units. This unit
showed the dependence on only two variables, which was not a very technically balanced
mode of operation of this unit.
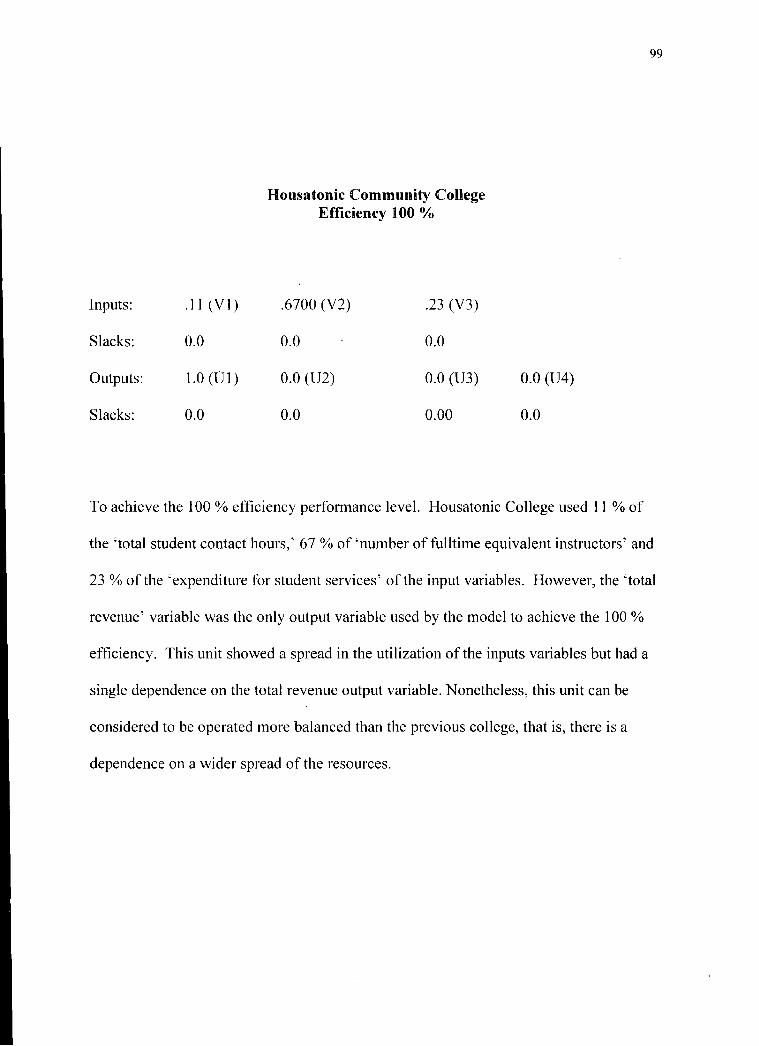
Inputs: .11 (V 1)
Slacks: 0.0
Outputs: 1.0(01)
Slacks: 0.0
Housatonic Community College Efficiency 100%
.6700 (V2) .23 (V3)
0.0 0.0
0.0 (U2) 0.0 (U3)
0.0 0.00
0.0 (U4)
0.0
To achieve the 100 % efficiency performance level. Housatonic College used 11 %of
99
the 'total student contact hours,' 67% of 'number offulltime equivalent instructors' and
23% of the 'expenditure for student services' of the input variables. However, the 'total
revenue' variable was the only output variable used by the model to achieve the 100 %
etliciency. This unit showed a spread in the utilization ofthe inputs variables but had a
single dependence on the total revenue output variable. Nonetheless, this unit can be
considered to be operated more balanced than the previous college, that is, there is a
dependence on a wider spread of the resources.

Inputs: .718(Vl)
Slacks: 0.0
Outputs: .452(Ul)
Slacks: 0.0
Gateway Community College 100 % Efficiency
0.09V2) .282(V3)
0.0 0.0
.336(U2) .212(U3) O.O(U4)
0.0 0.0 0.0
100
Gateway Community College 100% efficiency achievement was attained differently from
the previous units. 71.8% of the' total student contact hours' and 28.2% ofthe'
expenditure for student services' input variables, plus 45.2% of 'total revenue, 33.6%
of the 'Number of student completing programs' and 21.2 5 of ' total credit awarding
grades given by the faculty', were all responsible for the efficient rating of the college.
This demonstrated a balanced unit as far as, the utilization of the resources and the
production of outputs.
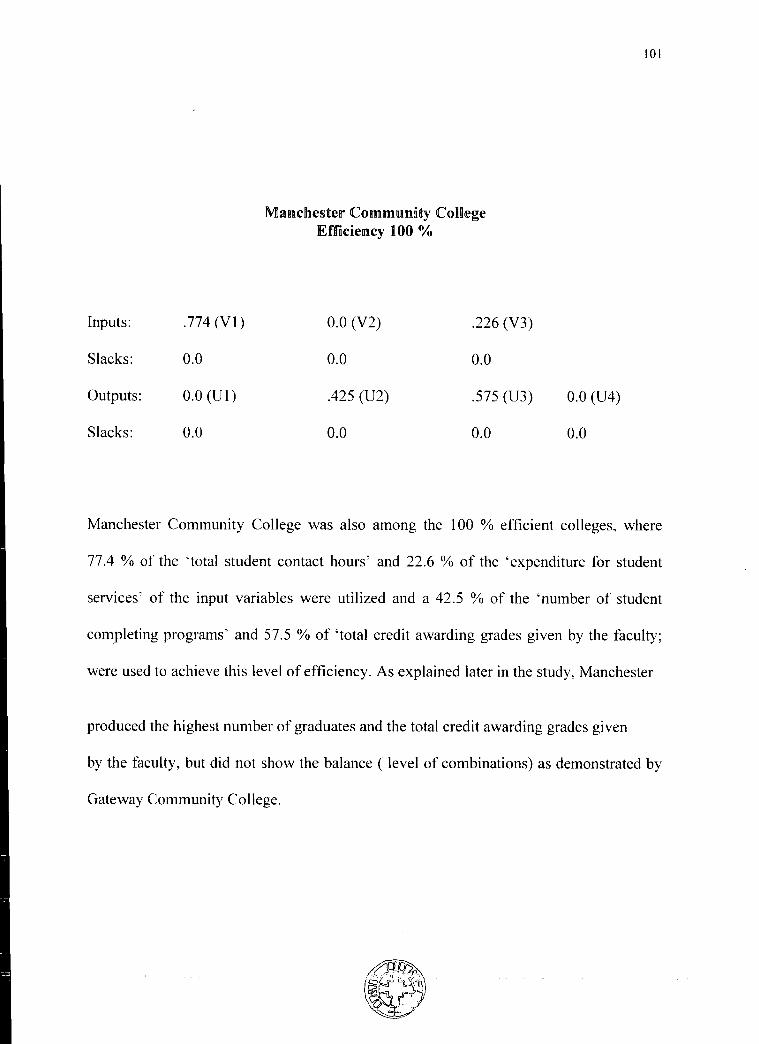
Inputs: .774 (Vl)
Slacks: 0.0
Outputs: 0.0 (Ul)
Slacks: 0.0
Manchester Commumity College Effnciency 100 %
0.0 (V2) .226 (V3)
0.0 0.0
.425 (U2) .575 (U3)
0.0 0.0
101
0.0 (U4)
0.0
Manchester Community College was also among the 100 % efficient colleges, where
77.4 % of the 'total student contact hours' and 22.6 % of the 'expenditure for student
services' of the input variables were utilized and a 42.5 % of the 'number of student
completing programs' and 57.5 % of 'total credit awarding grades given by the faculty;
were used to achieve this level of efficiency. As explained later in the study, Manchester
produced the highest number of graduates and the total credit awarding grades given
by the faculty, but did not show the balance ( level of combinations) as demonstrated by
Gateway Community College.
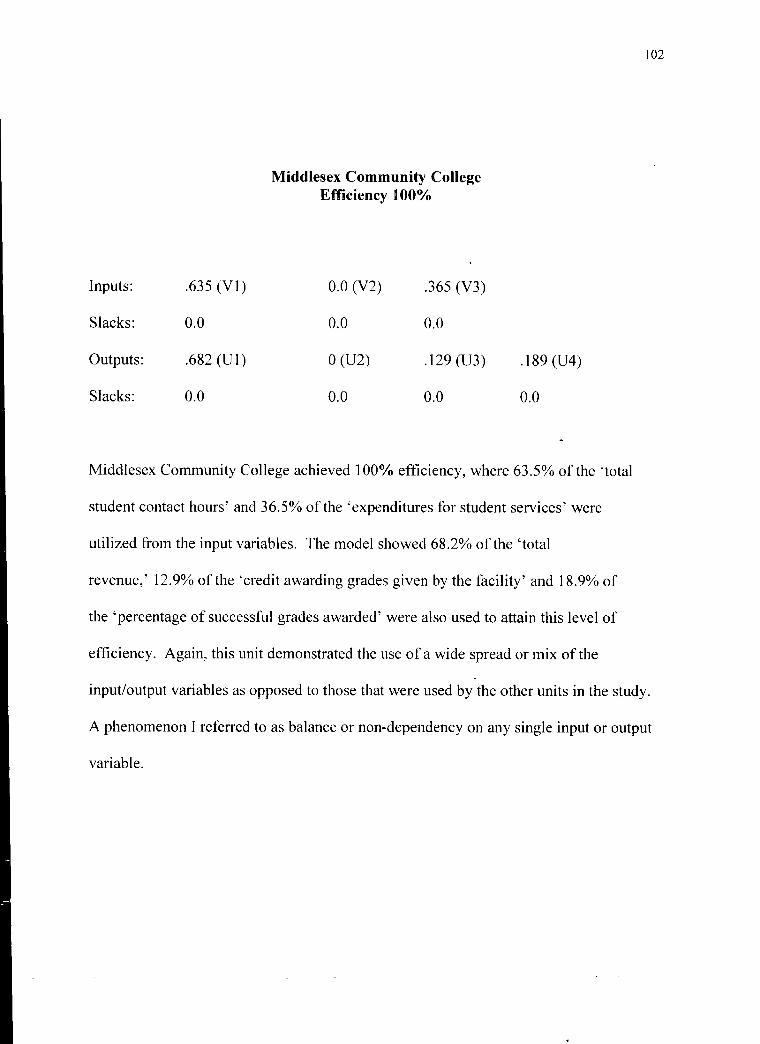
Inputs: .635 (Vl)
Slacks: 0.0
Outputs: .682(Ul)
Slacks: 0.0
Middlesex Community College Efficiency 100%
0.0 (V2) .365 (V3)
0.0 0.0
0 (U2) .129 (U3)
0.0 0.0
.189 (U4)
0.0
Middlesex Community College achieved 100% efficiency, where 63.5% ofthe 'total
student contact hours' and 36.5% of the 'expenditures for student services' were
utilized from the input variables. The model showed 68.2% of the 'total
revenue,' 12.9% ofthe 'credit awarding grades given by the facility' and 18.9% of
the 'percentage of successful grades awarded' were also used to attain this level of
efficiency. Again, this unit demonstrated the use of a wide spread or mix of the
102
input/output variables as opposed to those that were used by the other units in the study.
A phenomenon I referred to as balance or non-dependency on any single input or output
variable.

Inputs:
Slacks:
Outputs:
Slacks:
Northwest Community College Efficiency= 9L4%
.563 (VI) 0 (V2) .437 (V3)
0.0 6.705 0.0
.353 (Ul) .647 (U2) 0.0 (U3)
0.0 0.0 .51
0.0 (U4)
11.07
This unit was deemed inefficient by the model with 91.4% performance efficiency,
utilized 56.3% of the 'total student contact hours' and 43.7% ofthe 'expenditure for
student services.' of the input variables, and 35.3% of the 'Total Revenue from fees,
103
tuition and Government Appropriation' and 64.7% of the 'number of student completing
programs' of the output variables to acquire this level of efficiency. This college could
have increased their outputs by [(I /eff.)- I], 9.4% and increase the total credit awarding
grades given by faculty by .5, without any increase of expenditures.

Inputs: 0. (Vl)
Slacks: 0.0
Outputs: .836 (Ul)
Slacks: 0.0
Quinebaug Community CoBiege 100% Efficiency
.510 (V2) .49 (V3)
0.0 0.0
0 (U2) 0 (U3) .164 (U4)
0.0 0.0 0.0
104
Quinebaug Community College achieved the 100 % efficiency rating by utilizing 51 % of
the 'number of full time equivalent instructors' and 49 % of the 'Expenditure for student
Services' input variables. The model showed that 83.6% of the 'total revenue' and
16.4% of 'percentage of successful grades' was used to acquire the et1icient status for
this unit. The zero weights on the two output variables, showed that Quinebaug
Community College could not have depended on the number of students completing
programs and the total credit awarding grades given by the faculty, to attain an efficient
score.
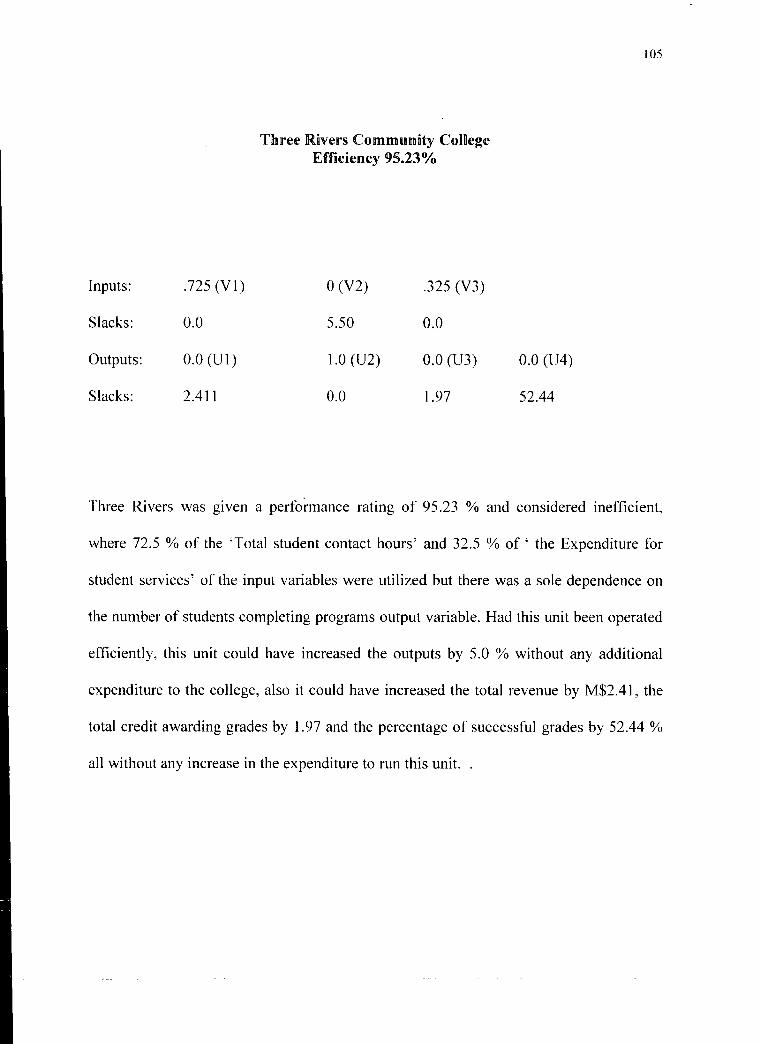
Inputs: .725 (V1)
Slacks: 0.0
Outputs: 0.0 (U1)
Slacks: 2.411
Three Rivers Commmrnnty CoiDege Efficiency 95.23°/o
0 (V2) .325 (V3)
5.50 0.0
1.0 (U2) 0.0 (U3)
0.0 1.97
105
0.0 (U4)
52.44
Three Rivers was given a performance rating of 95.23 % and considered inefficient,
where 72.5 % of the 'Total student contact hours' and 32.5 % of' the Expenditure for
student services' of the input variables were utilized but there was a sole dependence on
the number of students completing programs output variable. Had this unit been operated
efficiently, this unit could have increased the outputs by 5.0 % without any additional
expenditure to the college, also it could have increased the total revenue by M$2.41, the
total credit awarding grades by 1. 97 and the percentage of successful grades by 52.44 %
all without any increase in the expenditure to run this unit. .

Inputs: .877 (V1)
Slacks: 0.0
Outputs: .717 (U 1)
Slacks: 0.0
1I'llllmds Community College Effnciency of 92.80%
0.0 (V2)
5.78
0:0 (U2)
24.0
106
.193 (V3)
0.0
.283 (U3 0.0 (U4)
0.0 57.62
The model adjudicated this unit as inefficient with its 92.8 % efficiency. The unit relied
on 87.7 % of the total student contact hours, 19.3 % of the expenditure for student
services and zero dependence on the number of full time equivalent to achieve this level
of efficiency. The college also depended on 71.7 % of the total revenue and 28.3 % of the
total credit awarding grades given by the faculty to attain the 92.8 % efficient level.
However, this unit could have increased the level of production of its outputs by [(I /eff.)-
1] that is, 7.75% without any further increases of the expenditure to run the college. The
slack of 5.78 on the number of full time instructors input variable indicated that this unit
could have reduced the number of full time instructors by 6 and still achieves the 7. 75 %
increase on the output variables. This college could have boosted the number of graduates
by 24 and increased the percentage of successful grades by 57.62 % without increasing
the expenditure.
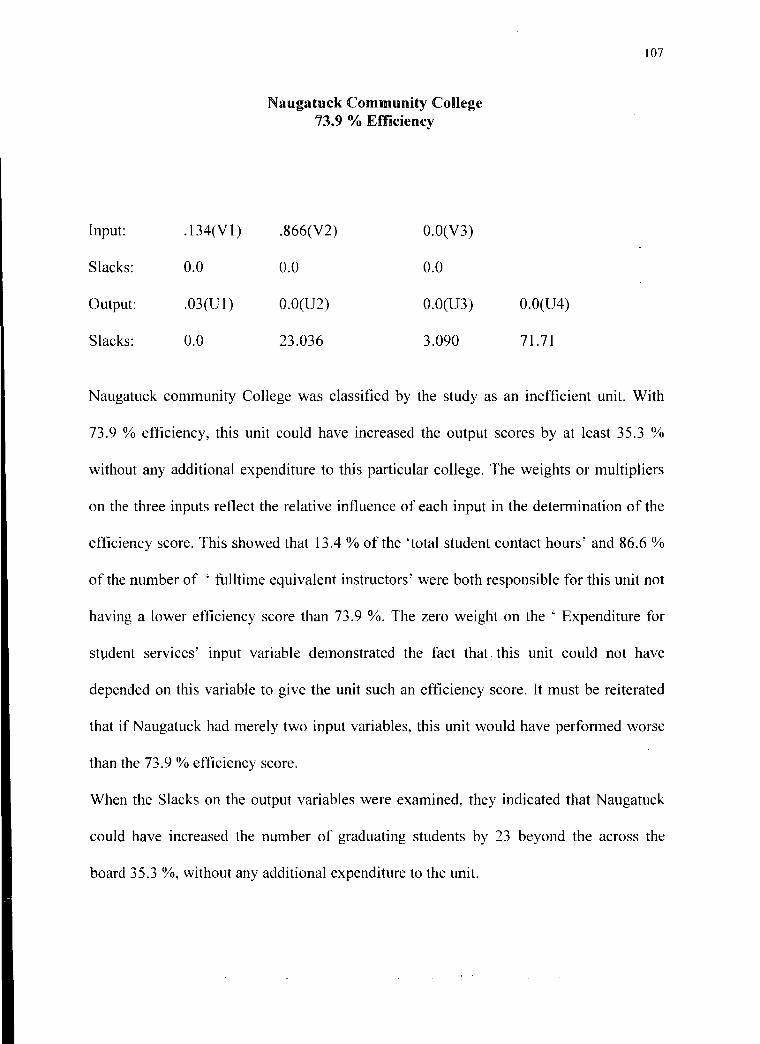
Input: .134(Vl)
Slacks: 0.0
Output: .03(Ul)
Slacks: 0.0
Naugatuck Community College 73.9 % Efficiency
.866(V2) O.O(V3)
0.0 0.0
O.O(U2) O.O(U3)
23.036 3.090
107
O.O(U4)
71.71
Naugatuck community College was classified by the study as an inefficient unit. With
73.9 % efficiency, this unit could have increased the output scores by at least 35.3 %
without any additional expenditure to this particular college. The weights or multipliers
on the three inputs reflect the relative influence of each input in the determination of the
efllciency score. This showed that 13.4 % of the 'total student contact hours' and 86.6 %
of the number of ' fulltime equivalent instructors' were both responsible for this unit not
having a lower etliciency score than 73.9 %. The zero weight on the ' Expenditure for
stl,.ldent services' input variable demonstrated the fact that this unit could not have
depended on this variable to give the unit such an efllciency score. It must be reiterated
that if Naugatuck had merely two input variables, this unit would have perfonned worse
than the 73.9% efficiency score.
When the Slacks on the output variables were examined, they indicated that Naugatuck
could have increased the mtmber of graduating students by 23 beyond the across the
board 35.3 %, without any additional expenditure to the unit.
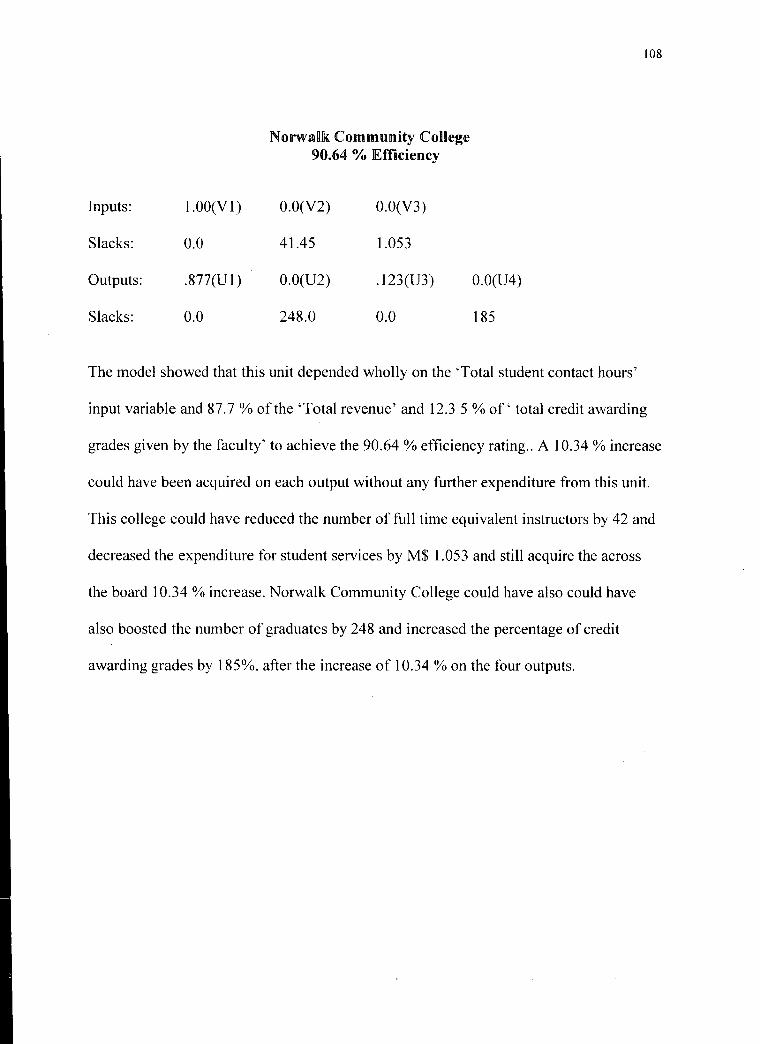
108
Nonvank Community College 90.64 % Efficiency
Inputs: l.OO(Vl) O.O(V2) O.O(V3)
Slacks: 0.0 41.45 1.053
Outputs: .877(Ul) O.O(U2) . 1 23(U3) O.O(U4)
Slacks: 0.0 248.0 0.0 185
The model showed that this unit depended wholly on the 'Total student contact hours'
input variable and 87.7% ofthe 'Total revenue' and 12.3 5% of' total credit awarding
grades given by the faculty' to achieve the 90.64 % efficiency rating .. A 1 0.34 % increase
could have been acquired on each output without any further expenditure from this unit.
This college could have reduced the number of full time equivalent instructors by 42 and
decreased the expenditure for student services by M$ 1.053 and still acquire the across
the board 10.34 % increase. Norwalk Community College could have also could have
also boosted the number of graduates by 248 and increased the percentage of credit
awarding grades by 185%. after the increase of 10.34 %on the four outputs.

The second research question:
What conditions may account for the dlnfJferences in the DeveB of success witllnnn snmilarBy efficient colleges?
109
Although a large percentage of this question was answered in the response to the first
research question, an attempt is made here to further explain differences that were present
in the efficient colleges. As was previously mentioned, Asnuntuck, Capital, Housatonic,
Manchester, Middlesex, Gateway and Quinebaug Community Colleges all demonstrated
a level of efficiency of 100%. To examine the differences in consumption of the
resources and the production of the output variables selected in this study, I made a side-
by-side comparison of the efficient units using all the variables of the efficient units of
the model. Table 4.3 shows the data of this comparison.
TABLE 4.3 COMPARISON OF THE EFFICIENT COLLEGES
Variables Asnuntuck Capital Gateway Housatonic Manchester
TSCHRS I., ~ . .) 4.9 6.2 5.4 8.3
TISQRF 6.4 17.7 15.7 10.3 10.3 TDIEXP 3.1 8.9 10 6.8 10 FTEINST 22 67 95 57 106 TOPP 0.67 1.3 1.4 1.3 1.7 OEAS 3.6 6.43 6.65 5.71 10.14 STUSERV 1.58 1.90 2.53 1.89 2.89 TOT REV 9.52 21.6 22.82 19.48 27.03 TGANG 197 292 393 286 577 SUCGRDS 6.3 7.5 15.62 14.39 18.77 SUCPER 80.5 38.93 76.2 74.24 73.32
TSCHRS --- Total student contact hours TISQRF --- Total instructional Area Footage TDIEXP --- Total Direct Instructional Expense FTEINST --- Full Time Equivalent Instructors TOPP Physical Plant Expenditure ( Grounds+Building Maint. +Custodial) OEAS ------- Overhead Expenditure for Administrative and Academic Support STUSERV --- Expenditure for Student Services
Middlesex
3.3 7 4.5 38 0.72 2.33 1.43 12.31 155 7.41 72.96
TOTREV ------ Total Revenue (Tuition, fee.Gov't funding and credit rree programs ) TGANG -------- Total number of graduates SUCGRDS ----- Credit awarding grades SUCPER -------- Percent of Successful grades
Quinebaug
2.1 3.8 2.4 21 0.65 3.24 1.34 8.52 127 4.49 74.24
Multi-Fact IOK hrs I OK ft!'2 $10K Instructo1 $I M $IM $I M $I M Graduate IK Grad( Percent

110
The most direct indicator of the provision of a quality education by each institution was
measured by the number of graduates being produced (TGANG) and the quantity of
credit awarding grades (sucgrds) given out at any one time. These two factors determined
both the quantity of education received by matriculating and non-matriculating students.
Hence, as indicated in the table above, Manchester Community College, by
producing 577 graduates and providing 18,770 credit awarding grades, appeared to be
the most diligent in the efficient group. Gateway Community College was second by
having 393 graduates and providing 15,620 credit-awarding grades for the service area of
Greater New Haven Metropolis. It should be noted that there was not a direct relationship
between the number of graduates and the number of credit awarding grades given at any
college. This was clearly pointed out by Capital Community College and Housatonic
Community College: Capital produced 292 graduates and provided 7,500 credit awarding
grades while Housatonic had 286 graduates but provided a much higher 14,390 credit
awarding grades which indicated that Housatonic had a greater percentage of non
matriculating students. A similar potential for providing an education to the non
matriculating students existed between Middlesex and Asnuntuck where although
Middlesex had only 155 graduates compared to 197 graduates at Asnuntuck, Middlesex
provided 7,410 credit-awarding grades.
Upon further inspection of the data within this efficient group, Manchester
Community College used twice as much of the OEAS- Overhead Expenditure for
Administrative and Academic Support-than any ofthe efficient units. However, the
model did not recommend any potential improvement for the relative efficient units of
the study.

Third research question:
What Jfadotrs otr collllst"trafttrnts ctreate the vatrynllllg scotre among the
nneffidellllt colleges
111
The remaining five colleges, Three Rivers, Tunxis, Norwalk, Northwest and Naugatuck
Community Colleges were given an inefficient rating on the basis ofthe variables of the
model for the period 1999-2000. The following is the rating of these colleges:
Three Rivers--- 95.23 %, Northwestern---- 91.38 %, Tunxis --- 90.01 %, Norwalk ---
86.12 % and Naugatuck --- 73. 92· %. The individual analysis of the colleges done in the
response to the first research question adequately described the differences and
shortcomings of the inefficient units of this study.
For each college in this group the model presented the weighting factors that depicted
the level of dependence of the performance assessment on the various input and output
variables and the percent or quantity of potential improvement of each variable that was
necessary to bring each unit up to 100 % efficient. In essence, the values of the
variablesthat create the varying scores of efficiency can be closely examined. In many
cases the model requested that the number of full-time equivalent instructors, FTEINST,
be reduced, and the total number of students completing the programs, should be
increased, in order to achieve a 1 00% efficiency level. Eighty percent of the time, the
total revenue (TOTREV) brought in by the units of this group was adequate and needed
no augmentation to reach the efficient frontier. Since TSCHRS was a surrogate for
TSCHRS, TISQRF, TDTEXP, TOPP and OEAS, and the model did not call for the
reduction or addition to TSCHRS, there was no need to examine the members of this
surrogate group for changes where they were possible.

T AJBJLIE 4.11 COMJP ARTISON§ OIF TINIEIFJFTICTIIENT UNTIT§
( as per JBallD.xna lFrollD.~ner AllD.aBysns)
COJLJLIEGJE§ Tllnree Rivers Nor~lltwes~ Tunmds Nm-waHk
VarnabBe Act. Tar. PB Act. Tar. PI Act. Tar. lP I Act. Tar. PI
§TlU§JERV 3.141 2.99 -4.77 1.81 1.65 -8.62 2.96 2.51- 15.13 6.46 2.94 -54.5
lFTIETIN§T 77 68 -11.57 33 24.03 -27.18 58 51. -12.05 u 23 93.8 -23.7
T§CHR§ 6.3 6 --4.77 2.70 2.47 -8.62 5 4.5 -9.99 8.2 7.06 -13.9
§lUClPIER 72.67 122.6 68.7 72.95 83.1 13.87 74.1 105.1 41.8 74.2 74.2 0
§lUCGRJI))§ 12.96 87.7 577 6.21 70.85 1041 I I. 7 80.6 588 19.5 29.9 53.4
TGANG 460 460 0 209 209 0 3355 335 0 394 438.3 11.2
TOTRIEV 19.6 21.9 11.72 10.14 no.I4 o 19.15 19.15 0 30.95 30.95 0
Act ..•.• ActanaB lPerformarnce, Tar ..... Target, lPTI ...... potei!D.tnall ]percentage
performance
The multiplying factors for each variable are the same throughout this study can be
obtained from the above comparison Table 4.3.
112
Naungatunck
Act. Tar. PI
4.71 3.48 -26.]
129 95.36 - 26.08
11.2 8.28 -26.08
73.1 126 .I 72.51
16.5 57.03 246
487 504 3.5
33.01 33.0] 0

113
~.4 1Effideullt Reference Set
As part of the results of this model and a very salient feature that was characteristic of the
DEA system, was the Efficient Reference Set. This set was a group of efficient units
against which the inefficient units were compared, to be deemed inefficient. Each
inefficient unit had a unique Efficiency Reference Set and so, the units of this Reference
Set acted as the benchmark, which the inefficient units should emulate.
The five institutions that received a rating less than 100% efficiency in this study
had the following Efficiency Reference Set.
Three Rivers ..................... Asnuntuck and Manchester
Nmthwest Asnuntuck, Capital and Manchester
Tunxis Asnuntuck, Capital and Housatonic
Norwalk ........................... Asnuntuck and Capital
Naugatuck ......................... Asnuntuck, Capital and Housatonic
As was shown in the previous section, Asnuntuck gained its relative efficiency based on
86 % of the TSCHRS variable and 15% of the FTEINST variable. Similarly
Manchester's efficiency level had the input/output contributions of77.4% of the
TSCHRS, 57.5% SUCGRDS, 22.6% STUSERV and 45% TGANG. Since the
Reference Set of Three Rivers consisted of Asnuntuck and Manchester, the efficiency of
Three Rivers should be based on the FTEJNST, TSCHRS, STUSERV and TGANG. The
model used STUSERV, and TSCHRS, showing that, indeed, Three Rivers needed to
emulate similar variables as the members of its Reference Set, to achieve a 100%
efficiency rating. Similar analyses were done on the remaining four inefficient units.
114
4.5 Analysis of individual efficient and inefficient colleges
In the analysis and subsequent proposal of guidelines for the performance improvement
of the Community Colleges in Connecticut, this study characterized the tasks of these
institutions, as far as their academic program offerings, their intended service areas and
their individually acquired parameter values that were used in the determination of the
efficient and inefficient grouping. In this Section a view of the performance of the
colleges was taken from the State Labor Force perspective.
Again this study reiterated the fact that this analysis was done strictly for the period 1999
- 2000 academic year and changes in the operation of the colleges could have occurred to
the time of the development of this study.
Quoting from the Economic Development Cluster Report: Building Connecticut by
Preparing the Workforce ofthe Future prepared by the System Office Community
Colleges of Connecticut:
* In 1950, the Bureau of Labor Statistics classified sixty percent of the jobs
as requiring an unskilled labor force. However, in the year 2000, the Bureau
predicted that sixty percent of the available jobs required a skilled labor force.
The professional categories of employment remained essentially constant, at
Twenty percent of the workforce, but the skilled and unskilled categories had
made an almost equivalent switch (see Pie chart below).
The impact of technology forced an increase in the level of skills and the
level of education required for most jobs. For career advancement, skills had

to be upgraded and retaining lifelong learning was necessary to maintain
currency in many fields.
Figure 4.15 Workforce Analysis
Work fore e P ere en tag e 1 9 50
P rotes s 'I
20%
Skilled
20%
Unskilled
60%
Workforee Preeentage 2000
P ro fe ss 'I
20%
Unskilled~ 15% ~killed
65%
From those trends it was evident that in the next five years there would be more job
115
openings in the technical and professional fields than there were workers to fill them. As
shown by the Bureau of Labor Statistics, six out of every ten jobs required a technical
background. The job growth was concentrated in positions that required training beyond
the High School, but not necessarily a four -year degree.

116
Economic growth in Connecticut in the year 1999-2000 was predicted in six employment
areas which were designated as the Economic Development Cluster: they were,
Telecommunications & Information Technology, Financial Services, Health Services,
High Technology, Manufacturing and Tourism.
The Economic Development Cluster Report showed the alignment between this cluster
and the current programs offered by the twelve Community Colleges of Connecticut,
including the Associate Degree curricula, certificate programs, non-credit skill building
courses and customized training programs developed for Business and Industry.
As a general outcrop of the Mission of the Community College System, one can say that
the curricula offered at all twelve colleges, combining Liberal Arts and Sciences and
career- oriented programs, made a community college education the ideal preparation for
the high demand work environment of the 21 51 century where careers that required:
analytical thinking, problem solving, communication, teamwork and lifelong learning,
meet the demand of the specific work environment.
Many programs, especially the College of Technology, a transfer curriculum that
provided entry at the junior level to the University of Connecticut and Central
Connecticut State University, the Water Management and Electrical program options, the
Dmg & Alcohol Counseling, Fire Technology and Administration and Physical Therapist
Assistant programs, were offered system wide through cooperative programs that
encouraged resource sharing and convenience for students.
The following section of the study now outlined how the individual colleges attempted to
meet the goals of the W orkforce of the Future as mandated by the Bureau of Labor of
Connecticut, and the factors of their individual efficiency are examined.
117
Asnuntuck Community College, located in Enfield, CT provided a tertiary education to
the following service area: East Granby, East Windsor, Ellington, Enfield, Somers, I
Stafford, Suftield and Windsor Locks, which was described as a farming community
raising cattle and growing crops of tobacco and corn. For the period of this study, the
college had a total headcount of 3464 students and a Full time Equivalent (FTE) of 1488
students. This college offered six programs within the Telecommunications &
Information Technology cluster, eight programs within Financial Services, four programs
within Health Services, two programs within High Technology, seven programs within
Manufacturing and three programs within the Tourism cluster, to a total of thirty
programs in the entire college. That was an average size program offering and reflected
the low level of industrialization that the service area had undergone. However, this
study deemed Asnuntuck as an efficiently operated institution based on all the parameters
of the study and the highest contributing factor of the number of full time equivalent
instructors, FTEINST and the percentage of credit awarding grades, SUCPER given out.
During the academic year of 1999-2000, this college did not award a punitive F grade on
any of its academic courses, which resulted in the abnormally high, 80.5%, SUCPER
value of the study, and propelled the college to an efficient performance standing.
Asnuntuck Community College is located within close proximity of the Somers
Correctional Facility and although the towns of the service area did not have a very
diverse and ambitious population, the college could enjoy a higher level of prosperity by
providing more college level courses to the inmates of the correctional institution. The
college would have an opportunity to expand on the program offerings to accommodate
the diverse prison population and also increase its revenue base from the state for
providing this service.
118
Asnuntuck Community College, for the period of this study, received a total state
appropriation of $9.2 M with which the college produced 197 graduates using 22 full time
equivalent instructors. This college had the second to the smallest square footage of all
the colleges in the system and did a good job in achieving its mission.
Capital Community College (previously Greater Hartford Community College and
Hartford State Technical College) had a total of5575 students with 2644 fulltime
equivalent students for the academic year 1999-2000. This college serviced Hartford, CT
and its five neighboring towns ofBloomfield, Newington, West Hartford, Wethersfield
and Windsor. This college had 38 programs distributed among the Economic
Development Cluster: Seven programs within the Telecommunications and Information
Technology. eight within Financial Services, ten within the Health Services, six within
High Teclmology, six within Manufacturing and one in the Tourism cluster. This college,
in my opinion, could have offered a better mix of programs and courses that would reflect
the fact that Hartford is the insurance capital of the world.
With the values of the inputs and outputs parameters of this model, this college was
given an efficient rating. For the period 1999-2000, the State of Connecticut appropriated
$21.6M for Capital Community College with which it produced 292 graduates using 57
fulltime equivalent instructors. The parameters used to detennine the relative efficient
level of this college, were all within a good range of the values of the other institutions
except, the percentage of credit awarding grades given at the college, SUCPER. This

119
parameter had a value 38.93% which was low enough to warrant that some action should
be taken to correct this situation.
Gateway Community CoHege (previously South Central Community College and
Greater New Haven State Technical College) was located in New Haven, CT and
serviced the following 12 towns of: Bethany, Branford, East Haven, Guilford, Hamden,
Madison, New Haven, North Branford, North haven, Orange, west Haven and
Woodbridge. For the academic year 1999-2000 the college had 8075 students with 3834
fulltime equivalent students. This college provided for this service area 63 programs
within all the clusters: ten programs within the Telecommunications and Information
Technology cluster, eight within Financial Services, eighteen within Health Services, six
within High Technology, fifteen within Manufacturing and seven in the Tourism cluster.
This college had the largest program offering in the community college system and had a
relative efficient rating when compared to the remaining colleges of this system.
Although, Gateway had a very respectable program offering, it was evident from its low
number of graduates in the field of Biotechnology and because of its proximity to the
Biotechnology industry in New Haven, CT, that it should have had more Biotechnology
related programs. Gateway Community College was the second of two colleges, which
evolved from the merger of two institutions: the Community Colleges and the State
Technical Colleges, which received an efficient rating within the system. This college
received $22.82M appropriations with which it produced 393 graduates using 95 fulltime
instructors. This college did a commendable job in its attempt to achieve its mission.

120
Housatonic Community College was located in Bridgeport, CT and serviced eleven
towns: Ansonia, Bridgeport, Derby, Easton, Fairfield, Milford, Monroe, Seymour,
Shelton, Stratford and Trumbull and provided twenty nine programs within the Economic
Development Cluster: seven programs within Telecommunication and Information
Technology, eleven programs within Financial Services, seven programs within Health
Services, three programs in High Technology, one in Manufacturing and one in Tourism.
This college had a 7578 headcount and 3542 fulltime equivalent students and had 14390
credit awarding grades given out, although there were 286 graduates as compared to
Capital 292 graduates for the 7500 grades. This indicated that Housatonic Community
College had a large non-matriculating student population: people returning to college to
improve their career standing or changing careers, which was part ofthe mission of the
Community College System of Connecticut. Based on all the parameters used in this
study, the college received a relative etlicient rating and showed a utilization of $19.48
M of State Appropriations to produce 286 graduates using 57 full time equivalent
instructors. The program offerings for the Health Services and Tourism clusters could
have been increased to attract a higher proportion of potential student whom had been
laid off from the manufacturing industry of the area.
Manchester Community College was located in Manchester, CT and serviced the towns
of Andover, Bolton, Columbia, Coventry, East Hartford, Glastonbury, Hebron,
Manchester, Mansfield, Madborough, South Windsor, Tolland, Union, Vernon/Rockville
and Willington. For the academic year of 1999-2000, the college enrolled 9783 students
with a full time equivalent of 5021 students. The college had a very respectable offering

121
of 4 7 programs within the six Clusters of Economic Development: ten programs in
Telecommunications and Information Technology, ten programs in Financial Services,
thirteen programs in Health Services, two programs in High Technology, five programs
in Manufacturing and seven in the Tourism cluster. This college received an efficient
rating from the parameters of this study; it used $27M of State appropriations to produce
577 graduates using 106 fulltime equivalent instructors. Since this model did not show
any Potential Improvements (PI) for the efficient units, comparison between the efficient
units made by examining the data on Table 4.3, showed that this college used a
noticeable $10.14M on the OEAS parameter. This parameter represented the Overhead
Expenditure for Administrative and Academic Support and was approximately double
any other OEAS parameter value for the efficient units in this study. Apart from this high
administrative cost, Manchester Community College did a commendable job in achieving
its mission within the Community College System of Connecticut for the period of this
study.
M.iddlesex Community College was located in the town of Middletown, CT, enrolled a
total head count of 4426 students which resulted in 2079 full time equivalent students.
This college serviced the towns of Chester, Clinton, Cromwell, Deep River, Durham,
East Haddam, East Hampton, Essex, Haddam, Killington, Meriden, Middlefield,
Middletown, Old Saybrook, Pm1land, Rocky Hill, Wallingford and Westbrook, and
provided twenty-nine programs within the Economic Development Cluster. The
programs were as follow: seven in the Telecommunication and Information Technology
Cluster, eight in the Financial Services Area, nine in the Health Services Cluster, two in

122
the High Technology Cluster, four in the Manufacturing Cluster and one in the Tourism
Cluster. For the period of this study this college was operated efficiently as per the model
and the parameters used. For 18 towns of the service area, the program offering appeared
to be very meager. There was a high school in each town and in order to capture a
reasonable percentage of those students the program offering should be more attractive.
Also because of this college's proximity to the Greater New Haven Area it should have
had a larger program offering of Biotechnology related courses to meet the demand of
this area.
This college used $12.31 M of State Appropriations to produce 155 graduates using 38
fulltime equivalent instructors during the academic year of 1999-2000, using the lowest
expenditure for administrative and academic support (OEAS) of$ 2.33 M of the entire
study. This was a very commendable job on the part of Middlesex Community College.
Quinebaug Valley Community College was located in the Northeast CT town of
Danielson and serviced thirteen towns of Ashford, Brooklyn, Chaplin, Eastford,
Hampton, Killingly, Plainfield, Pomfret, Putnam, Sterling, Thompson, Windham, and
Woodstock. This college provided 26 programs within the Economic Development
Cluster: four programs in the Telecommunications and Information Technology Area
, ten programs within the Financial Services, five in Health Services, two in High
Technology, five in Manufacturing and zero in Tourism. This was a Very small program
offering fitting for the most sparsely populated area of Connecticut. The college enrolled
a total headcount of 2492 students, and had 1261 full time equivalent students. During the
period of this study this college received $8.52 M from the State Appropriations with
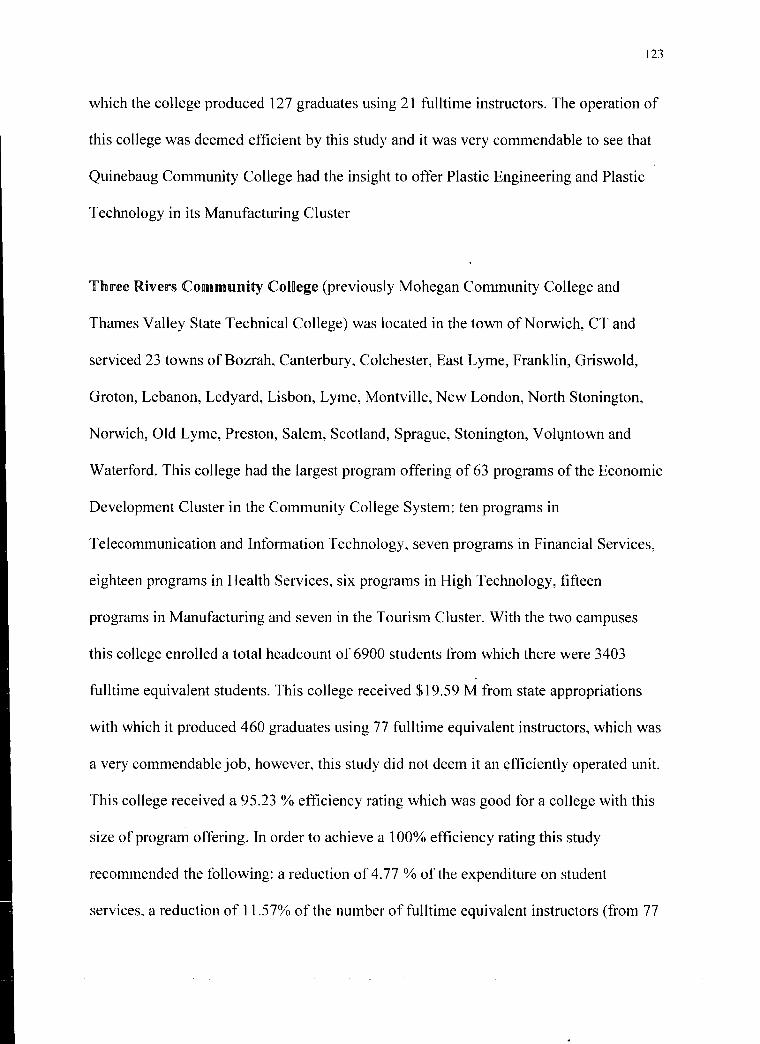
123
which the college produced 127 graduates using 21 fulltime instructors. The operation of
this college was deemed efficient by this study and it was very commendable to see that
Quinebaug Community College had the insight to offer Plastic Engineering and Plastic
Technology in its Manufacturing Cluster
'flh11ree Rivers Community CoiDege (previously Mohegan Community College and
Thames Valley State Technical College) was located in the town ofNorwich, CT and
serviced 23 towns ofBozrah, Canterbury, Colchester, East Lyme, Franklin, Griswold,
Groton, Lebanon, Ledyard, Lisbon, Lyme, Montville, New London, North Stonington,
Norwich, Old Lyme, Preston, Salem, Scotland, Sprague, Stonington, Voh,mtown and
Waterford. This college had the largest program offering of 63 programs of the Economic
Development Cluster in the Community College System: ten programs in
Telecommunication and Information Technology, seven programs in Financial Services,
eighteen programs in Health Services, six programs in High Technology, fifteen
programs in Manufacturing and seven in the Tourism Cluster. With the two campuses
this college enrolled a total headcount of 6900 students from which there were 3403
fulltime equivalent students. This college received $19.59 M from state appropriations
with which it produced 460 graduates using 77 fulltime equivalent instructors, which was
a very commendable job, however, this study did not deem it an efficiently operated unit.
This college received a 95.23 % efficiency rating which was good for a college with this
size of program offering. In order to achieve a 100% efficiency rating this study
recommended the following: a reduction of 4. 77 % of the expenditure on student
services, a reduction of 11.57% of the number of full time equivalent instructors (from 77

124
to 68), a reduction of 4.77% of the total contact hours with the students, an increase of
68.72 %on the percentage of credit awarding grades given out at the college, an increase
in the overall number of credit awarding grades and a 11.72 % increase in total revenue
coming into the college. In this study the Total Student Contact Hours (TSCHRS) acted
as a surrogate to four other highly correlated parameters: TISQRF, TDEXP, TOPP,
OEAS and any change in TSCHRS requested by the model indicated that was a need for
a change in one or any of the members of this group. These changes were presented
strictly as guidelines and many times, when the study gave a specific value increase or
decrease in any of the parameters, this indicated that there was need to further investigate
of this parameter.
Northwestern Connecticut Community College was located in the town of Winsted,
CT and provided a tertiary education to twenty towns: Barkhamsted, Canaan, Canton,
Colebrook, Cornwall, Goshen, Granby, Hartland, Harwinton, Kent, Litchfield, Morris,
New Hartford, Norfolk, North Canaan, Salisbury, Sharon, Torrington, Warren and
Winchester. This college had 35 programs within the Economic Development Cluster:
seven programs in Telecommunications and Information Technology, six programs in
Financial Services, ten programs in Health Services, two programs in High Technology,
three programs in Manufacturing and seven programs in the Tourism Cluster. During the
academic year of 1999-2000, this institution enrolled a total headcount of 3294 and had
1406 fulltime equivalent students. The college received $10.14 M of State Appropriations
with which it produced 209 graduates using 33 fulltime equivalent instructors, which was
a good job. However, this college did not get an efficient rating from the study, for the
input and output parameters used in the model, this unit was assessed to a rating of 91.38

125
%. In order to achieve a 100% efficiency rating, the model showed that the college had
to: reduce the expenditure on student services by 8.62 %, reduce the number offulltime
equivalent instructors by 27.18%, reduce the TSCHRS by 8.62 %, increase the
percentage of credit awarding grades (SUCPER) by 13.87% and increase the total
number of credits awarded at the college (matriculating and non-matriculating). The data
also showed that the number of graduates (TGANG) and the total revenue coming into
the school, TOTREV, were adequate for the period during which this study was
undertaken.
Tunxis Community College was located in the town ofFarmington, CT where it
serviced eleven towns of: Avon, Berlin, Bristol, Burlington, Farmington, New Britain,
Plainville, Plymouth/Terryville, Simsbury, Southington and Wolcott. The college offered
twenty-seven programs within the Economic Development Cluster: six programs in
Telecommunications and Information Technology, eight in Financial Services, six in
Health Services, two in High Technology, three in Manufacturing and two in Tourism.
For the academic year of 1999-2000 the college had a total headcount of 6646 students
and a full time equivalent of 3050 students, it also received $ 19.15 M of State
Appropriations with which the college produced 335 graduates using 58 fulltime
equivalent instructors. This was a very commendable job for a growing college with the
excessive competition from the neighboring colleges, however, the study did not give this
college an efficient rating, it received a 90.01 % efficiency rating relative to the other
community colleges of the system. In order to receive a 100 % efficiency rating Tunxis
Community College had to: reduce the expenditure on student services by 15.13 %,
reduce the number of fulltime equivalent instructors by 12.05 %, reduce the TSCHRS
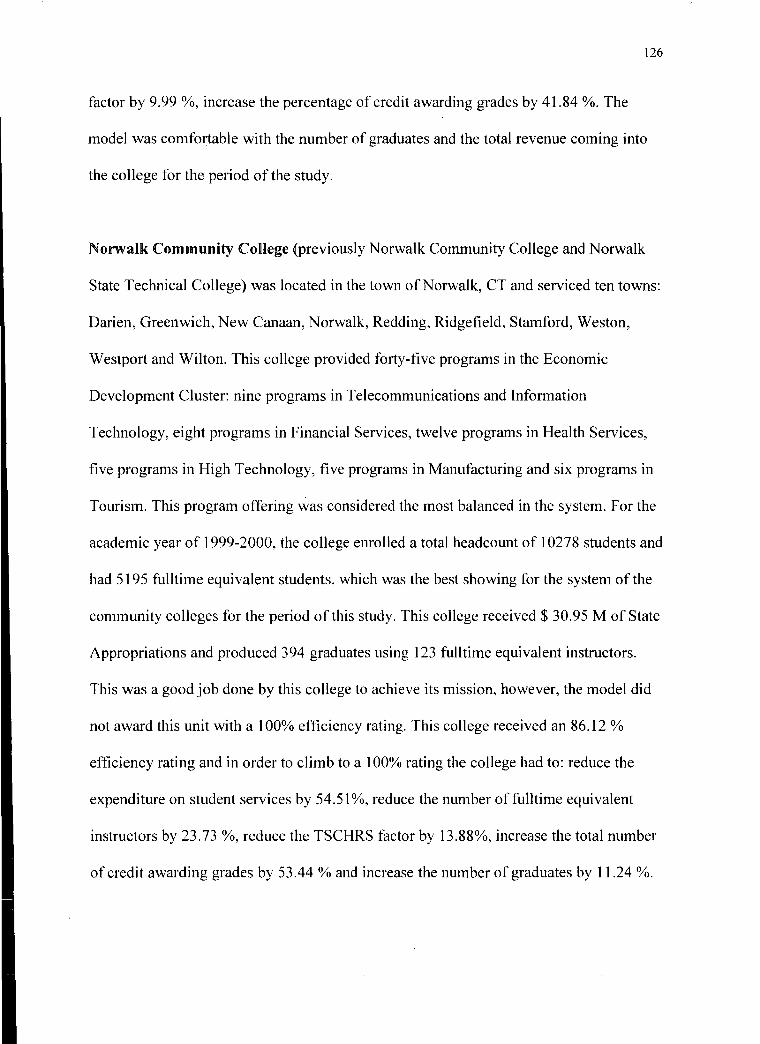
126
factor by 9. 99 %, increase the percentage of credit awarding grades by 41.84 %. The
model was comfortable with the number of graduates and the total revenue coming into
the college for the period of the study.
Norwalk Community CoUege (previously Norwalk Community College and Norwalk
State Technical College) was located in the town ofNorwalk, CT and serviced ten towns:
Darien, Greenwich, New Canaan, Norwalk, Redding, Ridgefield, Stamford, Weston,
Westport and Wilton. This college provided forty-five programs in the Economic
Development Cluster: nine programs in Telecommunications and Information
Technology, eight programs in Financial Services, twelve programs in Health Services,
five programs in High Technology, five programs in Manufacturing and six programs in
Tourism. This program offering was considered the most balanced in the system. For the
academic year of 1999-2000, the college enrolled a total headcount of 10278 students and
had 5195 full time equivalent students, which was the best showing for the system of the
community colleges for the period of this study. This college received $ 30.95 M of State
Appropriations and produced 394 graduates using 123 fulltime equivalent instructors.
This was a good job done by this college to achieve its mission, however, the model did
not award this unit with a 100% efficiency rating. This college received an 86.12 %
efficiency rating and in order to climb to a 1 00% rating the college had to: reduce the
expenditure on student services by 54.51%, reduce the number of full time equivalent
instructors by 23.73 %, reduce the TSCHRS factor by 13.88%, increase the total number
of credit awarding grades by 53.44% and increase the number of graduates by 11.24 %.

The levels of the SUCPER, percentage of credit awarding grades, and TOTREV, total
revenue coming into the college, were considered adequate, and so did not need any
changes.
127
Naugatuck Valley Community College ( Mattatuck Community College and Waterbury
State Technical College) was located in Waterbury,CT and serviced the twenty-two
towns of: Beacon Falls, Bethel, Bethlehem, Bridgewater, Brookfield, Cheshire, Danbury,
Middlebury, Naugatuck, New Fairfield, New Milford, Newton, Oxford, Prospect,
Roxbury, Sherman, Southbury, Thomaston, Washington, Waterbury, Watertown and
Woodbury. The college offered fifty-one programs within the Economic Development
Cluster: four in Telecommunications and Information Technology, eight in Financial
Services, fifteen in Health Services, eight in High Technology, twelve in Manufacturing
and four in the Tourism Cluster. For the period of this study, this college enrolled a total
headcount of 93 75 students and had 4941 full time equivalent students, which represented
the second highest fulltime equivalent student enrollment for the academic year 1999-
2000. Naugatuck Valley Community College received, for the same period, a $33.01 M
State Appropriations with which it produced 487 graduates using 129 fulltime equivalent
instructors. This college received an efficiency rating of 73.92 % and in order to achieve
a I 00% rating it had to: reduce the TSCHRS factor by 26. %, reduce the number of
fulltime equivalent instructors by 26.08 %, reduce the expenditure on student services by
26%, increase the number of graduates by 3.5%, and increase the percentage of credit
awarding grades and the total number of grades given out at this college. The total
revenue or appropriations was adequate for the college as determined by the model.

128
It should be borne in mind that the indication of inefficiency of the colleges was '
based on the chosen parameters of the model for which there was good selection of
available data. However, there are many non-tangible variables in the education
production function, this is the function that converts inputs to the educational process
into the desired outputs, that are not accounted for in the this model, and so, although the
results of the model were good indicators of the level of operation of the colleges, they
should be used as guidelines on which the respective administrators should act. These
were not meant to be absolute facts that were etched in stone.
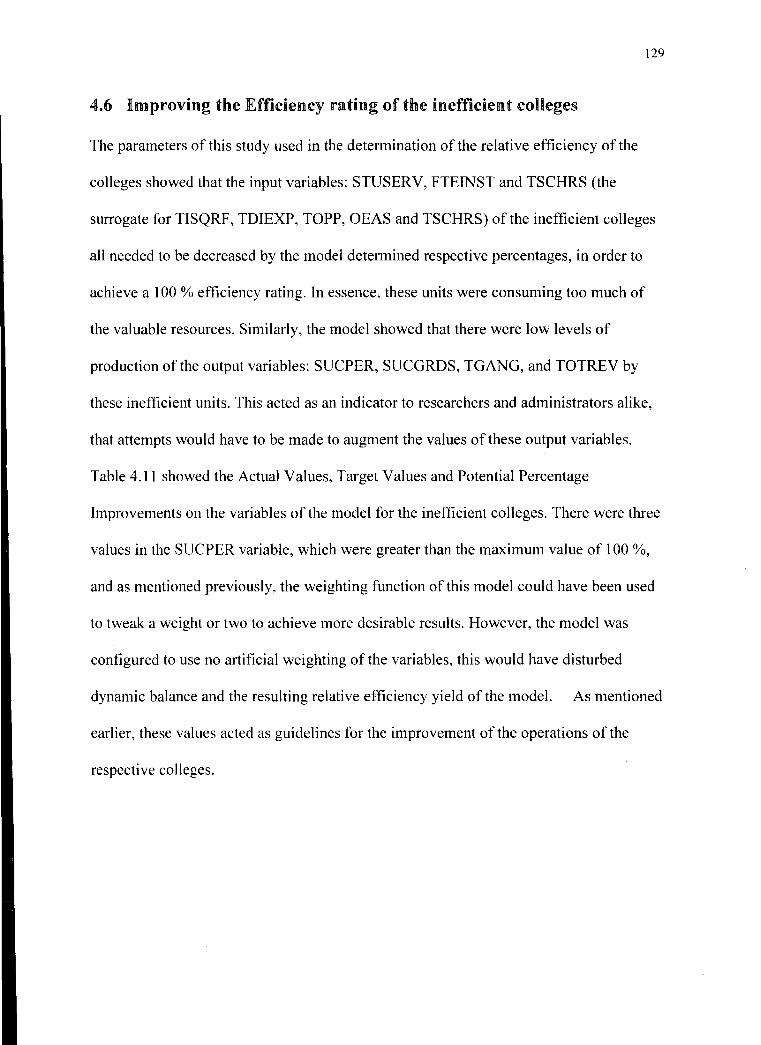
129
4.6 Improving the Efficiency rating of the inefficient college§
The parameters of this study used in the determination ofthe relative efficiency of the
colleges showed that the input variables: STUSERV, FTEINST and TSCHRS (the
surrogate for TISQRF, TDIEXP, TOPP, OEAS and TSCHRS) of the inefficient colleges
all needed to be decreased by the model determined respective percentages, in order to
achieve a 1 00 % efficiency rating. In essence, these units were consuming too much of
the valuable resources. Similarly, the model showed that there were low levels of
production of the output variables: SUCPER, SUCGRDS, TGANG, and TOTREV by
these inefficient units. This acted as an indicator to researchers and administrators alike,
that attempts would have to be made to augment the values of these output variables.
Table 4.11 showed the Actual Values, Target Values and Potential Percentage
Improvements on the variables of the model for the inefficient colleges. There were three
values in the SUCPER variable, which were greater than the maximum value of 100 %,
and as mentioned previously, the weighting function ofthis model could have been used
to tweak a weight or two to achieve more desirable results. However, the model was
configured to use no artificial weighting of the variables, this would have disturbed
dynamic balance and the resulting relative efficiency yield of the model. As mentioned
earlier, these values acted as guidelines for the improvement of the operations of the
respective colleges.

130
The following section outlined the actual guidelines for improving the inefficient colleges
of the system.
Three lRnvers Commullllity CoBiege : This college received a 95.23 %efficiency rating
which was good for a college with this size of program otTering. In order to achieve a
I 00% efficiency rating this study recommended the following: a reduction of 4.77% of
the expenditure on student services, a reduction of I1.57% of the number of fulltime
equivalent instructors (from 77 to 68), a reduction of 4.77% of the total contact hours
with the students, an increase of 68.72 % on the percentage of credit awar_ding grades
given out at the college, an increase in the overall number of credit awarding grades and a
I1.72% increase in total revenue coming into the college.
Northwestern Connecticut Community College : the college had to: reduce the
expenditure on student services by 8.62 %, reduce the number offulltime equivalent
instructors by 27.18 %, reduce the TSCHRS by 8.62 %, increase the percentage of credit
awarding grades (SUCPER) by 13.87% and increase the total number of credits awarded
at the college ( matriculating and non-matriculating)
Tunxis Community College : . In order to receive a 100 %efficiency rating Tunxis
Community College had to: reduce the expenditure on student services by 15.13 %,
reduce the number of fulltime equivalent instructors by 12.05 %, reduce the TSCHRS
factor by 9. 99 % and increase the percentage of credit awarding grades by 41.84 %.
Norwalk Community College: in order to acquire a I 00% rating the college had to:
reduce the expenditure on student services by 54.51%, reduce the number of full time

131
equivalent instructors by 23.73 %, reduce the TSCHRS factor by 13.88%, increase the
total number of credit awarding grades by 53.44% and increase the number of graduates
by 11.24%.
Naugatuck VaDRey Community CoDiege: in order to achieve a 100% rating this college
had to: reduce the TSCHRS factor by 26. %, reduce the number offulltime equivalent
instructors by 26.08 %, reduce the expenditure on student services by 26%, increase the
number of graduates by 3 .5%, and increase considerably the percentage of credit
awarding grades and the total number of grades given out at this college.
In summary of this chapter, the Analysis of Data of the Model, of the twelve community
colleges of Connecticut, the study addressed more than the mere analysis of the data of
the model. It featured: A Description of the DEA (Frontier Analysis) Model as used by a
personal computer system, The Analysis of the Model Data, Analysis of the Model
Results, The Inefficient Reference Set, Analysis of the Individual Etlicient and
Inefficient Colleges, and Improving thee Efficiency rating ofthe inefficient colleges.
The DEA model answered the three research questions of this study. A) How do
institutions of the Community College System of Connecticut compare to each other
regarding their levels of efficiency. This was done by the direct comparison of the
efficiency ratings delivered by the DEA model. Seven colleges were rated efficient and
five were given considered inefficient for the period of this study. B) What conditions
may account for the differences in the level of success within similarly efficient college.
This was achieved by examining the differences in the input and output parameters of the
model. Since this model did not indicate any Percentage Potential Improvement for the
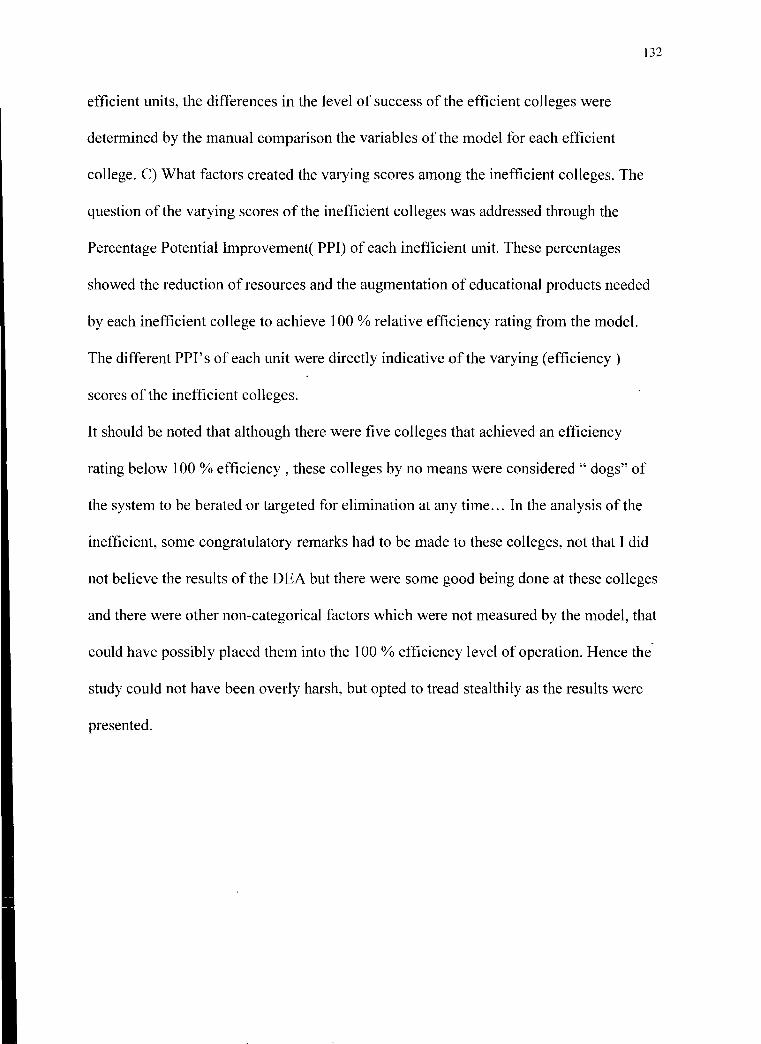
efficient units, the differences in the level of success of the efficient colleges were
determined by the manual comparison the variables of the model for each efficient
college. C) What factors created the varying scores among the inefficient colleges. The
question ofthe varying scores of the inefficient colleges was addressed through the
Percentage Potential Improvement( PPI) of each inefficient unit. These percentages
showed the reduction of resources and the augmentation of educational products needed
by each inefficient college to achieve 100% relative efficiency rating from the model.
The different PPI's of each unit were directly indicative ofthe varying (efficiency)
scores of the inefficient colleges.
It should be noted that although there were five colleges that achieved an efficiency
rating below 100 % efficiency , these colleges by no means were considered " dogs" of
the system to be berated m targeted for elimination at any time ... In the analysis of the
inefficient, some congratulatory remarks had to be made to these colleges, not that I did
not believe the results of the DEA but there were some good being done at these colleges
and there were other non-categorical factors which were not measured by the model, that
could have possibly placed them into the I 00 % efficiency level of operation. Hence the-
study could not have been overly harsh, but opted to tread stealthily as the results were
presented.

I.,., .).)
A. Chames, W.W. Cooper, A.Y. Lewin, R.C. Morey and J.J. Rousseau initiated the study
of Sensitivity Analysis in an article entitled
"Sensitivity and Stability Analysis in DEA" which was published in the Annals of
Operation Research in 1985. That work was concerned with the fact that changes in the
data of the units of a study altered the inverse matrix used to develop solutions in the
Simplex algorithm computer codes. Further research in Sensitivity Analysis was directed
along the path of finding algorithms that avoided the use of additional matrix inversions.
However, Chames et al ( 1992) abandoned that path of the algorithmic exploration and
embarked on a metric concept. The idea in that new direction was to use a length or a
distance to configure "radii of stability " within which the occurrence of data variations
will not alter a unit's rating from efficient to inefficient or vice versa (Seiford et a!, 2000).
Along the idea of efficiency stability with data variations, the sensitivity check was
developed for the twelve units of this study.
The sensitivity analysis of the model results examined the stability or the robustness of
the DEA model in order to identify the factors that changed the rating of the units from
inet1icient to efficient or vice versa, as per the following changes:
a) The most highly compared unit, that is the unit that appeared in the Reference Set as
Benchmark to the inefficient units most often (that was Asnuntuck), was removed from
the study. The relative efficiency of the remaining units was then detem1ined.

b) Removal of each variable from the model, for example, TGANG, then the relative
efficiency scores ofthe units were successively calculated.
c) Different variable values were used in the model and the new efficiency score were
calculated.
134
d) The study used a DEA Model developed by Cooper, Seiford and Tone and calculated
the efficiency of the units.
Thus, this analysis provided an index of stability of the relative efficiency of the units of
the model by measuring the extent to which changes in or the omission of an input or an
output variable value, a unit or even the utilization of a different software model,
rendered the individual colleges efficient or inefficient.
To lend some validity to the study, a second DEA (Frontier Analysis) model developed
in the US by Cooper, Seiford and Tone (2000) was used to analyze the same data as in
the first model. The results ofthe second model were identical to that of the first and
were included in the Sensitivity Analysis Section of chapter 4. To verify some of the
findings of the model, an interview was conducted with a senior financial administrator at
one ofthe colleges ofthe system. This administrator had been in the employ of the
college for the past 12 years and had observed the cycles the colleges had undergone
during his tenure. He was satisfied by the general trend and the individual results of the
colleges proposed by the results of the model. and he was convinced that there were at
least five colleges within the system that were being operated at a lower level of
efficiency than the others. His choice of low performers based on his administrative
135
markers, was identical to the group of colleges that received an efficiency rating of less
than 100 % from the DEA model.

' I
~----- H--- - - Table 4.12 SUMMARY OF SENSITIVITY ANAL YSI§ J
REMOVAL OF REMOVAL OF IPARAMATIER
MODEL RESULTS MODEL RESULTS ASNUNTUCK
(BANXIA SOFTWARE) (COOPER. SEIFORD & TONE) (MOST COMPARED UNIT) VARIABLE RESUTING UNITS RATIO NUMBER REMOVED EFF. RANGE OF
EFF/INEFF UNIT
QUINEBAUG - 100% QUINEBAUG -100% QUINEBAUG - 100% TSCHRS 100 -64.97% 6/6
ASNUNTUCK - 100% ASNUNTUCK - I 00% MIDDLESEX -100% FTEINST 100 -71.50% 7/5
MIDDLESEX - 100% MIDDLESEX -100% CAPITAL - 100% STUSERV 100 -62.00% 3/9
CAPITAL - 100% CAPITAL - 100% HOUSA TONIC - I 00% TOT REV 100 -62.00% 517
HOUSATONIC -100% HOUSATONIC - 100% MANCHESTER - I 00% TGANG 100 -73.92% 517
MANCHESTER - I 00% MANCHESTER- I 00% GATEWAY - 100% SUCPER 100 -73.92% 517
GATEWAY - 100% GATEWAY - 100% THREE RIVERS - I 00% SUCGRD 100 -73.92% 6/6 I
I
THREE RIVERS - 95.23% THREE RIVERS- 95.23% NORTHWESTERN- I 00% I
NORTHWESTERN- 91.38% NORTHWESTERN- 91.38% TUN XIS - 100%
TUN XIS -90.01% TUN XIS -90.01% NOR WALK -98.73%
I
NOR WALK - 86.12% NORWALK - 86.12% NAUGATUCK - 75.39%
NAUGATUCK - 73.92% NAUGATUCK - 73.92% -- -

137
'fabne 4.].3 lEffndei!Dcy §core§ §ei!D§itDvnty a§ JPer 1Uilllnt lEinmillllatioiiD
Unit Score,%
Middlesex 100.00
Northwestern 100.00
Quinebaug V alley 100.00
Housatonic 100.00
Manchester 100.00
Capital 100.00
Three Rivers 100.00
Tunxis 100.00
Gateway 100.00
Norwalk 98.73
Naugatuck Valley 75.39
As Asnuntuck was omitted from the group of colleges of the system, the above results
showed that nine colleges had relative efficiency rating of 100%, Norwalk and
Naugatuck obtained higher level of efficiency but remained below 100 % . The
benchmark for Norwalk was Housatonic and Quinebaug, while Naugatuck had Capital,
Housatonic, Manchester and Quinebaug to emulate.
This showed that the model was affected by the number of units that were present. This
was expected, since this model yielded a relative efficiency, that is, one that depended on
the performance of the peer units in the model.

138
Table 4 14l Effidellllcy §core§ §en§itivity a§ per modlel variable§ 0
TSCHRS FTEINST STUSERV TOTREV TGANG SUCPER SUCGRD UNCH
RANGE 100- 100-71.50 100-62.06 100-62.06 100- 100-73.92 100-73.92 100-
0/o 64.97 73.92 73.92
No. of
EFF. 6 7 "' 5 5 5 6 7 .)
No. of
INEFF. 6 5 9 7 7 7 6 5
In the above table, each column with a specific variable represented the condition when
the variable was removed from the study and the number of efficient and inefficient units
resulted. Compared to the unchanged (UNCH) column, the model was least sensitive to
the omission of the number of full time instructors (FTEINST) variable and most affected
by-the deletion ofSTUSERV variable. These were very important results that were used
for development of further discussion on the model dependence on the variables.

139
'fable 4.15 Efficiency scores sensitivity as per variable values
Unit Score
Asnuntuck 100.00 0
Quinebaug Valley 100.00 0
Middlesex 100.00 0
Housatonic 100.00 0
Manchester 100.00 0
Capital 100.00 0
Gateway 100.00 0
Three Rivers 95.23 0
Tunxis 92.94 0
Northwestern 91.38 0
Norwalk 90.64 0
Naugatuck Valley 72.05 0
The model appeared to be least sensitive to the changes in its variable values. The
efficiency scores shown above were obtained by removing the TGANG variable and the
FTEINST variable for all the units of the study. These values were chosen quite
arbitrarily or at random, as the statistician would say. The results of seven efficient
colleges and five inefficient colleges were the same obtained when the model was run
undisturbed. However, the inefficient units received a lower efficiency rating as
compared to the values they had received on the initial runs of the model.
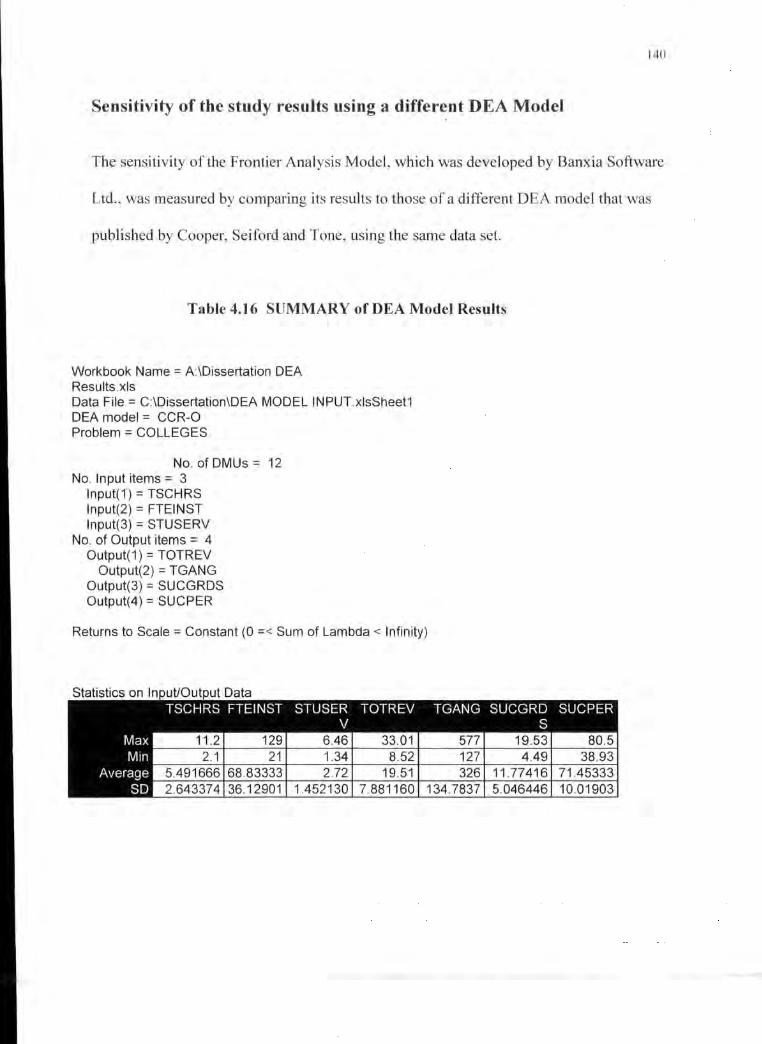
140
Sensitivity of the study results using a different DEA Model
The sensitivity of the Frontier Analysis Model, which was developed by Banxia Software
Ltd. , was measured by comparing its results to those of a different DEA model that was
published by Cooper, Seiford and Tone, using the same data set.
Table 4.16 SUMMARY of DEA Model Results
Workbook Name = A:\Dissertation DEA Results.xls Data File = C:\Dissertation\DEA MODEL INPUT.xlsSheet1 DEA model = CCR-0 Problem = COLLEGES
No. of DMUs = 12 No. Input items= 3
lnput(1) = TSCHRS lnput(2) = FTEINST lnput(3) = STUSERV
No. of Output items = 4 Output(1 ) = TOTREV
Output(2) = TGANG Output(3) = SUCGRDS Output(4) = SUCPER
Returns to Scale = Constant (0 =< Sum of Lambda < Infinity)

Correlation
0.047446 0.138297
~Data with respect to the chosen Model
~ None
No. of DMUs 12 Average 0.953321
SD 0.073879 Maximum 1 Minimum 0. 739196
Frequency in Reference Set Peer set Frequency to other DMUs
Asnuntuck 5 Capital 4
Gateway 0 Housatonic 2 Manchester 2
Middlesex 0 Quinebaug 0
No. of DMUs in Data = No. of DMUs with inappropriate Data = No. of evaluated DMUs =
Average of scores = No. of efficient DMUs = No. of inefficient DMUs = No. of over iteration DMUs =
12 0
12
0.953321 7 5 0
[CCR-0) LP started at 03-04-2002 15:32:31 and completed at 03-04-2002 15:32:40
141

142
Elapsed time = 1 0 seconds Total number of simplex iterations= 76
REFERENCE SET
Model Name = CCR-0 Workbook Name= A:\Dissertation DEA Results.xls ------~~--~------ ~
I No. GHVlUJ Score - ~ani< ' j -· --~~-- --- --
Reference set (lambda)
Asnuntuck 1 1 Asnuntuck 1 2 Capital 1 1 Capital 1 3 Gateway 1 1 Gateway 1 4 Housatonic 1 1 Housatonic 1 5 Manchester 1 1 Manchester 1 6 Middlesex 1 1 Middlesex 1 7 Naugatuck 0.7391969 12 Asnuntuck 0.82171 Capital 0.827964 Housaton 0.972784
1 ic 8 Northwest 0.9138257 10 Asnuntuck 1.11463 Capital 7.24E-03 Manchest 1.21 E-02
4 er 9 Norwalk 0.9064398 11 Asnuntuck 3.23601 Capital 0.154522
8 10 Quinebaug 1 1 Quinebaug 1 11 Three Rivers 0.9523083 8 Asnuntuck 1.21462 Manche 0.422452
8 ster 12 Tunxis 0.9280838 9 Asnuntuck 1.51610 Capital 0.189294 Housaton 0.108410
3 ic
In Rank order

lPIROJIECll'ION§
Model Name = CCR-0 Workbook Name = A:\Dissertation DEA Results.xls
._j TSCHRS 2.3 2.3 0 0.00% FTEINST 22 22 0 0.00%
STUSERV 1.58 1.58 0 0.00% TOTREV 9.52 9.52 0 0.00% TGANG 197 197 0 0.00%
SUCGRDS 6.3 6.3 0 0.00% SUCPER 80.5 80.5 0 0.00%
2 TSCHRS 4.9 4.9 0 0.00% FTEINST 67 67 0 0.00%
STUSERV 1.9 1.9 0 0.00% TOTREV 21.6 21.6 0 0.00% TGANG 292 292 0 0.00%
SUCGRDS 7.5 7.5 0 0.00% SUCPER 38.93 38.93 0 0.00%
3 TSCHRS 6.2 6.2 0 0.00% FTEINST 95 95 0 0.00%
STUSERV 2.53 2.53 0 0.00% TOTREV 22.82 22.82 0 0.00% TGANG 393 393 0 0.00%
SUCGRDS 15.62 15.62 0 0.00% SUCPER 76.2 76.2 0 0.00%
4 ~~--~---~.
~ ¥tsusat®mlc -~~~=- =-o;i TSCHRS 5.4 5.4 0 0.00% FTEINST 57 57 0 0.00%
STUSERV 1.89 1.89 0 0.00% TOTREV 19.48 19.48 0 0.00% TGANG 286 286 0 0.00%
SUCGRDS 14.39 14.39 0 0.00% SUCPER 74.24 74.24 0 0.00%
5 TSCHRS 8.3 8.3 0 0.00% FTEINST 106 106 0 0.00%
STUSERV 2.89 2.89 0 0.00% TOTREV 27.03 27.03 0 0.00%
143

144

12
TOTREV 19.59 TGANG 460
SUCGRDS 12.96 SUCPER 72.67
0 9280838 Tunxis
TSCHRS 5 FTEINST 58
STUSERV 2.96 TOTREV 19.15 TGANG 335
SUCGRDS 11.63 SUCPER 74.1
145
22.98214 3.392149 17.32% 483.0368 23.03680 5.01% 15.58158 2.621589 20.23% 128.7517 56.08177 77.17%
5 0 0.00% 52.21642 -5.783573 -9.97%
2.96 0 0.00% 20.63391 1.483910 7.75% 384.9519 49.95192 14.91% 12.53119 0.901194 7.75% 137.4640 63.36401 85.51%
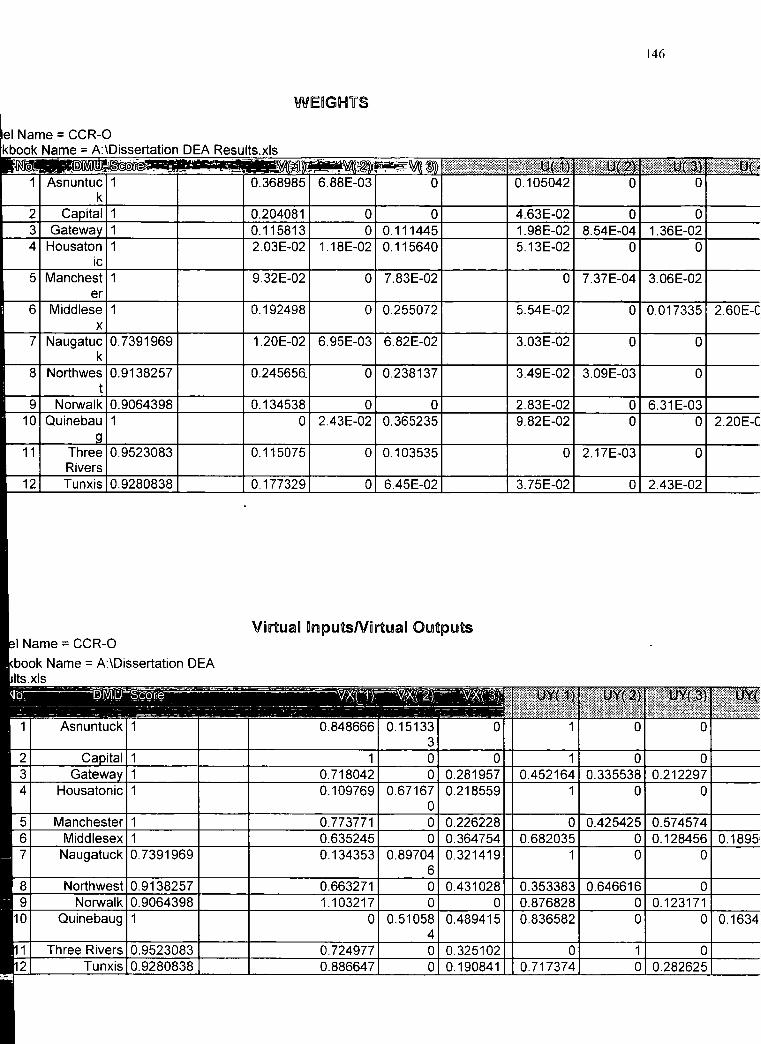
146
WE~GHTS
I Name = CCR-0 Name = A:\Dissertation DEA Results.xls
~~~
ic 5 Manchest 1 9.32E-02 0 7.83E-02 0 7.37E-04 3.06E-02
er 6 Middlese 1 0.192498 0 0.255072 5.54E-02 0 0.017335 2.60E-C
X
7 Naugatuc 0.7391969 1.20E-02 6.95E-03 6.82E-02 3.03E-02 0 0 k
8 Northwes 0.9138257 0.245656_ 0 0.238137 3.49E-02 3.09E-03 0 t
2.20E-C
VirtUial lnputsNirtual OUitpiUits

147
SLACKS
In summary of this section on Sensitivity Analysis, the model showed a level of
applicative robustness when changes were made to the variable values, using a different
DEA coding and to a lesser extent when an entire variable was removed from the data
set. The model results were least affected when the FTEINST variable was removed from
the input data as compared to the removal of the other variables of the study. However,
upon the removal of the unit with the highest frequency in the Reference Set, the model
results were most affected. Three more units attained the 100 % efficiency rating. This
was expected, since this study developed a relative efficiency rating based on the
performance of each unit. Mention should be made of the fact that the term "Applicative

148
Robustness" was used and not Robustness, because the determination of a robustness
factor should be based on the DEA system and the mode of solution of the Mathematical
Linear Programming problems coupled with marginal increases in stability variables of
the matrices involved. This in my opinion was too theoretical and not germane to the
intent to the study. Hence, the Robustness was based on the changes observed in the
efficiency values as data and system code changes were made.

Clhtapter 5
§ummary a1111d Co1111cltUI§nollll§
s.n §ummall"y
149
The inherent concern of institutions of higher education to acquire adequate resources waxes and wanes,
but never goes away. In the United States and so Connecticut, the 1960s were times when growth
justified considerable support for buildings, faculty, scholarship, and overall positive attitudes by the
general public. In most other times, support has increased or decreased with the public's expectations of
the common good of higher education. Generally speaking, a college degree has not always ensured a
good job or a secured future for all graduates and as a result, society is questioning whether a higher
education warrants additional taxes to support increased funding requests when compared to competing
interests and needs. Today, the public has higher education under heavy scrutiny and is clamoring for
higher levels of efficiency and accountability without weakening access and quality of the education
expenence.
On the other hand, The Community College Fact Book stated that community colleges represent
a financially efficient segment of Higher education, educating 43 percent of the US undergraduate for a
disproportionately small share of state and federal higher education monies (El-Khawas, Catier, and
Ottinger 1988,xviii). Although a majority of all entering freshmen begin their collegiate studies at
community colleges and state funds account for 50 percent of community college revenues, two-year
colleges receive only 19 percent of state funds for higher education and less than 10 percent of federal
higher education funds. Community college spokespersons must begin to make a more persuasive case
for more adequate funding.
!50
In Connecticut within the growing Community College System, the colleges are
responding to the cost containment by reducing expenditures (for example, more low enrollment
classes are constantly being removed, etc.) and seeking new sources of revenue (more grant
proposal are being written).
With the adoption of effective strategies during financial stress, many colleges are learning how
to manage efiectively. The resulting issue then would be the task of sustaining adaptations to
changes in the external environment while protecting excellence in the mission of discovery,
dissemination and preservation of knowledge. A college may be considered an enterprise in
which the professional staff and faculty provide the operating conditions for transforming
quantifiable resources (inputs) into graduates (outputs). As explained by Bessent et al. 1982,
school administrators can increase the productivity of individual schools through the hiring and
assignn1ent of personnel and through the provision of resources and incentives that have the
potential for increasing production if they are efficiently employed.
The aim of this study was to develop guidelines for improving the overall performance
(efficiency) of the Community Colleges of Connecticut using a linear programming technique
called Data Envelopment Analysis (DEA) .. DEA has evolved from the Simplex Method of
Mathematical Linear Programming into a comprehensive computer assisted mathematical model
for performing comparison between units with wide ranges of inputs and various outputs. No
other method provided an overall operational definition- either conceptually or
implementationally- of the efficiency of a school ( Bessent et al., 1982).
This new DEA method was developed to determine the relative efficiency of subunits of a
system where the production functions between the inputs and the outputs of the sub units were

151
unknown. DEA was very much suited for the analysis of institutions of higher learning within a
higher education system as that of the Community Colleges System of Connecticut, primarily
because the functional relationship between resources and outputs was not available and very
difficult to obtain, and the model had the facility of handling multiple inputs and multiple outputs
without priori definition of the weighting ofthe input/output variables.
From the analysis of the twelve community colleges in the Community College System
of Connecticut, the model deemed seven colleges to be operating at 100% efficiency and five
colleges to be operating below the 100% level. These results were nicely corroborated by a
second DEA model developed by Cooper et a! (2000) and also paralleled by the findings of a
senior financial administrator at one of the member college.
The study showed a distinctive trend in the operation of the five inefficient units: most of
the units in this group over consumed the resources and under produced the outputs by their
respective percentages as determined by the model and shown in their individual analysis in
Chapter 4 of this study.
The number of units (twelve) used in this study was too small for the minimal number of
three inputs and four outputs in order that the DEA model would meet Degree of Freedom
constraints. This was determined by the rule of thumb that was outlined elsewhere in the study.
Hence, the results of the model did yield a relatively higher number of efficient units. When the
number of variables (7) , that were originally used in this study was reduced to meet the
guidelines of the rule of thumb, this resulted in a sizeable decrease in the number of eilicient
units in the system. With two inputs and two outputs, which represented a massive decrease in
the aspects of the colleges' performance, the model showed that there were only two units that
were operating efficiently.

152
5.2 Cmndusimn
The results of this study indicated that DEA showed great promise as a tool for evaluating the
efficiency of Institutions of Higher Learning among many organizations. This method's ability to
take into account the multiple outputs and multiple inputs was used to provide perspective on other
managerial accounting tools similar to the Cost-per-unit type of analysis, and had proven to be
superior to these productivity factors types of tools. As described by Ahn, Charnes and Cooper
(1988), DEA can also be used as an alternative and perhaps more easily used approach than was
provided by statistical regressions and similar techniques, like the index number construction
method where a variety of a priori assumptions and /or weighting techniques must be provided for
the analysis. This was inadequate for the determinations needed to be made in this study. DEA
invariance to units and many other flexibilities made it very suitable for this study and attractive to
many researchers, however, as was demonstrated in the study, the model had a serious handicap
that concerned the number of units analyzed and the number of input/output variables that could be
actually used to characterize a unit in the study.
The small sample of units (twelve) is really stretching the DEA process beyond its capabilities, and
since this number of units ofthe system cannot be changed, coupled with the complexity ofthe
perfonnance of the colleges one is encouraged to apply the results ofthe model cautiously with the
suitable hesitation and caveats about the conclusion. The greater the number of variables that are
included, a better characterization ofthe colleges' performance is taken into account, however, this
would yield a greater number of colleges on the I 00% efficiency frontier. Hence there is a tension
between validity of the modeling ( the number of variables used to characterize the colleges) and
the discrimatory power (the number of etiicient units yielded) of the DEA Model. As shown in

chapter 4 above when the number of variables is decreased, merely to stay within the rule of
thumb, there was a drastic decrease in the number of efficient units
153

!54
§trellllgths and Weaknesses of the 11lEA Procedure
A. The DEA is a multi-input and multi-output linear programming based system
used to calculate the relative efficiency of organizations, agencies, and public
or private not-for-profit institutions of higher education called decision Making
Units (DMU's).
B. DEA pennitted each DMU to select any weights it wanted to use for each input
and output. As per the classical definition of efficiency, DEA used a ratio of a
sum of weighted outputs to a sum of weighted inputs. Hence it does not require
the user to supply weights to be attached to each input and output.
C. DEA does not require prior description of any functional relationship that
existed between the inputs and the outputs of the model.
D. The DMU's of a DEA system are compared to the best performer ofthe
group, so the relative efficiency of each DMU is calculated using the best
perfonner as reference, as opposed to the Regression Method where each unit is
compared to an average performance of all the units.
E. As per the rule of thumb concerning the number of units analyzed by DEA,
outlined elsewhere in the study, the model was very sensitive to the number of
units analyzed and the number of input and output variables used to
characterize the unit.
F. D EA identified the resources and the amounts of deficiencies of specific
resources that were responsible for the low level of performance of a given unit.

155
G. Because DEA Efficiency Scores are related they cannot be used as factors in
Regression Analysis to determine any other statistics of the scores. A Bootstrap
Procedure must be performed.
There were other shortcomings and strengths of the DEA that would be best
demonstrated by using examples. Consider the manager of an inefficient DMU who used
DEA results to identify inputs that were in excess of the amount needed if the unit was to
be efficient. This valuable infonnation was used to indicate unproductive processes
internal to the unit. Similarly, the manager or administrator might be required to justify
some input that he or she has in oversupply and for which a more effective use was
prevented by constraints over which he or she had no control.
The administrator of a set otT DMU's (say colleges) had additional problems concerning
the input allocations to subunits, and the DEA was less informative at this level. The
administrator aim was to allocate available resources to individual units in a manner that
will maximize the overall outputs of all subunits in some usefully defined way. In this
way, DEA can be used to provide pointers, but something more concrete was needed in
the way of overall planning models to achieve the overall "best" allocations. Here too,
DEA could help in supplying the needed coefficient values that were derivable from the
values of the virtual multipliers obtained trom the DEA application, as discussed in
previous sections of this study.
In the case of efficient units there was the question: Will additional input enable unit
administrators to increase output? If so, which inputs were the most promising for additional
allocation? Suppose the administrator knew or made a guess - based on knowledge of the
technology area and assisted by the DEA results- where to reallocate inputs. There was then the

!56
question: How much should be allocated to and withdrawn from which units to optimize overall
output of the units under his or her charge? A value structure or some sort of judgment must
enter when these choices were to be made. However, as per Bessent, I983, many conditions limit
what can be done, the fact that many faculty members were tenured and specialized and many
programs required expensive, high technology equipment reduced the flexibility ·for
reassignment of faculty and space. Equipment could be removed, new equipment could· be
installed, and faculty could be retrained but this would require additional time that were not
considered in the problem.
As outlined in the previous chapter of this study, the analysis of the DEA results followed the
three research questions of the study.
Research Question# 1
How do institutions of the Community College System of Connecticut compare to each other
regarding their levels of efficiency?
DEA was applied to a sample of the 12 colleges, the model produced an empirically
based me~sure of each college's ability to produce desired outputs from the inputs. The analysis
showed that seven colleges were ranked etlicient and the remaining five had a performance
assessment below I 00 % et1iciency rating. Quinebaug Valley, Asnuntuck, Middlesex, Capital,
Housatonic, Manchester, and Gateway Community Colleges comprised the group that attained
I 00% performance efficiency rating. While Three Rivers, Northwestern, Tunxis, Norwalk and
Naugatuck Valley Community Colleges had efficiency rating ranging from 95.23% to 73.92 %.
It should be reiterated that these results were based on the three inputs namely: TSCHRS- total
student contact hours generated by each college- (which acted as a surrogate for five other

157
inputs with which it was highly correlated), FTEINST- the number of Full Time Equivalent
Instructors and STUSERV- Student Services Expenditure and four outputs TOTREV- Total
Revenue, TGANG- total number of students completing degrees and certificate programs,
SUCGRDS- Total credit awarding grades given by the faculty., and SUCPER- percentage of
successful grades awarded. Within the group represented by TSCHRS there were some very
strong variables which had great descriptive potentials but had to be included in a group because
of the high level of correlation that existed within that group and the constraint of the number of
variables that could have been possibly used in the study. I strongly believe that each college
performed well for the different environmental conditions which they served for the period 1999-
2000. There were many non-tangible factors, excluded from the study, that were also responsible
for the differences in their efficiency level of performance of the various units. It should be
recognized that in this study only the technical efficiency, that is, efficiency based on the
organization of the available resources in such a way that the maximum feasible output is
produced, was addressed.
Research Question #2
What conditions may account for the differences in the level of success within similarly efficient
colleges?
This model did not show any potential improvement of a unit once it was placed on the frontier
efficiency line, that is, given the efficiency rating of 1 00 %. Hence, to draw conclusion on the
differences between the efficient units (colleges}, direct comparison of the values ofthe input and
output variables had to be made. For instance, Manchester Community College had the highest

158
OEAS, expenditure for Administration and Academic Services, although the college did not have
the highest student population for the period of the study, 1999-2000.in the System. There were
many more conclusions that could have been drawn by the mere examination of the data values
which were included in Table 4.3.
Research Question #3
What factors or constraints create the varying scores among inefficient colleges?
The seven variables of this study were identified as factors contributing at varying levels of
efficiency of the inefficient units analyzed in this research. All of the resources ofthese units were
over consumed and most of the products were under produced. From the research, this was the
most typical scenario in the analysis of educational systems. In this study there were five colleges
that were rated below 100 % efficiency, as shown in table 4.4, the inputs of all the inefficient units
were over consumed and had potential improvements in the form of a reductions of the resources
used, and all the outputs, with the exceptions of the TOTREV and TGANG variables had to be
increased, for each of the units in this category in order to achieve 100 % efficiency.
However, it should be noted that the DEA procedure did not yield absolute measures of efficiency,
rather, the inetlicient colleges were compared to an identified peer set (reference set) of colleges
that were similar in their levels and mixes of inputs. Administrators of the colleges should measure
159
the performance of their individual college as compared to a nom1. As pointed out by Bessent et
al.,( 1982), if an efficient school succeeds in raising its achievement more than others , then some
schools that were formerly efficient may become inefficient and some inefficient schools may be
reduced to even greater inefficiency.
The strength of the DEA lies in its ability to identify both sources and amounts of deficiencies
for specific resources that were responsible for the low level of performance of a given unit.
Colleges, which were identified as being relatively efficient, while having high levels of outputs,
could have been studied by the less efficient colleges to identify the practices that were used by
these successful colleges. College that were using their resources inefficiently and yet were
achieving relatively high levels of outputs could have been examined to determine whether their
resources should be reallocated to needier colleges. The important point to be made was that
DEA results must be carefully examined to take full advantage ofthe diagnostic data that was
available for each college's unique conditions. Decisions of the reallocation of resources (which
also required further inquiry beyond DEA) must be made in the context of careful consideration
of consequences for each member college within the system.
Although the model of this study presented a very quantitative outlook at the potential
improvements that the Community Colleges could undertake to achieve higher levels of
performance, there were limitations on the applications of this Linear Programming model to
determine good results on the mere twelve colleges of the Connecticut System. As shown by the
rough rule of thumb showed in the previous chapter:
N ~max{mxs,3(m+s)} where N is the number of units to be analyzed
and m is the number of inputs and s the outputs
160
The System had 12 for the value ofN, 3 for m and 4 fors, and so, as required by the rule
of thumb, N must be greater than or equal to a maximum value between 3 x 4 and 3( 3 +
4 ), that is between 12 and 21. TheN value ofthe study was in the vicinity of the interval,
mandated by the rough rule of thumb, and so, the model was not as discriminating as it
would have been with a larger number of colleges within the system. From the research it
was evident that DEA had been widely used in various methods of performance
assessment in a large genre of organizations, however, primarily because of the low
number of units that were analyzed in the study, there appeared to be a relatively high
number of efficient units.
5.3 Policy Recommendations and Implications
In general, it would seem to be unwise to give additional resources to inefficient units
since that would only increase their inefficiency unless they could improve their
technology by using the new resources.

The conclusions that were drawn from this study had implications for collaborative
college improvements, for managerial techniques in college administration and for
further research using the DEA procedure.
Implications for collaborative efforts
161
Implications concerning collaborative efforts for college improvements stemmed directly
from the DEA results. The effective use of DEA results depend on shared strategies for
college improvement, as well as upon shared sources of input and output data. Inherent
in the results of the DEA model was the provision of a Reference Set for each inefficient
unit. The Reference Set for each inefficient college, as demonstrated by the model and
defined elsewhere in the study, should serve as the benchmark, with which the inefficient
college should develop a collaboration. The reader is directed to Section 4.4 on Reference
Set, where Northwest Community College (an inefficient unit) was provided the
Reference Set of Asnuntuck, Capital and Manchester Community Colleges. The results
of the study identified that the respective Reference Set had many commonalities with the
inefficient unit, and so, some collaborative effort should be made to share resources
within this group and to lift the identified inefficient college to an efficient level. Other
collaborative work can be spearheaded within similar (those that were merged with a
Technical College and the unmerged) colleges of the system. With the same idea of
benchmarking provided by the Reference Set, the public four-year colleges can develop
direct conversation with a selected community college for the sole purpose of developing
collaborative efforts aimed at establishing better standards for the higher education
process and sharing the limited resources appropriated by the State for Higher education.

162
Implications for ManageriaB Tedmiques
Operations managers (Deans and Administrators) at the colleges and the central
governing bodies of the System could use DEA for providing quantitative proof of the
funding needed to achieve goals and to improve overall performance of individual
institution. DEA could also be used for the balancing of the appropriation of resources
among the different colleges of the System. As a forecasting tool, programs can be
evaluated with DEA, where the incremental changes in the inputs (resources) or the
outputs (products) needed to achieve 1 00% efficient operation would be determined,
thus, helping to produce successful outcomes. In essence, the DEA Procedure was
likened to the quintessential" Weegie Board" where administrators could have:
reallocated resources, identify the best practices. identify poor practices, set targets,
monitor efficiency changes over time, award tokens for good performances and plan site
for additional educational institution.
implications for further Research
Implications for further research included the analysis of colleges and universities in a
particular region; for example, the institutions of higher education within the New

England States appeared to have had considerable similarities but were still different.
Hence, DEA could have had quite a number of applications in the determination of the
factors that made these institutions perform differently.
163
As a second track for further research, the issue of resource allocation was once more
considered. The administrators of inefficient units could use DEA to identify inputs that
were in excess of the quantities required for the unit to be efficient. This is valuable data
that might be used to identity the unproductive processes internal to the unit. As an
alternative perspective, some administrator might be required to justify an input that
he/she has in oversupply and for which a more effective use was forbidden by some
politically motivated constraint. A similar issue arose for efficient units. Would
additional input enable the unit manager to increase inputs on the efficient units? If so
which inputs were the most promising for additional allocation. The question was best
proposed by the statement ... How much should be allocated to and withdrawn from what
units to optimize the overall output of the units under his/her charge ....
Bessent (1983) alluded to a fact at San Antonio College which was very pertinent to this
st~1dy of the Community College of Connecticut, the fact that many faculty were tenured
and specialized and many programs required expensive, high technology equipment
reduced the flexibility for reassignment of faculty and space. Equipment could be
removed, new equipment installed and faculty could be retrained but that required
extensions into dimensions of time that were not considered in the present analysis.
All of the above and more, in the form of some multiple objective mode ling would be
required in the same sense as the multiple input/ multiple output DEA evaluation that had
been used in this study, should be considered for future research in DEA type analysis.

164
5.4 Closing Remarks
165
In closing, one can say that DEA showed great promise to be a good evaluative tool for
future analysis on educational systems, where the production function between the inputs
and outputs was virtually absent or extremely difficult to acquire. The facility of multiple
inputs and multiple outputs of the DEA model was definitely an attractive one to most
researchers and hence, the DEA procedure had found many applications beyond
education into commerce, government and industry.
In the overall analysis, I believed that the Community Colleges of Connecticut
performed well for their respective service area for the period 1999-2000. The
discrimination created by the model whereby seven colleges were deemed efficient and
five inefficient should act merely as an indicator for the need for further iuvestigation of
the operations at the respective colleges. The limited number of variables used to
characterize the colleges, as demanded by the model for the small number of twelve
colleges yielded results that would have been inherently better had the model been
allowed to use more of the variables.
As outlined in the section on limitations of the DEA procedure, the DEA model
had its shortcomings as any other mathematical modeling tool, and in my opinion, the
study was severely handicapped by the small number of community colleges ( 12) in the
system. The study was forced to use a mere three inputs and four outputs from the total of
sixteen variables of data collected. There were many other important pieces of data that
would have helped to further characterize the operations of the community colleges of
this system, which had to be omitted from the calculations to attempt to meet the linear
programming constraints of the DEA. This was very unfortunate, and although the
number of units in the model criterion set by the rule of thumb, was not met, the results

166
did depict a relatively accurate discrimination between the efficient and the inefficient
units of the model, as observed by a senior financial administrator within the system of
colleges.
The Community Colleges of Connecticut have come a long way, from their
humble beginning of little more than a trade school to institutions of higher learning
offering the first two years of the four-year baccalaureate programs, with learning
environn1ents that would rival that of a number of universities in the United States.
However, although the Community Colleges had the autonomy to develop their
individual programs and the ability to shape each college into whatever the chief
administrators thought would be best for the service region, the quality markers that
would place a college in the top I 00 community colleges of the United States had never
been achieved by any member college of the Community College System of Connecticut.
The Appendix E of this study showed the list of the I 00 top community colleges of the
United States with their respective student population included. It should be noted that
there were colleges in this top I 00 group with student population lower than that of the
community colleges of Connecticut for the period of the study, 1999-2000.
Hence, it was evident that the Community Colleges of Connecticut Central Office
should adopt a quantitative approach. as demonstrated by the DEA model, to steer the
various institutions to a higher level of perfonnance, efficiency and accountability as
demanded by the Legislature of the State of Connecticut. In doing so, missions, strategic
plans and college developmental programs would have to be changed to transform the
community colleges of Connecticut into a place of inquiry where dreams are no longer
diverted and winners are made of ordinary people.

167
Gnossary
Meaning of Terms
To facilitate a thorough understanding of this study, it is necessary to provide a glossary
of the terms used in this research. The following is this list.
INPUTS A. TSCHRS - Student Contact Hours generated by each College (lecture and
Lab. hours for one course per week times the number of students times the
number of weeks of Instruction times the total number of courses otTered in
the academic year). This input is used in State Funding formulas and so it is
audited to guarantee that only students enrolled in courses unique to a given
program are counted. It represents an Input to the Output revenue generated
and to number of completors. A student is considered a completor when this
student has successfully completed coursework and has achieved stated
educational goals.
B. FTEINST - The number of Full Time Equivalent (FTE) Instructors in each
college. FTE should be based on a 12- credit-hour load for part-time staff
members.
C. TISQRF- Facilities allocation as determined by the square feet assigned to
each college for classroom, office, laboratory use and library facilities.
D. TDIEXP- Direct instructional expenditures in each college including

salaries, equipment and instructional supplies.
E. TOPP- Total Operational Expenditure for Physical Plant (building
maintenance, grounds and custodial services)
168
lF. OlEA§- Overhead expenditure for Administrative and Academic
support.
G. §TU§lERV- Expenditure for Student Services --student club activities,
trips, dances and some cafeteria expenses.
OUTPUT
A. TOTREV- Total revenue from Tuition, Fees, Government Appropriations
and Credit Free programs. Revenue earned by contact hours through state
funding formulas --- each college would lose revenue earned if the program
were terminated.
B. TGANG - The number of students completing programs (Degrees and
Certificates) or those who are far enough advanced to get a job. This output
was chosen instead of the number of students enrolled because the latter is
accounted for in the contact hour input and because the colleges have an
announced goal of preparing for the available job market.
C. EAS - Employer/ Admission satisfaction with training of students employed
or transferred to a four-year institution.
D. SUCGRDS - Total credit awarding grades given by the faculty. This figure
represents the courses for which the students received a passing grade (A to
0- and P). This figure should include all matriculating and non-matriculating

169
students. There are many students who come to the Community Colleges and
do not receive a diploma, they merely took a few courses to sharpen their
skills, change their careers or increase their knowledge base. This figure
measures a level of deliverability of the college and so, should be included as
an output for this study.
E. §UCPER -Percentage of successful grades awarded.
Efficiency: Efficiency relates to technical efficiency of a unit and refers to
the utilization of resources in such a way to produce the maximum feasible
output, that is, no other combination of resources could yield a larger output.
Output: Output is the measure of the results of a given system charged with
the duty to utilize inputs.
[nput: Input is defined as a resource or a factor of production that is used in a
production process.
Resource Allocation: Resource Allocation is defined as the apportionment or
utilization of personnel, material or funding to the colleges.
Regression Analysis: Regression Analysis is a statistical technique in which
the degree to which a set of independent variables relate or form a
relationship to a single dependent variable. The objective is to determine the
best fit line that lies between data points using a least square principle. The
method reflects an average or a central tendency behavior of the observation.
Data Envelopment Analysis( DEA): DEA is a calculation method derived
from Mathematical Linear Programming and utilizes multiple inputs and
outputs to determine the efficiency of the system from which the performance

170
variables came. DEA deals with the best perfonnance and evaluates all
performances by deviation from a frontier line.
Decision Making Unit (DMU): The entity on which the analysis is being
done, for example: a college, a bank or a transportation system.
Slack Values: Slack Values are the unnecessary consumption of resources or
the shortcomings of output as determined by the DEA process.
Return to Scale: Return to scale represents the proportionate increase/decrease
in outputs that results from a given increase/decrease in all inputs employed in
the production process. Three possible relationships can exist between the
change in inputs and the change in outputs:
For an increase in all inputs by a factor of K
1. Increasing return to scale : Output increases by more than K
2. Decreasing return to scale: output decreases by less than K
3. Constant return to scale : output increases by exactly K

171
Ahn, T.S., Arnold, V., Charnes, A., Cooper, W.W. (1989), DEA and Ratio
Efficiency Analyses [or Public Institutions of Higher Learning in Texas. (Research
in Government and Non-profit Accounting). Vol.5, 165-185.
Ahn, T.S. (1987), Efficiencv and Related Issues in Higher Education: A Data
Envelopment Analvsis Approach. Ph.D. dissertation, Graduate School of
Business, University of Texas. Source: Vol. 49 03-A of Dissertation Abstracts
. International. 543- 593
Aigner, D., Lovell, A. K. and Schn1idt, P.(l977). Formulation and estimation of
stochastic fi·ontier production function models. (Journal ofEconometrics), 6: 21-
37
Athanassopoulos, A.D., and Shale, E. (1997), Assessing the Comparative
E(ficiencv o[Higher Education Institutions in the UK by Means o[Data
Envelopment Analysis,: Education Economics, vol. 5, no. 2,. 117-34,
Ball, R. and Wilkinson, R.H.(l992), Measuring the Performance o[Higher
Education Institutions: The Application o[Data Envelopment Analysis.
Proceedings of the 13th International Forum of the European Association for
Institutional Research , M. Wright, ed., 219-234,
Banathy, B.A.(l991 ), Examining Performance in Community Colleges: Data
Envelopment Analysis as a Means o(increasing the Domain of Inquiry, Ph.D.

dissertation, University of California. Source: Volume 52/08-A of Dissertation
Abstracts International. 2761-2973
172
Banker, R.D. and Morey, R.C. (1986), Efficiency Analysis for Exogenously Fixed
Inputs and Outputs, ( Operations Research 34 ), 513-521
Beasley, J.E.(l990), Comparing University Departments, Omega-International
(Journal ofManagement Science), vol. 18, no. 2,
Bessent, A.M. and Bessent, E.W.(1981), Productivity in Communitv College
Programs: A Technique (or Determining Relative Efficiency,( ed. D.T.
Community Coli. Productivity Center)
Bessent, A .. M. (1983), Evaluation o(educational program proposal bv means o(
DEA, (Educational Administration Quarterly), Vol. 19,No. 2, 82-107
Bessent, A.M. and Bessent, E.W, Charnes, Cooper, and Thorogood(l983),
Evaluation o(Educationa/ Programs Proposals bv means o[DEA, (Educational
Administration Qumterly),Vol. 3, No. 2, 82- 107
Bhattacharyya A.,Lovell, C.A.K. and Shay,P., ( 1997), The impact of
Liberalization on the Productive Efficiency o(Jndian Commercial Banks'
(European Journal of Operation Research, 332-345 .
. Charnes, A., Cooper, W.W., and Rhodes, E.L.(l981), Evaluating Program and
Managerial Etficiencv: An Application o(Data Envelopment Analvsis to Program
Follow Through, (Management Science) .vol. 27, no. 6, 668-697
.Charnes, A., Cooper, W.W., and Rhodes, E.L(l978), A1easuring the Efficiency o(
Decision Making Units, European Journal of Operational Research, 2, 429 - 444

173
Chames, W. W. , McLaren, C. H.( 1994), Selection o(Jnput and Output Measures
in Data Envelopment Analvsis o(Large Indiana School Corporations,
Proceedings of the Annual Meeting- Decision Sciences Institute, 2, pp.1215-1217,
Cooper, W.W, Lewin, A.Y, Seiford, L.M.(1994), Data Envelopment Analysis:
Theory, Methodology, and Applications, 1994. (Kluwer Academic Publishers).
Boston
Cooper, W.W., Seiford, L.M., Tone, K.( 2000), Data Envelopment Analysis, A
Comprehensive Text with Models and Applications, ( Kluwer Academic
Publishers), Boston/Dordrecht/London.
Cox, Mary Anne B.(200 1 ), Summary and Histon1 of Connecticut Community
Colleges, (the System Office of the Connecticut Community Colleges)
Desai, A. ( 1986), Extension to Measures o(Relative Etliciencv with an
Application to Educational Productivity, Ph.D. dissertation, University of
Pennsylvania. Source: Volume 47/10-B Of Dissertation Abstracts International.
4285-4485.
Deprins, D. and Simar, L., (1989), Estimating Technical Efliciencies ·with
Correction {or Environmental Conditions with and Applications to Railways
Companies, (Annals ofPublic and Cooperative Economics), 60, 1(Jan-Mar) 81-
102.
El-Kawas, E., Cmter, J.C. and Ottinger, Cecilia, A.(1988.) Community College
Fact Book. (New York: MacMillian).

174
Farrell, M.J.(1957),The measurement o(Productive Ef!Jciencv (Journal of Royal
Statistical Society), 120,Sec. A, 253-281..
Ferrier, G.D. and Valdmanis, V., ( 1996), Rural Hospital PerfOrmance and its
correlates, (Journal of Productivity,&, (1 ), 63-80)
Goldstein, Harvey.(1990), Data Envelopment Analysis: An Exposition and
Critique, Evaluation and Research in Education, vol. 4, No. I.
Grosskopf S., ( 1996), Statistical Interence and Non-Parametric E(ficiencv:A
Selective Survey, (Journal of Productivity Analysis, 7, 161-176.
Haksever, C., and Muragishi, Y.(l998), Measuring Value in MBA Programs,
(Education Economics), vol. 6,no. 1, 11-25,.
Hanke, M., and leopoldseder, T.(l998),, 4/3, pp. 191-198, (Jessica Kingsley
Publishers. London) Comparing the Efiiciencv o(Austrian Universities: A Data
Envelopment Analvsis Application, Tertian; Education and Management
Hanison, M.E. Jr.(1988). Measuring the Comparative Technical Etficiencv of
Universities. Ph.D. dissertation, Graduate School o(Business Administration,
University o(North Carolina. Vol. 50/03-A of0isset1ation Abstracts
International. Page 63 5. 418
Hauksson, A.G.(I988), The Commercialization of University Research
Discoveries: Are University Technologv Transfer Offices Stimulating the
Process? Ph.D. dissertation, (Massachusetts Institute ofTechnology; 0753.)
Hussain and Brightman (2000), Frontier Analyst- How Data Envelopment
Analysis Works, (The Economic Journal)
Hoffman,A.J.(l957) Commentator to: The Measure o(productive Efticiencv,(
Royal Statistical Society)
175
Justinger, M.E.S.(l986), An Efticiencv Analvsis o(Services for Adult Students
at CommuniD; Colleges. Ed. D. dissertation, State University ofNew York. Vol.
47/03-A ofDissertation Abstracts International. Page 767. 102
.lesson, David; Mayston, David; Smith, Peter,(1987), Performance Assessment in
the Education Sector: educational and economic perspectives, (Oxford Review of
Education), Vol. 13, No.3,
Johnes, Jill; Johnes Gerairit (1995), Research Funding and Perfonnance in U.K.
University Departments of Economics: A Frontier Analysis, (Economics of
Education Review). Vol.l4,No.3 pp. 301-314
Johnson, S.L ( 1995 ), Organizational Structure and the PerfOrmance o(Contract
Training Operations in American Community Colleges, Ph.D. dissertation, (The
University of Texas at Austin).
Kao, C.(1994), Evaluation o(Junior Colleges o(Technology- The Taiwan Case,
(European Journal of Operational Research), vol. 72, no. 1, 43-51.

176
Kwimbere, F.J.(1987), Measuring Efficiency in Not-For-Profit Organizations: An
Attempt to Evaluate Efficiencv in Selected U.K. UniversiD1 Departments Using
Data Envelopment Analysis CDEA). M.Sc. thesis, School of Management,
University of Bath
Lovell, C.A.K.(1993), Production Frontiers and Production Efficiency, in Fried
H.O., C.A.K. Lovell and SS Schmidt, eds., The Measurement ofProductive
Efficiency: Techniques and Application (Oxford University Press, UK).
Lovell, C.A.K.,Walters, L.C., and Wood, L.L.(1991), Stratified Models of
Education Production Using Modified DEA and Regression Analysis,
Puttakul, W. (1994),Technical Efficiency ofArea Vocational-Technical Schools:
An Illustrative Studv o(the Application ofData Envelopment Analysis CDEA).
Ph.D. Dissertation, University of Missouri - Columbia;
Ray, S.C.(l991), Resource-Use Efficiency in Public Schools: A Studv of
Connecticut Data, (Management Science). vol. 37, no. 12, and pp. 1620-1628,
Reaves, L.J .(1983 ), Using Data Envelopment Analysis to Operationalize the
Concept ofEqual Education Opportunity. Ph.D. dissertation, College of
Education, University of Texas. Vol. 44/04-A of Dissertation Abstracts
International. Page 945- 184.
177
Rhodes, E.L.(1978),Data Envelopment Analysis and Approaches (or Measuring
the Efficiency o[Decision-making Units with an Application to Program Follow
Through in US. Education. Ph.D. dissertation,(School ofUrban and Public
Affairs, Carnegie-Mellon University). Vol. 41/08-A of Dissertation Abstracts
International.
Seiford L.M., (1996), Data Envelopment Analysis: The evolution ofthe State of
the art(1978-1995), (Journal of Productivity Analysis, 7, 99-138.
Sexton, et al.,( 1986), The methodology o[Data Envelopment Analysis, in New
Directions fOr program evaluation, ( Jossey-Bass) Vol.32, No.2, Pg 7-29
Simar, L., Lovell, C.A.K., and Eeckaut, Vanden,P. (1994), Stochastic Frontier
Incorporating Exogenous Influences o[Ef!iciencv. Discussion paper 9403
(lnstitut de Statistique, Universite Catholique de Louvain, Belgium).
Si mar, L. and Wilson ( 1995), Sensitivity Analysis o[E(ficiencv Sccores: Hmr to
Boots/rap in Non-parametric Frontier Models. Discussion paper 9503 (Institut de
Statistique Universite Catholique de Louuvain, Belgium)
Thorogood, N.J .C.(1983), The Application and Utilization o{Data Envelopment
Analysis {Or Decision Support in the Administration o(lnstructional Programs {or
an Urban Community College. Ph.D. dissertation, College of Education,
University of Texas. Vol. 44/06-A of Dissertation Abstracts International. Page
1658.252
Xue, M., and Harker, P.T.,(l999)0vercoming the Inherent Dependency o(DEA
E(liciencv Scores: A boot strap Approach, Working Papers 99-17, (Financial
Institution Center, The Wharton School, University ofPennsylvania).
Appendix A
How does Data Envelopment Analysis (DEA) work?
Data envelopment Analysis was developed to assist researchers and investigators
evaluate and improve performance of their organizations. Managers were constantly
under pressure to improve the performance and accountability of their respective
organizations. It was a fact that in the public sector, government officials were seeking
better value for taxpayers' money and on a larger scale, global economy had created
competitive pressures on industrial and commercial companies.
178
Previously researchers and managers used factors like cost per unit or profit per
unit to detem1ine the productivity of a unit based on single variables, in this case cost or
profit. This measure of productivity only yielded a partial productivity index for a given
unit, and so, there would be need for many partial productivity indices to characterize a
total productivity of any unit. The move from pattial productivity index to total
productivity index of any unit was met with many difficulties, such as the selection of the
best inputs and outputs and the necessary weights needed for each of these variables to tit
within a model. Also there was the life long problem of the production function that
related the inputs to the outputs. However, the adoption of the DEA procedure eliminated
the need for any of the above infonnation and total productivity could be acquired for a
unit.

179
As mentioned previously, the facility of using multiple inputs and multiple
outputs without prior determination of production function that exists between the inputs
and the outputs,
was the most attractive facet of the DEA procedure particularly in the determination of
the efficiency of educational institutions. Apart from being able to discriminate between
the efficient and the inefficient units, the DEA procedure had the ability to suggest
potential improvement for specific variables of the inetlicient units to bring them up to an
efficient level of operation.
In order to graphically demonstrate the concept of Data Envelopment Analysis,
two variables ( 1 inputs, the number of teachers and 1 outputs, number of graduates), with
no known functional relationship between them, from seven high schools in the West
Indies where a British type of education was used, were selected . At these schools a
student graduated successfully only when he/she passed five subjects in the General
Certificate of Education (GCE) examination at the end of a five-year period ofhigh
school studies.

180
The following data was obtained for the demonstration:
Table A-1 High Schools Data
No. School Input Output Productivity
No. ofteachers No. of Graduates Grad/teacher
St. Mary's 90 230 2.55
2 Holy Cross 35 85 2.43
" Fatima 82 185 2.25 .)
4 Trinity 75 120 1.60
5 Presentation 95 218 2.29
6 Queen's Royal 98 210 2.14
7 Senior Comp. 90 160 1.77

250
0-200 •Ill
0 Cl) 150 ~ni
- ::::s .e. "E 1oo ::::s C) 50 0
0
0
181
DEA Graphical Analysis
20 40 60 80 100 120
Input (No. of Teachers)
The slope of the line drawn from the origin to any unit on the above graph determined the
productivity (Graduates/ teacher) of each school and the highest slope, which was
attained by the line that went through the origin and unit # 1 was called the Efficient
Frontier. This efficient frontier line envelopes the rest ofthe units, hence, the name Data
Envelopment Analysis. The efficiency of the remaining units were measured up against
the frontier line produced by unit # 1
(1 00% efficiency).
At this point, it was very important to highlight the deviation of the DEA procedure from
the previously used statistical methods of analysis. Normally, to analyze the above data
on the schools, one would develop a regression line through the data points and visually
examine the units that fell above the regression line and were considered to be those units
that were performing excellent and those below the regression line were the
unsatisfactory performers. The magnitude of the performance was detennined by
measuring the deviation of each unit from the regression line. This use of regression line
method reflected the average or the central tendency behavior of the units, while the DEA

182
dealt with the best performance and determined all performances by their deviations from
the Efficient Frontier line. This characterized the fundamental difference between the
DEA procedure and the Statistical Methods.
The etlicient frontier line drawn on the above graph demonstrated that unit # 1 was 100 %
efficient relative to the remaining schools of the group under study. Based on the
performances of unit #1 the efficiencies ofthe remaining schools were calculated using
the following:
Graduates/ Teacher of other units 0 < <
Graduates/teacher of unit # 1
Efficiency of the schools
Unit No. Efficiency (%)
100
2 95
3 88
4 65
5 90
6 84
7 69

183
Placed in the order of decreasing efficiency, the schools stack up in the following way:
#I > #2 > # 5 > #3 > #6 > #7 > #4 .
School #1 set the benchmark for the remaining schools of the group to emulate, and so,
the
efficiency levels calculated were·all relative to the best performer of the group.
The next step in this analysis was to determine how to raise the efficiency levels
of the inefficient units to 100 %. This was demonstrated by observing the performance of
school #4, Trinity High School. From the graph on the DEA Graphical Analysis, there
are two arrows that pointed out from unit #4, showing the two different options this unit
had to achieve I 00% efficiency level. Trinity High School (Unit#4) could have reduced
the number of teachers from 75 to 48 and this would bring the school to an efficient level
of operation or it could have increased the number of graduates from 120 to 185 students.
The latter appeared to be the more feasible proposal. Between the points A and B on the
graph, there existed a multiple of combinations of inputs and outputs that would bring the
unit up to a 100 % efficiency level. In a similar manner, the other inefficient units could
have been brought up to an efficient level by measuring the possible augmentation the
input or output variables must undergo. Not all the recommendations made by the
analysis were very applicable.
In many cases the reduction of the number of teachers in a school was not the best
line of action to improve the efficiency level of the unit in question. However, the
increase in the number of graduates produced by each unit always appeared to be a more
attractive altemative.
184
With the addition of many more input/output variables to a study, it was physically
impossible to represent this type of analysis on a two dimensional plane. Hence, with this
same type of analysis using multiple inputs and outputs and Mathematical Linear
Programming a computer model was developed to handle the analysis of systems of units
with multiple inputs and multiple outputs. It must be understood that there were many
more variables that would have affected the performance rating of the high schools, for
example, the achievement of the students prior to entering the respective high schools and
many more which cannot be used to make my two dimensional demonstration of the
workings ofthe DEA Procedure.
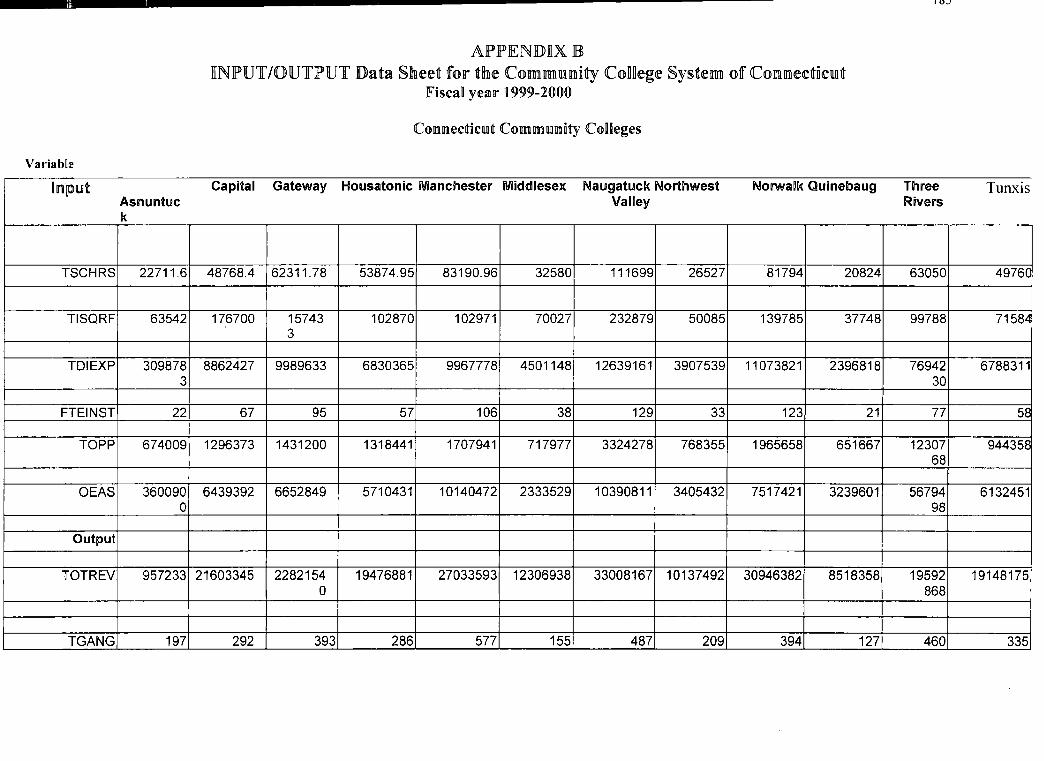
Variab1£
kopiUit Asnuntuc k
TSCHRS 22711.6
TISQRF 63542
TDIEXP 309878 3
FTEINST 22
TOPP 674009
OEAS 360090 0
Output
TOT REV 957233
TGANG 197
AIPPJENDJIX lB 1INPU1'/0U1'PlUT Data Sheet for tllne Commllllllllncy CoDllege System of Colllllllledn£1lllt
JF'nscan yea !I" ~ 999-2000
Commedncunt Commmrnnty CoDleges
Capital Gateway Housatonic Manchester Middlesex Naugatuck Northwest Noii'Wa~k QaJinebaug Valley
48768.4 62311.78 53874.95 83190.96 32580 111699 26527 81794 20824
176700 15743 102870 102971 70027 232879 50085 139785 37748 3
8862427 9989633 6830365 9967778 4501148 12639161 3907539 11073821 2396818
67 95 57 106 38 129 33 123 21
1296373 1431200 1318441 1707941 717977 3324278 768355 1965658 651667
6439392 6652849 5710431 10140472 2333529 10390811 3405432 7517421 3239601
21603345 2282154 19476881 27033593 12306938 33008167 10137492 30946382 8518358 0
292 393 286 577 155 ____ 48_Z 209 394 127
IO.J
Three Tunxis Rivers
63050 4976C
99788 71584
76942 6788311 30
77 58
12307 944358 68
56794 6132451 98
19592 19148175 868
460 3351
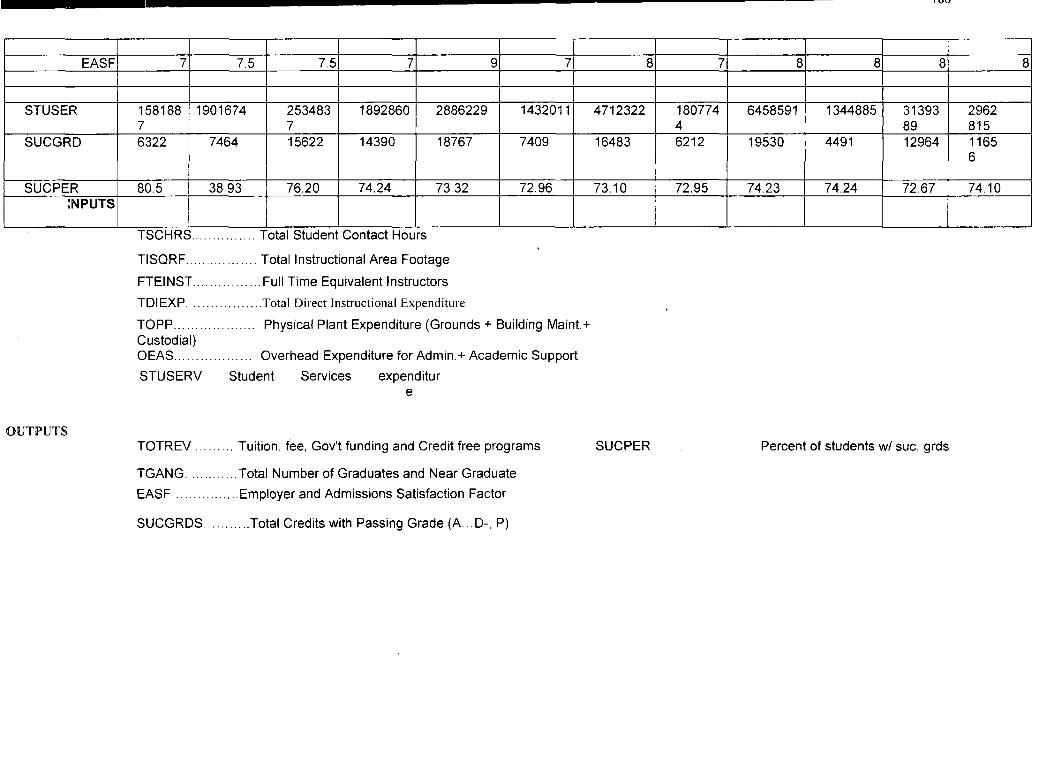
IOU
EASF 7 7.5 7.5 7 9 7 8 7 8 8 8 8
STUSER 158188 1901674 253483 1892860 2886229 1432011 4712322 180774 6458591 1344885 31393 2962 7 7 4 89 815
SUCGRD 6322 7464 15622 14390 18767 7409 16483 6212 19530 4491 12964 1165 6
SUCPER 80.5 38.93 76.20 74.24 73.32 72.96 73.10 72.95 74.23 74.24 72.67 74.10 ~NPUTS
TSCHRS ............... Total Student Contact Hours
TISQRF ................ Total Instructional Area Footage
FTEINST. ............... Full Time Equivalent Instructors
TDIEXP ................. Total Direct Instructional Expenditure
TOPP ................... Physical Plant Expenditure (Grounds+ Building Maint.+ Custodial) OEAS ................. Overhead Expenditure for Admin.+ Academic Support
STUSERV Student Services expenditur e
OUTPUTS TOTREV ......... Tuition, fee, Gov't funding and Credit free programs SUCPER Percent of students w/ sue. grds
TGANG ............ Total Number of Graduates and Near Graduate
EASF ................ Employer and Admissions Satisfaction Factor
SUCGRDS ........... Total Credits with Passing Grade (A. .. 0-, P)

Capital Gateway Housatonic Manchester Middlesex Naugatuck Northwest Norwalk Quinebaug Asnuntuc Valley
~ VARIABLE
TOTEXP 10213293 22047694 23750638 18266905 27348927 12298547 34148893 10492748 29940737 8747800
TGANG 197 292 393 286 577 155 487 209 394 127
EXP/GRAD 51844.1 75505.8 60434.CA 63870.3 47398.5 79345.5 70120.93 50204.54 75991.72 68880.3 3 Put!'
-
.
Three Rivers
19497145
460
42385.1
Tunxi s
18299 801
335
54626. 27

APPENDIX C
Degrees and Certificates awarded 1999-2000
CONNECTICUT COMMUNITY COLLEGES ASSOCIATE DEGREES AND CERTIFICATES AWARDED
July 1, 1999 - June 30, 2000
Naugatuc Northwester Quinebau Three k n Q
Asnuntu Capital Gateway Housatoni Manchest Middlesex Valley Connecticut Norwalk Valley Rivers Tunxis Total ck c er
M F M F M F M F M F M F M F M F M F M F M F M F M F Business & DP
Accounting 2 9 7 17 1 22 5 13 CAP 30 1 9 5 16 3 5 8 10 2 6 7 16 2 17 62 170 ut!'
Business Admin 8 26 3 6 9 16 7 ,46 17 12 4 12 10 13 6 6 11 CA 5 4 9 16 7 14 96 160 Put!
'
DP 11 12 11 26 23 8 3 3 16 16 4 3 2 5 7 6 9 15 4 2 3 1 14 6 107 103 Institutional Mqmt 0 0 0 0 5 3 0 0 11 16 0 0 6 13 0 0 3 3 0 0 2 4 0 0 27 39 Marketinq 0 4 0 0 1 2 0 0 0 2 4 3 1 5 0 0 11 15 0 0 3 8 2 3 22 42 I I Office Admin Career 0 1 0 1 0 15 0 3. 0 18 0 4 0 15 2 13 1 8 1 12 0 - 7 0 12 4 109 I Subtotal 21 52 21 50 39 66 15 35 63 94 13 31 24 67 18 30 43 70 12 24 24 52 25 52 318 623 941 Business & DP 24.1
%
Health Related .,,,
Allied Health Srvs 0 0 0 5 0 0 0 0 0 0 0 0 0 0 2 10 0 0 0 12 0 Q 0 0 2 27 Allied Health Tech 0 0 5 13 5 25 8 23 9 16 5 10 8 16 0 4 2 5 2 7 2 0 3 51 49 170 Mental Health/H.S. 0 18 4 7 10 27 8 28 12 49 1 13 1 20 2 35 2 11 1 7 1 6 3 30 45 251 Nursinq 0 0 10 69 0 0 0 14 0 0 0 0 3 55 0 0 1 26 0 0 2 32 0 0 16 196 Subtotal 0 18 CAP 94 15 52 16 65 21 65 6 23 12 91 4 49 5 42 3 26 5 38 6 81 112 644
ut!'
' - -- . - L__ - --- L__ _ ___ - - -- -- --- ------ ---- I

Visual & Performing I Arts Graphic Design 0 0 0 0 5 5 2 3 7 5 0 0 1 3 2 5 0 0 2 0 0 0 5 10 24 31 Fine Arts 0 0 0 0 0 0 1 4 4 8 0 1 4 2 5 11 0 0 1 5 0 0 1 4 16 35 Theatre Arts 0 0 0 0 0 0 0 0 0 0 0 0 0 0 0 0 0 0 0 0 0 0 0 0 0 0 Music 0 0 0 0 0 0 0 0 0 0 0 0 1 0 0 0 0 0 0 0 0 0 0 0 1 0 I Subtotal 0 0 0 0 5 5 3 7 11 13 0 1 6 5 7 16 0 0 3 5 0 0 6 14 41 66 I
I Industry & Manufacturing Tech
Mech & Repairers 0 0 0 0 23 0 0 0 0 0 0 0 11 0 0 0 0 0 1 0 0 0 0 0 35 0 lndust Environmental 0 0 0 0 0 0 0 0 0 0 0 0 2 0 0 0 0 0 0 0 0 0 0 0 2 0 Manufacturinq Enq 0 0 1 0 5 1 0 0 1 0 0 0 16 1 0 0 0 0 0 0 9 1 0 0 32 3 Mechanical Enq 0 0 0 0 2 0 0 0 0 0 0 0 5 2· 0 0 0 0 0 0 8 0 0 0 15 2 Quality Assurance 0 0 0 0 0 0 0 0 0 0 0 0 6 5 0 ; 0 0 0 0 0 0 0 0 0 6 5 Industrial Manaqe. 3 1 0 0 0 0 0 0 2 0 0 0 1 0 0 0 0 0 0 0 0 0 0 0 6 1 Subtotal 3 1 1 0 30 1 0 0 3 0 0 0 41 8 ., C) 0 0 0 1 0 17 1 0 0 96 11 I
Precision Production '""' Tech
CAD ID 1 1 3 f) 2 0 0 0 0 0 0 0 4 4 0 , 0 0 0 0 0 CAP 5 0 1 29 11 ut! '
Graphic Communic. 0 0 0 0 5 0 0 0 0 0 0 0 0 0 0 0 0 0 0 0 0 0 0 0 5 0 Subtotal 1 1 3 0 7 0 0 0 0 0 0 0 4 4 0 0 0 0 0 0 CAP 5 0 1 34 1i
ut!'
Architectural/Civil Eng Tech
Arch/Construction 0 0 2 0 0 0 0 0 0 0 0 0 0 0 0 0 9 1 0 0 2 2 0 0 13 3 Civil Engineering 0 0 3 0 0 0 0 0 0 0 0 0 0 0 0 0 0 0 0 0 7 2 0 0 10 2 Subtotal 0 0 5 0 0 0 0 0 0 0 0 0 0 0 0 0 9 1 0 0 9 4 0 0 23 5
I I I I Naugatuc Northwester Quinebau Three
k n Q
Asnuntu Capital Gateway Housatoni Manchest Middlesex Valley Connecticut Norwalk Valley Rivers Tunxis Total ck c er
M F M F M F M F M F M F M F M F M F M F M F M F M F
Electrical Engineering

Tech Biomedical Enq 0 0 0 0 1 0 0 0 0 0 0 0 0 0 0 0 0 0 0 Q 0 0 0 0 1 0 I Computer Sys Enq 0 0 1 1 20 5 3 0 0 0 0 0 28 14 14 3 8 1 3 3 8 6 5 3 90 36 I Electrical 0 0 17 0 9 3 0 0 0 '0 0 0 9 0 1 0 9 0 0 0 8 ; 0 0 53 4 Engineering Electromech. Eng 0 "' 0 0 0 0 0 0 0 0 0 0 0 0 0 0 0 0 0 0 . 0 0 0 0 0 0 0 Optical Engineering 0 0 0 0 0 0 0 0 0 0 0 0 0 0 0 0 0 0 0 0 6 0 0 0 6 0 Subtotal 0 0 18 1 30 8 3 0 0 · 6 0 0 37 14 15 3 17 1 3 3 22 7 5 3. 150 40 190 Electrical 4.9%
' ,:, Engineering
Science Technology Horticultural Enq 0 0 0 0 0 0 0 0 0 0 0 0 6 4 0 0 0 0 0 0 0 0 0 0 6 4 Environment. 0 0 0 0 4 1 0 0 0 0 1 1 2 1 0 0 1 0 0 0 3 0 0 0 11 3 Eng!Tox Chemical 0 0 5 4 0 0 0 0 0 0 0 0 2 0 0 0 0 0 0 0 0 0 0 0 7 4
I Enqineerinq Nuclear Enqineering 0 0 0 0 0 0 0 0 0 0 0 0 0 0 0 0 0 0 0 0 6 1 0 0 6 1 Subtotal 0 0 5 4 4 1 0 0 0 0 1 1 10 5 0 0 1 0 0 0 9 1 0 0 30 12
Public Services Criminal Justice 0 4 0 0 0 0 14 CA 42 20 0 0 14 6 5 3 7 9 0 · o 6 8 60 30 148 99
PUt! '
Fire Tech 0 0 2 0 0 0 0 0 0 0 0 0 1 0 0 0 3 2 0 . 0 7 0 0 0 13 2 Legal Assisting 0 0 0 0 0 0 0 0 2 25 0 0 3 11 0 1 1 14 0 0 0 0 0 0 6 51 Public Admin/Govt 0 0 0 0 0 0 0 0 0 0 0 0 0 0 0 0 0 0 0 0 0 0 0 0 0 0 Subtotal 0 4 · 2 0 0 0 14 CA 44 45 0 ~0 18 17 5 4 11 25 ,0 q 13 8 60 30 167 152
Put! '
College of Technology Technological 5 3 0 0 4 2 0 0 0 0 0 1 0 0 1 0 0 0 0 0 0 0 3 2 13 8 Studies ' Engineering Science 2 0 0 0 4 1 0 0 14 1 0 0 0 0 0 0 4 2 0 0 8 0 0 0 32 4 Subtotal 7 3 0 0 8 3 0 0 14 1 0 1 0 0 1 0 4 2 0 0 8 0 3 2 45 12
!Child Care/ECE 0 4 0 18 2 26 0 21 0 15 0 0 0 15 2 4 1 27 . 0 2 0 CA 0 0 5 151 Put!
' ~-- ---- ~---~------------'-------~---- ---- ---- _......______;___

\Communications 6 0 0 0 0 0 0 0 4 11 7 3 0 0 0 0 0 0 0 0 0 0 0 1 17 15 M
IDP Technology 0 0 0 0 0 0 0 0 0 0 0 0 0 0 0 0 0 0 0 0 0 0 0 0 0 0
"'-ibrary Science 0 0 1 2 0 0 0 0 0 0 0 0 0 0 0 0 0 0 0 0 2 5 0 0 3 7 I
r ec & Leisure Stds 0 0 0 0 0 3 0 0 2 0 0 0 0 1 8 1 1 5 0 0 0 0 ' 0 0 11 10 2,81 1 Occup 71.9 . ,., ~ %
r eneral Studies 22 44 0 0 26 61 24 54 61 99 24 43 CAP 29 7 14 30 49 14 16 74 75 7 21 308 505 813 20.8 ut! ' %
1 '101 LAS & Gen Stds 28.1 %
[Liberal Arts & Sci 4 6 7 41 1 0 5 5 3 8 0 1 29 31 10 11 13 37 1 14 32 11 3 15 108 180 288 7.4% I I
r asic Skills (ESL) 0 0 0 0 0 0 0 0 0 0 0 0 0 0 0 0 0 0 0 0 0 0 0 0 0 0 0 Special/Non- 0.0% degree
"
All Programs 64 133 82 210 167 2.26 80 206 226 351 : 51 104 200 287 77 132 135 259 37 90 234 226 115 220 1,46 2,44 3,912 Total I 8 4
09/08/1 999
;
- - --- - - - - -- -- --
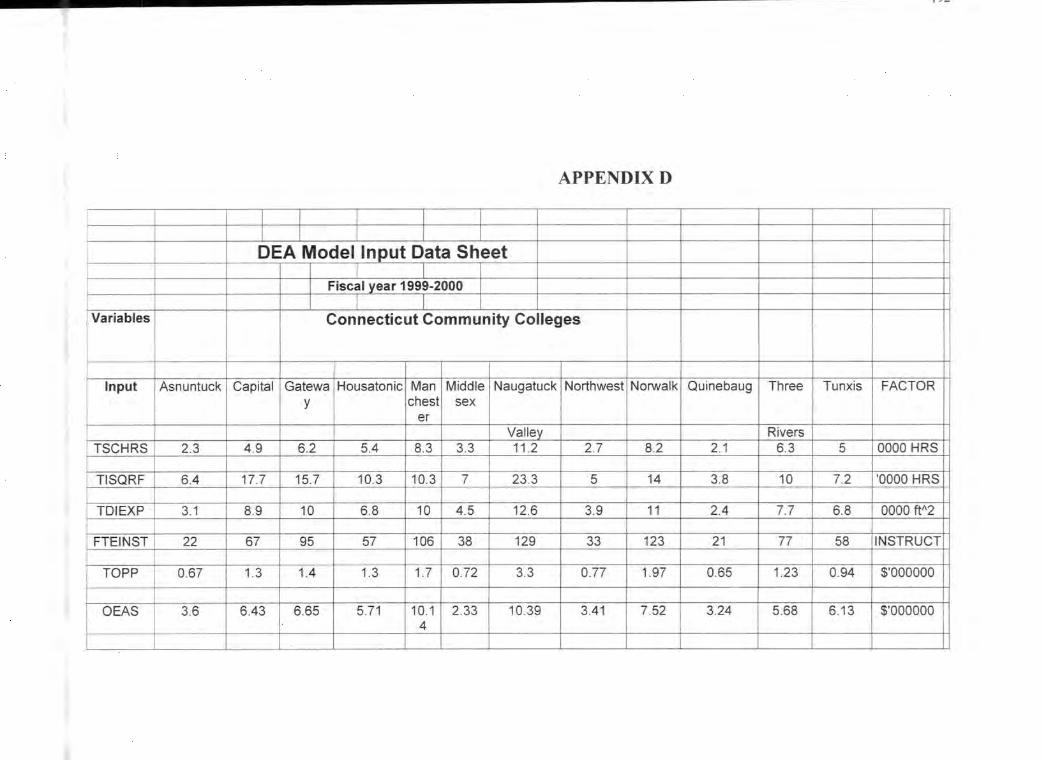
I /"-
APPENDIXD
I I I I I I I I DEA Model Input Data Sheet
I I Fiscal year 1999-2000
I I Variables Connecticut Community Colleges
Input Asnuntuck Capital Gatewa Housatonic Man Middle Naugatuck Northwest Norwalk Quinebaug Three Tunxis FACTOR y chest sex
er Valley Rivers
TSCHRS 2.3 4.9 6.2 5.4 8.3 3.3 11 .2 2.7 8.2 2.1 6.3 5 0000 HRS
TISQRF 6.4 17.7 15.7 10.3 10.3 7 23.3 5 14 3.8 10 7.2 '0000 HRS
TDIEXP 3.1 8.9 10 6.8 10 4.5 12.6 3.9 11 2.4 7.7 6.8 0000 ft"2
FTEINST 22 67 95 57 106 38 129 33 123 21 77 58 INSTRUCT
TOPP 0.67 1.3 1.4 1.3 1.7 0.72 3.3 0.77 1.97 0.65 1.23 0.94 $'000000
OEAS 3.6 6.43 6.65 5.71 10.1 2.33 10.39 3.41 7.52 3.24 5.68 6.13 $'000000 4
--L__

9.52 21 .6 I 22.82 I CAPut!'.48 l 27.0 1 12.31 3
33.01 10.14 30.95
f'j j
CAPut! '.! CAPut! '. I $'000000 59 15
8.52

APPENDIX E
lOO TOP ASSOC[ATJE'S DEGREE lP'ROliHJCERS, 1999-2000
Two year institutions State Men Women Total 1 MIAMI-DADE COMMUNITY COLLEGE Fla. 1543 2442 3985 2 RICKS COLLEGE Idaho 3177 2040 5217 3 VALENCIA COMMUNITY COLLEGE Fla. 1137 1817 2954 4 NASSAU COMMUNITY COLLEGE N.Y. 1222 1677 2899 5 FLORIDA COMMUNITY COLLEGE AT JACK. Fla. 888 1533 2421 6 ST. PETERSSURG JUNIOR COLLEGE Fla. 816 1568 2384 7 MACOMB COMMUNITY COLLEGE Mic h. 1021 1321 2342 8 CENTRALTEXASCOLLEGE Texas 1215 886 2101 9 SANTA FE COMMUNITY COLLEGE Fla. 922 1148 2070
10 MONROE COMMUNITY COLLEGE N.Y. 839 1200 2039 11 SALT LAKE COMMUNITY COLLEGE Utah 955 1013 1968. 12 PALM AEACH COMMUNITY COLLEGE Fla. 689 1192 1881 13 CUNY-BOROUGH OF MANHATTAN COLLEGE NY. 540 1336 1876 11 BROW ARD COMMUNITY COLLEGE Fla. 651 1208 1859 15 NORTHERN VIRGINIA COMMUNITY COLLEGE V a. 714 1097 1811 16 SANTA ROSA JUNIOR COLLEGE Calif. 748 1060 1808 17 T ARRANT COUNTY COLLEGE DISTRICT Texas 695 1109 1804 15 BREV ARD COMMUNITY COLLEGE-COCOA Fla. 619 1020 1639 19 COLLEGE OF DUPAGE Ill. 619 939 1558 20 HILLSBOROUGH COMMUNITY COLLEGE Fla. 566 971 1537 21 CUY AHOGA COMMUNITY COLLEGE Ohio 424 1082 1506 22 SIERRA COLLEGE Calif. 562 916 1478 23 SUFFOLK COUNTY COMM. COLLEGE N.Y. 589 863 1452 24 TIDEWATER COMMUNITY COLLEGE V a. 543 897 1434 25 HUDSON V ALLEY COMMUNITY COLLEGE N.Y 725 696 1421 26 T ALLAHASSEE COMMUNITY COLLEGE Fla. 622 770 1392
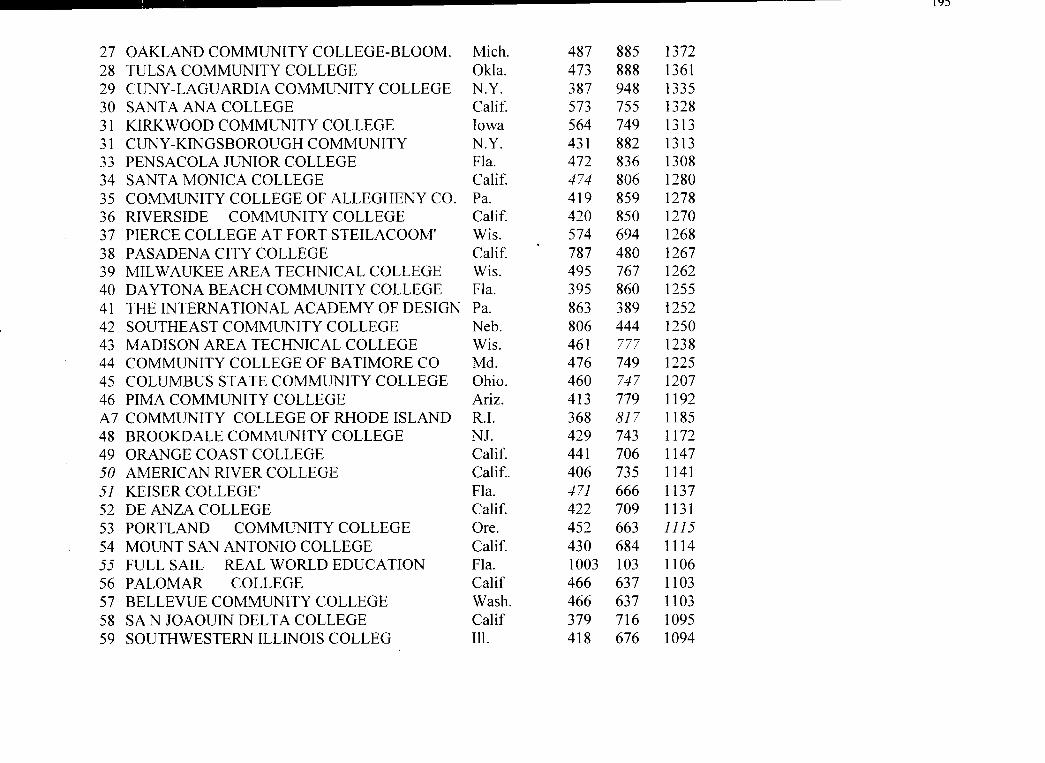
IY~
27 OAKLAND COMMUNITY COLLEGE-BLOOM. Mic h. 487 885 1372 28 TULSA COMMUNITY COLLEGE Okla. 473 888 1361 29 CUNY-LAGUARDIA COMMUNITY COLLEGE N.Y. 387 948 1335 30 SANTA ANA COLLEGE Calif. 573 755 1328 31 KIRKWOOD COMMUNITY COLLEGE Iowa 564 749 1313 31 CUNY-KINGSBOROUGH COMMUNITY N.Y. 431 882 1313 33 PENSACOLA JUNIOR COLLEGE Fla. 472 836 1308 34 SANTA MONICA COLLEGE Calif. 474 806 1280 35 COMMUNITY COLLEGE OF ALLEGHENY CO. Pa. 419 859 1278 36 RIVERSIDE COMMUNITY COLLEGE Calif. 420 850 1270 37 PIERCE COLLEGE AT FORT STEILACOOM' Wis. 574 694 1268 38 PASADENA CITY COLLEGE Calif. 787 480 1267 39 MIL W AUKEE AREA TECHNICAL COLLEGE Wis. 495 767 1262 40 DA YTONA BEACH COMMUNITY COLLEGE Fla. 395 860 1255 41 THE INTERNATIONAL ACADEMY OF DESIGN Pa. 863 389 i252 42 SOUTHEAST COMMUNITY COLLEGE Ne b. 806 444 1250 43 MADISON AREA TECHNICAL COLLEGE Wis. 461 777 1238 44 COMMUNITY COLLEGE OF BA TIMORE CO M d. 476 749 1225 45 COLUMBUS STATE COMMUNITY COLLEGE Ohio. 460 747 1207 46 PIMA COMMUNITY COLLEGE Ariz. 413 779 1192 A 7 COMMUNITY COLLEGE OF RHODE ISLAND R.I. 368 817 1185 48 BROOKDALE COMMUNITY COLLEGE NJ. 429 743 1172 49 ORANGE COAST COLLEGE Calif. 441 706 1147 50 AMERICAN RIVER COLLEGE Calif.. 406 735 1141 51 KEISER COLLEGE' Fla. 471 666 1137 52 DE ANZA COLLEGE Calif. 422 709 1131 53 PORTLAND COMMUNITY COLLEGE Ore. 452 663 1115 54 MOUNT SAN ANTONIO COLLEGE Calif. 430 684 1114 55 FULL SAIL REAL WORLD EDUCATION Fla. 1003 103 1106 56 PALOMAR COLLEGE Calif 466 637 1103 57 BELLEVUE COMMUNITY COLLEGE Wash. 466 637 1103 58 SAN JOAOUIN DELTA COLLEGE Calif 379 716 1095 59 SOUTHWESTERN ILLINOIS COLLEG Ill. 418 676 1094
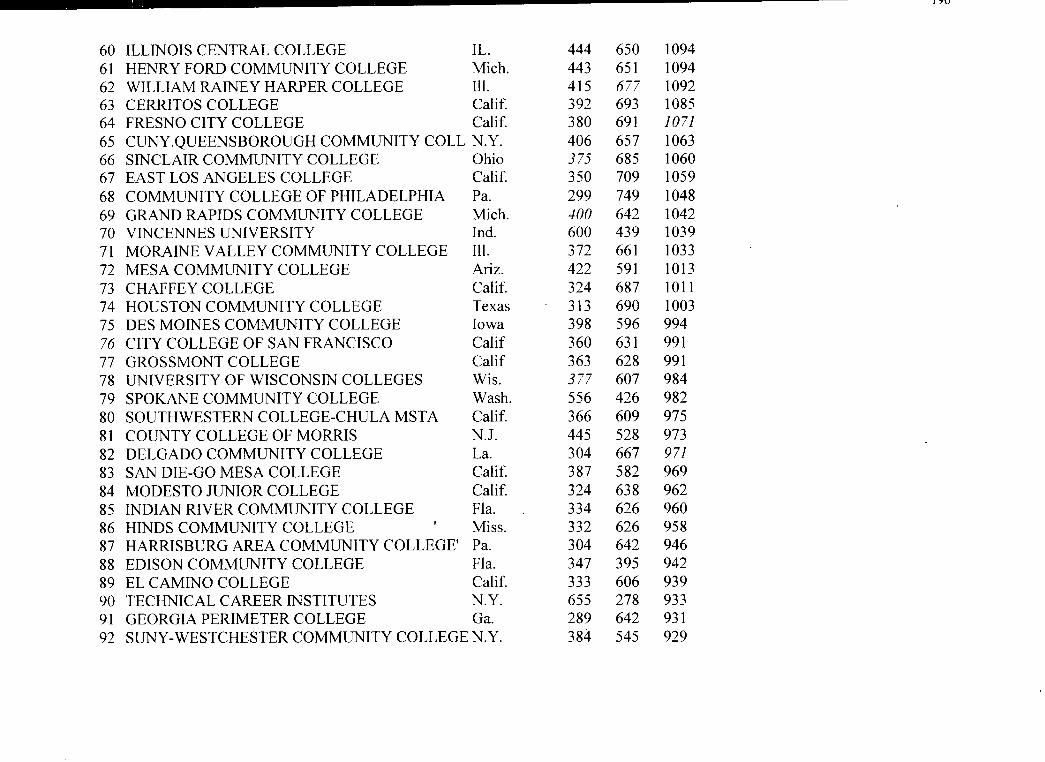
I~U
60 ILLINOIS CENTRAL COLLEGE IL. 444 650 1094 61 HENRY FORD COMMUNITY COLLEGE Mich. 443 651 1094 62 WILLIAM RAINEY HARPER COLLEGE Ill. 415 677 1092 63 CERRITOS COLLEGE Calif 392 693 1085 64 FRESNO CITY COLLEGE Calif. 380 691 1071 65 CUNY.QUEENSBOROUGH COMMUNITY COLL N.Y. 406 657 1063 66 SINCLAIR COMMUNITY COLLEGE Ohio 375 685 1060 67 EAST LOS ANGELES COLLEGE Calif 350 709 1059 68 COMMUNITY COLLEGE OF PHILADELPHIA Pa. 299 749 1048 69 GRAND RAPIDS COMMUNITY COLLEGE Mic h. 400 642 1042 70 VINCENNES UNIVERSITY In d. 600 439 1039 71 MORAINE VALLEY COMMUNITY COLLEGE Ill. 372 661 1033 72 MESA COMMUNITY COLLEGE Ariz. 422 591 1013 73 CHAFFEY COLLEGE Calif. 324 687 1011 74 HOUSTON COMMUNITY COLLEGE Texas 313 690 1003 75 DES MOINES COMMUNITY COLLEGE Iowa 398 596 994 76 CITY COLLEGE OF SAN FRANCISCO Calif 360 631 991 77 GROSSMONT COLLEGE Calif 363 628 991 78 UNIVERSITY OF WISCONSIN COLLEGES Wis. 377 607 984 79 SPOKANE COMMUNITY COLLEGE Wash. 556 426 982 80 SOUTHWESTERN COLLEGE-CHULA MSTA Calif. 366 609 975 81 COUNTY COLLEGE OF MORRIS N.J. 445 528 973 82 DELGADO COMMUNITY COLLEGE La. 304 667 971 83 SAN DIE-GO MESA COLLEGE Calif. 387 582 969 84 MODESTO JUNIOR COLLEGE Calif. 324 638 962 85 INDIAN RIVER COMMUNITY COLLEGE Fla. 334 626 960 86 HINDS COMMUNITY COLLEGE I Miss. 332 626 958 87 HARRISBURG AREA COMMUNITY COLLEGE' Pa. 304 642 946 88 EDISON COMMUNITY COLLEGE Fla. 347 395 942 89 EL CAMINO COLLEGE Calif. 333 606 939 90 TECHNICAL CAREER INSTITUTES N.Y. 655 278 933 91 GEORGIA PERIMETER COLLEGE Ga. 289 642 931 92 SUNY-WESTCHESTER COMMUNITY COLLEGE N.Y. 384 545 929

I"::/
92 SHORELINE COMMUNITY COLLEGE Wash. 384 545 929 94 OKALOOSA-W AL TON COMMUNITY COLLEGE Fla. 413 515 928 95 SACRAMENTO CITY COLLEGE Calif. 316 609 924 95 MISSISSIPPI GULF COAST COMMUNITY COLL Miss 309 615 924 97 ANNE ARUNDEL COMMUNITY COLLEGE M d. 330 584 914 98 OWENS COMMUNITY COLLEGE-TOLEDO Calif. 333 565 898 99 CLARK COLLEGE Wash. 335 557 892 100 FULLERTON COLLEGE Calif. 358 528 886
SOURCE: COMMUNITY COLLEGE WEEK ANALYSIS OF U.S. DEPARTMENT OF EDUCATION DATA
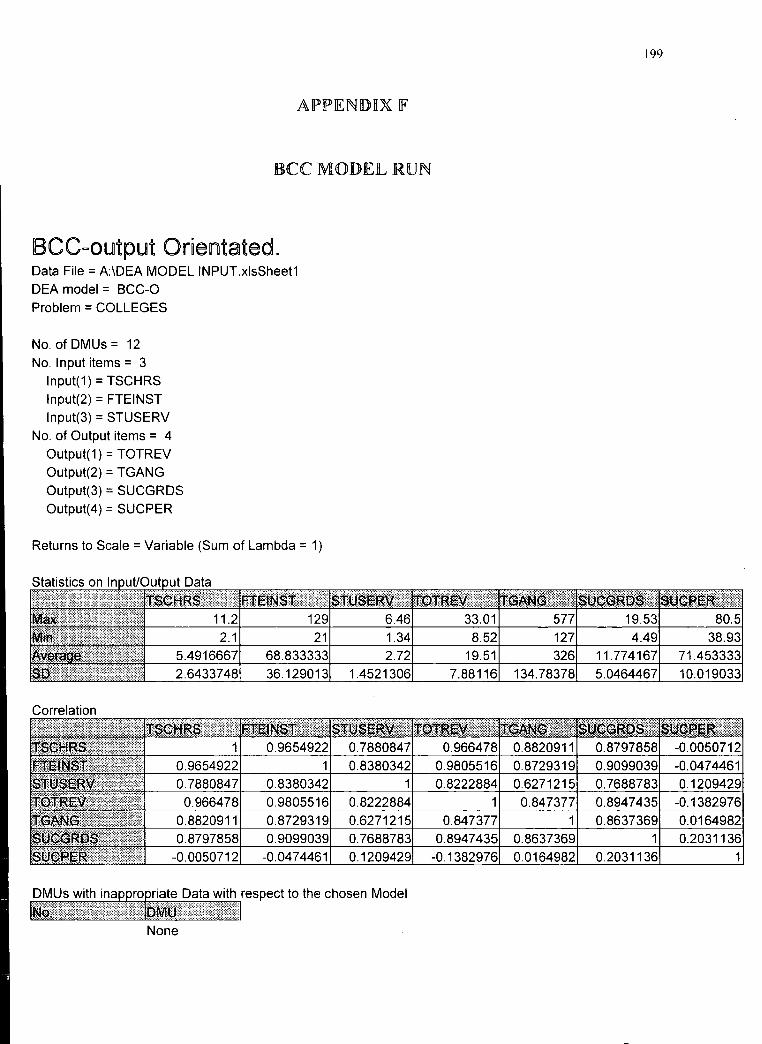
APPJENJJJILX JF
.IBCC MODElL RUN
BCC~output Orientated. Data File= A:\DEA MODEL INPUT.xlsSheet1 DEA model = BCC-0 Problem = COLLEGES
No. of DMUs = 12 No. Input items = 3
lnput(1) = TSCHRS lnput(2) = FTEINST lnput(3) = STUSERV
No. of Output items = 4 Output(1) = TOTREV Output(2) = TGANG Output(3) = SUCGRDS Output(4) = SUCPER
Returns to Scale = Variable (Sum of Lambda = 1)
None
199
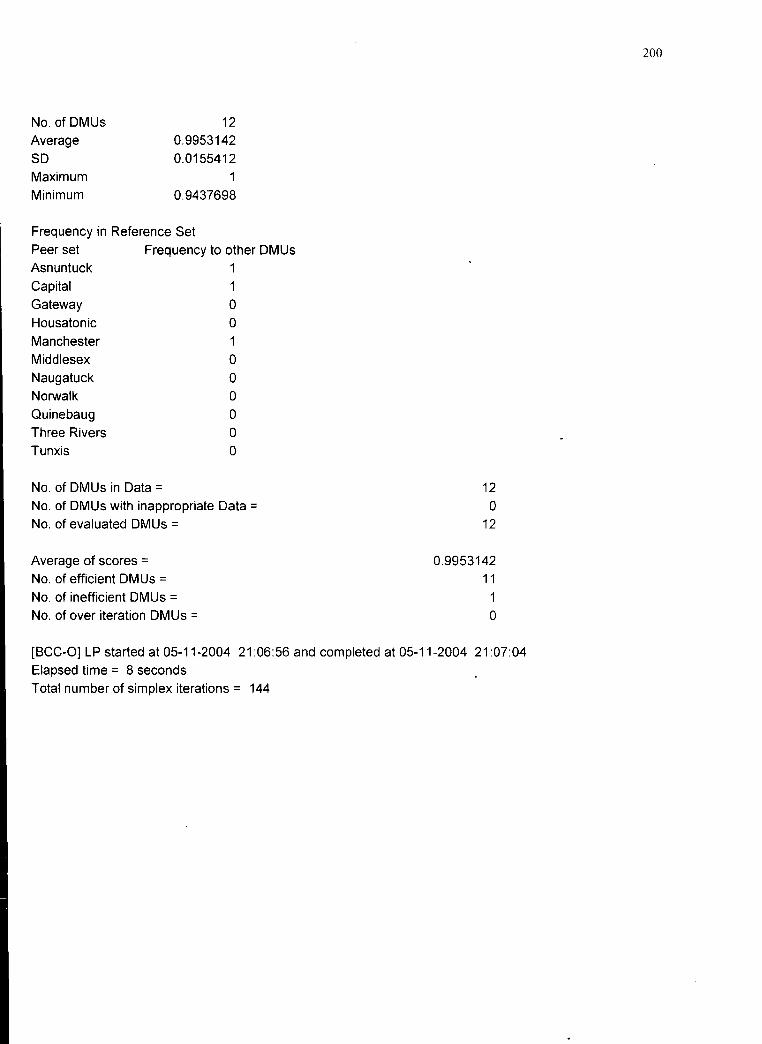
No. of DMUs Average
so Maximum Minimum
12 0.9953142 0.0155412
1 0.9437698
Frequency in Reference Set
Peer set Frequency to other DMUs Asnuntuck 1
Capital 1 Gateway 0 Housatonic
Manchester Middlesex Naugatuck Norwalk Quinebaug
Three Rivers Tunxis
No. of DMUs in Data =
0 1 0 0 0 0 0
0
No. of DMUs with inappropriate Data = No. of evaluated DMUs =
Average of scores= No. of efficient DMUs = No. of inefficient DMUs = No. of over iteration DMUs =
12
0 12
0.9953142 11
1 0
[BCC-0] LP started at 05-11-2004 21:06:56 and completed at 05-11-2004 21:07:04 Elapsed time = 8 seconds
Total number of simplex iterations= 144
200
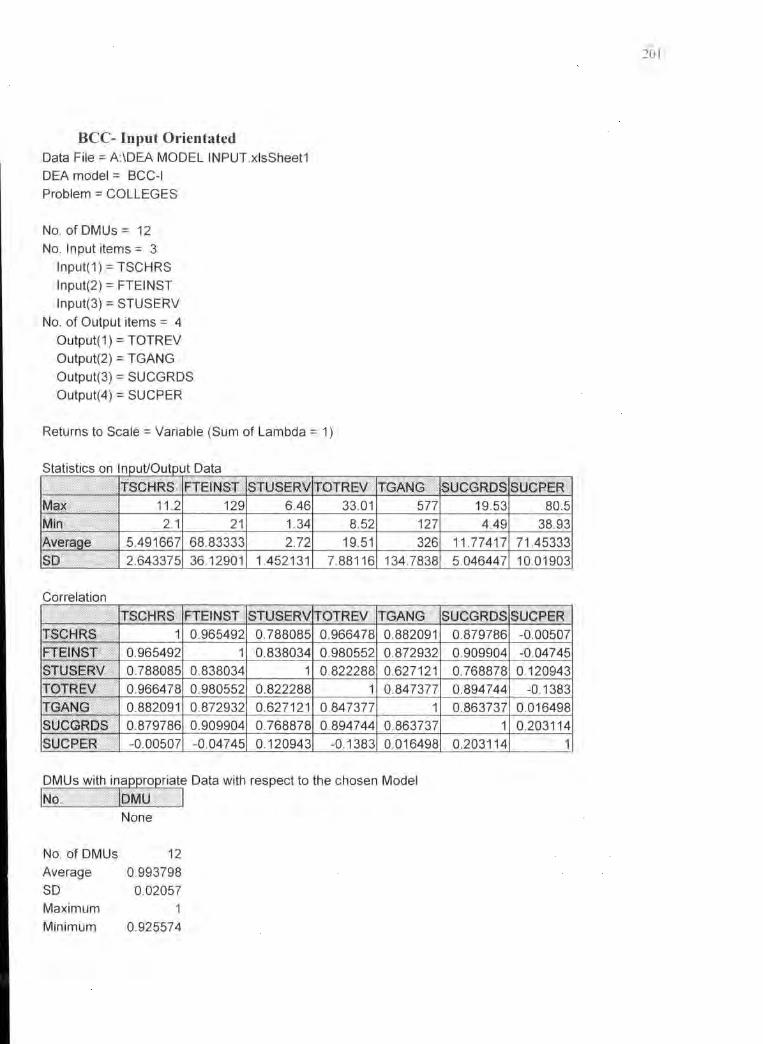
BCC- Input Orientated Data File = A:\DEA MODEL INPUT.xlsSheet1 DEA model = BCC-1 Problem = COLLEGES
No. of DMUs = 12 No. Input items= 3
lnput(1) = TSCHRS lnput(2) = FTEINST lnput(3) = STUSERV
No. of Output items = 4 Output(1) = TOTREV Output(2) = TGANG Output(3) = SUCGRDS Output(4) = SUCPER
Returns to Scale= Variable (Sum of Lambda= 1)
~~~~~t::.:~~wi1~~~~~~~~~~1:,::~1 Data with respect to the chosen Model CNQi . :i!!:.;;:w;.: il'& liln.l.\!x,g; 1:1 t1
None
No. of DMUs 12 Average 0.993798 so 0.02057 Maximum Minimum 0.925574
201
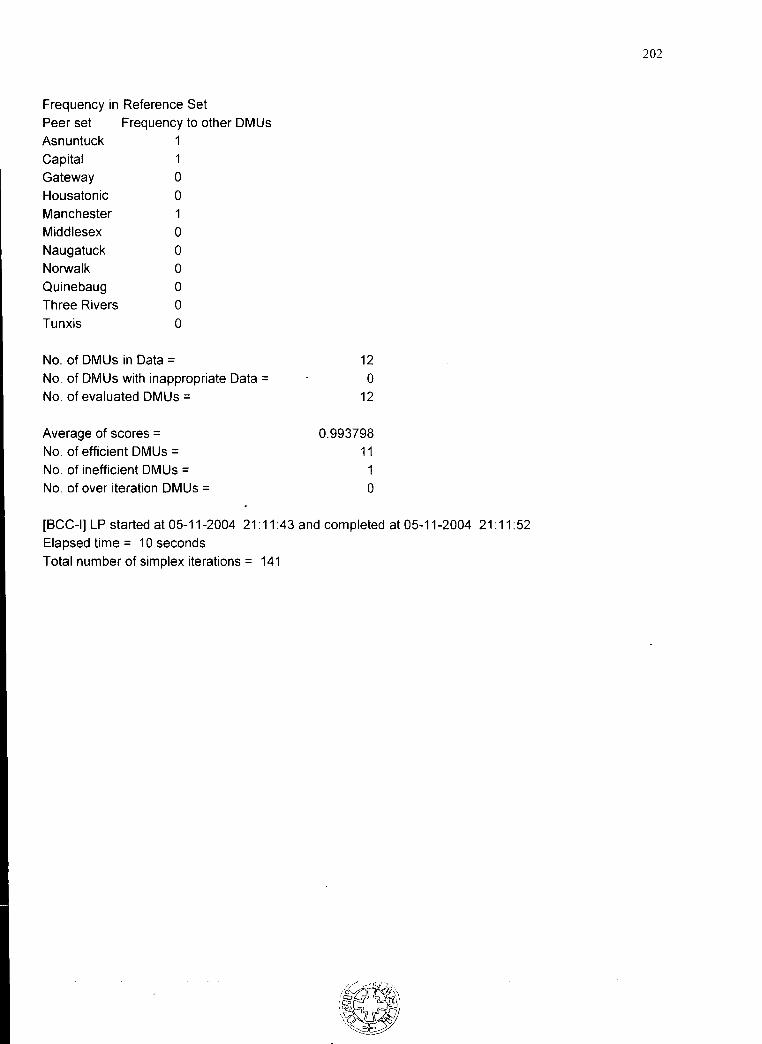
Frequency in Reference Set
Peer set Frequency to other DMUs
Asnuntuck 1 Capital 1 Gateway 0
Housatonic 0
Manchester 1 Middlesex 0
Naugatuck 0
Norwalk 0
Quinebaug 0
Three Rivers 0
Tunxis 0
No. of DMUs in Data= 12 No. of DMUs with inappropriate Data =
No. of evaluated DMUs =
Average of scores =
No. of efficient DMUs =
No. of inefficient DMUs =
No. of over iteration DMUs =
0
12
0.993798
11
0
[BCC-1] LP started at 05-11-2004 21: 11 :43 and completed at 05-11-2004 21: 11:52
Elapsed time = 1 0 seconds
Total number of simplex iterations = 141
202