Page 1
8/3/2019 3142-Msdarmawan-ce-Probabilistic Assesment of Pitting Corrosion Effect on Flexural Strength of Partial Pre Stresse…
http://slidepdf.com/reader/full/3142-msdarmawan-ce-probabilistic-assesment-of-pitting-corrosion-effect-on-flexural 1/8
Feb. 2010, Volume 4, No.2 (Serial No. 27)
Journal of Civil Engineering and Architecture, ISSN 1934-7359, USA
Probabilistic Assessment of Pitting Corrosion Effect on
Flexural Strength of Partial Prestressed Concrete
Structures in a Chloride Environment
Muhammad Sigit Darmawan
Department of Civil Engineering, Institut Teknologi Sepuluh Nopember (ITS), Surabaya 60111, Indonesia
Abstract: Like reinforced concrete (RC) structure, Prestressed concrete (PC) structures cannot escape from corrosion related problems,
especially when they are subjected to very aggressive environment, such as chloride environment. The corrosion of PC and RC
structures can take place if the concrete quality is not adequate, the concrete cover is less than that specified in the design, poor detailing
during design and construction. For RC structures, corrosion in the reinforcing steel generally leads to serviceability problems (staining,
cracking and spalling of concrete). By contrast, for PC structures, corrosion of prestressing strands may initiate structural collapse due
to higher stress levels in the steel and smaller diameter of the prestressing steel. Research on corrosion effect on concrete structure has
mainly considered the effect of corrosion have on reinforced and full prestressed concrete structure. In this study, a structural
framework will be developed to predict the flexural strength of partial prestressed concrete structures in a chloride environment. The
corrosion model previously developed for reinforced and prestressed concrete structures will be combined to predict the effect of
corrosion has on partial prestressed concrete structures. Note that in partial prestressed concrete structures, both non prestressing steel
(passive) and prestressing (active) reinforcement are utilized to carry the load. The framework developed will be combined with
probability analysis to take into account the variability of parameters influencing the corrosion process. This approach allows more
accurate prediction of service life of partial prestressed concrete structures in a chloride environment.
Key words: Corrosion, partial prestressed concrete structure, chloride, probability.
1. Introduction
Corrosion of reinforcing and prestressing steel due to
chloride contamination can result in considerable
reduction in service life of concrete structures. In
general, corrosion is of most concern because of the
associated reduction in steel cross-sectional area,
cracking, spalling and loss of bond, which over time will
lead to reductions of strength and serviceability of structures. For prestressed concrete (PC) structures, the
corrosion of prestressing strands may initiate structural
collapse due to higher stress levels in the steel and
smaller diameter of prestressing steel. A post-mortem
analysis of the collapsed bridge showed that the 40 year
Muhammad Sigit Darmawan, PhD, research field: stochasticmodeling of deteriorating of concrete in aggressive
environments. E-mail: [email protected] .
old post-tensioned bridge failed as a result of pitting
corrosion near the box girder joint [1].
Chloride contamination is considered to be the major
causes of corrosion of reinforced concrete (RC) and PC
structures. This is caused by either from the application
of deicing salts in cold regions or exposure to sea-spray
in chloride environments. The deterioration of
reinforced concrete structures due to chloride attack
comprises of two stages. The first stage involves themovement of chlorides through concrete cover until
they reach the threshold chloride concentration at the
steel to initiate active corrosion (Fig. 1). The second
stage is called corrosion propagation, where
reinforcing steel corrodes causing loss of steel area
(metal loss) and therefore reduces structural capacity.
Different methods have been made to model
chloride penetration in concrete (i.e., corrosion
initiation). The different methods proposed clearly
Page 2
8/3/2019 3142-Msdarmawan-ce-Probabilistic Assesment of Pitting Corrosion Effect on Flexural Strength of Partial Pre Stresse…
http://slidepdf.com/reader/full/3142-msdarmawan-ce-probabilistic-assesment-of-pitting-corrosion-effect-on-flexural 2/8
Probabilistic Assessment of Pitting Corrosion Effect on Flexural Strength of Partial PrestressedConcrete Structures in a Chloride Environment
26
underline that the actual chloride penetration process
is very complicated, and may involve a combination
of processes contributing towards the overall ingress
of chlorides [2]. Of all the available models, it is
generally accepted that the model based on diffusion
theory represents the chloride ingress in concrete.
Hence, in this paper only corrosion propagation will
be discussed.
Corrosion propagation is mainly modeled by
assuming a relatively uniform loss of material thickness
[3], see Fig. 2. However, this approach is not accurate
for concrete structures subjected to chloride attack,
which usually experiences pitting corrosion, see Fig. 3
[4]. Pitting corrosion model for PC structures subjectedto chloride attack can be found in the literature [5]. This
model was developed from accelerated corrosion test
using four slabs, each of dimensions 1500 mm × 1000
mm × 250 mm with wires/strands. Using a similar
approach, pitting corrosion model for RC structures
subjected to chloride attack was developed [6]. From
these tests, it was found that the distribution of
Fig. 1 Deterioration model.
Fig. 2 General corrosion.
Fig. 3 Pit-configuration [4].
Fig. 4 Inverse CDF (CDF-1) plots for maximum pit-depths
in prestressing wires[5].
Fig. 5 Inverse CDF (CDF-1) plots for maximum pit-depths
in a reinforcing bar [6].
maximum pit-depths for prestressing wires and
reinforcing bar is best represented by the Gumbel
(EV-Type I), see Figs. 4 and 5.
2. Corrosion Model for Partial PC Structures
Research on corrosion effect on concrete structure
has so far considered only the effect of corrosion haveon reinforced and full prestressed concrete structure. In
this study, a structural framework will be developed to
predict the flexural strength of partial prestressed
concrete structures in a chloride environment. Note that
in partial prestressed concrete structures, both non
prestressing steel (passive) and prestressing (active)
reinforcement are utilized to carry the load. The
corrosion model previously developed for reinforced
Page 3
8/3/2019 3142-Msdarmawan-ce-Probabilistic Assesment of Pitting Corrosion Effect on Flexural Strength of Partial Pre Stresse…
http://slidepdf.com/reader/full/3142-msdarmawan-ce-probabilistic-assesment-of-pitting-corrosion-effect-on-flexural 3/8
Probabilistic Assessment of Pitting Corrosion Effect on Flexural Strength of Partial PrestressedConcrete Structures in a Chloride Environment
27
and prestressed concrete structures will be combined to
determine the effect of corrosion has on partial
prestressed concrete structures. The framework
developed will be combined with probability analysis
to take into account the variability of parameters
influencing the corrosion process. This approach
allows more accurate prediction of service life of
partial prestressed concrete structures in a chloride
environment.
The following assumptions are made in developing a
more general probabilistic model for pitting corrosion:
(1) homogeneous environment along the wire/rebar
under consideration (corrosion rate assumed constant
along wire/rebar);(2) after an initial period of corrosion, the number of
pits formed is assumed constant, length of pit is held
constant and pit depth continues to increase; and
(3) at any cross-section of the wire/rebar only one pit
can form.
The predicted Gumbel distribution of maximum pit
depth (a in mm) at any time T (years), corrosion rate
icorr (1) in μA/cm2
at start of corrosion propagation and
wire/rebar length L (mm) is thus:
i
e
a
54.0corr aTT ee)L,i,T(f
54.0
a
54.0
>λα
=⎟⎟⎟
⎠
⎞
⎜⎜⎜
⎝
⎛ μ−
λα
−⎟⎟ ⎠
⎞⎜⎜⎝
⎛ μ−
λα−
(1)
where
( )[ ]
[ ]⎥⎥⎦
⎤
⎢⎢⎣
⎡⎟⎟ ⎠
⎞⎜⎜⎝
⎛
⎭⎬⎫
⎩⎨⎧
−+θκ
+−−
⎥⎥⎦
⎤
⎢⎢⎣
⎡⎟⎟ ⎠
⎞⎜⎜⎝
⎛
⎭⎬⎫
⎩⎨⎧
−−+θκ
+−−
=λ+θ
+θ
2
1
ocorr o
2
o
2
1
icorr o
2
o
1T1
1(1)0.0232iDD
1TT1
1(1)0.0232iDD
(2)
To= exp
1
θ+1( )ln
θ +1( ) icorr −expTo−exp( )+ κ −θ−1( ) icorr (1)( )κicorr (1)
⎛
⎝ ⎜⎜
⎞
⎠⎟⎟
⎡
⎣⎢⎢
⎤
⎦⎥⎥ (3)
μ =μo−exp +1
αo−expln
L
Lo−exp
⎝ ⎜⎜ ⎠⎟⎟ α = αo−exp
(4)
year 1TT )TT()1(i)TT(i iicorr icorr ≥−−κ×=− θ(5)
obtained from statistical analysis of maximum pit
depths recorded from the accelerated corrosion tests
(see Tables 1 and 2), Do is the initial diameter of the
wire/rebar (mm), and κ and θ are corrosion rate
empirical factors. If corrosion rate reduces with time
then κ = 0.85 and θ = -0.29 [3]. Otherwise, if
corrosion rate is constant with time (time-invariant)
Table 1 Statistical parameters for the maximum pit-depths
of prestressing strand.
a (mm)To-exp
(years)
icorr-exp
(µA/cm2)
Length
Lo(mm)µo-exp αo-exp
mean COV
0.03836 186 650 0.84 8.10 0.91 0.17
μο-exp,αο-exp are Gumbel parameters
Table 2 Statistical parameters for the maximum pit-depths
of reinforcing bar.
a (mm)To-exp
(years)icorr-exp
(µA/cm2)LengthLo(mm)
µo-exp αo-exp
mean COV
0.076712 150 325 1.68 2.99 1.87 0.23
then κ = 1 and θ = 0. The geometric model is then
used to predict the loss of cross-sectional area for a pit
size of depth a, see Fig. 3 [4].
3. Statistical Parameters of Maximum
Pit-depths Distribution
The maximum pit-depth of corroded prestressing or
reinforcing steel is an important parameter as it is the
likely place of critical (minimum) section of the steel.
Therefore, it is also the likely place where failure of the
steel occurs. Statistical parameter of maximum pit-depth distribution used in this study is given in
Tables 1 and 2 for prestressing strands [5] and
reinforcing bars [6], respectively. These statistical
parameters were obtained from accelerated corrosion
tests using concrete slabs, each of dimensions 1500
mm × 1000 mm × 250 mm with strands/rebar. The
accelerated corrosion process was introduced to the
rebar using an electric current which was induced from
a power supply through a current regulator. At the
completion of each corrosion test the specimen was
broken up and the steel then cleaned, dried and
weighed using the method as specified by Standard
Practice for Preparing, Cleaning, and Evaluating
Corrosion Test Specimens [7]. The pit-depth in the
corroded steel was then measured using a micrometer
gauge.
The pitting corrosion statistical parameters µo-exp
and αo-exp are indicative only and increased confidence
Page 4
8/3/2019 3142-Msdarmawan-ce-Probabilistic Assesment of Pitting Corrosion Effect on Flexural Strength of Partial Pre Stresse…
http://slidepdf.com/reader/full/3142-msdarmawan-ce-probabilistic-assesment-of-pitting-corrosion-effect-on-flexural 4/8
Page 5
8/3/2019 3142-Msdarmawan-ce-Probabilistic Assesment of Pitting Corrosion Effect on Flexural Strength of Partial Pre Stresse…
http://slidepdf.com/reader/full/3142-msdarmawan-ce-probabilistic-assesment-of-pitting-corrosion-effect-on-flexural 5/8
Probabilistic Assessment of Pitting Corrosion Effect on Flexural Strength of Partial PrestressedConcrete Structures in a Chloride Environment
29
reinforcing steel area at time T, and f p and f s are the
stress in the prestressing steel and reinforcing steel,
respectively. As the time since corrosion (T) increases,
the corrosion will decrease the steel area and therefore
reduce the flexural strength of partial prestressed
concrete beam.
6. Illustrative Example
For illustrative purpose, the corrosion model
developed will be used to determine the effect of
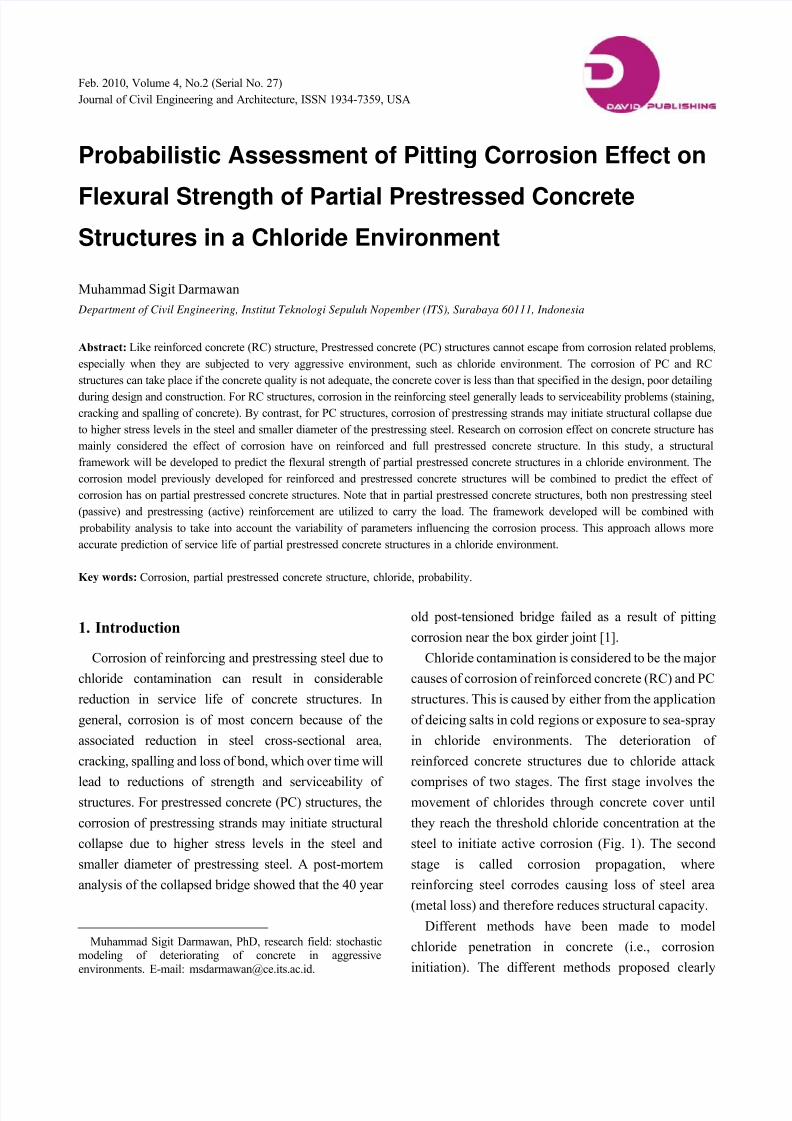
corrosion has on partial PC beam shown in Fig. 7[15].
The prestressing steels (Ap) comprise two cables, each
consisting of 18 supergrade 7-wire strands of 12.5 mm
diameter, whereas passive reinforcement (As)
comprise of 10 reinforcing bar of 32 mm diameter. The
beam is exposed in a near-coastal area. Four different
scenarios of corrosion are considered
(1) No corrosion,
(2) Only reinforcing bars corrode,
(3) Only prestressing steels corrode,
(4) Both reinforcing bar and prestressing steel
corrode.
The corrosion rate used in the analysis is 1 μA/cm
2
(0.012 mm/year), which can be classified as low to
moderate corrosion rate [17].
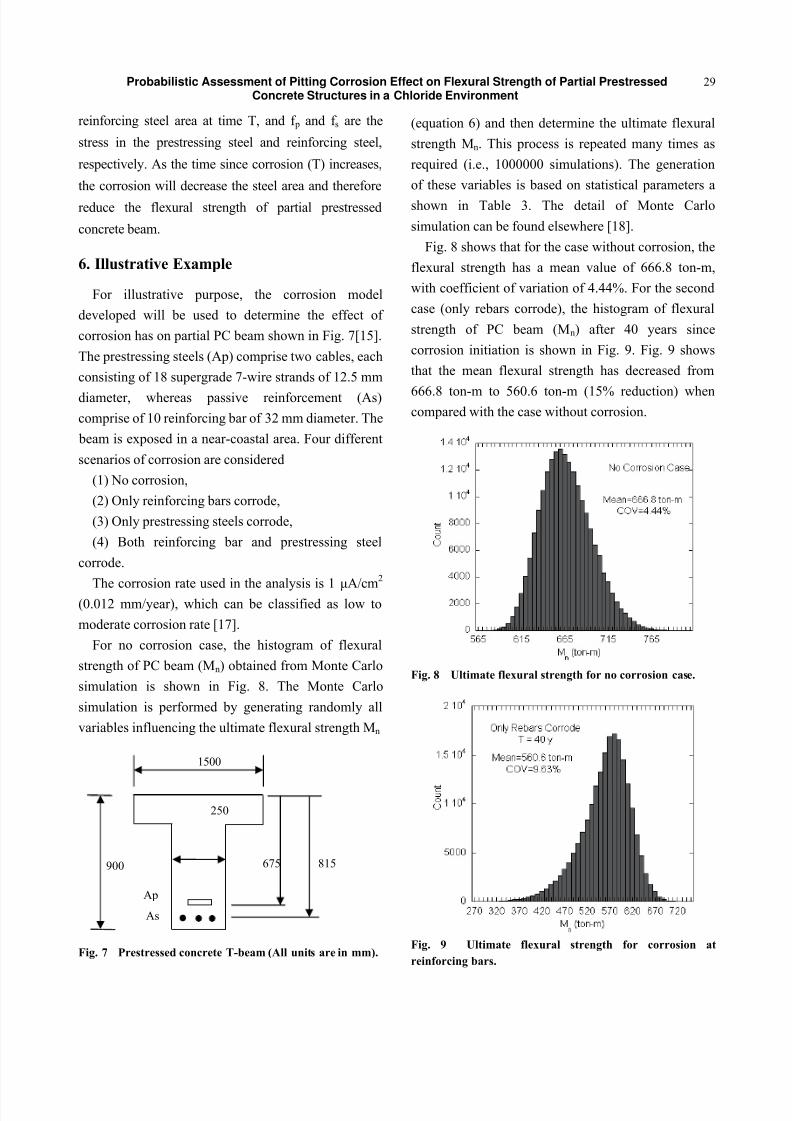
For no corrosion case, the histogram of flexural
strength of PC beam (Mn) obtained from Monte Carlo
simulation is shown in Fig. 8. The Monte Carlo
simulation is performed by generating randomly all
variables influencing the ultimate flexural strength Mn
Fig. 7 Prestressed concrete T-beam (All units are in mm).
(equation 6) and then determine the ultimate flexural
strength Mn. This process is repeated many times as
required (i.e., 1000000 simulations). The generation
of these variables is based on statistical parameters a
shown in Table 3. The detail of Monte Carlo
simulation can be found elsewhere [18].
Fig. 8 shows that for the case without corrosion, the
flexural strength has a mean value of 666.8 ton-m,
with coefficient of variation of 4.44%. For the second
case (only rebars corrode), the histogram of flexural
strength of PC beam (Mn) after 40 years since
corrosion initiation is shown in Fig. 9. Fig. 9 shows
that the mean flexural strength has decreased from
666.8 ton-m to 560.6 ton-m (15% reduction) whencompared with the case without corrosion.
Fig. 8 Ultimate flexural strength for no corrosion case.
Fig. 9 Ultimate flexural strength for corrosion at
reinforcing bars.
1500
815675900
250
Ap
As
Page 6
8/3/2019 3142-Msdarmawan-ce-Probabilistic Assesment of Pitting Corrosion Effect on Flexural Strength of Partial Pre Stresse…
http://slidepdf.com/reader/full/3142-msdarmawan-ce-probabilistic-assesment-of-pitting-corrosion-effect-on-flexural 6/8
Probabilistic Assessment of Pitting Corrosion Effect on Flexural Strength of Partial PrestressedConcrete Structures in a Chloride Environment
30
Fig. 10 Ultimate flexural strength for corrosion at
prestressing steel.
Fig. 11 Ultimate flexural strength for corrosion at
reinforcing and prestressing steel.
Fig. 12 Distribution of ultimate flexural strength with time.
For the third case (only prestressing steel corrode),
the histogram of flexural strength of PC beam (Mn)
after 40 years since corrosion initiation is shown in
Fig. 10. Fig. 10 shows the mean flexural strength has
decreased from 666.8 ton-m to 494.5 ton-m (26%
reduction) when compared with the case without
corrosion.
For the last case (both passive and active
reinforcement corrode), the histogram of flexural
strength of PC beam (Mn) after 40 years since
corrosion initiation is shown in Fig. 11. Fig. 11 shows
the mean flexural strength has decreased from 666.8
ton-m to 486.5 ton-m (28% reduction) when
compared with the case without corrosion.Fig. 12 demonstrates the effect of corrosion has on
flexural strength of PC beam, by assuming that both
prestressing steel and reinforcing bar is corroding.
This figure shows that with time the flexural strength
of the beam decreases considerably. For example after
40 years since corrosion initiation, the probability of
flexural strength less than 500 ton-m is around 50%.
For the case without corrosion, the probability of
flexural strength less than 500 ton-m is zero. This
figure clearly indicates that corrosion has significant
effect on flexural strength of PC beam.
For corroded high strength steel, such as
prestressing steel, there is high possibility to have
different mode of failure than yielding. It is known
Fig. 13 Effect of different mode of failure of corroded
prestressing steel on ultimate flexural strength.
Page 7
8/3/2019 3142-Msdarmawan-ce-Probabilistic Assesment of Pitting Corrosion Effect on Flexural Strength of Partial Pre Stresse…
http://slidepdf.com/reader/full/3142-msdarmawan-ce-probabilistic-assesment-of-pitting-corrosion-effect-on-flexural 7/8
Page 8
8/3/2019 3142-Msdarmawan-ce-Probabilistic Assesment of Pitting Corrosion Effect on Flexural Strength of Partial Pre Stresse…
http://slidepdf.com/reader/full/3142-msdarmawan-ce-probabilistic-assesment-of-pitting-corrosion-effect-on-flexural 8/8
Probabilistic Assessment of Pitting Corrosion Effect on Flexural Strength of Partial PrestressedConcrete Structures in a Chloride Environment
32
(2) Sensitivity analysis found that pitting model
parameters for prestressing steel, corrosion rate, yield
strength of prestressing steel, model error for flexure,
and cover thickness as the most important parameters
influencing the flexural strength of partial prestressed
concrete beam.
References
[1] E. Proverbio and G. Ricciardi, Failure of a 40 year old
post-tensioned bridge near seaside, Proc. Int. Conf.
Eurocorr, London, 10-14 September, 2000.
[2] V. G. Papadakis, A. P. Roumeliotis, M. N. Fardis and C.
G. Vagenas, Mathematical modeling of chloride effect on
concrete durability and protection measures, in: R. K. Dhir
and M. R. Jones (Eds.), Concrete Repair, Rehabilitation
and Protection, E & FN Spon, London, 1996, pp. 165-174.
[3] K. A. T. Vu and M. G. Stewart, Structural reliability of
concrete bridges including improved chloride-induced
corrosion models, Structural Safety 22 (2000) 313-333.
[4] D. V. Val and R. E. Melchers, Reliability of deteriorating
reinforced concrete slab bridges, Journal of Structural
Engineering 123 (1997) 1638-1644.
[5] M. S. Darmawan and M. G. Stewart, Effect of spatially
variable pitting corrosion on structural reliability of
prestressed concrete bridge girders, Australian Journal of
Structural Engineering 6 (2006) 147-158.
[6] M. S. Darmawan, Pitting corrosion model for reinforced
concrete structures in a chloride environment, The Future
Development in Civil Engineering Based on Research and
Practical Experience (International Conference),
University Pelita Harapan and University Stuttgart
Germany, Lippo Karawaci, Jakarta, Indonesia, CD-ROM,
26-27 September, 2007.
[7] ASTM G1-03, Standard practice for preparing, cleaning,
and evaluating corrosion test specimens, American
Standard Testing Materials (ASTM), West Conshohocken,
Pennsylvania, USA, 1999.
[8] M. S. Darmawan and M. G. Stewart, Spatial
time-dependent reliability analysis of corroding
pretensioned prestressed concrete bridge girders,
Structural Safety 29 (2007) 16-31.
[9] M. G. Stewart, Workmanship and its influence on
probabilistic models of concrete compressive strength,
ACI Materials Journal 92 (1995) 361-372.
[10] S. A. Mirza, D. K. Kikuchi and J. G. MacGregor, Flexural
strength reduction factor for bonded prestressed concrete
beams, ACI Journal 77 (1980) 237-246.
[11] S. A. Mirza and J. G. MacGregor, Variability of
mechanical properties of reinforcing bars, Journal of the
Structural Division 105 (1979 a) 921-937.
[12] S. A. Mirza and J. G. MacGregor, Variations in
dimensions of reinforced concrete members, Journal of the
Structural Division 105 (1979b) 751-766.
[13] B. Ellingwood, T. V. Galambos, J. G. MacGregor and C.
A. Cornell, Development of a Probability Based Load
Criterion for American National Standard A58, National
Bureau of Standards Special Publication 577, US
Government Printing Office, Washington DC, 1980.
[14] K. A. T. Vu and M. G. Stewart, Structural reliability of
concrete bridges including improved chloride-induced
corrosion models, Structural Safety 22 (2000) 313-333.
[15] R. F. Warner, B. V. Rangan, A. S. Hall and K. A. Faulkes,
Concrete Structures, Longman Press, Melbourne, 1998.
[16] AS 3600, Concrete Structures, Standards Association of
Australia, Homebush, New South Wales, Australia, 2001.
[17] BRITE/EURAM, The residual service life of reinforced
concrete structures, Final Technical Report, Report No.
BRUE-CT92-0591, 1995.
[18] A. S. Nowak and K. R. Collins, Reliability of Structures,
McGraw-Hill Higher Education, New York, 2000.
[19] D. A. Jones, Principles and Prevention of Corrosion,
Macmillan Publishing Co, New York, 1996.