24
3/15/12 SHRA Business Plan 2011/12 SHRA Strategic Plan 2013 - 2017
| Date post: | 01-Jan-2016 |
| Category: |
Documents |
| Upload: | denis-phelps |
| View: | 213 times |
| Download: | 0 times |

3/15/12 SHRA Business Plan 2011/12
SHRA Strategic Plan 2013 - 2017

3/15/12 SHRA Business Plan 2011/12
Snapshot of Delivery for 2011/12Strategic FrameworkVision, Mission, ValuesSituational AnalysisOrganisational Development StateFunctional StructureStrategic ObjectivesTargets (APP)Financials
Snapshot of Delivery for 2011/12Strategic FrameworkVision, Mission, ValuesSituational AnalysisOrganisational Development StateFunctional StructureStrategic ObjectivesTargets (APP)Financials
22 3/15/12

3/15/12 SHRA Business Plan 2011/12
Establishment and operationalisation of office;Approval of funding for 4 142 units (investment);Processing of 33 accreditation applications of which 14 were conditionally accredited and 4 fully accredited;Unqualified audit for 2010/11;Approval of institutional grants;Agreements signed with the NHFC and the Eastern Cape and KwaZulu Natal Provinces and NURCHA (drafts);Funding movement from two provinces (Eastern Cape and KZN);Two international visits with representative delegates and Agreements with Canada and Netherlands;6 Project launches (including 2 by the Minister of Human Settlements);Participation in Outcome 8 programme;Engaged with DHS and Treasury to improve funding streams for social housing; andEngaged local and international funders to establish a comprehensive funding regime for social housing in South Africa; andFinalising the Regulations for the Social Housing as per the SH Act.
Establishment and operationalisation of office;Approval of funding for 4 142 units (investment);Processing of 33 accreditation applications of which 14 were conditionally accredited and 4 fully accredited;Unqualified audit for 2010/11;Approval of institutional grants;Agreements signed with the NHFC and the Eastern Cape and KwaZulu Natal Provinces and NURCHA (drafts);Funding movement from two provinces (Eastern Cape and KZN);Two international visits with representative delegates and Agreements with Canada and Netherlands;6 Project launches (including 2 by the Minister of Human Settlements);Participation in Outcome 8 programme;Engaged with DHS and Treasury to improve funding streams for social housing; andEngaged local and international funders to establish a comprehensive funding regime for social housing in South Africa; andFinalising the Regulations for the Social Housing as per the SH Act.
33 3/15/12

3/15/12 SHRA Business Plan 2011/12
Strategic Framework
44 3/15/12
3/15/12 SHRA Business Plan 2011/12
Vision, Mission, Values
55 3/15/12
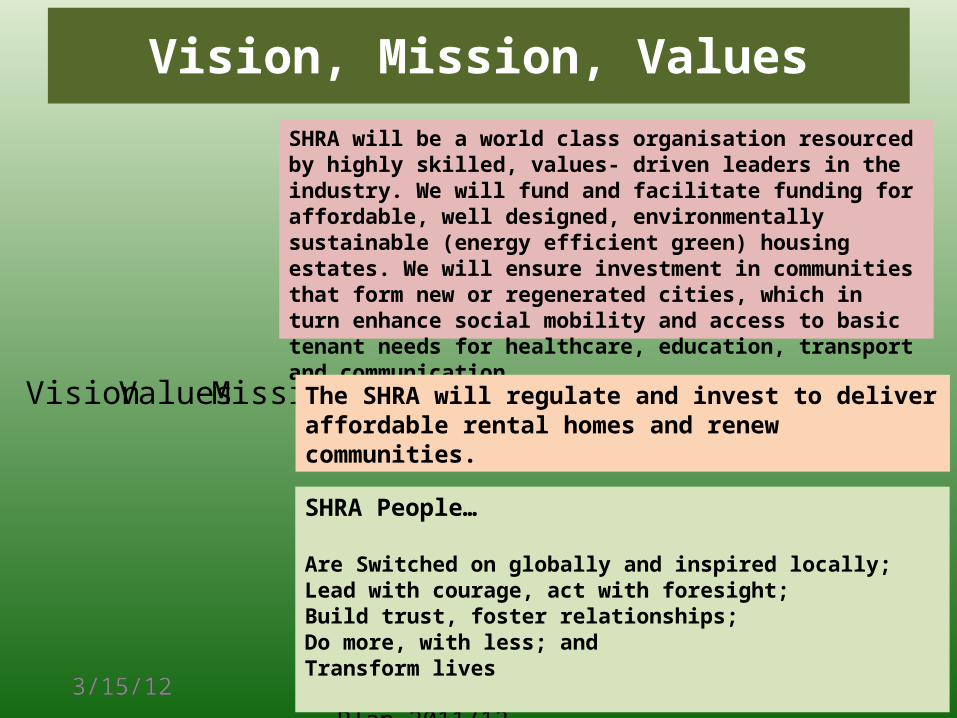
Vision MissionValues
SHRA will be a world class organisation resourced by highly skilled, values- driven leaders in the industry. We will fund and facilitate funding for affordable, well designed, environmentally sustainable (energy efficient green) housing estates. We will ensure investment in communities that form new or regenerated cities, which in turn enhance social mobility and access to basic tenant needs for healthcare, education, transport and communication.
The SHRA will regulate and invest to deliver affordable rental homes and renew communities.
SHRA People… Are Switched on globally and inspired locally;Lead with courage, act with foresight;Build trust, foster relationships;Do more, with less; and Transform lives

3/15/12 SHRA Business Plan 2011/12
Situational Analysis
66 3/15/12
Projected Annual Growth in the National Rental Market
Province 2001% Growth
2006% Growth
2011
Eastern Cape 162,924 2.86% 2.80%
Free State 111,920 3.87% 3.77%
Gauteng 654,486 7.21% 7.01%
KwaZulu Natal 344,020 5.73% 5.43%
Limpopo 53,161 5.49% 5.29%
Mpumalanga 100,642 5.23% 4.93%
Northern Cape 30,347 6.05% 5.81%
North West 128,517 3.17% 2.99%
Western Cape 232,406 4.17% 3.98%
Total 1,818,423 5.23% 5.14%

3/15/12 SHRA Business Plan 2011/12
340
182
494
663
304313
13%
19%
25%
33%
17%15%
0
200
400
600
800
<R850 [850-1500)
[R1500-R3500)
[R3500-R7500)
[R7500-R10000)
R10000+0%
10%
20%
30%
40%
Number who rent Percentage of rental market
Thou
sand
hou
seho
lds Percent of households
44% between R1500 & R7500
Situational Analysis
3/15/12 SHRA Business Plan 2011/12
Situational Analysis
88 3/15/12
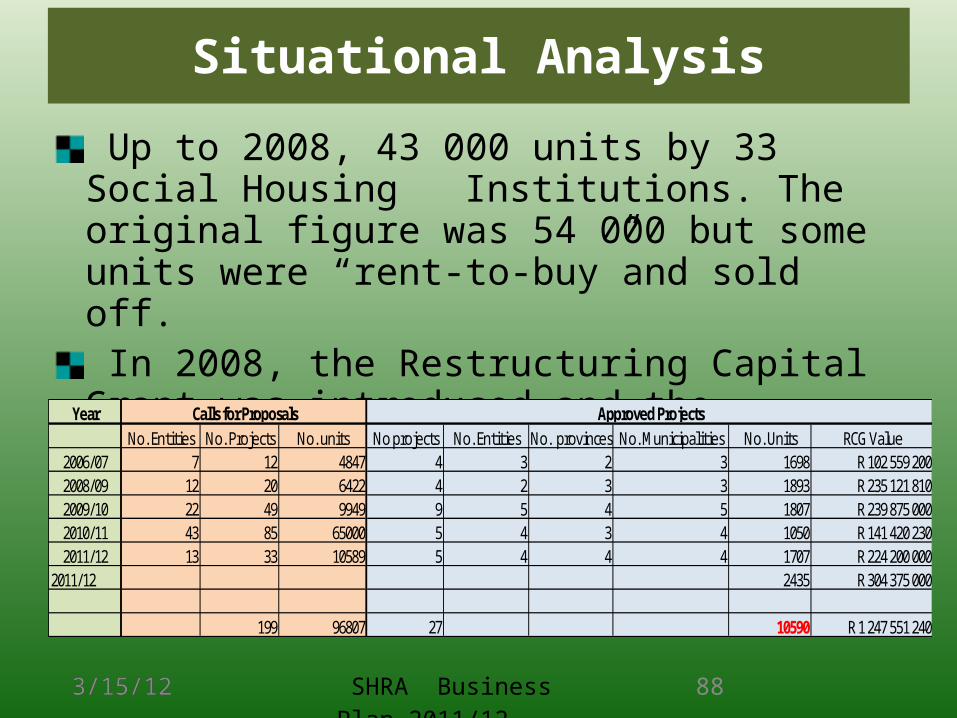
Up to 2008, 43 000 units by 33 Social Housing Institutions. The original figure was 54 000
but some units were “rent-to-buy”and sold off. In 2008, the Restructuring Capital Grant was introduced and the delivery is 10 590:-
YearNo. Entities No. Projects No. units No projects No. Entities No. provinces No. Municipalities No. Units RCG Value
2006/07 7 12 4847 4 3 2 3 1698 R 102 559 2002008/09 12 20 6422 4 2 3 3 1893 R 235 121 8102009/10 22 49 9949 9 5 4 5 1807 R 239 875 0002010/11 43 85 65000 5 4 3 4 1050 R 141 420 2302011/12 13 33 10589 5 4 4 4 1707 R 224 200 000
2011/12 2435 R 304 375 000
199 96807 27 10590 R 1 247 551 240
Calls for Proposals Approved Projects

3/15/12 SHRA Business Plan 2011/12
Situational Analysis
99 3/15/12
Challenges:-Introduction of Co-op SectorIntroduction of Private SectorRecommendations from State of the Cities Report 2011Recommendations from National Planning Commission Report 2011

3/15/12 SHRA Business Plan 2011/12
Organisational Development State
1010 3/15/12
Current
Phase

3/15/12 SHRA Business Plan 2011/12
SHRA Council
SHRA Council
1111 3/15/12
SHRA Council Members Table 1: SHRA Council Members
Name Professions\Experience Gender
Zohra Ebrahim (Chairman) Social Housing Specialist Female
Gratitude Booysen (Deputy Chairperson) Housing Policy: SALGA Male
Maphuti Lamola Rental Housing Board: Lawyer Female
Ahmedi Vawda Town Planner Male
Sharon Trail Consultant: Habitat & Housing Finance Female
Seeng Ntsaba-Letele Gauteng Rental Tribunal: Advocate Female
Nontutuzelo Nogaga Executive Manager: Property Development Group Female
Collen Weapond Forensic Auditor and Advocate Male
Shanaaz Majiet Resigned in November 2011

3/15/12 SHRA Business Plan 2011/12
SHRA Council
SHRA Council
1212 3/15/12

3/15/12 SHRA Business Plan 2011/12
Fu
nct
ion
al S
tru
ctu
re
1313 3/15/12
Council
Intervention Manager
Regulations Manager
CFO
Executive Assistant
Committees
AdministrativeAssistant
PA
KnowledgeManager
Research & Development
InvestmentManager
Corporate Services Manager
Company Secretary
CEO
HR(Outsourced)
Accountant
IT
Intern
Reception
Messenger
Supply Chain Management
Accreditation Manager
Compliance & Monitoring
Legal Officer
Senior Administrator
Relationship Manager
Information Analyst
Investment Analyst
Administrator
Pipeline Analyst
Technical Manager
GrantManager

3/15/12 SHRA Business Plan 2011/12
Strategic Objectives
1414 3/15/12
Strategic Objective Objective Statement
Strategic Objective 1 Incremental Implementation of the Social Housing Act 16 0f 2008
Further Development of SHRA footprint as a national regulator Proper Functioning of the SHRA Council Fully developed internal operational environment to support the
business including risk management and performance management Provide the platform for efficient and effective regulation and
investment programmes Development of comprehensive Rental programme and host Sub-
PMU as support for Outcome 8 and beyond Rollout of subsequent phases of SHRA Outreach programme
including agreements with relevant stakeholders No baseline
Strategic Objective 2 Efficient and effective Regulation of the Social Housing sector
Develop subordinate legislation for approval Ensure annual accreditation of qualifying entities and accessibility of
register Ensure effective compliance and monitoring of the sector Deploy interventions as per Act and Regulations where necessary Baseline : Process all applications for accreditation received
Strategic Objective 1 Efficient and effective Investment in the Sector
Ensure optimal use of Restructuring Capital Grant in the delivery of social housing units
Ensure optimal use of capacitation grant funding mechanisms to support regulation and investment programmes
Rollout private sector and co-op housing strategies
Form alliances and partnerships with local and international funders to create more adaptive funding models and leverage more finance for the sector.
Baseline: Ensure maximum number of units yielded by optimal use of RCG.

3/15/12 SHRA Business Plan 2011/12
Targets (APP)
1515 3/15/12
Strategic objective
Audited/Actual performanceEstimated
performance
2012
Medium-term targets
2009 2010 2011 2013 2014 2015 2016
1 Investment in Social Housing 1041 units 4214 units 4661 units 5429 units 5668 units 5979 units
2 Accreditation 33 entities 40 entities 45 entities 50 entities 50 entities 70 entities
3 Regulation 10 entities 20 entities 30 entities 40 entities 40 entities 50 entities

3/15/12 SHRA Business Plan 2011/12
Targets (APP)
1616 3/15/12
Programme performance indicator
Audited/Actual performanceEstimated
performance2012
Medium-term targets
2009 2010 2011 2013 2014 2015 2016
1 Number of SH units approved 1041 4142 4661 5429 5668 5979
2 Number of project feasibility grants issued 6 14 16 20 30
3 Number of Gear-up grants issued 3 15 20 25 30
4 Number of Specific Intervention grants issued 3 15 15 15 20
5 Percentage of applications processed for accreditation 100 100 100 100 100 100
6 Percentage of accredited applications 60 60 70 75 75
7 Number of Compliance Inspections 2 12 20 30 30

3/15/12 SHRA Business Plan 2011/12
Targets (APP)
1717 3/15/12
Financial Year Units Approved Institutional Grants Accredited Entities
2012/13 4 661 25 35
2013/14 5 429 30 40
2014/15 5 668 50 45
2015/16 5 979 70 50
2016/17 6 211 70
Total 27 948 245 aggregated
3/15/12 SHRA Business Plan 2011/12
Financials
1818 3/15/12
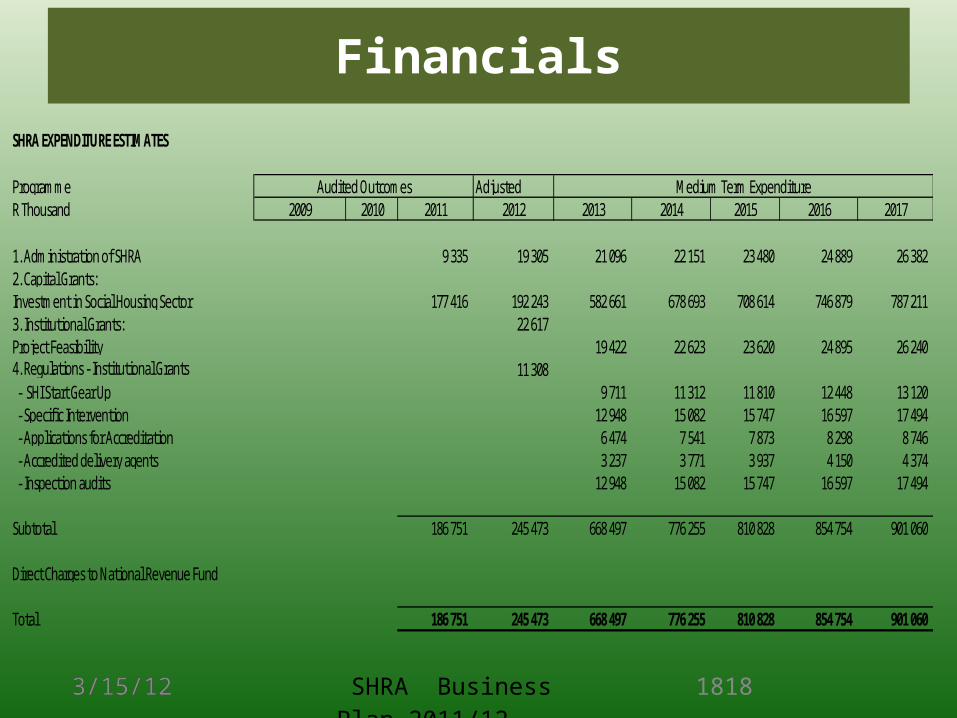
SHRA EXPENDITURE ESTIMATES
Programme AdjustedR Thousand 2009 2010 2011 2012 2013 2014 2015 2016 2017
1. Administration of SHRA 9 335 19 305 21 096 22 151 23 480 24 889 26 382 2. Capital Grants:Investment in Social Housing Sector 177 416 192 243 582 661 678 693 708 614 746 879 787 211 3. Institutional Grants: 22 617 Project Feasibility 19 422 22 623 23 620 24 895 26 240 4. Regulations - Institutional Grants 11 308 - SHI Start Gear Up 9 711 11 312 11 810 12 448 13 120 - Specific Intervention 12 948 15 082 15 747 16 597 17 494 - Applications for Accreditation 6 474 7 541 7 873 8 298 8 746 - Accredited delivery agents 3 237 3 771 3 937 4 150 4 374 - Inspection audits 12 948 15 082 15 747 16 597 17 494
Subtotal 186 751 245 473 668 497 776 255 810 828 854 754 901 060
Direct Charges to National Revenue Fund
Total 186 751 245 473 668 497 776 255 810 828 854 754 901 060
Audited Outcomes Medium Term Expenditure
3/15/12 SHRA Business Plan 2011/12
Financials
1919 3/15/12
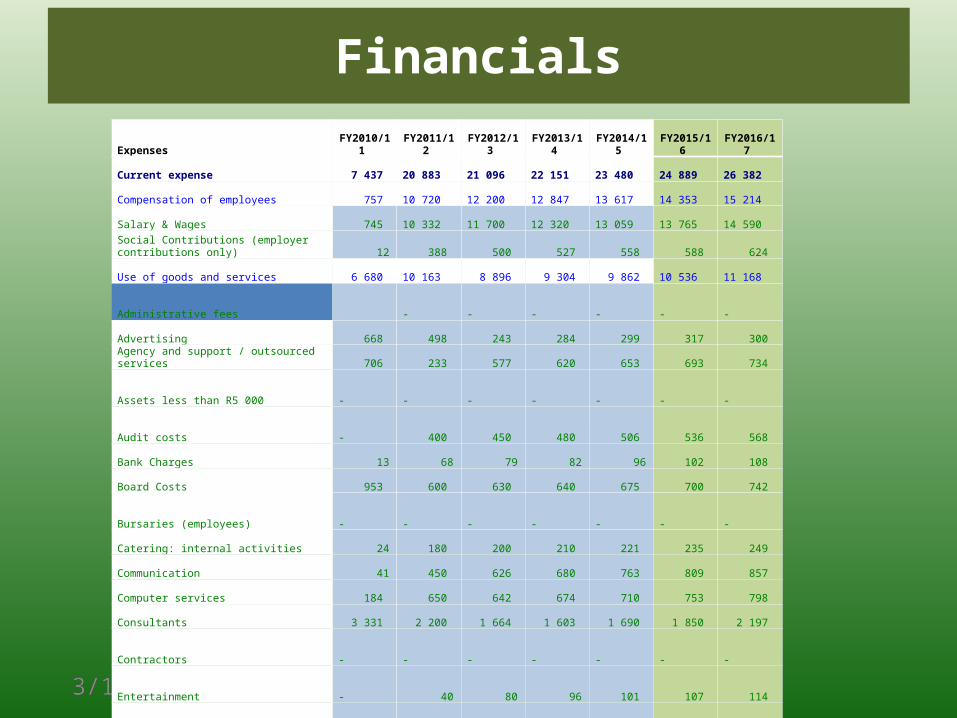
Expenses FY2010/11 FY2011/12 FY2012/13 FY2013/14 FY2014/15 FY2015/16 FY2016/17
Current expense 7 437 20 883 21 096 22 151 23 480 24 889 26 382
Compensation of employees 757 10 720 12 200 12 847 13 617 14 353 15 214
Salary & Wages 745 10 332 11 700 12 320 13 059 13 765 14 590
Social Contributions (employer contributions only) 12 388 500 527 558 588 624
Use of goods and services 6 680 10 163 8 896 9 304 9 862 10 536 11 168
Administrative fees - - - - - -
Advertising 668 498 243 284 299 317 300
Agency and support / outsourced services 706 233 577 620 653 693 734
Assets less than R5 000 - - - - - - -
Audit costs - 400 450 480 506 536 568
Bank Charges 13 68 79 82 96 102 108
Board Costs 953 600 630 640 675 700 742
Bursaries (employees) - - - - - - -
Catering: internal activities 24 180 200 210 221 235 249
Communication 41 450 626 680 763 809 857
Computer services 184 650 642 674 710 753 798
Consultants 3 331 2 200 1 664 1 603 1 690 1 850 2 197
Contractors - - - - - - -
Entertainment - 40 80 96 101 107 114
Lease payments - 1 200 1 310 1 415 1 491 1 581 1 676
Legal fees - 385 420 466 491 521 552
Non life insurance - 126 160 168 177 188 199
Printing and Publication 76 338 356 373 393 417 442
Property payments - - - - -
Repairs and maintenance 5 30 31 34 36 38 40
Research and development - 230 350 380 401 425 250
Training and staff development 36 145 180 195 206 218 231
Travel and subsistence 524 2 000 800 800 843 932 988
Utilities 103 10 12 14 15 16 17
Venues and facilities 16 380 86 90 95 101 107

3/15/12 SHRA Business Plan 2011/12
Financials
2020 3/15/12
STATEMENT OF FINANCIAL PERFORMANCER 000 R 000 R 000 R 000 R 000 R 000
Mar-12 Mar-13 Mar-14 Mar-15 Mar-16 Mar-17Revenue
Grants received:NDHS - 21 096 22 151 23 480 24 889 26 382 Realisation of Deferred Transfers 117 627 414 138 732 769 780 708 827 550 877 204 Interest 5 535 - - - - - Other Income 380 - - - - -
Total Revenue 123 542 435 234 754 920 804 188 852 439 903 586
Expenditure
Compensation of Employees 10 720 12 200 12 847 13 617 14 352 15 127 ▪ Salaries 10 332 11 700 12 320 13 059 13 764 14 507 ▪ Social Contributions 388 500 527 558 588 620 Depreciation 510 290 290 290 306 322 Capital Restructuring Grants 94 720 384 893 704 071 750 518 795 549 843 282 Capacity Grants 7 304 27 485 26 911 28 470 30 178 31 989 Travelling costs 2 000 800 800 800 843 889
115 254 425 668 744 919 793 695 841 228 891 609 Other Administration Expenses 8 288 9 566 10 001 10 493 11 211 11 976
Total Expenditure 123 542 435 234 754 920 804 188 852 439 903 585
Surplus for the year - - - - (0) 0

3/15/12 SHRA Business Plan 2011/12
Financials
2121 3/15/12
STATEMENT OF FINANCIAL POSITIONR 000 R 000 R 000 R 000 R 000 R 000
Mar-12 Mar-13 Mar-14 Mar-15 Mar-16 Mar-17Assets
Current Assets Trade and other receivables 251 251 251 251 251 251 Cash and cash equivalents 260 827 498 124 521 709 528 954 560 664 594 277
261 078 498 375 521 960 529 205 560 915 594 528
Non-Current Assets Property, plant and equipment 4 649 5 766 6 476 6 936 7 352 7 793
4 649 5 766 6 476 6 936 7 352 7 793
Total Assets 265 727 504 141 528 436 536 141 568 267 602 321
Liabilities
Current Liabilities Deferred Government Grant 255 413 488 676 510 010 516 651 547 650 580 509 Trade and other payables 2 119 1 749 2 749 2 914 3 089 3 274
257 532 490 425 512 759 519 565 550 739 583 783
Total Liabilities 257 532 490 425 512 759 519 565 550 739 583 783
Net AssetsAccumulated surplus 8 195 13 716 15 677 16 576 17 528 18 538
- - - - - - ok ok ok ok ok ok
3/15/12 SHRA Business Plan 2011/12
Financials
2222 3/15/12
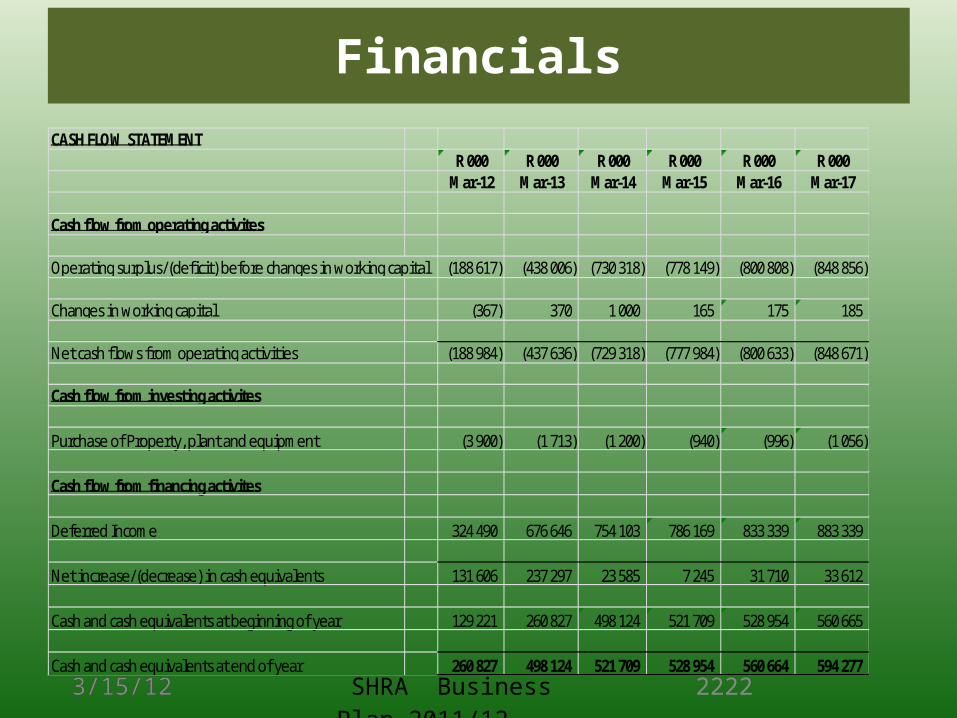
CASH FLOW STATEMENTR 000 R 000 R 000 R 000 R 000 R 000
Mar-12 Mar-13 Mar-14 Mar-15 Mar-16 Mar-17
Cash flow from operating activites
Operating surplus/(deficit) before changes in working capital (188 617) (438 006) (730 318) (778 149) (800 808) (848 856)
Changes in working capital (367) 370 1 000 165 175 185
Net cash flows from operating activities (188 984) (437 636) (729 318) (777 984) (800 633) (848 671)
Cash flow from investing activites
Purchase of Property, plant and equipment (3 900) (1 713) (1 200) (940) (996) (1 056)
Cash flow from financing activites
Deferred Income 324 490 676 646 754 103 786 169 833 339 883 339
Net increase/(decrease) in cash equivalents 131 606 237 297 23 585 7 245 31 710 33 612
Cash and cash equivalents at beginning of year 129 221 260 827 498 124 521 709 528 954 560 665
Cash and cash equivalents at end of year 260 827 498 124 521 709 528 954 560 664 594 277

3/15/12 SHRA Business Plan 2011/12
Financials
2323 3/15/12
Financial YearOperational Budget Capital Budget Total
(Rm) (Rm) (Rm)
2012/13 21 096 647 401 668 497
2013/14 22 151 754 104 776 255
2014/15 23 480 787 348 810 828
2015/16 24 889 829 865 854 754
2016/17 26 382 874 678 901 060
Total 117 998 3 893 396 4 011 394
Summary

3/15/12 SHRA Business Plan 2011/12
Q & A
2424 3/15/12


