20
Ireland’s National Greenhouse Gas Emissions Projections to 2020 Includes comparison with Ireland’s Kyoto Limit for 2008-2012 and with Proposed EU Target for 2020 25 September 2008
| Date post: | 13-May-2017 |
| Category: |
Documents |
| Upload: | ronald-de-la-cruz |
| View: | 214 times |
| Download: | 0 times |
Ireland’s National Greenhouse Gas
Emissions Projections to 2020
Includes comparison with
Ireland’s Kyoto Limit for 2008-2012
and with
Proposed EU Target for 2020
25 September 2008


1
EPA Headquarters
PO Box 3000
Johnstown Castle Estate
County Wexford, Ireland
T +353 53 9160600
LoCall 1890 33 55 99
www.epa.ie
September 25th
2008
IRELAND’S GREENHOUSE GAS EMISSION PROJECTIONS 2007-2020
Summary
The National Climate Change Strategy (NCCS 2007) designated EPA with responsibility for
developing annual national emission projections for greenhouse gases (GHG) for all key
sectors of the economy, in collaboration with relevant State and other bodies. Emission
projections serve to inform national policy initiatives, such as the annual Carbon Budget, and
allow Ireland to comply with EU reporting obligations on projections (e.g. Council Decision
280/2004).
The EPA intends to produce GHG emission projections annually as this will allow the most
recent environmental and other policy developments to be taken into account as well as
updates to key assumptions (such as revisions to anticipated economic growth). The
projections presented here update the most recent set of national emissions projections which
were published in the NCCS (DEHLG, 2007).
Greenhouse gas emission projections have been produced, under three scenarios, for each key
emission sector up to 2020. The three scenarios show three potential outlooks for emissions
to 2020 depending on policy development and implementation. The scenarios are:
(i) the Baseline scenario which is based on current policies and measures.
However not all existing policies and measures from the NCCS are
included in this scenario.
(ii) the With Measures scenario which adjusts the Baseline scenario to
account for all existing policies and measures from the NCCS.
(iii) the With Additional Measures scenario adjusts the Baseline scenario to
account for all existing and planned policies and measures. Planned
policies and measures include the renewable energy targets set out in the
Energy White Paper and energy efficiency targets set out in the draft
Energy Efficiency Action Plan.
Greenhouse Gas Emissions Targets
Ireland is currently faced with meeting two targets with respect to greenhouse gas emissions.
The first of these is the Kyoto Protocol to the United Nations Framework Convention on
Climate Change (UNFCCC) which limits Ireland’s total national emissions to an average of
2
62.8 Mtonnes of CO2e per annum (13% above the baseline estimate) in the period 2008 –
2012.
The Kyoto Protocol is, however, only a first step in addressing the serious global threat of
climate change. The ultimate goal of the UNFCCC is to stabilise atmospheric concentrations
of greenhouse gases at a level that prevents dangerous human interference with the climate
system. Therefore, in January 2008 the EU Commission put forward a package of proposals
that will deliver on the European Union's commitments to fight climate change and promote
renewable energy up to 2020 and beyond. The package seeks to deliver a 20% reduction in
total EU greenhouse gas emissions by 2020 (relative to 1990 levels) and at the same time to
increase to 20% the share of renewable energies in energy consumption. The emissions
reduction will be increased to 30% by 2020 when a new global climate change agreement is
reached.
The total effort for greenhouse gas reductions by 2020 has been divided between the sectors
covered by the EU Emissions Trading Scheme (ETS) and non-ETS sectors1. For those sectors
covered by the EU ETS, a single EU-wide cap has been proposed. Consequently, there are no
specific national emissions targets for emissions from ETS sectors in 2020. For those sectors
that are not covered by the EU ETS, the Commission has proposed individual targets for
Member States which average out at a total of 10% reduction in 2020 (compared to 2005).
The proposed target for Ireland for non-ETS sector emissions is to reduce emissions by 20%
by 2020 relative to 2005 levels; the proposed limit has been calculated by the EU
Commission as 37.9 Mtonnes of CO2e.
Comparison with Kyoto Protocol Target (2008 – 2012)
The projections indicate the level of total national emissions in Ireland over the Kyoto period
2008 – 2012 and, therefore, indicate our distance to the Kyoto Protocol target under the three
scenarios. The impact of forest sinks is included in each scenario as allowed for under Article
3.3 of the Kyoto Protocol.
• Under the Baseline scenario, emissions, over the period 2008 – 2012, are projected to
be 9.0 Mtonnes of CO2e per annum higher than our Kyoto Protocol target. When
account is taken of the contribution from the EU ETS, the distance to target reduces to
6.7 Mtonnes of CO2e per annum.
• Projections under the With Measures scenario are similar to those under the Baseline
scenario. Emissions are projected to be 8.7 Mtonnes of CO2e per annum higher than
our Kyoto Protocol target. When account is taken of the contribution from the EU
ETS, the distance to target reduces to 6.5 Mtonnes of CO2e per annum.
• Under the With Additional Measures scenario, emissions are projected to be 7.0
Mtonnes of CO2e per annum higher than our Kyoto Protocol target. When account is
taken of the contribution from the EU ETS, the distance to target reduces to 5.0
Mtonnes of CO2e per annum.
1 Non-ETS sector emissions refer to emissions from sources that are not included in the emissions trading
scheme such as transport, households, services, smaller industrial installations, agriculture and waste.
3
• The NCCS envisaged Ireland over-achieving on its Kyoto Protocol target through (i)
the use all existing and additional policies and measures and (ii) the purchase of
Kyoto mechanisms equivalent to 3.607 Mtonnes of CO2e per annum. The projections
presented here now imply a further distance to target of 1.4 Mtonnes per annum after
all existing and additional policies and measures, forest sinks and the purchase of
Kyoto mechanisms, as envisaged in the NCCS, are taken into account.
Comparison with proposed EU 2020 Targets for non-ETS sector emissions
The projections have been disaggregated into EU ETS and the non-ETS sectors to allow a
comparison to be made with the proposed 2020 target for non-ETS sector emissions.
• Ireland’s non-ETS sector emissions in 2020 are projected to be 15.0 Mtonnes of CO2e
higher than the proposed EU Commission 2020 target under the Baseline scenario.
The impact of forest sinks is still under negotiation at Member State level and
therefore projections are reported here without forest sinks.
• Under the With Measures scenario, non-ETS sector emissions are projected to be
14.0 Mtonnes of CO2e higher in 2020 than the proposed EU Commission 2020 target.
• Under the With Additional Measures scenario, national emissions are projected to be
7.0 Mtonnes of CO2e higher in 2020 than the proposed 2020 target. A significant
reduction in the distance to the 2020 target is projected in this scenario relative to the
Baseline and the With Measures scenario. This is attributable to the projected impact
of all policies and measures outlined primarily in the Energy White Paper and the
draft Energy Efficiency Action Plan. The impact of these measures will be realised
primarily in the period 2012 and 2020. The With Additional Measures scenario
assumes that (i) all the relevant policies and measures outlined in these Government
policy documents will be adopted and fully implemented on time and (ii) all relevant
measures will achieve the full emissions reductions anticipated. Failure to deliver
these measures or a reduction in their environmental effectiveness will result in higher
emissions levels than projected. The difficulties associated with meeting these criteria
should not be underestimated.
4
Background
The National Climate Change Strategy (NCCS 2007)2 designated EPA with responsibility for
developing annual national emission projections for greenhouse gases (GHG) for all key
sectors of the economy, in collaboration with relevant State and other bodies. Emissions
projections serve to inform national policy initiatives, such as the annual Carbon Budget, and
allow Ireland to comply with EU reporting obligations on projections (e.g. Council Decision
280/2004).
The EPA intends to produce GHG emission projections annually as this will allow the most
recent environmental and other policy developments to be taken into account as well as
updates to key assumptions (such as revisions to anticipated economic growth). The
projections presented here update the most recent set of national emissions projections which
were published in the NCCS (2007).
The latest projections are given below with a discussion of the key trends and a commentary
on the significance of the figures in relation to Ireland’s commitments for the 2008 – 2012
period and in relation to proposed EU 2020 emission targets for non-ETS sector emissions.
These projections are underpinned by data provided by a range of other State agencies and
organisations, most notably Sustainable Energy Ireland (SEI) for energy forecasts and
Teagasc for forecast animal numbers. A key assumption underpinning the energy forecasts
and hence emissions projections is a low-growth economic outlook for the period 20073 –
20204. It is assumed that GDP growth will be on average 4.2% between 2005 and 2010, 3.1%
between 2010 and 2015 and 3.2% between 2015 and 2020. These growth rates are generally
similar to the ESRI’s Benchmark forecast published in their 2008 – 2015 Medium-Term
Review (MTR)5 (which was published after these projections were prepared). The MTR
forecasts average GDP growth of 4.0% between 2005 and 2010, 3.6% between 2010 and
2015 and 3.3% between 2015 and 2020.
Ireland’s Greenhouse Gas Emission Projections
Three scenarios were produced which show three potential outlooks to 2020 depending on
policy development and implementation. The scenarios are called
(i) Baseline
(ii) With Measures
(iii) With Additional Measures
A description of the three scenarios is provided in Table 1.
2 National Climate Change Strategy 2007 - 2012. Department of Environment, Heritage and Local Government.
(2007) 3 As the most recent national greenhouse gas inventory is for 2006 (finalised in 2008 by the EPA), projections
are made for each year from 2007 up to 2020. 4 National energy forecasts underpin the energy-related emission projections reported here. These are produced
by ESRI for Sustainable Energy Ireland and are published annually. See “Energy in Ireland 1990-2006”,
Sustainable Energy Ireland (2007) for the key assumptions underpinning the 2007 energy forecasts. 5 Medium-Term Review 2008 – 2015. ESRI. (2008).
5
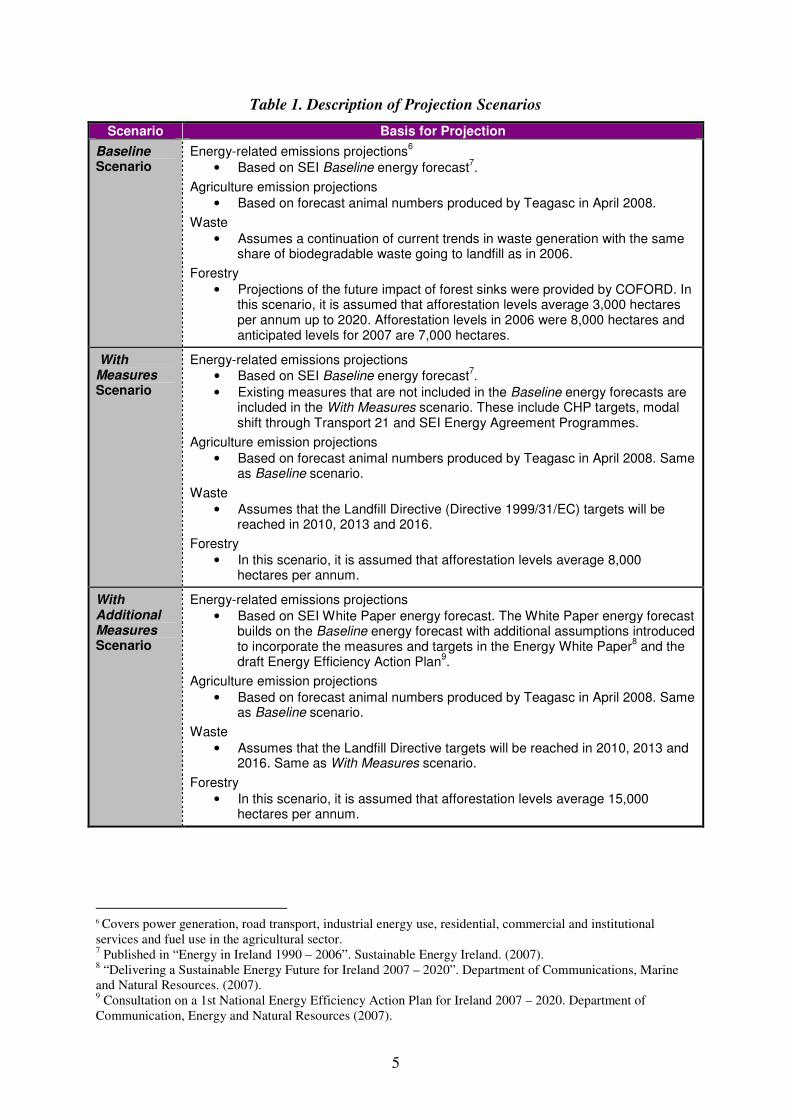
Table 1. Description of Projection Scenarios
Scenario Basis for Projection
Baseline Scenario
Energy-related emissions projections6
• Based on SEI Baseline energy forecast7.
Agriculture emission projections
• Based on forecast animal numbers produced by Teagasc in April 2008.
Waste
• Assumes a continuation of current trends in waste generation with the same share of biodegradable waste going to landfill as in 2006.
Forestry
• Projections of the future impact of forest sinks were provided by COFORD. In this scenario, it is assumed that afforestation levels average 3,000 hectares per annum up to 2020. Afforestation levels in 2006 were 8,000 hectares and anticipated levels for 2007 are 7,000 hectares.
With
Measures Scenario
Energy-related emissions projections
• Based on SEI Baseline energy forecast7.
• Existing measures that are not included in the Baseline energy forecasts are included in the With Measures scenario. These include CHP targets, modal shift through Transport 21 and SEI Energy Agreement Programmes.
Agriculture emission projections
• Based on forecast animal numbers produced by Teagasc in April 2008. Same as Baseline scenario.
Waste
• Assumes that the Landfill Directive (Directive 1999/31/EC) targets will be reached in 2010, 2013 and 2016.
Forestry
• In this scenario, it is assumed that afforestation levels average 8,000 hectares per annum.
With
Additional
Measures Scenario
Energy-related emissions projections
• Based on SEI White Paper energy forecast. The White Paper energy forecast builds on the Baseline energy forecast with additional assumptions introduced to incorporate the measures and targets in the Energy White Paper
8 and the
draft Energy Efficiency Action Plan9.
Agriculture emission projections
• Based on forecast animal numbers produced by Teagasc in April 2008. Same as Baseline scenario.
Waste
• Assumes that the Landfill Directive targets will be reached in 2010, 2013 and 2016. Same as With Measures scenario.
Forestry
• In this scenario, it is assumed that afforestation levels average 15,000 hectares per annum.
6 Covers power generation, road transport, industrial energy use, residential, commercial and institutional
services and fuel use in the agricultural sector. 7 Published in “Energy in Ireland 1990 – 2006”. Sustainable Energy Ireland. (2007).
8 “Delivering a Sustainable Energy Future for Ireland 2007 – 2020”. Department of Communications, Marine
and Natural Resources. (2007). 9 Consultation on a 1st National Energy Efficiency Action Plan for Ireland 2007 – 2020. Department of
Communication, Energy and Natural Resources (2007).
6
BASELINE SCENARIO
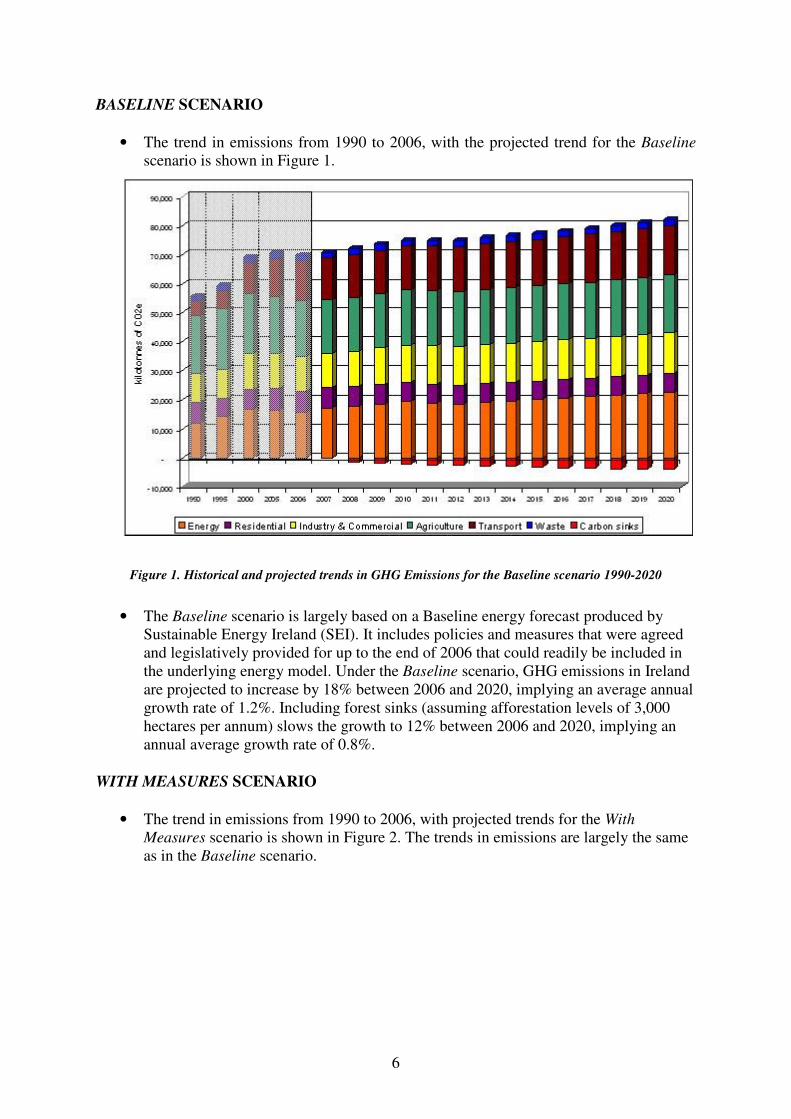
• The trend in emissions from 1990 to 2006, with the projected trend for the Baseline
scenario is shown in Figure 1.
Figure 1. Historical and projected trends in GHG Emissions for the Baseline scenario 1990-2020
• The Baseline scenario is largely based on a Baseline energy forecast produced by
Sustainable Energy Ireland (SEI). It includes policies and measures that were agreed
and legislatively provided for up to the end of 2006 that could readily be included in
the underlying energy model. Under the Baseline scenario, GHG emissions in Ireland
are projected to increase by 18% between 2006 and 2020, implying an average annual
growth rate of 1.2%. Including forest sinks (assuming afforestation levels of 3,000
hectares per annum) slows the growth to 12% between 2006 and 2020, implying an
annual average growth rate of 0.8%.
WITH MEASURES SCENARIO
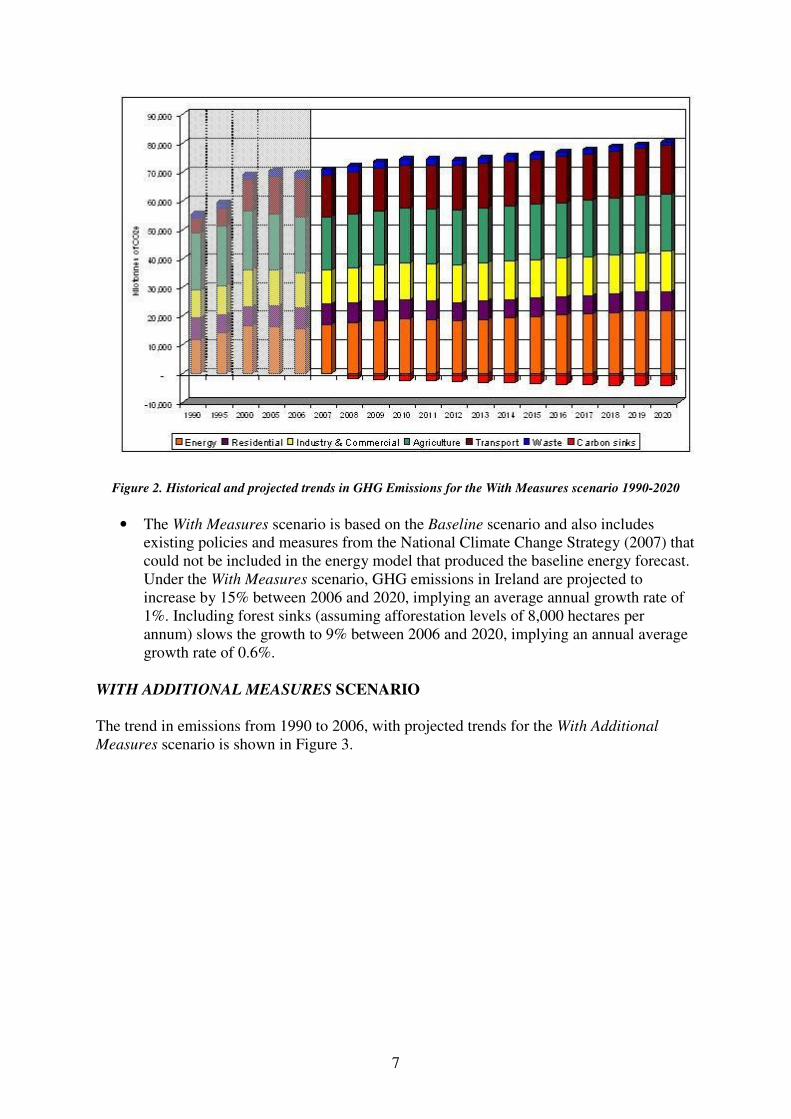
• The trend in emissions from 1990 to 2006, with projected trends for the With
Measures scenario is shown in Figure 2. The trends in emissions are largely the same
as in the Baseline scenario.
7
Figure 2. Historical and projected trends in GHG Emissions for the With Measures scenario 1990-2020
• The With Measures scenario is based on the Baseline scenario and also includes
existing policies and measures from the National Climate Change Strategy (2007) that
could not be included in the energy model that produced the baseline energy forecast.
Under the With Measures scenario, GHG emissions in Ireland are projected to
increase by 15% between 2006 and 2020, implying an average annual growth rate of
1%. Including forest sinks (assuming afforestation levels of 8,000 hectares per
annum) slows the growth to 9% between 2006 and 2020, implying an annual average
growth rate of 0.6%.
WITH ADDITIONAL MEASURES SCENARIO
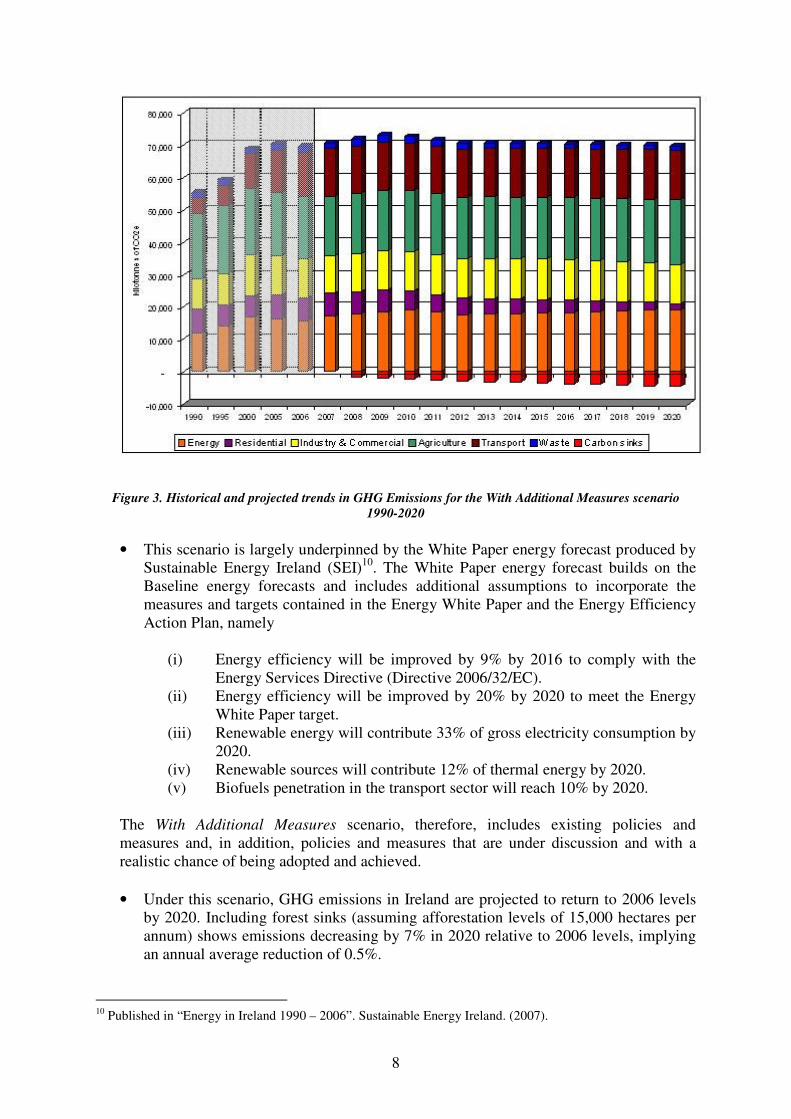
The trend in emissions from 1990 to 2006, with projected trends for the With Additional
Measures scenario is shown in Figure 3.
8
Figure 3. Historical and projected trends in GHG Emissions for the With Additional Measures scenario
1990-2020
• This scenario is largely underpinned by the White Paper energy forecast produced by
Sustainable Energy Ireland (SEI)10
. The White Paper energy forecast builds on the
Baseline energy forecasts and includes additional assumptions to incorporate the
measures and targets contained in the Energy White Paper and the Energy Efficiency
Action Plan, namely
(i) Energy efficiency will be improved by 9% by 2016 to comply with the
Energy Services Directive (Directive 2006/32/EC).
(ii) Energy efficiency will be improved by 20% by 2020 to meet the Energy
White Paper target.
(iii) Renewable energy will contribute 33% of gross electricity consumption by
2020.
(iv) Renewable sources will contribute 12% of thermal energy by 2020.
(v) Biofuels penetration in the transport sector will reach 10% by 2020.
The With Additional Measures scenario, therefore, includes existing policies and
measures and, in addition, policies and measures that are under discussion and with a
realistic chance of being adopted and achieved.
• Under this scenario, GHG emissions in Ireland are projected to return to 2006 levels
by 2020. Including forest sinks (assuming afforestation levels of 15,000 hectares per
annum) shows emissions decreasing by 7% in 2020 relative to 2006 levels, implying
an annual average reduction of 0.5%.
10
Published in “Energy in Ireland 1990 – 2006”. Sustainable Energy Ireland. (2007).
9
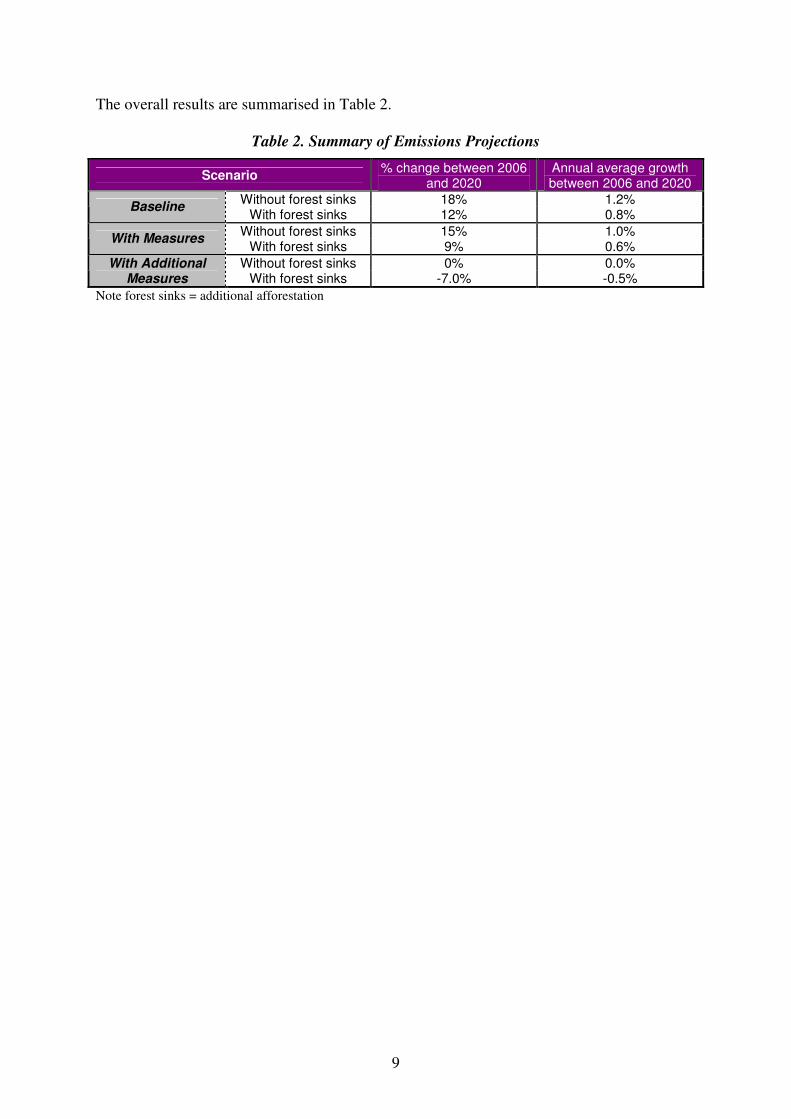
The overall results are summarised in Table 2.
Table 2. Summary of Emissions Projections
Scenario % change between 2006
and 2020 Annual average growth between 2006 and 2020
Without forest sinks 18% 1.2% Baseline
With forest sinks 12% 0.8%
Without forest sinks 15% 1.0% With Measures
With forest sinks 9% 0.6%
Without forest sinks 0% 0.0% With Additional
Measures With forest sinks -7.0% -0.5%
Note forest sinks = additional afforestation
10
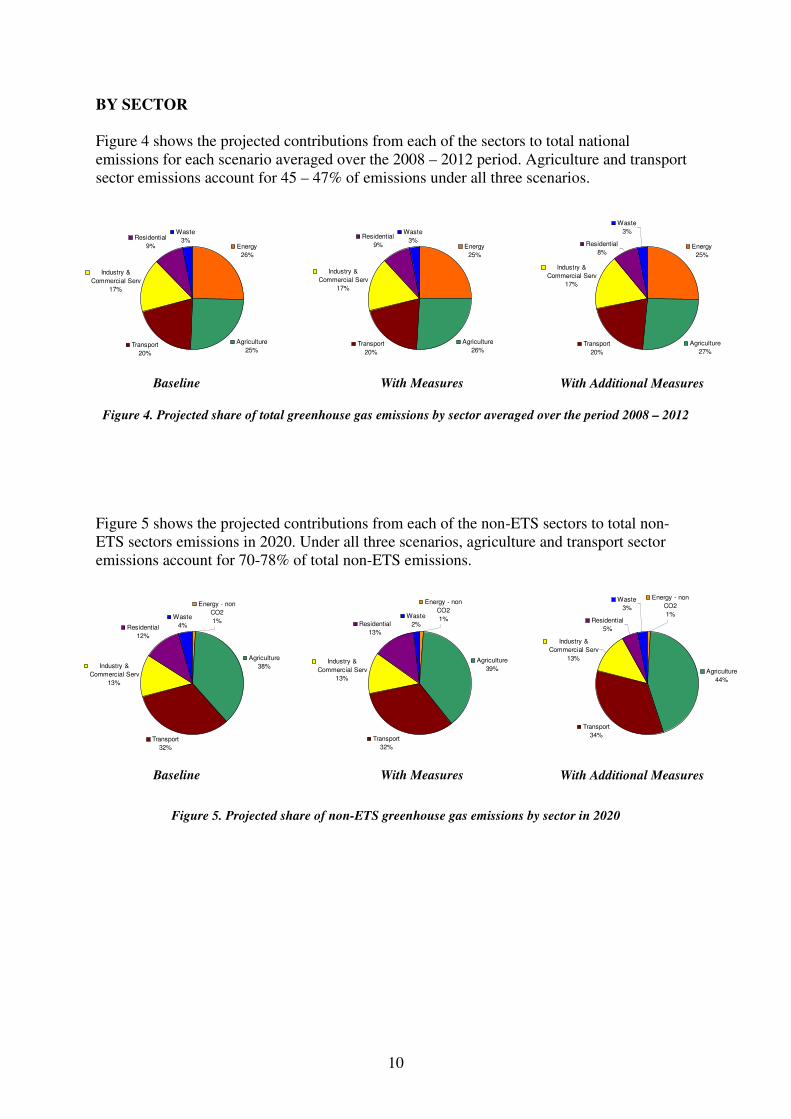
BY SECTOR
Figure 4 shows the projected contributions from each of the sectors to total national
emissions for each scenario averaged over the 2008 – 2012 period. Agriculture and transport
sector emissions account for 45 – 47% of emissions under all three scenarios.
Figure 4. Projected share of total greenhouse gas emissions by sector averaged over the period 2008 – 2012
Figure 5 shows the projected contributions from each of the non-ETS sectors to total non-
ETS sectors emissions in 2020. Under all three scenarios, agriculture and transport sector
emissions account for 70-78% of total non-ETS emissions.
Figure 5. Projected share of non-ETS greenhouse gas emissions by sector in 2020
Energy
26%
Agriculture
25%Transport
20%
Industry &
Commercial Serv
17%
Residential
9%
Waste
3%Energy
25%
Agriculture
26%Transport
20%
Industry &
Commercial Serv
17%
Residential
9%
Waste
3%Energy
25%
Agriculture
27%
Transport
20%
Industry &
Commercial Serv
17%
Residential
8%
Waste
3%
Baseline With Measures With Additional Measures
Agriculture
44%
Transport
34%
Industry &
Commercial Serv
13%
Residential
5%
Waste
3%
Energy - non
CO2
1%
Agriculture
39%
Transport
32%
Industry &
Commercial Serv
13%
Residential
13%
Waste
2%
Energy - non
CO2
1%
Agriculture
38%
Transport
32%
Industry &
Commercial Serv
13%
Residential
12%
Waste
4%
Energy - non
CO2
1%
Baseline With Measures With Additional Measures
11
Transport
• Under the Baseline scenario, transport emissions are projected to increase by 23%
over the period 2006 – 2020 to 16.9 Mtonnes of CO2e. It is assumed in this scenario
that the use of biofuels will increase to 2% of road transport fuel in 2008 and stay
constant thereafter to 2020.
• Under the With Measures scenario, transport emissions are projected to increase by
22% over the period 2006 – 2020 to 16.7 Mtonnes of CO2e. This scenario builds on
the Baseline scenario and also includes an estimate of the impact of Transport 21 and
closer alignment of spatial planning and transport investment.
• Under the With Additional Measures scenario, transport emissions are projected to
increase by 12% over the period 2006 – 2020 to 15.3 Mtonnes of CO2e. In this
scenario, it is assumed that the use of biofuels increases to 10% of all road transport
fuel use by 2020 which will have a significant impact on CO2 emissions from this
sector. As well as measures included in the With Measures scenario, savings
anticipated to be delivered through motor tax and VRT rebalancing and an energy
efficient driving campaign are included.
• The growth in transport is projected to slow significantly compared with the annual
growth rate between 1990 and 2006. This is attributable to a projected slow-down in
economic growth. Improving the quality and robustness of transport emission
projections will be a key focus for future work. Transport sector emissions are highly
dependent on key forecast variables including economic indicators such as GDP,
vehicle technology and the future travel behaviour of individuals. A continual focus
on these key underlying drivers and their impact on transport emission levels will be
important. Since these projections were prepared progress has been made with
projecting energy demand from transport which will impact projections from this
sector. These improvements will be incorporated in the next round of projections.
Energy
• Under the Baseline scenario, emissions from the energy sector are projected to
increase by 44% over the period 2006 – 2020 to 22.5 Mtonnes of CO2e. In this
scenario, it is assumed that renewable energy will account for 15% of Ireland’s gross
electricity consumption by 2010.
• Under the With Measures scenario, emissions are projected to increase by 41% over
the period 2006 – 2020 to 22.0 Mtonnes of CO2e. In addition to renewables
penetration of 15% of gross electricity consumption by 2010, it is also assumed that
the targets outlined in the Energy White Paper for Combined Heat and Power (CHP)
will be achieved.
• Under the With Additional Measures scenario, emissions are projected to increase by
21% between 2006 and 2020 to 18.9 Mtonnes of CO2e. It is assumed that renewable
energy will contribute 33% of gross electricity consumption by 2020 (primarily wind
but also biomass and ocean energy). In addition, indicative savings associated with
energy efficiency improvements in line with targets set down in the Energy White
Paper and the draft Energy Efficiency Action Plan are included in the underpinning
12
energy forecasts. Such energy efficiency measures will directly impact energy use and
therefore emissions from the energy sector.
Agriculture
• There is only one scenario for agricultural emission projections. Emissions are
projected to increase by 3% over the period 2006 – 2020 to 19.9 Mtonnes of CO2e.
These projections are based on unpublished forecast animal numbers produced by
Teagasc in April 2008 and supplied to the EPA. The assumptions and assumed policy
developments underpinning these forecasts include recent developments in
agricultural markets which has seen significant increases in cereal, fertiliser and dairy
prices, the gradual abolition of milk quota by 2015 and the introduction of a new
suckler cow premium in Ireland.
Residential
• Under the Baseline and With Measures scenario, emissions from the residential sector
are projected to decrease by 10% to 6.5 Mtonnes of CO2e between 2006 and 2020.
Factors such as increasingly efficient housing stock and a move away from solid fuels
to renewables and gas are all projected to have a positive impact on emissions from
this sector.
• Under the With Additional Measures scenario, emissions are projected to decrease by
71% between 2006 and 2020 to 2.1 Mtonnes of CO2e. This significant decrease in
projected emissions is predicated on the assumption that all of the relevant measures
outlined in the draft Energy Efficiency Action Plan, which includes new building
regulations, an insulation scheme and technologies for existing homes, will be
adopted and implemented on time and, in addition, will deliver the emissions savings
anticipated in the Action Plan.
Industry and Commercial Services
• Under the Baseline scenario, emissions from the industry and commercial service
sector are projected to grow by 17% between 2006 and 2020.
• Under the With Measures scenario, emissions from the industry and commercial
services sector are projected to grow by 16% between 2006 and 2020. As well as the
measures included in the Baseline scenario, this scenario also includes an estimate of
the impact of the 2005 Building Regulations and SEI Energy Agreements.
• Under the With Additional Measures scenario, emissions from the industry and
commercial services sector are projected to grow by 2% between 2006 and 2020. In
this scenario, energy demand from industrial and commercial services sectors
decreases relative to the Baseline and With Measures scenarios as energy efficiency
policies and measures (as outlined in the Energy White Paper and draft Energy
Efficiency Action Plan) are assumed to be adopted and implemented. In addition, the
RES-H target (i.e. 12% thermal heat to come from renewables by 2020) will have a
significant impact on emissions from both the industrial and commercial services
sector.
13
Waste
• Under the Baseline scenario, emissions from the waste sector, primarily methane gas
released from landfills, is projected to increase by 19% between 2006 and 2020. It is
assumed that current waste generation trends continue and the share of biodegradable
waste going to landfill remains the same as in 2006. The share of landfill gas that is
utilised and flared is also assumed to remain the same as in 2006.
• Under the With Measures and With Additional Measures scenarios, emissions from
the waste sector are projected to decrease by 31% below 2006 levels in 2020. In these
scenarios, it is assumed that the Landfill Directive targets (Directive 1999/31/EC) for
the diversion of biodegradable waste from landfill are met progressively in 2010,
2013 and 2016.

14
Comparison with Kyoto Protocol Target
Ireland’s target in relation to the Kyoto Protocol is to limit total national greenhouse gas
emissions to 314.2 Mtonnes of CO2e over the five year period 2008 – 2012 which is
equivalent to 62.8 Mtonnes of CO2e per annum. This is calculated as 13% above Ireland’s
1990 baseline value which was established and fixed at 55.60 Mt CO2e following an in-depth
review of Ireland’s 2006 greenhouse gas inventory submissions to the UNFCCC.
Table 5 shows the projected annual average emissions for the period 2008 – 2012 and the
subsequent distance to the Kyoto Protocol target (62.8 Mtonnes of CO2e). The impact of
forest sinks is included in each scenario as allowed for under Article 3.3 of the Kyoto
Protocol. The distance to target is disaggregated to show the contribution expected from EU
ETS sectors and from non-ETS sectors.
Table 5. Projected annual average emissions for 2008-2012 and
distance to Kyoto Protocol target
(Mtonnes of CO2e)
Baseline Scenario With Measures Scenario With Additional Measures
Scenario
Projected Emissions
Amount Over Target
Projected Emissions
Amount Over Target
Projected Emissions
Amount Over Target
2008-2012 71.9 9.0 71.5 8.7 69.7 7.0
Attributed to EU ETS
- 2.3 - 2.2 - 2.0
Attributed to Non-ETS
- 6.7 - 6.5 - 5.0
Figure 6 shows emissions for the period 1990 to 2020 for each scenario and compares with
the Kyoto Protocol target for the 2008 – 2012 period.
Figure 6. Historical and projected GHG Emissions for each scenario and the Kyoto Protocol target
15
The projections in the NCCS had shown Ireland over-achieving on its Kyoto Protocol limit
under a With Additional Measures scenario. However, these current projections now show
that even if all projected reductions from existing and planned policies and measures are
delivered and forest sinks and Kyoto mechanisms purchases are used as envisaged, Ireland
will still exceed its Kyoto Protocol limit by an average of 1.4 Mtonnes per annum of CO2e
for each of the five years over the period 2008 – 2012. Additional domestic policies and
measures and additional Government purchases will be required to bridge this gap.
16
Comparison with Proposed EU 2020 Target
for the Non-ETS Sector Emissions
The Kyoto Protocol is only a first step in addressing the serious global threat of climate
change. The ultimate goal of the UNFCCC is to stabilise atmospheric concentrations of
greenhouse gases at a level that prevents dangerous human interference with the climate
system. Therefore, in January 2008 the EU Commission put forward a package of proposals
that will deliver on the European Union's commitments to fight climate change and promote
renewable energy up to 2020 and beyond. The package seeks to deliver a 20% reduction in
total EU greenhouse gas emissions by 2020 (relative to 1990 levels) and at the same time
increase to 20% the share of renewable energies in energy consumption. The emissions
reduction will be increased to 30% by 2020 when a new global climate change agreement is
reached.
The total effort for greenhouse gas reductions by 2020 has been divided between the EU ETS
and non-ETS sectors. The following approach is proposed:
(i) A single EU wide cap for all emissions covered by the EU ETS, ensuring a level
playing field in the single European market for industrial installations, is
proposed. A 21% reduction in EU ETS sector emissions by 2020 (compared to
2005) has been proposed. The annual cap will decrease along a linear trend line
which will continue beyond the end of the third trading period (2013 – 2020).
Consequently, there are no specific national emissions targets for emissions from
ETS sectors in 2020.
(ii) An EU-wide reduction of 10% in 2020 (compared to 2005) for the sectors that are
not covered by the EU ETS. The Commission has proposed individual targets for
Member States which average out at a total 10% reduction in 2020 (compared to
2005). GDP per capita was used as the main criterion when setting the targets for
Member States. The proposed target for Ireland for non-ETS sectors is to reduce
emissions by 20% in 2020 relative to 2005 levels; the proposed limit has been
calculated by the EU Commission as 37.9 Mtonnes of CO2e.
Taken together, the combined ETS and non-ETS EU wide reductions will result in an overall
reduction of 14% compared to 2005, which is equivalent to a reduction of 20% compared to
1990.
The projections presented here were disaggregated into EU ETS and the non-ETS sectors to
allow a comparison to be made with the proposed 2020 target for non-ETS sector emissions.
Table 6 deals only with non-ETS sectors and shows the absolute level of emissions projected
for 2020, percentage change for each scenario in 2020 relative to 2005 emission levels and
the implied distance to the proposed 2020 target. The inclusion of the impact of forest sinks is
still under negotiation at Member State level and therefore projected emissions for 2020 are
presented both with and without forest sinks.
17
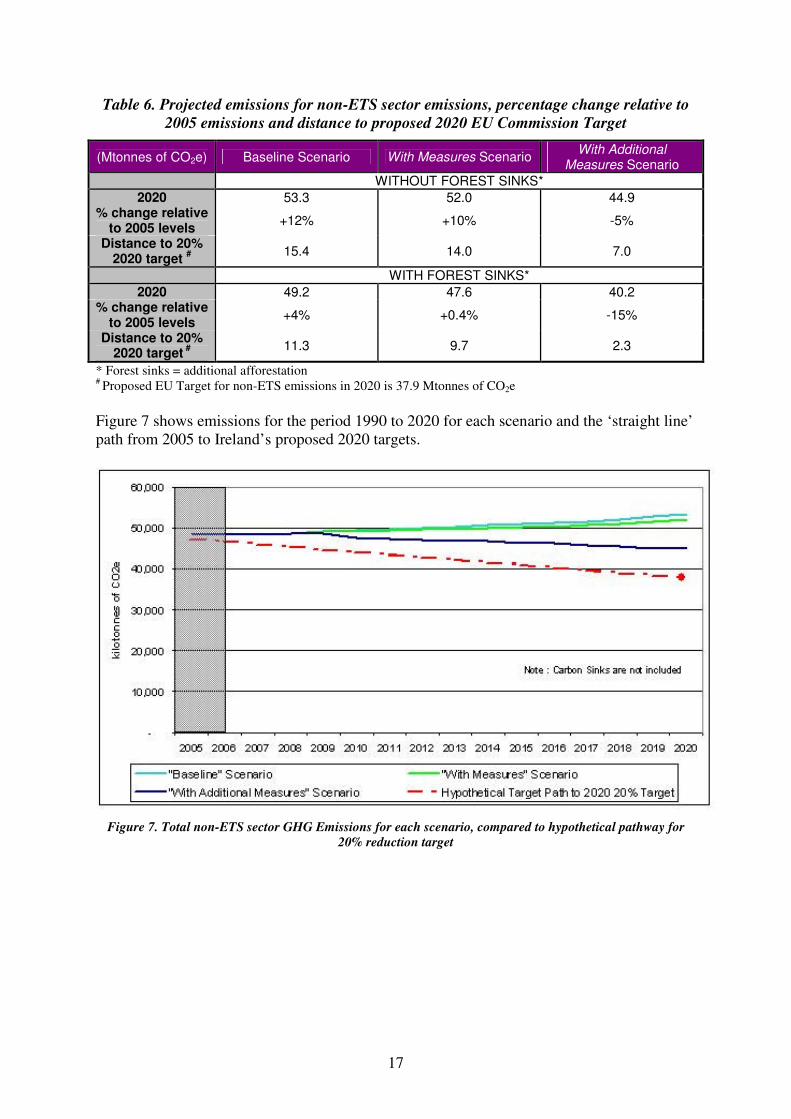
Table 6. Projected emissions for non-ETS sector emissions, percentage change relative to
2005 emissions and distance to proposed 2020 EU Commission Target
(Mtonnes of CO2e) Baseline Scenario With Measures Scenario With Additional
Measures Scenario
WITHOUT FOREST SINKS*
2020 53.3 52.0 44.9 % change relative
to 2005 levels +12% +10% -5%
Distance to 20% 2020 target
#
15.4 14.0 7.0
WITH FOREST SINKS*
2020 49.2 47.6 40.2 % change relative
to 2005 levels +4% +0.4% -15%
Distance to 20% 2020 target
#
11.3 9.7 2.3
* Forest sinks = additional afforestation # Proposed EU Target for non-ETS emissions in 2020 is 37.9 Mtonnes of CO2e
Figure 7 shows emissions for the period 1990 to 2020 for each scenario and the ‘straight line’
path from 2005 to Ireland’s proposed 2020 targets.
Figure 7. Total non-ETS sector GHG Emissions for each scenario, compared to hypothetical pathway for
20% reduction target
18
Appendix
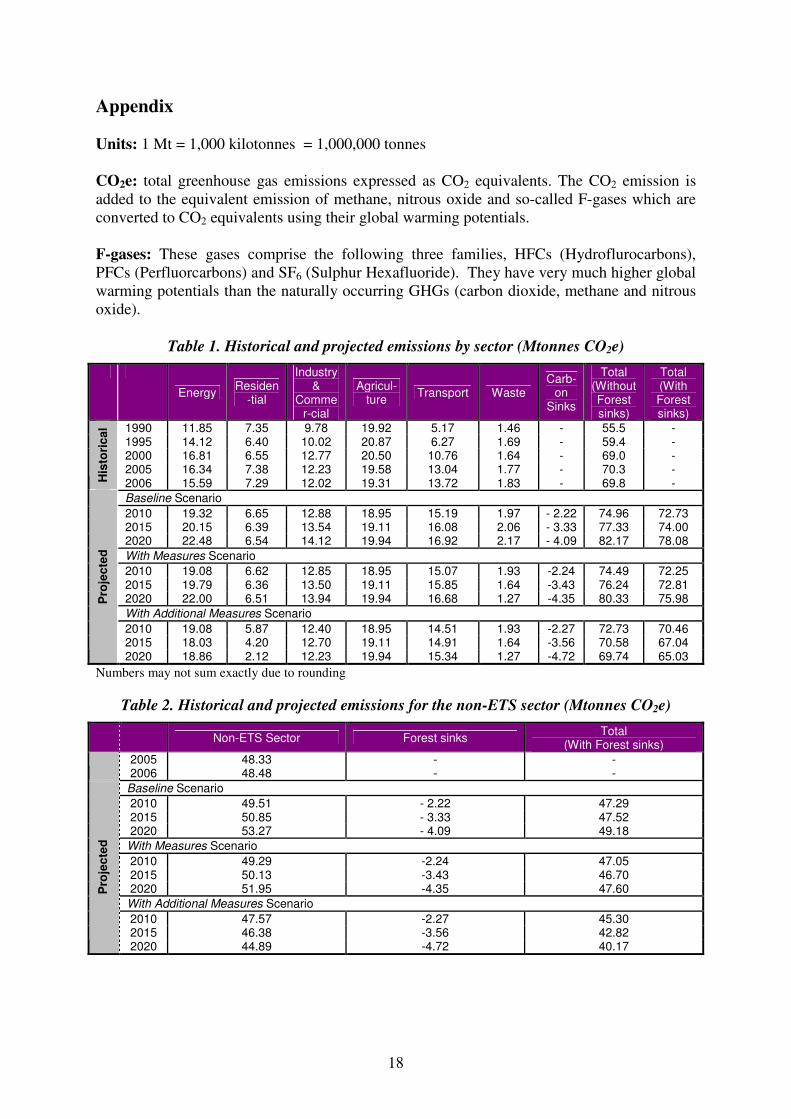
Units: 1 Mt = 1,000 kilotonnes = 1,000,000 tonnes
CO2e: total greenhouse gas emissions expressed as CO2 equivalents. The CO2 emission is
added to the equivalent emission of methane, nitrous oxide and so-called F-gases which are
converted to CO2 equivalents using their global warming potentials.
F-gases: These gases comprise the following three families, HFCs (Hydroflurocarbons),
PFCs (Perfluorcarbons) and SF6 (Sulphur Hexafluoride). They have very much higher global
warming potentials than the naturally occurring GHGs (carbon dioxide, methane and nitrous
oxide).
Table 1. Historical and projected emissions by sector (Mtonnes CO2e)
Energy Residen
-tial
Industry &
Commer-cial
Agricul-ture
Transport Waste Carb-
on Sinks
Total (Without Forest sinks)
Total (With Forest sinks)
1990 11.85 7.35 9.78 19.92 5.17 1.46 - 55.5 - 1995 14.12 6.40 10.02 20.87 6.27 1.69 - 59.4 - 2000 16.81 6.55 12.77 20.50 10.76 1.64 - 69.0 - 2005 16.34 7.38 12.23 19.58 13.04 1.77 - 70.3 -
His
tori
ca
l
2006 15.59 7.29 12.02 19.31 13.72 1.83 - 69.8 -
Baseline Scenario
2010 19.32 6.65 12.88 18.95 15.19 1.97 - 2.22 74.96 72.73 2015 20.15 6.39 13.54 19.11 16.08 2.06 - 3.33 77.33 74.00 2020 22.48 6.54 14.12 19.94 16.92 2.17 - 4.09 82.17 78.08
With Measures Scenario
2010 19.08 6.62 12.85 18.95 15.07 1.93 -2.24 74.49 72.25 2015 19.79 6.36 13.50 19.11 15.85 1.64 -3.43 76.24 72.81 2020 22.00 6.51 13.94 19.94 16.68 1.27 -4.35 80.33 75.98
With Additional Measures Scenario
2010 19.08 5.87 12.40 18.95 14.51 1.93 -2.27 72.73 70.46 2015 18.03 4.20 12.70 19.11 14.91 1.64 -3.56 70.58 67.04
Pro
jec
ted
2020 18.86 2.12 12.23 19.94 15.34 1.27 -4.72 69.74 65.03
Numbers may not sum exactly due to rounding
Table 2. Historical and projected emissions for the non-ETS sector (Mtonnes CO2e)
Non-ETS Sector Forest sinks Total
(With Forest sinks)
2005 48.33 - - 2006 48.48 - -
Baseline Scenario
2010 49.51 - 2.22 47.29 2015 50.85 - 3.33 47.52 2020 53.27 - 4.09 49.18
With Measures Scenario
2010 49.29 -2.24 47.05 2015 50.13 -3.43 46.70 2020 51.95 -4.35 47.60
With Additional Measures Scenario
2010 47.57 -2.27 45.30 2015 46.38 -3.56 42.82
Pro
jec
ted
2020 44.89 -4.72 40.17


