UNITED NATIONS EDUCATIONAL, SCIENTIFIC AND CULTURAL ORGANIZATION UNESCO INSTITUTE FOR INFORMATION TECHNOLOGIES IN EDUCATION MOSCOW 2002 BASIC ICT USAGE INDICATORS IN SECONDARY EDUCATION IN THE BALTIC AND CIS STATES Statistical Report
Transcript
UNITED NATIONS EDUCATIONAL, SCIENTIFIC AND CULTURAL ORGANIZATION
UNESCO INSTITUTE FOR INFORMATION TECHNOLOGIES IN EDUCATIONMOSCOW 2002
BASIC ICT USAGE INDICATORS
IN SECONDARY EDUCATION
IN THE BALTIC AND CIS STATES
Statistical Report
UNESCO INSTITUTE FOR INFORMATION TECHNOLOGIES IN EDUCATION
PROJECT COORDINATOR
B. Kotsik
WORKING GROUP
N. Listopad
K. Miniukovich
T. Shavrova
Basic ICT Usage Indicators in Secondary Education in the Baltic and CIS States
IITE, Moscow, 2002
This report presents results of a study carried out under the Indicators of ICT Usage in Education project.
For further information, please, contact:
UNESCO Institute for Information Technologies in Education
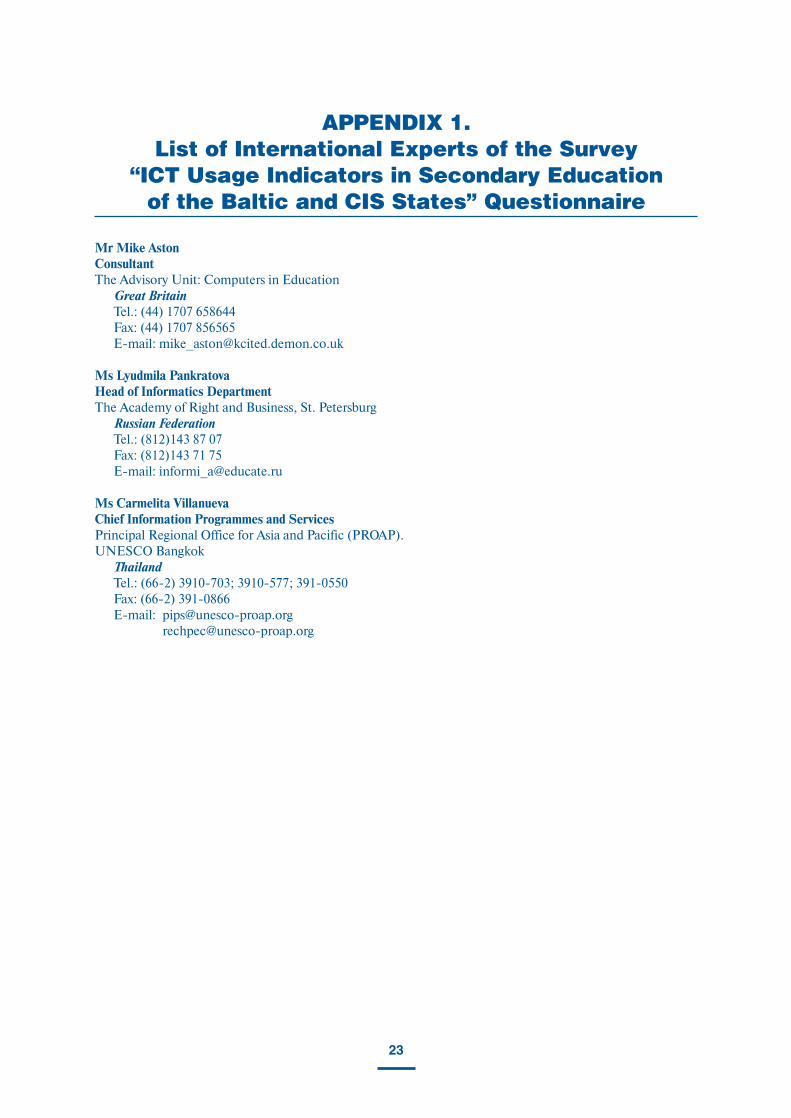
APPENDIX 1. List of International Experts of the Survey “ICT Usage Indicators inSecondary Education of the Baltic and CIS States” Questionnaire . . . . . . . . 23
APPENDIX 2. List of Education Ministries of the Countries Participating in the Project . . . 24
APPENDIX 3. List of Specialists for Survey Data Submission . . . . . . . . . . . . . . . . . . . . . . . . 26
APPENDIX 4. Recommendations of Working Meeting “ICT Usage Indicators in SecondaryEducation in the Baltic and CIS States”, IITE, Moscow, November 2001 . . . . 27
– acquisition, analysis and dissemination of the latest data and statistics on the educational status-quo in
the UNESCO Member States; attracting various data sources and conducting specialized investigations,
which contribute to regular data collection systems;
– circulation of scientific and research results, information on efficient policies, innovations and
advancements, securing access to such data.
Actual ICT usage in education and this field’s dynamics are so high that, in addition to the annual Eurostat
report, which presents major data on education in Europe, the independent Eurydice report on ICT usage in
education has also been in publication since 2000. These materials are used as reference data here.
Soon after its foundation in 1998, the UNESCO Institute for Information Technologies in Education (IITE)
has been dealing with this topic. The OrbIt 2000 report on information and communication technologies in
education in G-8 member countries was published in 1999-2000 with help from IITE. In March 2000, the
Institute organized and hosted an international expert meeting on ICT usage indicators in education. In 2001,
IITE conducted statistical study on information and communication technologies in secondary education in the
Baltic and CIS states. This work is the next in the series of IITE program activities on ICTs in Education: State-
of-the-Art, Needs and Perspectives and presents the intermediate results of the Institute’s efforts in this field.
This statistical report reveals the project’s results.
ABBREVIATIONS USED
IN THE REPORT
IT – information technologies
ICTs – information and communication technologies
EI – educational institutions
OS – operational system
5
AM Armenia
AZ Azerbaijan
BY Belarus
GE Georgia
KG Kyrgyzstan
KZ Kazakhstan
LT Lithuania
MD Republic of Moldova
RU Russian Federation
TJ Tajikistan
UA Ukraine
UZ Uzbekistan
D1The list of official documents on IT/ICTs in secondary education that are valid until 2002
D2The list of official documents on IT/ICTs in secondary education currently in use
PRIndicator characterizing a government curriculum’s availability for Informatics/Information Technologies
SIIndicator characterizing Informatics/Information Technologies as a separate subject
SSIndicator characterizing ICT usage in support of other subjects implied in the curricula of said subjects
S Total number of EI
S(C) Percentage of EI equipped with computer classrooms
International Abbreviations for Participating Countries
Basic Indicators. List of Symbols
Note: Microsoft Windows™, MS DOS™, IBM, Apple and Macintosh are registered trademarks.
6
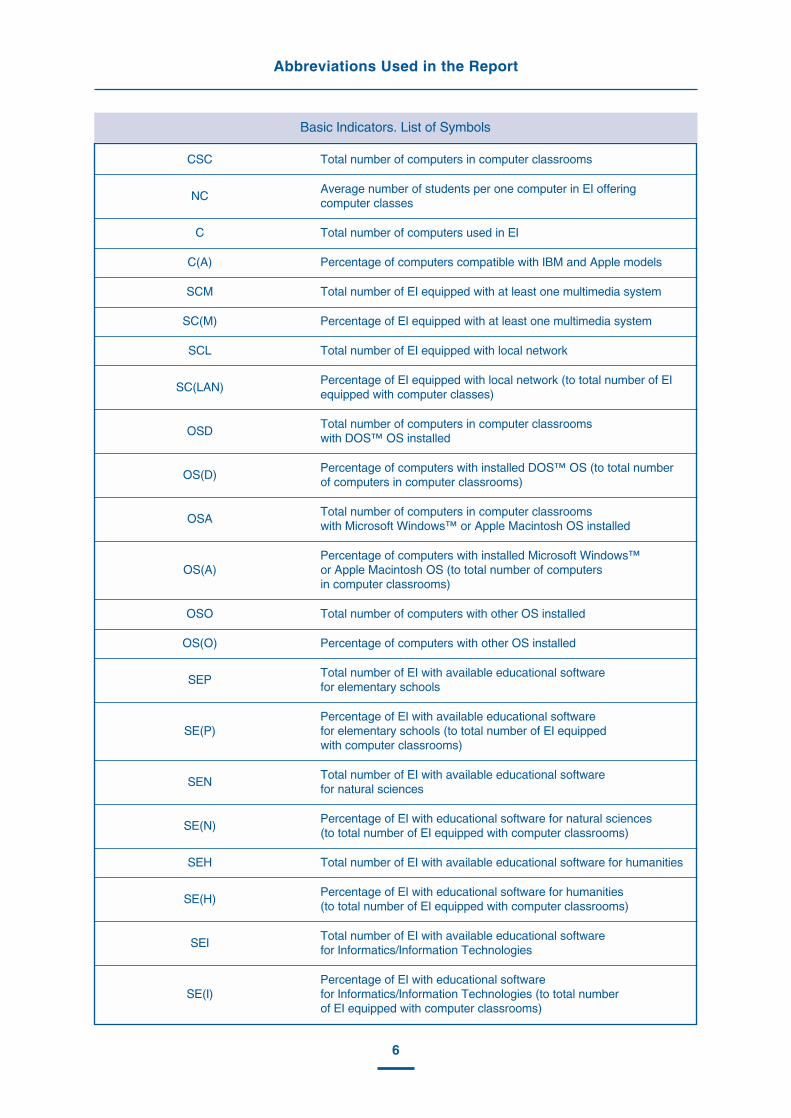
Abbreviations Used in the Report
CSC Total number of computers in computer classrooms
NCAverage number of students per one computer in EI offering computer classes
C Total number of computers used in EI
C(A) Percentage of computers compatible with IBM and Apple models
SCM Total number of EI equipped with at least one multimedia system
SC(M) Percentage of EI equipped with at least one multimedia system
SCL Total number of EI equipped with local network
SC(LAN)Percentage of EI equipped with local network (to total number of EI equipped with computer classes)
OSDTotal number of computers in computer classrooms with DOS™ OS installed
OS(D)Percentage of computers with installed DOS™ OS (to total number of computers in computer classrooms)
OSATotal number of computers in computer classrooms with Microsoft Windows™ or Apple Macintosh OS installed
OS(A)Percentage of computers with installed Microsoft Windows™ or Apple Macintosh OS (to total number of computers in computer classrooms)
OSO Total number of computers with other OS installed
OS(O) Percentage of computers with other OS installed
SEPTotal number of EI with available educational software for elementary schools
SE(P)Percentage of EI with available educational software for elementary schools (to total number of EI equipped with computer classrooms)
SENTotal number of EI with available educational software for natural sciences
SE(N)Percentage of EI with educational software for natural sciences (to total number of EI equipped with computer classrooms)
SEH Total number of EI with available educational software for humanities
SE(H)Percentage of EI with educational software for humanities (to total number of EI equipped with computer classrooms)
SEITotal number of EI with available educational software for Informatics/Information Technologies
SE(I)Percentage of EI with educational software for Informatics/Information Technologies (to total number of EI equipped with computer classrooms)
Basic Indicators. List of Symbols
7
Abbreviations Used in the Report
P; N; H; ITotal number of educational software programmes for elementary school, natural sciences, humanities, Informatics/Information Technologies, respectively
INP; INN; INH; INI
Total number of educational software programmes developed by domestic specialists for elementary school, natural sciences, humanities, Informatics/Information Technologies, respectively
EXP; EXN; EXH; EXI
Total number of educational software programmes developed by foreign specialists for elementary school, natural sciences, humanities, Informatics/Information Technologies, respectively
IN(P); IN(N); IN(H); IN(I)
Percentage of educational software programmes developed by foreign specialists for elementary school, natural sciences, humanities, Informatics/Information Technologies, respectively
IO Total number of EI without Internet access
I(O)Percentage of EI without Internet access (to total number of EI equipped with computer classrooms)
IL Total number of EI with e-mail only
I(L)Percentage of EI with e-mail only (to total number of EI equipped with computer classrooms)
IC Total number of EI with Internet access via dial-up channel
I(C)Percentage of EI with Internet access via dial-up channel (to total number of EI equipped with computer classrooms)
ID Total number of EI with Internet access via dedicated channel
I(D)Percentage of EI with Internet access via dedicated channel (to total number of EI equipped with computer classrooms)
IW Total number of EI with web pages on the Internet
I(W)Percentage of EI with web pages on the Internet (to total number of EI equipped with computer classrooms)
UP; US; UI; UDTotal number of teachers of elementary school subjects, other subjects, Informatics/Information Technologies, administration, respectively
Percentage of teachers of elementary school subjects, other subjects,Informatics/Information Technologies and administration who have taken a computer literacy course of up to 50 hours, respectively
Percentage of teachers of elementary school subjects, other subjects, Informatics/Information Technologies, administration who have taken computer literacy course of 50 to 100 hours, respectively
Percentage of teachers of elementary school subjects, other subjects, Informatics/Information Technologies, administration who have taken computer literacy course of over 100 hours, respectively
Basic Indicators. List of Symbols
U1(P); U1(S); U1(I); U1(D)
U2(P); U2(S); U2(I); U2(D)
U3(P); U3(S); U3(I); U3(D)
8
Abbreviations Used in the Report
Basic Indicators. List of Symbols
UPC; USC; UIC; UDCTotal number of teachers of elementary school subjects, other subjects, Informatics/Information Technologies, administration with elementary computer skills, respectively
Percentage of teachers of elementary school subjects, other subjects, Informatics/Information Technologies, administration with elementary computer skills, respectively
Percentage of teachers of elementary school subjects, other subjects, Informatics/Information Technologies, administration with ICT proficiency, respectively
L1(P); L1(S); L1(I); L1(D)
L2(P); L2(S); L2(I); L2(D)
PROJECT DESCRIPTION
The ICT Usage Indicators in Secondary Education of the Baltic and CIS States project’s goal is to study
basic factors, identify tendencies and trends revealing common problems and their solutions, elaborate on
relevant recommendations for shaping of a national ICT usage policy in education for the participating
countries.
In order to reach this goal, a questionnaire was developed and later reviewed by a group of international experts.
Almost all of the participating countries submitted comprehensive and informative answers to the questions on
the survey. Figure1 shows general information on the project’s geography and data flow.
Throughout the course of indicator data collection, contacts were established with leading specialists in school
ICT usage in the participating countries.
This report was prepared based on an analysis of the acquired data. The information reflecting indicators of
educational ICT usage is shown in tables and diagrams.
9
Fig 1. Participation in the ICT Usage Indicators in Secondary Education of the Baltic and CIS States Project
10
Study Organization
Statistics were collected and studied in two stages. During the first stage the questionnaire was compiled and
some changes were made based on the recommendations from international experts (Appendix 1) .
Education Ministers of the Baltic and CIS states appointed specialists (Appendix 2) responsible for submitting
of the project’s indicator data (Appendix 3) via official letters. Consequently, the data gained the status of official
information. The experts involved expressed their interest in the project and actively participated in the
collection and submission of material.
The questionnaire for the survey Indicators of ICT Usage in Secondary Education in the Baltic and CIS States was
faxed and e-mailed to addresses provided by the ministries.
Once all parties were familiar with the questionnaire and preliminary data, a working meeting Indicators of ICT
Usage in Secondary Education in the Baltic and CIS States was held on 23 November 2001, IITE, Moscow.
At said meeting, participants discussed specific features and details of submitted information on certain sections
of the questionnaire in addition to methods for unifying and simplifying data collection. Some of the
representatives from participating education ministries were actively involved, as were international experts (who
analyzed the questionnaire), data submission specialists and IITE hosts and project’s managers. The methods
used for the project’s data collection, extrapolation and analysis were discussed. Participants noted the
importance of the work in shaping national educational systems and expressed interest in continuing the project
(Appendix 4).
The second stage included applying the working meeting’s recommendations regarding the questionnaire while
data submission specialists collected and transferred information on educational ICT usage indicators from their
respective locations. The information was put into table form and illustrated with diagrams. Some
inconsistencies were revealed during work in the second stage. In some cases, specialists changed the initial data
three or four times. As a result, additional proposals for modifying the questionnaire’s content and
recommendations for its completion were drafted. These proposals were integrated with working materials to
produce results that will be used for future work.
Project Description
11
The Indicator System
The questionnaire was based on the indicators which best reflected the main factors determining the efficiency
ICT usage in education, as in similar studies and recommendations from the international IITE expert meeting
(Appendix 5) (see List of Symbols, pp. 5-8). They are as follows:
– Indicator Group 1. Official documents on ICT usage in education (D1, D2)
– Indicator Group 2. ICTs in EI curricula (PR, SI, SS)
– Indicator Group 3. Equipment (S(C), NC, C(A), SC(M), SC(LAN))
Refer to Appendix 6 for a detailed list of the data indicators, conventional symbols and calculation methods.
These indicator groups determined the content of the questionnaire’s main sections for the Survey Indicators of
ICT Usage in Secondary Education of the Baltic and CIS States (see Appendix 7).
In Section 1, Government Documents Regulating Educational ICT Usage, information on Indicator Group 1 is
given as is a description of the official documents on current and future application of ICT in education.
Section 2, ICTs in EI Curricula, contains data on Indicator Group 2, which shows current government curricula
that include Informatics/Information Technologies subjects. This section also includes data on teaching
informatics as a separate subject in elementary, basic and secondary schools as well as on ICT usage in other
subjects, as per the curricula.
Section 3, Computer Equipment at Educational Institutions, includes the figures for Indicator Group 3, which
covers equipment at schools equipped with computer classrooms, the average number of students per one
computer, computers compatible with IBM and Apple models, and equipment with multimedia systems and
local networks.
Section 4, Software, gives data on Indicator Group 4, which shows different types of operational systems and
educational software programmes installed at computer classrooms.
EI Access to Internet is denoted by Indicator Group 5 and is presented in Section 5 along with information on
the type of access to and speed and availability of the Internet at schools.
Section 6 gives information regarding Indicator Group 6, which deals with advanced training and improvement
of computer literacy skills among school personnel.
The questionnaire included both open and closed questions depending on the question and type of data. In order
to provide verification, expert estimates were differentiated.
Project Description
12
STUDY RESULTS
The Structure of Secondary Education in the Countries
Participating in the Project
To specify classes, student ages and stages of education, a comparative table was composed on the structures of
secondary education systems in the countries that participated in the project. Diagram 1 shows these materials.
Data included in the statistical report is based on grouping secondary education systems into elementary, basic
and secondary stages.
AM AZ BY GE KG KZ LT MD RU TJ TM UA UZ
■ Elementary ■ Basic › Secondary
18
17
16
15
14
13
12
11
10
9
8
7
6
Stu
dent
's a
ge (
year
s)
Diagram 1. Structure of general education system of participating countries
18
17
16
15
14
13
12
11
10
9
8
7
6
13
Study Results
Indicators of ICT Usage in Education
Indicator Group 1. Official ICT Usage in Education Documents Currently, ICT development is an integral part of educational policy. Consequently, all European governments
possess official documents (laws, decrees, recommendations, plans and programmes ) in this field. In most
European countries, these documents were issued beginning in 1990 and deal with at least mandatory
(elementary and secondary) education levels, in some cases, they cover pre-school through higher education.
Everywhere in Europe, special bodies are established to monitor the implementation of official
recommendations, practical activities and joint initiatives. The number of these bodies differs from country to
country, but the duties and responsibilities stipulated all include the following:
– determination of goals, solutions and programmes;
– selection of hardware and software;
– organization of teacher training;
– organization and development of training software;
– tracing and coordination of local and outside initiatives;
– sharing the responsibilities under agreements and solutions;
– collection of information and assessment of solutions and programme accomplishments.
The list of government documents regulating ICT usage in secondary education in the Baltic and CIS states that
are valid until 2002 and prospective programmes for development in and after 2002 covering indicators D1, D2
(see List of Symbols, pp. 4-7) can be found in Appendix 8. Note that this issue was thoroughly discussed in
Belarus, Kazakhstan, Russian Federation and Ukraine and less so in Azerbaijan, Lithuania and Republic of
Moldova.
Indicator Group 2. ICTs in EI CurriculaIn almost all European countries, ICTs have become a mandatory component of secondary education content
and many countries have incorporated ICTs into elementary school curricula. Education content is
approximately similar in all countries. In some areas educational goals are defined not by a list of applications
and tools to be studied, but by computer literacy skills and the qualifications acquired throughout the
educational process. Usually, secondary education goals of ICT studies include:
– the development of programming skills;
– the use of word processors, spreadsheets, and other applications;
– searching for information on a network, CD-ROM, etc.;
– network communication.
Some European curricula also include the history of technology, copyrights and the application of computer
skills in professional activities. In some schools, the role of ICTs in society and the problems of information
reliability are also examined.
Secondary school programming skills are not usually defined in the curricula, as programming is not among the
most popular goals of ICT studies in European countries. Nevertheless, in more than half of these countries,
programming is included in curricula for advanced secondary education. In some countries, programming is an
elective course.
In elementary schools, ICTs are used to provide either educational content or project activity.
In the majority of Europe’s secondary schools, ICTs are taught as a separate subject, although teachers often
consider it as a means to study other subjects and a tool for interdisciplinary projects. The number of obligatory
ICT lessons at the final phase is officially recommended at 10-60 hours per year in various countries. Moreover,
the duration of educational projects and the study of educational content must be added to those hours.
However, this factor is hard to measure in practice.
Official documents showing the analysis of the amount of time devoted to ICT study as a separate subject in
secondary school must also account for additional factors, such as the duration of secondary education in
different countries, the number of years devoted to ICT study, the number of lessons per year and the duration
14
Study Results
of each class. To simplify the analysis, the notion of a “conditional” academic year is introduced in complete
secondary education. In different countries, 20-40 academic hours per year are devoted to ICT study. Note that
in countries such as Germany and Lithuania, the secondary education is completed in 6 years.
All of the countries participating in this study possess a government curriculum on Informatics/Information
Technologies (indicators PR, SI, SS – see List of Symbols, pp. 5-8). Almost nowhere are ICTs expected to be
used as support for other subjects, with the exceptions of Uzbekistan and elementary education in the Russian
Federation. Figure 2 shows the situation concerning Informatics as a separate subject in basic education
curricula.
Fig. 2. Informatics in basic education curricula
■ Countries in which Informatics/Information Technologies is presented as a separate subject
in the basic education curriculum
■ Countries in which Informatics/Information Technologies is not presented as a separate
subject in the basic education curriculum
Indicator Group 3. HardwareThe majority EU elementary and secondary schools are equipped with computers. In certain cases, the
equipment is used to solve auxiliary, service and management problems. When determining the number of
students per one computer, only the computers that are used for educational purposes are considered. However,
in this case, it is unclear whether computers used by teachers for lesson preparation are also included. When
analyzing this indicator, the education level and communicational capabilities of equipment with Internet access
were considered.
In European countries, 2-30 students at elementary level have access to one computer, and 5-80 students have
access to one computer equipped with Internet connection capabilities.
In the secondary education, those figures are 1.5-16.4 and 2-40 students per computer, respectively.
15
Study Results
Data reflecting the quantity and quality of ICT equipment in educational institutions of the Baltic and CIS states
is shown by indicators S(C), NC, C(A), SC(M), SC(LAN) (see List of Symbols, pp. 5-8) and are calculated
Indicators in Secondary Education of the Baltic and
CIS States”, IITE, Moscow, November 2001
To recommend that:
1. Similar meetings be held in order to exchange experience and information. To recommend that IITE
organize these working meetings as well as talks on experience exchange and other activities.
2. Work on the data presentation model be continued. Automatic data collection and processing methods
should also be further developed and improved. Statistical reports should include not only averages but
should also reflect the worst and best cases based on answers provided in the questionnaire.
3. Information be summoned via three independent channels: official statistics, expert estimates and field
studies.
4. The project be translated into Russian and circulated throughout the Commonwealth of Independent States.
5. Systematic information collection activities be organized once every two years.
6. Analyzing the experiences of Armenia and Kyrgyzstan in order to form a basis for additional
recommendations to be included in the project.
7. Materials reflecting international experience in statistics collection on educational ICT usage be found,
processed and distributed among the project’s participating countries.
28
APPENDIX 5.
Recommendations of International Expert Meeting
“ICT Usage Indicators in Education”
IITE, Moscow, March 2001
Considering the evaluation of ICT application in education to be one of the most important parts of the work on
the project ICTs in Education: State-of-the-Art, Needs and Perspectives in the IITE activities, a study of existing
experience and special research should be made, analytical survey should be prepared and disseminated and a
system of ICT indicators be determined, standards and procedures of indicator measurement for different
educational systems should be included in the list of IITE activities for the near future.
Since educational systems of UNESCO Member States vary significantly, there exists a need in a module to be
developed for policy- and decision- makers as well as educational authorities on the Indicators of ICT usage in
Education, hence, IITE recommended to form an international working team for the module elaboration.
A policy paper on indicators of ICT usage in education based on the expert meeting recommendations should
be developed by IITE in collaboration with partners in the UNESCO Member States. IITE, at the request of
UNESCO Member States, should support the pilot projects on the application of ICT use indicators in national
action plans and policy documents.
The IITE information system network should include data acquisition, processing, analysis and dissemination
mechanism for the indicators of ICT usage in education. This mechanism should be made the part of the IITE
clearing-house activities.
29
AP
PE
ND
IX 6
Group Characteristics ¹ Indicator SymbolsDataType
Description Formula
Official documents onnational policies on ICTusage in secondary education
1.1 Official documents in IT/ICTs insecondary education valid till2002
D1 Text List of laws, decrees, etc. regulating ICT usage in education up until 2002 —
Offi
cial
Doc
umen
ts
1.2 Official documents in IT/ICTs insecondary education currentlyin force
D2 Text List of laws, decrees, etc. regulating ICT usage in education currently in effect
—
2.1 Available state curriculum onInformatics/InformationTechnologies
PR YES/NO
— —
2.2 Informatics/InformationTechnologies as a separatesubject
IT YES/NO
— —
2.3 ICT usage to support othersubjects implied in curricula
SS YES/NO
— —
Computer equipment in rural and urban educational institutions
3.1 Availability of computer classrooms in EI
S(C) % Ratio of the number of EIequipped with computer classrooms (SC) to the totalnumber of EI (S) times 100%
S(C) =SCS
100%
Har
dwar
e
Table of Indicators for the Survey ICT Usage Indicators in Secondary Education of the Baltic and CIS States
30
Ap
pe
nd
ix 6
Group Characteristics ¹ Indicator SymbolsDataType
Description Formula
Computer equipment in rural and urban educational institutions
3.2 The average number of studentsper one computer in EI offeringcomputer classes
NC number Ratio of the number of studentsin EI equipped with computerclassrooms (USC) to the numberof computers in these EI (CSC).
3.3 Percentage of computers compatible with IBM and Applemodels in total number of EIcomputers
C(A) % Ratio (times 100%) of computerscompatible with IBM and Applemodels (CA) to the total numberof computers in EI (C)
3.4 Percentage of EI equipped withone or more multimedia systemsin total number of EI equippedwith computer classrooms
SC(M) % Ratio (times 100%) of the number of EI with at least onemultimedia computer (SCM) tothe total number of EI equippedwith computer classrooms
3.5 Percentage of EI equipped withlocal networks to the total num-ber of EI equipped with computerclassrooms
SC(LAN) % Ratio (times 100%) of the number of EI equipped with localnetwork (SCL) to total number of EI equipped with computerclassrooms
Har
dwar
e
4.1 Percentage of computers withinstalled OS DOS™ to totalnumber of computers in com-puter classrooms
OS(D) % Ratio (times 100%) of the number of computers withinstalled OS DOS™ (OSD) tothe total number of computers in computer classrooms
Operational system
Sof
twar
epr
ogra
mm
es
NC = USCCSC
C(A) =CAC
100%
SC(M) =SCMSC
100%
SC(LAN) =SCLSC
100%
OS(D) =OSD
C100%
Table of Indicators for the Survey ICT Usage Indicators in Secondary Education of the Baltic and CIS States
31
Ap
pe
nd
ix 6
Group Characteristics ¹ Indicator SymbolsDataType
Description Formula
Operational system
4.2 Percentage of computers withinstalled OS Windows™ orApple Macintosh to total numberof computers in computer classrooms
OS(A) % Ratio (times 100%) of the number of computers withinstalled OS Windows™ orApple Macintosh (OSA) to totalnumber of computers in computer classrooms
4.3 Percentage of computers withother installed OS to the totalnumber of computers in computer classrooms
OS(O) % Ratio (times 100%) of the number of computers with otherinstalled OS (OSO) to totalnumber of computers in computer classroomsOS(D)+OS(A)+OS(O)=100%
5.1 Percentage of EIwith any installededucational software programmes forcorrespondingsubjects to totalnumber of EIequipped withcomputer classrooms
SE(P) % Ratio (times 100%) of the number of EI with any installededucational software programmesfor elementary school (SEP) tototal number of EI equipped withcomputer classrooms
Sof
twar
e pr
ogra
mm
es
Educational software programmes
Elementaryschool subjects
SE(N) % Ratio (times 100%) of the num-ber of EI with any installed edu-cational software programmesfor science subjects (SEN) tototal number of EI equipped withcomputer classrooms
Sciencesubjects
SE(H) % Ratio (times 100%) of the number of EI with any installededucational software programmes for humanities(SEH) to total number of EIequipped with computer classrooms
Humanities
OS(A) =OSA
C100%
OS(O) =OSO
C100%
SE(P) =SEPSC
100%
SE(N) =SENSC
100%
SE(H) =SEHSC
100%
Table of Indicators for the Survey ICT Usage Indicators in Secondary Education of the Baltic and CIS States
32
Ap
pe
nd
ix 6
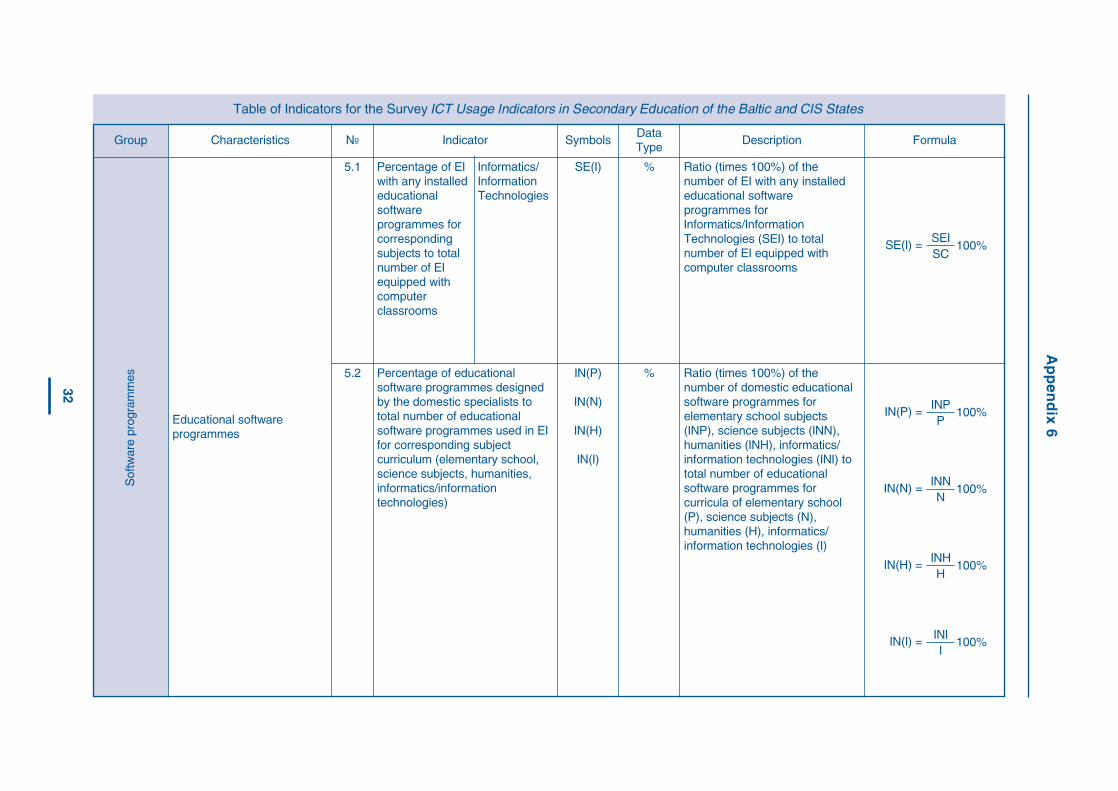
Group Characteristics ¹ Indicator SymbolsDataType
Description Formula
Educational software programmes
5.2 Percentage of educational software programmes designedby the domestic specialists tototal number of educational software programmes used in EIfor corresponding subject curriculum (elementary school,science subjects, humanities,informatics/information technologies)
IN(P)
IN(N)
IN(H)
IN(I)
% Ratio (times 100%) of the number of domestic educationalsoftware programmes for elementary school subjects(INP), science subjects (INN),humanities (INH), informatics/information technologies (INI) tototal number of educational software programmes for curricula of elementary school(P), science subjects (N),humanities (H), informatics/information technologies (I)
5.1 Percentage of EIwith any installededucational software programmes forcorrespondingsubjects to totalnumber of EIequipped withcomputer classrooms
SE(I) % Ratio (times 100%) of the number of EI with any installededucational software programmes forInformatics/InformationTechnologies (SEI) to total number of EI equipped withcomputer classrooms
Sof
twar
e pr
ogra
mm
es
Informatics/InformationTechnologies
SE(I) =SEISC
100%
IN(P) =INPP
100%
IN(H) =INHH
100%
IN(N) =INNN
100%
IN(I) =INII
100%
Table of Indicators for the Survey ICT Usage Indicators in Secondary Education of the Baltic and CIS States
33
Ap
pe
nd
ix 6
Group Characteristics ¹ Indicator SymbolsDataType
Description Formula
Educational software programmes
5.3 Percentage of educational software programmes designedby foreign specialists to totalnumber of educational softwareprogrammes used in EI forteaching the corresponding curriculum (elementary school,science subjects, humanities,informatics/ information technologies)
EX(P)
EX(N)
EX(H)
EX(I)
% Ratio (times 100%) of the number of educational softwareprogrammes designed by foreignspecialists for curricula in elementary school (EXP), science subjects (EXN), thehumanities (EXH), informatics/information technologies (EXI) tototal number of educational software programmesS
oftw
are
prog
ram
mes
Internet access
6.1 Percentage of EI without Internetaccess
I(O) % Ratio (times 100%) of the number of EI without Internetaccess (IO) to the number of EIequipped with computer classrooms
6.2 Percentage of EI with limitedInternet access – e-mail only
I(L) % Ratio (times 100%) of the number of EI with limited Internetaccess (IL) to the number of EIequipped with computer classrooms
6.3 Percentage of EI with Internetaccess via dial-up channel
I(C) % Ratio (times 100%) of the number of EI with dial-upInternet access (IC) to the number of EI equipped withcomputer classrooms
6.4 Percentage of EI with Internetaccess via dedicated line
I(D) % Ratio (times 100%) of the number of EI with Internetaccess via dedicated line (ID) tothe number of EI equipped withcomputer classrooms
Com
mun
icat
ions
EX(P) =EXP
P100%
EX(N) =EXN
N100%
EX(H) =EXH
H100%
EX(I) =EXI
I100%
I(O) =IOSC
100%
I(L) =IL
SC100%
I(C) =ICSC
100%
I(D) =IDSC
100%
Table of Indicators for the Survey ICT Usage Indicators in Secondary Education of the Baltic and CIS States
34
Ap
pe
nd
ix 6
Group Characteristics ¹ Indicator SymbolsDataType
Description Formula
Internet access
6.5 Percentage of EI with own web sites
I(W) % Ratio (times 100%) of the number of EI with own web sites(IW) to the number of EIequipped with computer classrooms
Com
mun
icat
ions
EI staff development in computer literacy
7.1
7.2
7.3
Percentage of elementary schoolteachers, subjectteachers (exceptteachers ofInformatics/InformationTechnologies),teachers ofInformatics and EIadministration whohave taken a computer literacycourse fromSeptember 1, 1999until present time
50 hours or less
(index 1)
50-100hours
(index 2)
over 100hours
(index 3)
U1(P)
U1(S)
U1(I)
U1(D)
U2(P)
U2(S)
U2(I)
U2(D)
U3(P)
U3(S)
U3(I)
U3(D)
% Ratio (times 100%) of the number of elementary schoolteachers, subject teachers(except teachers of Informaticsand/or InformationTechnologies), teachers ofInformatics and EI administrationwho have taken a computer literacy course of up to 50 hours(k=1); 50-100 hours (k=2); over100 hours (k=3) (UkP, UkS, UkI,UkD) to total number of teachersof corresponding profession/administration (UP, US, UI, UD)
Per
sonn
el
I(W) =IWSC
100%
Uk(P) =UkPUP
100%
Uk(S) =UkSUS
100%
Uk(I) =UkIUI
100%
Uk(D) =UkDUD
100%
k = 1, 2, 3
Table of Indicators for the Survey ICT Usage Indicators in Secondary Education of the Baltic and CIS States
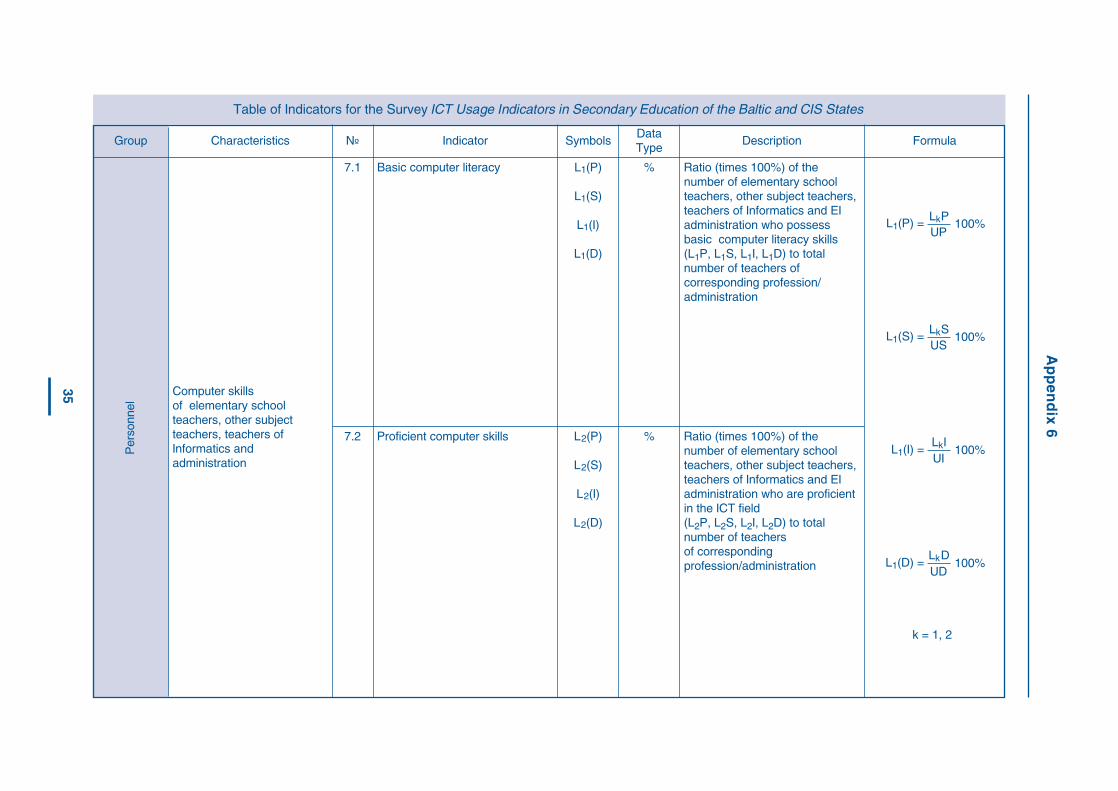
35
Ap
pe
nd
ix 6
Group Characteristics ¹ Indicator SymbolsDataType
Description Formula
7.1 Basic computer literacy L1(P)
L1(S)
L1(I)
L1(D)
% Ratio (times 100%) of the number of elementary schoolteachers, other subject teachers,teachers of Informatics and EIadministration who possessbasic computer literacy skills(L1P, L1S, L1I, L1D) to total number of teachers of corresponding profession/administration
Per
sonn
el
7.2 Proficient computer skills L2(P)
L2(S)
L2(I)
L2(D)
% Ratio (times 100%) of the number of elementary schoolteachers, other subject teachers,teachers of Informatics and EIadministration who are proficientin the ICT field (L2P, L2S, L2I, L2D) to total number of teachers of corresponding profession/administration
k = 1, 2
L1(P) = LkPUP
100%
L1(S) =LkSUS
100%
L1(I) =LkIUI
100%
L1(D) =LkDUD
100%
Computer skills of elementary school teachers, other subjectteachers, teachers ofInformatics and administration
Table of Indicators for the Survey ICT Usage Indicators in Secondary Education of the Baltic and CIS States
36
APPENDIX 7.
Questionnaire for the Survey “ICT Usage Indicators
in Secondary Education in the Baltic
and CIS States”
The structure of educational systems in the CIS is similar and includes three stages (see Table 1). In this
questionnaire, these stages are denoted as elementary education, basic education and secondary education.
State 1st stage (Elementary education)
2nd stage(Basic education)
3rd stage(Secondary education)
Student ages, years / education periods, years
Armenia 7-10 / 4 11-14 / 4 15-16 / 2
Azerbaijan 6-9 / 4 10-14 / 5 15-16 / 2
Belarus 6-9 / 4 10-14 / 5 15-16 / 2
Kazakhstan 7-10 / 4 11-15 / 5 16-17 / 2
Kyrgyzstan 7-10 / 4 11-15 / 5 16-17 / 2
Republic of Moldova 7-10 / 4 11-15 / 5 16-17 / 2
Russian Federation 7-9 / 3 10-14 / 5 15-16 / 2
Tajikistan 7-10 / 4 11-15 / 5 16-17 / 2
Turkmenistan 7-10 / 4 11-15 / 5 16-17 / 2
Ukraine 7-10 / 4 11-15 / 5 16-17 / 2
Uzbekistan 6-9 / 4 10-14 / 5 15-16 / 2
School systems include the following educational institutions: elementary school (elementary education), basic
school (elementary education, basic education), secondary school (elementary, basic and secondary education)
as well as new educational institutions, such as gymnasiums, college, lyceum, etc. Furthermore, all of these three
types of educational institutions will be abbreviated as EI in this questionnaire.
Country
Organization
Expert
Name:Tel.:Fax:Web site: http//
Name:Tel.:E-mail:
Table 1. Structure of Educational Systems
37
Appendix 7
1. Government Documents Regulating ICT Usage and Development in School Education
Government documents include state curricula, plans, official decrees, government resolutions, etc.
1.1 Government documents regulating ICT usage in education
1.2 Government documents regulating ICT usage in education effective beginning in 2002
Points 1.1 and 1.2 indicate the exact name of the document as well as how copies can be obtained (e.g., mailing
address, organization’s official web site with access to paper and electronic copies of the documents).
38
Appendix 7
2. ICTs in Curricula
A government curriculum is a curriculum approved by a country’s Education Ministry and mandatory for all EI
in that country.
2.1 Government curriculum available for Informaticsand/or Information Technologies
2.1.1 YES 2.1.2 NO
2.2 If “Yes” in point 2.1, please specify how a copy of the curriculum and the document(s) regulating the educational content in this subject (if it exists) can be obtained
State of EducationInformatics and/or Information
Technologies as a separate subject
ICT usage in support of other subjects as stipulated by curricula
for these subjects
2.3 Elementary education 2.3.1 YES 2.3.2 NO 2.3.3 YES 2.3.4 NO
2.4 Basic education 2.4.1 YES 2.4.2 NO 2.4.3 YES 2.4.4 NO
2.5 Secondary education 2.5.1 YES 2.5.2 NO 2.5.3 YES 2.5.4 NO
In points 2.1, 2.3, 2.4 and 2.5, select “Yes” or “No” and circle the answer.
39
Appendix 7
Percentage of EIequipped with
computer classrooms
Average numberof students percomputer in EIequipped with
computer classrooms
Percentage ofcomputers
compatible withIBM and Applemodels in thetotal number of computers
used in EI
Percentage of EIequipped withone or more multimedia
system* in thetotal number of EI
equipped withcomputer
classrooms
Percentage of EIequipped with
a local network**in the total
number of EIequipped with
computer classrooms
Total 3.1.1 3.1.2 3.1.3 3.1.4 3.1.5
Including ***urban EI
3.2.1 3.2.2 3.2.3 3.2.4 3.2.5
***rural EI 3.3.1 3.3.2 3.3.3 3.3.4 3.3.5
Points 3.2.1-3.2.5 indicate EI in urban areas and points 3.3.1-3.3.5 indicate EI in rural areas.
In point 3.1.1, the percentage is compared to the total number of EI; in point 3.2.1, the total number of urban EI;
in point 3.3.1, the total number of rural EI.
* Multimedia system equipment means soundcards, audio systems (speakers and/or headphones) and
CD-ROMs.
** Local network equipment means any network that connects all the computers in classrooms or
administrative workplaces (principal, deputy principal) that can be used in educational processes and
*** Urban EI are those located in areas with city status or city-type status, while rural indicates all other EI.
3. Computer Equipment at EI
40
Appendix 7
4. Software
Operation System
PC’s - DOS™ PC’s - Windows™or Apple Macintosh
Other OS TOTAL
%4.1 %4.2 %4.3 100%
In points 4.1-4.3, please note the percentage of OS types compared to the total number of computers used in EI.
Educational Software programmes
Percentage of EI with anyeducational software
programmes for teachingcorresponding subjects to
total number of EI equippedwith computer classrooms
Percentage of educationalsoftware programmesdeveloped by domesticspecialists to the totalnumber of educational
software programmes usedin EI for teaching the
corresponding set of subjects
Percentage of educationalsoftware programmesdeveloped by foreign specialists to the totalnumber of educational
software programmes usedin EI for teaching the
corresponding set of subjects
4.4 Elementary schoolsubjects
4.4.1 4.4.2 4.4.3
4.5 Science subjects 4.5.1 4.5.2 4.5.3
4.6 Humanities 4.6.1 4.6.2 4.6.3
4.7 Informatics and/or InformationTechnologies
4.7.1 4.7.2 4.7.3
41
Appendix 7
5. Communications – EI Internet Access
Percentage of EI with no access 5.1
Percentage of EI with e-mail only 5.2
Percentage of EI with access via dial-up connection 5.3
Percentage of EI with access via dedicated channel 5.4
Percentage of EI with own web sites 5.5
Points 5.1-5.5: please specify the percentage compared to the total number of schools equipped with computer
classrooms.
42
Appendix 7
6. EI Staff Development in Computer Literacy
6.1 Elementary school teachers 6.1.1 % 6.1.2 % 6.1.3 %
6.2 Teachers of other subject, not including Informatics and/or Information Technologies
6.2.1 % 6.2.2 % 6.2.3 %
6.3. Teachers of Informatics and/or Information Technologies
6.3.1 % 6.3.2 % 6.3.3 %
6.4 Administration 6.4.1 % 6.4.2 % 6.4.3 %
< 50 hours 50-100 hours >100 hours
Computer literacy courses taken from September 1999and after
A course in computer literacy implies a training course with topics such as OS basics, text and graphic editors,
spreadsheets, educational software, etc.
43
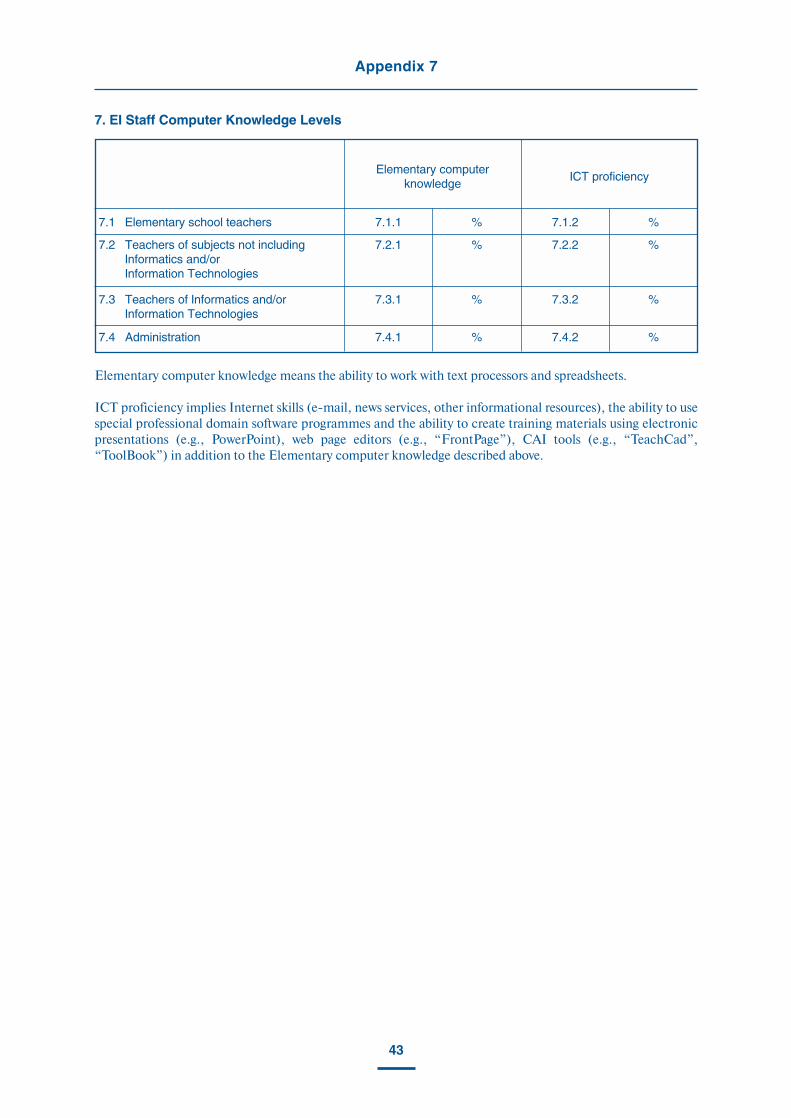
Appendix 7
7.1 Elementary school teachers 7.1.1 % 7.1.2 %
7.2 Teachers of subjects not includingInformatics and/or Information Technologies
7.2.1 % 7.2.2 %
7.3 Teachers of Informatics and/orInformation Technologies
7.3.1 % 7.3.2 %
7.4 Administration 7.4.1 % 7.4.2 %
Elementary computer knowledge
ICT proficiency
7. EI Staff Computer Knowledge Levels
Elementary computer knowledge means the ability to work with text processors and spreadsheets.
ICT proficiency implies Internet skills (e-mail, news services, other informational resources), the ability to use
special professional domain software programmes and the ability to create training materials using electronic
presentations (e.g., PowerPoint), web page editors (e.g., “FrontPage”), CAI tools (e.g., “TeachCad”,
“ToolBook”) in addition to the Elementary computer knowledge described above.
44
Appendix 7
8. Comments
In this section, you may comment on the data presented above and/or make notes and recommendations on the
content and form of the questionnaire. We will be happy to receive any questions, comments, suggestions or
ideas that you may have.
Respondent’s comments
45
Armenia The Law of the Republic of Armenia. “RA government education programme for 2001-2005,” Section 3 “Objectives and Actions,” item 4 “Integration in the International Education Society”
Azerbaijan Under development
Belarus The republican program “Informatisation of the Educational System”. The Education Ministry Board’s resolution titled “Basic Trends in Integrating Informatics in Educational Activities and Management in Secondary Schools of the Republic of Belarus”. A government program stipulating the creation of a computer network for education in the Republic of Belarus. Syllabi for the “Informatics” secondary school (8-11 grades)
Georgia Education Law adopted by the parliament and approved by the president of Georgia on 27 June 1997
Kyrgyzstan Curricula, syllabi, and a draft of government educational standards for Informatics. Curriculum approved by Kyrgyzstan’s Education Ministry
Kazakhstan Education Law ¹3904, adopted 7 June 1999. The Government Program of the President of the Republic of Kazakhstan “ICT Application in Secondary Education Systems” approved by Presidential order ¹3645 on 22 September 1997. The government standard of Informatics education (grades 7-11). Curriculum on Informatics (7-11 grades)
Lithuania Strategy for incorporating ICT in education
Republic of Moldova Curricula and syllabi
Russian Federation Education Ministry orders: ¹322 (9 February 1998), ¹56 (30 June 1999), ¹1788 (20 April 2001)
Tajikistan Development and incorporation of new IT into the educational system. “Computerization of information processes in education management”
Ukraine Law on the “Concept of National Information Integration Program” (4 February 1998). Law on the “National Informatization Programme” (4 February 1998). Amendments to Ukraine’s law on the “National Informatization Programme” (13 September 2001). Presidential order on “Activities to Develop National Components on the World Wide Web / Internet and to Provide Extensive Internet Access in Ukraine” (31 June 2000). Resolutions passed by the Supreme Rada of Ukraine titled: “Approval of Tasks stipulated by the National Information Integration Programme”
Uzbekistan Education Ministry Resolution ¹230 (2 May 2001). The Computer and Information Technologies Programme for 2001-2005, aiming to provide extensive access to the Internet
Valid through 2002
APPENDIX 8.
Government Documents Regulating ICT Usage
and Development in Education
46
Appendix 8
Armenia Official Government RA Educational Development Program
Azerbaijani Under development
Belarus The republican programme “Information Integration in the Education System” (effective until 2006). The government programme on computer networks for education systems in Belarus (2001-2005)
Georgia Presidential order ¹865 (4 August 2000): “Urgent Measures to Promote the Development of Information Integration in Georgia”
Kyrgyzstan KR Government resolution ¹697 titled: “Approval of the Information and Communication Technologies Development Program in the Kyrgyz Republic” (8 November 2001)
Kazakhstan The government program for secondary education in the Republic of Kazakhstan (2002-2004). The information integration program for elementary and secondary vocational institutions in the Republic of Kazakhstan. Approved by RK government resolution ¹616 on 10 May 2001
Lithuania Under development
Republic of Moldova The government’s draft resolution on incorporating ICT in education
Russian Federation Government resolutions ¹224 (23 March 2001) and ¹630 (28 August 2001). Education Ministry orders: ¹1788 (20 April 2001), ¹2093 (21 May 2001 (Appendix)), ¹834 (6 March 2001)
Tadjikistan A coordinative plan on complex education issues (2001-2010). Official statement ordering the analysis of ICT efficiency in education, approved by the Education Ministry and the Academy of Sciences
Ukraine Presidential Address to the Supreme Rada titled: “Ukraine in the 21st Century.Strategies for Economic and Social Development fin 2001-2004”. The Cabinet of Ministers resolution (6 May 2001) approving the information integration program for comprehensive secondary schools and the computerization of rural schools in 2001-2003
Uzbekistan Education Ministry order ¹237 (29 June 2001) to create the New Information Technologies Center
2002 and on
* For the exact titles of the laws and official documents mentioned above, please refer to the appropriate
sources.
47
APPENDIX 9.
Excerpt from the Curriculum on Advanced Training
for Teachers and Administration of Educational
Institutions in the Uzbekistan’s System
of Continued Education
Educational and Information Center of the National University of UzbekistanTopic: The Internet – 36 hours.
1. INTERNET BASICS
• What is the Internet?
• The number of Internet users. Estimates
• Internet structure
• Internet access
• Internet
• Internet access and services protocols
2. DISTRIBUTED NETWORKS
• Local networks as nodes of distributed access system
• Network topology
• Types of Ethernet connection
• Client-server architecture, servers and workstations
• Types of connection channels
• Equipment and software programmes for local network access to communication channels
3. IINTERNET BROWSERS
• Internet Explorer
• Windows-style graphic user interface
• Web browsing
• Web surfing
• Web pages printing
• Editing and saving of Web page excerpts
4. CONNECTING TO THE INTERNET
• What is an Internet provider? Selection criteria
• Provider services
• The Internet in Uzbekistan
• Internet providers and Internet companies in Uzbekistan
• What does one need to connect to the Internet?
5. INTERNET SEARCH
• Information search on the Web
• Catalogue servers and search engines
• Using catalogue servers
• Query languages and using search engines
• Characteristics of different search engines on the Web