76

◊
◊ ◊
◊
◊
◊
◊◊
◊
◊
◊
◊
◊
◊
◊
◊
◊
◊
◊
◊
◊
◊
◊
◊


WIMMERA REGIONAL SALINITYACTION PLAN 2005
AcknowledgmentsThis project has been funded by the National Action Plan forSalinity and Water Quality. This document was written byBrendan Madden of The Virtual Consulting Group and PhilDyson of Phil Dyson and Associates with input from WimmeraCatchment Management Authority (CMA). The WimmeraCMA Project Manager was Mr Bernie Dunn, Land andBiodiversity Program Manager. Wimmera CMA is grateful forthe assistance of the project steering committee in thedevelopment of the document. This group includedrepresentatives from:• Department of Primary Industries• Grampians Wimmera Mallee Water Authority• Wimmera CMA Board• Wimmera CMA Land Issues Functional Committee• Sinclair Knight MerzContact DetailsWimmera Catchment Management Authority26 Darlot St Horsham Victoria 3400 AustraliaPO Box 479 Horsham Victoria 3402 AustraliaTelephone +61 3 5382 1544 Facsimile +61 3 5382 6076Email [email protected] www.wcma.vic.gov.auISBN 0-9751259-0-7 DisclaimerThis document may be of assistance to you, but the responsibleorganisations and their employees do not guarantee that thepublication is without flaw of any kind or is wholly appropriatefor your particular purpose therefore disclaims all liability forany error, loss or other consequence which may arise fromyour relying on any information in this publication. Further,specific reference to funding levels in this plan is for indicativepurposes only. The level of Government investment in this planis contingent on budgets and Government priorities.© Wimmera Catchment Management Authority 2005
FOREWORD
In 2002 a steering group was formed to oversee thedevelopment of a Wimmera Regional Salinity Action Plan. Thisgroup consisted of representatives from Wimmera CMA, LandIssues Functional Committee, Department of PrimaryIndustries, Department of Sustainability and Environment andGrampians Wimmera Mallee Water Authority.The challenge in developing this salinity action plan for theWimmera was to bring together the learnings and knowledgegenerated through three existing plans, combine this with thelatest information and provide clear direction for investment insalinity management over the next five years.Wimmera CMA engaged a team of consultants in September2002 and they and the Project Steering Committee have sinceworked closely to develop this plan. The process has included:• A review of all relevant background documentation.• Field trip with the steering committee to examine existing
initiatives and explore groundwater flow systems (GFSs) andprocesses in the catchment.
• Develop profiles of each of the GFSs.• A series of workshops with key stakeholders and relevant
staff to examine issues relating to Implementation, Researchand Development and Monitoring.
• Prepare a draft plan for community consultation.• Present draft plan to and discussion with Wimmera CMA
Board and Land Issues Functional Committee.• A rapid appraisal of the draft plan by the DSE state-wide
salinity planning team.The draft plan was available for public comment andconsultation for a three-month period. There were seventargeted briefing and discussion sessions across the region aspart of the consultation process.The plan was reviewed in light of comments received by theProject Steering Committee.The plan was then forwarded to DSE and the State Minister forEnvironment.This plan will provide the framework to guide investment insalinity management in the Wimmera over the next five years. Icommend this plan to you and encourage you to get involvedin its implementation as we all have a role to play.
Barry HallWimmera CMA Board Member
P A G E 2
TABLE OF CONTENTS
PART ONE - SALINITY IN THE WIMMERA REGION1.1 INTRODUCTION1.1.1 Wimmera River Catchment1.1.2 Millicent Coast Basin1.1.3 Land Use1.1.4 Population1.2 SALINITY MANAGEMENT IN THE WIMMERA REGION1.2.1 Wimmera Regional Catchment Strategy1.2.2 Wimmera Catchment Salinity Management Plan1.2.2.1 Past Achievements1.2.2.2 Key Challenges for the Future1.2.3 Wimmera Catchment Irrigation Area Salinity Management Strategy1.2.3.1 Overview1.2.3.2 The Strategy1.2.3.3 Review Recommendations1.2.4 West Wimmera Salinity Management Plan - Draft1.2.5 Development of a Wimmera Region Salinity Action Plan1.3 SOCIAL ISSUES AND SALINITY MANAGEMENT1.3.1 Social Drivers and Natural Resource Management1.3.1.1 Issues/Values1.3.1.2 Knowledge1.3.1.3 Uptake of Programs and Current Recommended Practices1.3.2 Implications1.4 SALINITY THREATS TO THE WIMMERA REGION1.4.1 Agricultural Land1.4.1.1 Current Situation1.4.1.2 Future Projections1.4.2 Infrastructure1.4.2.1 Road, Rail and Transmission Lines1.4.3 Wimmera River1.4.3.1 Water Quality1.4.3.2 Salt Loads1.4.4 Wimmera Mallee Pipeline Project1.4.5 Flora and Fauna 1.4.6 Wetlands of the Region1.4.7 Ecological Vegetation Classes1.4.8 Impacts of Salinity Management Options upon Flora and Fauna 1.4.9 Impacts Outside the Wimmera Region1.5 THE FUTURE WITHOUT A PLAN1.5.1 Environmental Losses1.5.2 Lost Agricultural Production1.5.3 Infrastructure Losses
PART TWO - GROUNDWATER FLOW SYSTEMS IN THE WIMMERA REGION2.1 GROUNDWATER FLOW SYSTEMS2.1.1 Introduction2.1.2 Scales of GFS2.1.2.1 Salinity Management Triage2.1.3 Salinity Management Options2.2 REGIONAL FLOW SYSTEMS IN THE PARILLA SANDS2.2.1 Overview2.2.2 Salinity Processes2.2.3 Impacts Outside the Wimmera Region2.2.4 Asset Threats2.2.5 Management Options2.2.5.1 Biological 2.2.5.2 Engineering2.2.5.3 Living with Salinity

P A G E 3
2.2.6 Management Recommendations2.2.6.1 Implementation Opportunities2.2.6.2 Research and Development Recommendations2.2.7 Irrigation in the Wimmera2.2.7.1 Overview2.2.7.2 Irrigation Salinity Management2.2.7.3 Management Recommendations2.3 REGIONAL FLOW SYSTEMS IN LIMESTONE2.3.1 Overview2.3.2 Salinity Processes2.3.3 Asset Threats2.3.4 Management Options2.3.5 West Wimmera Bore Decommissioning2.3.6 Management Recommendations2.4 LOCAL FLOW SYSTEMS IN WOORINEN FORMATION2.4.1 Overview2.4.2 Salinity Process2.4.3 Asset Threats2.4.4 Management Options2.4.4.1 Biological 2.4.4.2 Engineering 2.4.4.3 Living With Salinity2.4.5 Management Recommendations2.4.5.1 Implementation Opportunities2.4.5.2 Research and Development Recommendations2.5 LOCAL FLOW SYSTEMS IN SAND DUNES (LOWAN FORMATION) 2.5.1 Overview2.5.2 Salinity Processes2.5.3 Asset Threats2.5.4 Management Options2.5.4.1 Biological 2.5.4.2 Engineering 2.5.4.3 Living With Salinity2.5.5 Management Recommendations2.5.5.1 Implementation Opportunities2.5.5.1.1 Northern Section2.5.5.1.2 Southern Section2.5.5.2 Research and Development Recommendations2.6 LOCAL FLOW SYSTEMS IN WEATHERED GRANITES (HIGH RELIEF) 2.6.1 Overview2.6.2 Salinity Processes2.6.3 Asset Threats2.6.4 Management Options2.6.4.1 Biological 2.6.4.2 Engineering2.6.4.3 Living With Salinity2.6.5 Management Recommendations2.6.5.1 Implementation Opportunities2.6.5.2 Research and Development Recommendations2.7 LOCAL FLOW SYSTEMS IN DEEPLY WEATHERED GRANITE (LOW RELIEF) 2.7.1 Overview2.7.2 Salinity Processes2.7.3 Asset Threats2.7.4 Management Options2.7.4.1 Biological 2.7.4.2 Engineering 2.7.4.3 Living with Salinity

P A G E 4
TABLE OF CONTENTS
2.7.5 Management Recommendations2.7.5.1 Implementation Opportunities2.7.5.2 Research and Development Recommendations2.8 LOCAL FLOW SYSTEMS IN HIGHLY FRACTURED ROCKS2.8.1 Overview2.8.2 Salinity Processes2.8.3 Asset Threats2.8.4 Management Options2.8.4.1 Biological 2.8.4.2 Engineering 2.8.4.3 Living With Salinity2.8.5 Management Recommendations2.8.5.1 Implementation Opportunities2.8.5.2 Research and Development Recommendations2.9 INTERMEDIATE GROUNDWATER FLOW SYSTEMS IN FRACTURED ROCKS2.9.1 Overview2.9.2 Salinity Processes2.9.3 Asset Threats2.9.4 Management Options2.9.4.1 Biological 2.9.4.2 Engineering2.9.4.3 Living With Salinity2.9.5 Management Recommendations2.9.5.1 Implementation Opportunities2.10 LOCAL AND INTERMEDIATE SYSTEMS IN DEEPLY WEATHERED FRACTURED ROCKS2.10.1 Overview2.10.2 Salinity Processes2.10.3 Asset Threats2.10.4 Management Options2.10.4.1 Biological 2.10.4.2 Engineering 2.10.4.3 Living With Salinity2.10.5 Management Recommendations2.10.5.1 Implementation Opportunities2.10.5.2 Research and Development Recommendations2.11 INTERMEDIATE FLOW SYSTEMS IN ALLUVIAL PLAINS2.11.1 Overview2.11.2 Salinity Processes2.11.3 Asset Threats2.11.4 Management Options2.11.4.1 Biological 2.11.4.2 Engineering 2.11.4.3 Living With Salinity2.11.5 Management Recommendations2.11.5.1 Research and Development Recommendations2.12 LOCAL FLOW SYSTEMS IN COLLUVIUM (GRAMPIANS SANDSTONE) 2.12.1 Overview2.12.2 Salinity Processes2.12.3 Asset Threats2.12.4 Management Options2.12.4.1 Biological 2.12.4.2 Engineering2.12.4.3 Living With Salinity2.12.5 Management Recommendations2.12.5.1 Research and Development Recommendations

P A G E 5
PART THREE:THE FIVE YEAR ACTION PLAN3.1 VISION3.1.1 Introduction3.1.2 Streams of the Wimmera River Basin3.1.3 Terminal Lakes3.1.4 Wetlands and Streams of the Millicent Coast Basin3.1.5 Agricultural Land3.1.6 Remnant Vegetation3.1.7 Groundwater3.2 INVESTMENT CLASSIFICATION OF GROUNDWATER FLOW SYSTEMS3.2.1 Investment Classification Framework3.2.1.1 Groundwater Flow System Characteristics3.2.1.2 Investment Classifications3.3 HOW IS IT ALL GOING TO HAPPEN? 3.3.1 Management Arrangements3.3.1.1 Current Arrangements3.3.1.2 Future Management Model3.3.2 Implementation Strategy3.3.2.1 Implementation Principals3.3.2.2 Proposed Implementation Initiatives and Resources3.3.3 Incentive Rates3.3.4 Additional Incentives Required for Salinity Management3.3.4.1 Perennial Plant Establishment3.3.5 Research and Development Needs3.3.5.1 GFS Knowledge Gaps and Research and Development Needs3.3.5.2 Priority Research and Development Needs3.3.5.3 Landcare Processes at Catchment/Groundwater Flow System Level3.3.5.3.1 Mount William Creek Catchment3.3.5.3.2 Local Flow Systems in Low Relief Granites (deeply weathered)3.3.5.3.3 Local Flow Systems in Deeply Weathered Fractured Sedimentary Rock3.3.5.3.4 Sub-regional Flow Systems in Upland Alluvium3.3.6 Catchment Salt and Water Balances3.3.7 Biological Manipulation of Water Balance of Catchments3.3.7.1 Lucerne and Other Introduced Perennial Plants3.3.7.2 Native Grasses3.3.7.3 Engineering Options to Protect Assets3.3.7.4 Productive Use3.3.8 Monitoring and Evaluation3.3.8.1 Monitoring Principals3.3.8.2 Evaluation Principals3.3.8.3 Bore Monitoring Network3.3.8.3.1 Lower Wimmera3.3.8.3.2 Upper Wimmera3.3.8.3.3 Millicent Coast Basin3.3.8.4 Monitoring Within Groundwater Flow Systems3.3.8.5 Surface Water Monitoring 3.3.8.5.1 Continuous Flow and Salinity Recorders3.3.8.5.2 Capacity to Inform Salinity Mitigation3.3.8.5.3 Millicent Coast3.4 SALINITY ACTION PLAN TARGETS3.4.1 Public Investment Requirements3.5 COST-BENEFIT ANALYSIS3.5.1 Quantifiable Costs3.5.2 Quantifiable Benefits3.5.3 Quantifiable Cost-Benefit Analysis

P A G E 6
TABLE OF CONTENTS
REFERENCESWimmera Salinity Research, Investigations and Monitoring BibliographyGlossary of Terms
FIGURES Figure 1 The Wimmera Catchment Management RegionFigure 2 The Wimmera RCS Structure and Linkages to State and Basin InitiativesFigure 3 Annual Salt Load and Distribution in the Wimmera CatchmentFigure 4 Groundwater Flow Systems of AustraliaFigure 5 Groundwater Flow System of the Murray Darling BasinFigure 6 Cross-section of the Regional Flow System in Parilla SandsFigure 7 Cross-section of the Regional Flow System in Parilla Sands in Edenhope AreaFigure 8 Windmill Trial of Groundwater Pumping of the Regional Flow System in Parilla SandsFigure 9 Cross-section of the Murray Group Limestone in West WimmeraFigure 10 Representation of Corroded and Successfully Decommissioned BoresFigure 11 Cross-section of a Local Flow System in the Woorinen FormationFigure 12 Cross-section of a Local Flow System in Sand Dunes (Lowan Formation)Figure 13 A Clay Borrow Pit Showing the Lowan Sand over the Weathered Surface of the ParillaFigure 14 A Local Saline Discharge Site in the Lowan Formation Groundwater Flow SystemFigure 15 Cross-section of a Local Flow System Weathered Granite (High Relief)Figure 16 A Solar Pump Installed in High Relief Granite Terrain at Langi GhiranFigure 17 Cross-section of a Local Flow System in Deeply Weathered Granite (Low Relief)Figure 18 Cross-section of a Local Flow System in Fractured RockFigure 19 Cross-section of an Intermediate Flow System in Fractured RocksFigure 20 Cross-section of a Local Flow System in Deeply Weathered Fractured RockFigure 21 Cross-section of an Intermediate Flow System in Alluvial PlainsFigure 22 Cross-section of a Local Flow System in Colluvium
TABLESTable 1 Land Use in the Wimmera RegionTable 2 Population of Local Government Area in the Wimmera RegionTable 3 Area of Land Affected by Salinity in the WimmeraTable 4 Infrastructure Affected by Salinity in the WimmeraTable 5 Current and Predicted Stream Salinity LevelsTable 6 Mass of Salt Generated/Imported in the Wimmera CatchmentTable 7 Destiny of Salt Loads in the Wimmera CatchmentTable 8 Expected Water Savings from the Northern Mallee and Wimmera Mallee PipelinesTable 9 Estimated Cost of Agricultural Production Lost as a Result of Salinity in the WimmeraTable 10 Annual Non-agricultural Costs of Dryland Salinity in the WimmeraTable 11 Snapshot of the Regional Flow System in Parilla SandsTable 12 Management Recommendations to Minimise the Impacts of Salinity on the Regional Flow System in Parilla SandsTable 13 Management Rec. to Minimise the Impacts of Salinity on the Regional Flow System in Parilla Sands in Edenhope AreaTable 14 Management Recommendations to 471 High-priority BoresTable 15 Rec. Management Options to Achieve a 50% Reduction in Recharge for the Woorinen Groundwater Flow SystemTable 16 Snapshot of the Local Flow Systems in Sand Dunes (Lowan Formation)Table 17 Management Recommendations to Achieve a 50% Reduction in Recharge for Local Flow Systems in Sand DunesTable 18 Snapshot of the Local Flow Systems in Weathered Granite (High Relief)Table 19 Management Recommendations for Local Flow Systems in Weathered Granite (High Relief)Table 20 Snapshot of the Local Flow Systems in Deeply Weathered Granites (Low Relief)Table 21 Management Recommendations for Local Flow Systems in Deeply Weathered Granites (Low Relief)Table 22 Snapshot of the Local Fractured Rock Groundwater Flow SystemsTable 23 Management Recommendations for Local Fractured Rock Groundwater Flow SystemTable 24 Snapshot of the Intermediate Fractured Rock Groundwater Flow SystemsTable 25 Management Recommendations for Intermediate Groundwater Flow System in Fractured RocksTable 26 Snapshot of the Local and Intermediate Flow Systems in Deeply Weathered Fractured RocksTable 27 Management Rec. for Local and Intermediate Groundwater Flow Systems in Deeply Weathered Fractured RocksTable 28 Snapshot of the Intermediate Groundwater Flow System in Alluvial PlainsTable 29 Management Recommendations for Intermediate Groundwater Flow System in Alluvial PlainsTable 30 Snapshot of the Local Flow Systems in Colluvium (Grampians Sandstone)

P A G E 7
Table 31 Management Recommendations for Local Flow Systems in Colluvium Groundwater Flow SystemsTable 32 Investment Classification of Wimmera Region Groundwater Flow SystemsTable 33 Assessment of the Characteristics and Priority Levels of Groundwater Flow Systems in the WimmeraTable 34 Indicative Technical Support Resources Required to Undertake Proposed Implementation ActivitiesTable 35 Indicative Five Year Grant/Works Budget Required to Undertake Proposed Implementation ActivitiesTable 36 Proposed Implementation Initiatives for each Groundwater Flow SystemTable 37 Regional Catchment Strategy Incentive Rates (July 2004)Table 38 Assessment of Groundwater Flow System Knowledge Gaps, R & D Needs and Potential Research PartnersTable 39 Region-wide Research and Development NeedsTable 40 Groundwater Monitoring - Wimmera RegionTable 41 Bore Location by Aquifer and Groundwater Flow System - Wimmera RegionTable 42 Extra Monitoring Infrastructure RequiredTable 43 NRM and Works Targets for the Implementation of the Wimmera Regional Salinity Action PlanTable 44 Indicative Annual Public Investment Required to Implement Proposed Five-year Program of ActivitiesTable 45 Quantifiable Benefits and Costs of Implementing the Wimmera Regional Salinity Action Plan
ABBREVIATIONSBOS Break Of SlopeBRS Bureau of Rural SciencesCMA Catchment Management AuthorityCOAG Council of Australian GovernmentsCRC Cooperative Research CentreCRC LEME Cooperative Research Centre for Landscape Environments and Mineral ExplorationCRC PBMDS Cooperative Research Centre for Plant-based Management of Dryland SalinityCSIRO Commonwealth Scientific and Industrial Research OrganisationDPI Department of Primary IndustriesDSE Department of Sustainability and EnvironmentEC Electrical ConductivityEMS Environmental Management SystemEVC Ecological Vegetation ClassGFS Groundwater Flow SystemGFSs Groundwater Flow SystemsGRDC Grains Research and Development Corporationha Hectarekm KilometreMDBC Murray Darling Basin CommissionML Megalitremm MillimetresNAP National Action Plan for Salinity and Water QualityNDSP National Dryland Salinity ProgramNLP National Landcare ProgramNHT Natural Heritage TrustNLWRA National Land and Water Resources AuditNRM Natural Resource Management% PercentR&D Research and DevelopmentRIRDC Rural Industries Research and Development CorporationSKM Sinclair Knight MerzWFP Whole Farm PlanmS/cm Milli Seimens per centimetrePMP Property Management Plan

P A G E 8
PART ONE: SALINITY IN THE WIMMERA REGION
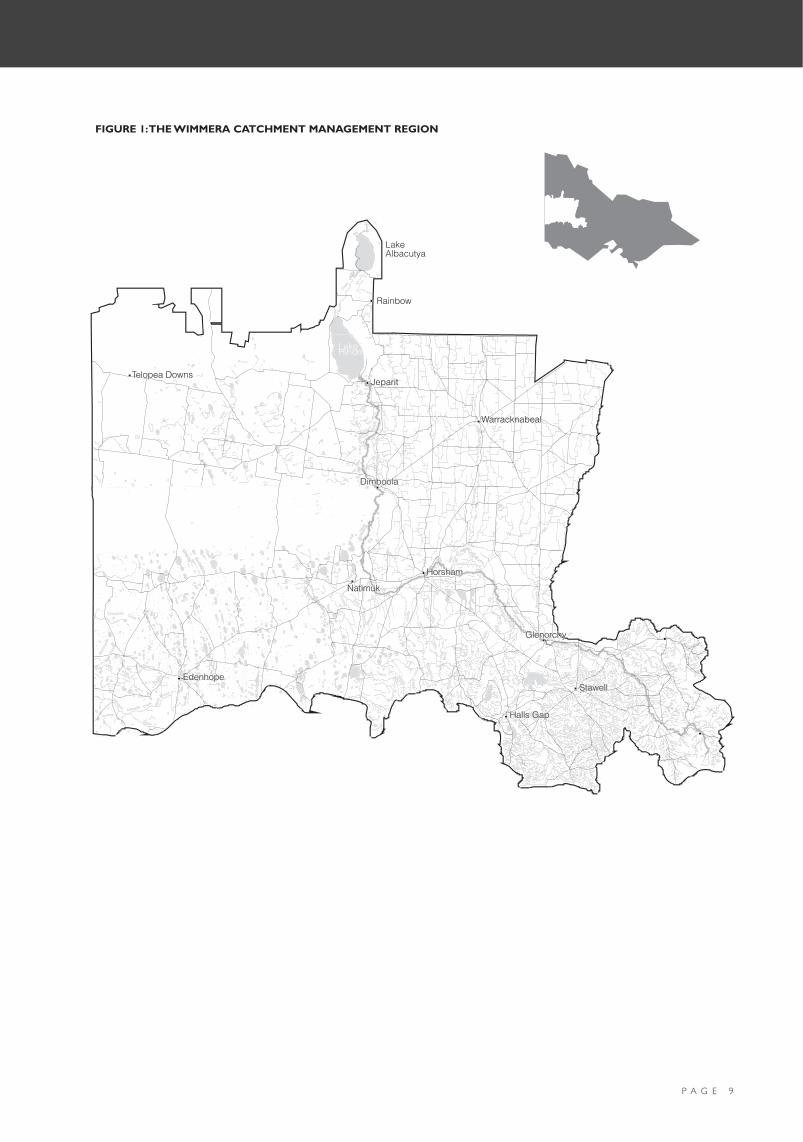
1.1 INTRODUCTIONThe Wimmera Region covers about 2,350,000 ha of centralwestern Victoria including the Wimmera River Catchment andpart of the Millicent Coast Basin adjacent to the SouthAustralian border (Figure 1).
1.1.1 WIMMERA RIVER CATCHMENTThe Wimmera River Catchment forms the south-west part ofthe Murray Darling Basin. It is a landlocked catchment with theWimmera River and tributaries draining from the MtCole/Pyrenees Ranges in the south east and the Grampians inthe south to the terminal lakes of Hindmarsh and Albacutyaand the Wyperfeld floodplains in the north.The Wimmera River is the largest inland waterway in Victoriaand the section downstream from Polkemmet Bridge is listedunder the Victorian Heritage Rivers Act 1992. The majority offlows in the Wimmera system are harvested for town andstock and domestic use.
1.1.2 MILLICENT COAST BASINThe Victorian portion of the Millicent Coast Basin comprises anarea of about 1.4 million hectares and contains over 3000wetlands, accounting for about 25% of Victoria’s individualwetlands. Wetland types include freshwater meadows, shallowand deep freshwater marshes, permanent open freshwaterwetlands and semi-permanent saline and permanent salinewetlands.
1.1.3 LAND USESince settlement in the 1850s, 85% of the region has beencleared for agricultural production, with only 1% of nativevegetation on private land and the remaining 14% nativevegetation in National, State or Regional Parks, State Forestsand public reserves.Agriculture is the main land use in the region withapproximately 2200 farms generating $560 million ofproduction during the 1996/97 season.1
TABLE 1: LAND USE IN THE WIMMERA REGION.2
Land Use % of RegionDryland Cropping 50Sheep Wool 26Sheep Meat 17Beef 4Other 3Total 100%
The region’s agriculture is dominated by broadacre land uses.Dryland cropping is the major agricultural enterprise in theregion, accounting for 50% of all agricultural land use, whiledryland pasture for sheep wool and meat production accountsfor a further 43%.A diverse range of activities including beef, viticulture, dairyingand horticulture accounts for a small proportion of land use inthe region.
1.1.4 POPULATIONThe region has a population of over 50,000 people. About70% of the population lives in urban centres of Horsham,Stawell, Nhill, Dimboola and Warracknabeal while the remaining30% reside on farms or in the smaller regional communities(TBA Planners 1998).
TABLE 2: POPULATION OF LOCAL GOVERNMENTAREA IN THE WIMMERA
Shire Population (2001)Hindmarsh 6,523Yarriambiack 8,262Northern Grampians 13,110West Wimmera 4,860Horsham Rural City 18,584Total 3 51,339
Note:The Wimmera CMA Region also includes parts of Ararat and Pyreneesmunicipalities
1.2 SALINITY MANAGEMENT IN THEWIMMERA REGION
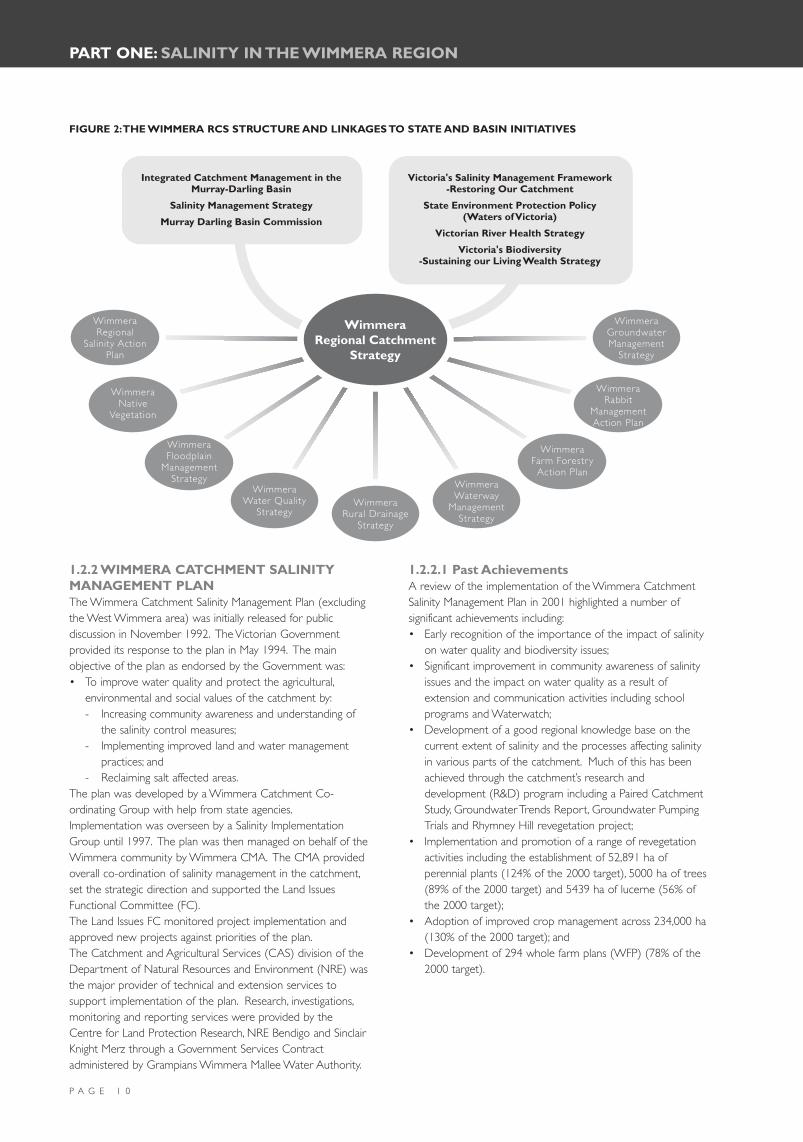
1.2.1 WIMMERA REGIONAL CATCHMENTSTRATEGYSalinity is addressed as part of the Wimmera RegionalCatchment Strategy (RCS); the overarching strategy for theregion that provides direction for natural resource management(NRM) in the Wimmera from 2003 until 2008.The RCS brings together the actions of various other planssuch as the Wimmera Regional Salinity Action Plan andprioritises them; forming a prospectus for investment from theVictorian and Commonwealth Governments to protect theWimmera’s assets. Figure 2 outlines the links between theWimmera RCS and local, regional, state and Murray DarlingBasin plans.The RCS also links the Wimmera Regional Salinity Action Planand provides framework to deal with issues that impairlandholder capacity to implement recommended actions suchas problem wildlife.Over the past 10 years there has been three separate plansdealing with salinity management in the Wimmera Region.• The Wimmera Catchment Salinity Management Plan
developed in 1992 and implemented from 1992 to 2002.• The Wimmera Catchment Irrigation Area Salinity
Management Strategy, 1995.• Draft West Wimmera Salinity Management Strategy
released in 2001.
1 ABS 1997
2 Developed from data collected from the “Understanding thesocial drivers of catchment management in the Wimmeraregion” study.3 Excluding the parts of the Ararat Rural City and PyreneesShire which are in the Wimmera region
Creek
Creek
Out
let
Out
let
Cre
ekC
reek
Cre
ekC
reek
Cre
ekC
reek
Cre
ekC
reek
Yarr
iam
biac
kYa
rria
mbi
ack
Dat
chak
Dat
chak
Yana
cYa
nac
RIV
ER
RIV
ER
WIM
ME
RA
WIM
ME
RA
Creek
Creek
EastEast
Dar
raga
n
Dar
raga
n
MountMount TalbotTalbot Station
Station
CkCk
Ck
Ck C
kC
kB
oggy
Bog
gy
Bur
ntB
urnt
River
River
Pot
ter
Pot
ter
Gol
ton
Gol
ton
WIM
MERA
WIM
MERA
William
William
Fyan
sFy
ans
Dun
mun
kle
Dun
mun
kle
Brim
Brim
(Old)
(Old)
(New
)(N
ew)
Mount
Mount
Sheepw
ash
Sheepw
ash
Branch
Branch
Nat
imuk
Nat
imuk
ThompsonThompson CreekCreek
Cre
ekC
reek
CreekCreek
CreekCreek
CreekCreek
Nor
thN
orth
BranchBranch
Creek
Creek
YallaYalla
Mosquito
Mosquito
MosquitoMosquito
Noo
rany
ook
Noo
rany
ook
Koijak
Koijak
Ck
Ck
Ck
Ck
Two
Two
Mile
Mile
Ck
Ck
CkCk
CkCk CkCk
CkCk
Ck
Ck
CkCk
CkCk
CkCk
Allanvale
Allanvale
Concongella
Concongella
SheepwashSheepwash
CkCk
NineNine
MileMile
SaltSalt
CkCk
BasinBasin
SugarloafSugarloaf
GeorgeGeorge
PentlandPentland
CkCk
CkCk
Creek
Creek
CreekCreek
Hyde
Hyde
Park
Park
Creek
Creek
PleasantPleasant
McCallsMcCalls
BarneysBarneys
Ck
Ck
Ck
Ck
CkCk
Ck
Ck
CkCk
Ck
Ck
Ck
Ck
RIVER
RIVER
Ck
Ck
Ck
CkS
undgeS
undge
Ck Ck
WattleWattle
GreensGreens
HeiferHeifer
StationStation
Salt
Salt
SixSixM
ileM
ile
Mile
Mile
Sev
enS
even
Buny
ip
Buny
ip
Ck
Ck
Ck
Ck
Norton
Norton
Bungalally
Bungalally
McKenzie
McKenzie
Creek
Creek
Cre
ekC
reek
Creek
Creek
Blackfellow
Blackfellow
Creek
Out
let
Cre
ek
Cre
ek
Cre
ek
Cre
ekYa
rria
mbi
ack
Dat
chak
Yana
c
RIV
ER
WIM
ME
RA
Creek
East
Dar
raga
n
Mount Talbot Station
Ck
Ck C
kB
oggy
Bur
nt
River
Pot
ter
Gol
ton
WIM
MERA
William
Fyan
s
Dun
mun
kle
Brim
(Old)
(New
)
Mount
Sheepw
ash
Branch
Nat
imuk
Thompson Creek
Cre
ek
Creek
Creek
Creek
Nor
th
Branch
Creek
YallaM
osquito
Mosquito
Noo
rany
ook
Koijak
Ck
Ck
Two
Mile
Ck
Ck
Ck Ck
Ck
Ck
Ck
Ck
Ck
Allanvale
Concongella
Sheepwash
Ck
Nine
Mile
Salt
Ck
Basin
Sugarloaf
George
Pentland
Ck
Ck
Creek
Creek
Hyde
Park
Creek
Pleasant
McCalls
Barneys
Ck
Ck
Ck
Ck
Ck
Ck
Ck
RIVER
Ck
CkS
undge
Ck
Wattle
Greens
Heifer
Station
Salt
SixM
ile
Mile
Sev
en
Buny
ip
Ck
Ck
Norton
Bungalally
McKenzie
Creek
Cre
ek
Creek
Blackfellow
RainbowRainbow
JeparitJeparit
HorshamHorsham
NatimukNatimuk
DimboolaDimboola
Telopea DownsTelopea Downs
WarracknabealWarracknabeal
EdenhopeEdenhope
GlenorchyGlenorchy
Halls GapHalls Gap
StawellStawell
Rainbow
Jeparit
Horsham
Natimuk
Dimboola
Telopea Downs
Warracknabeal
Edenhope
Glenorchy
Halls Gap
Stawell
LakeAlbacutya
LakeHindmarsh
P A G E 9
FIGURE 1:THE WIMMERA CATCHMENT MANAGEMENT REGION
WimmeraRegional Catchment
Strategy
WimmeraRural Drainage
Strategy
WimmeraWater Quality
Strategy
WimmeraFloodplain
ManagementStrategy
WimmeraNative
Vegetation
WimmeraRegional
Salinity ActionPlan
WimmeraWaterway
ManagementStrategy
WimmeraFarm Forestr y
Action Plan
WimmeraRabbit
ManagementAction Plan
WimmeraGroundwaterManagement
Strategy
Integrated Catchment Management in the Murray-Darling Basin
Salinity Management Strategy
Murray Darling Basin Commission
Victoria's Salinity Management Framework -Restoring Our Catchment
State Environment Protection Policy (Waters of Victoria)
Victorian River Health Strategy
Victoria's Biodiversity -Sustaining our Living Wealth Strategy
P A G E 1 0
PART ONE: SALINITY IN THE WIMMERA REGION
1.2.2 WIMMERA CATCHMENT SALINITYMANAGEMENT PLANThe Wimmera Catchment Salinity Management Plan (excludingthe West Wimmera area) was initially released for publicdiscussion in November 1992. The Victorian Governmentprovided its response to the plan in May 1994. The mainobjective of the plan as endorsed by the Government was:• To improve water quality and protect the agricultural,
environmental and social values of the catchment by:- Increasing community awareness and understanding of
the salinity control measures;- Implementing improved land and water management
practices; and- Reclaiming salt affected areas.
The plan was developed by a Wimmera Catchment Co-ordinating Group with help from state agencies.Implementation was overseen by a Salinity ImplementationGroup until 1997. The plan was then managed on behalf of theWimmera community by Wimmera CMA. The CMA providedoverall co-ordination of salinity management in the catchment,set the strategic direction and supported the Land IssuesFunctional Committee (FC).The Land Issues FC monitored project implementation andapproved new projects against priorities of the plan.The Catchment and Agricultural Services (CAS) division of theDepartment of Natural Resources and Environment (NRE) wasthe major provider of technical and extension services tosupport implementation of the plan. Research, investigations,monitoring and reporting services were provided by theCentre for Land Protection Research, NRE Bendigo and SinclairKnight Merz through a Government Services Contractadministered by Grampians Wimmera Mallee Water Authority.
1.2.2.1 Past AchievementsA review of the implementation of the Wimmera CatchmentSalinity Management Plan in 2001 highlighted a number ofsignificant achievements including:• Early recognition of the importance of the impact of salinity
on water quality and biodiversity issues;• Significant improvement in community awareness of salinity
issues and the impact on water quality as a result ofextension and communication activities including schoolprograms and Waterwatch;
• Development of a good regional knowledge base on thecurrent extent of salinity and the processes affecting salinityin various parts of the catchment. Much of this has beenachieved through the catchment’s research anddevelopment (R&D) program including a Paired CatchmentStudy, Groundwater Trends Report, Groundwater PumpingTrials and Rhymney Hill revegetation project;
• Implementation and promotion of a range of revegetationactivities including the establishment of 52,891 ha ofperennial plants (124% of the 2000 target), 5000 ha of trees(89% of the 2000 target) and 5439 ha of lucerne (56% ofthe 2000 target);
• Adoption of improved crop management across 234,000 ha(130% of the 2000 target); and
• Development of 294 whole farm plans (WFP) (78% of the2000 target).
FIGURE 2:THE WIMMERA RCS STRUCTURE AND LINKAGES TO STATE AND BASIN INITIATIVES

P A G E 1 1
1.2.2.2 Key Challenges for the FutureThe review also highlighted a number of challenges to beaddressed in developing a future salinity management plan forthe region.These include:a) Awareness
While community awareness of salinity has improveddramatically during implementation of the plan, thecommunity is not fully aware of the new knowledge of GFSsand the impact they have on major environmental,infrastructure and agricultural assets. Communicationactivities will need to focus on relating GFSs to their impacton assets.
b) Knowledge• There is limited confidence in estimates of the area of land
at risk to salinity in the future. Clarification of the potentialrisk using new digital elevation modelling techniques inconjunction with existing 1:25 000 discharge mapping andgroundwater trends is a priority.
• Understanding the hydrological and hydrogeologicalprocesses in the catchment has improved rapidly, however,further modelling is required to investigate groundwaterresponses to various management options. The suite ofmanagement options for various parts of the catchment willneed to be extended and refined on the basis of suchmodelling.
• Further investigations of groundwater pumping and otherengineering options will be necessary to allow for specificinterventions to protect some key assets.
• While there is good technical knowledge of many of theindividual management options, there is limitedunderstanding of how these options best fit within farmingsystems. Farm-systems research and modelling will berequired to develop solutions that are practical at a farmlevel.
• Current Wimmera farming systems based on annual cropsand pastures do not utilise available rainfall, especially largeepisodic recharge events.
c) AttitudeThe review highlighted that the lack of information availableon the drivers of community attitude limits the ability totailor implementation programs. To address this issue,Wimmera CMA commissioned Charles Sturt University in2001 to undertake a comprehensive social research projectto develop a better understanding of attitudes, perceptionsand the drivers for change.
d) Skills and Information• It is increasingly difficult to encourage farmers to participate
in WFP courses. Design of a new methodology, includinglinkages to quality assurance programs and other potentialincentives, and improved marketing will be required toimprove farmer participation in the future. A review of WFPin the region is currently underway and will provide futurerecommendations for the use of this particulartool/mechanism.
• Implementation of management options in the future willrequire skills in analysing farming systems and businessplanning to maximise economic outcomes.
• There is limited information available on the potential of
productive uses of saline resources in the catchment, whichis limiting the community’s capacity to adopt such options.
• There is limited understanding of the environmental andbiodiversity assets and the processes which are threateningthese assets.
• Without reliable quantification of the value of theenvironmental assets at risk it will continue to be difficult tojustify significant investment in salinity management. Areview of previous approaches to environmental valuationand development of a suitable approach for the WimmeraCatchment is required.
e) Resources• Where implementation of salinity management options
provides significant environmental services to thecommunity, payments should be made available to farmersto encourage adoption of such options. This will require aclear understanding of the services the community wants.
• Although the present system of monitoring is adequate inmany areas, it does not allow for adequate reporting of theextent of changes in salinity status over time. Nor does itattempt to target works and measure the impact of theseworks against natural resource indicator targets.
1.2.3 WIMMERA CATCHMENT IRRIGATIONAREA SALINITY MANAGEMENT STRATEGY
1.2.3.1 OverviewGrampians Wimmera Mallee Water Authority supplies irrigationwater to 250 irrigators who irrigate approximately 3000 ha ofland in three main districts:• Quantong - west of Horsham and north of the Wimmera
River• Riverside/Drung/Haven - south east of Horsham and south
of the Wimmera River• Murtoa/Coromby - around MurtoaThese areas are located over the regional Parilla GFS.
1.2.3.2 The StrategyThe objective of the Wimmera Irrigation Area SalinityManagement Strategy was to “provide directions for thesustainable use of land and water resources, and the protectionof the agricultural, environmental, and social values of theWimmera Irrigation Area”. It specifically aimed to:• Improve the understanding of the physical features and
processes occurring in the irrigation area and establishingbase information for future initiatives;
• Improve skills of land and water managers; and• Improve physical layout and operation of the irrigation
areas.

P A G E 1 2
PART ONE: SALINITY IN THE WIMMERA REGION
1.2.3.3 Review RecommendationsWhile the review of Wimmera Catchment Irrigation AreaSalinity Management Strategy noted significant achievements ofthe strategy it concluded that:It is unlikely that any major changes to the salinity status of theWimmera irrigation area, either positive or negative, are going tooccur without major changes in land use and irrigationmanagement.To help the change in land use and irrigation management, thereview recommended four main future directions:• Regional development - promote a Land Capability study,
encouraging transfer of water out of the Wimmera Rivertrench and, adopting high-value crops and new technology.
• Monitoring and Investigation - further monitoring andinvestigations under normal seasonal conditions andallocations to determine current land use, impact ongroundwater systems and groundwater levels.
• Drainage - encourage the use of re-use systems.• Ongoing help including revegetation works, channel seepage
works, salinity mapping and assistance to landholders.
1.2.4 WEST WIMMERA SALINITYMANAGEMENT PLAN - DRAFTIn June 2001 a draft West Wimmera Salinity ManagementStrategy was prepared under the guidance of a working groupcomprising landholder representatives from across the WestWimmera and agency representatives from that region.Three priority areas were identified within West Wimmera;Mosquito Creek Catchment, Edenhope district and TelopeaDowns district. The strategy identified nine programs to dealwith salinity issues and included research, monitoring,environmental, forestry, pastures, cropping, saline resources,water management and implementation.The draft strategy recognised the need to better understandsalinity processes and trends; for the community andlandholders to be fully informed about salinity; and the manyresource, social and economic challenges of dealing with salinityin a large, sparsely-populated area.
1.2.5 DEVELOPMENT OF A WIMMERAREGION SALINITY ACTION PLANIn 2002 a steering group was formed to oversee developmentof a Wimmera Region Salinity Action Plan. This group consistedof representatives from:• Wimmera CMA• Land Issues FC• DPI• DSE• Grampians Wimmera Mallee Water• Victorian Institute for Dryland AgricultureThe Project Steering Committee engaged a team of consultantsin September 2002 and have since worked closely with themto develop this plan.
The challenge was to bring together the learnings andknowledge generated through the three existing plans andcombine this with the latest information from relevant stateand federal initiatives to form a salinity action plan for theWimmera. The process has included:• A review of all relevant background documentation.• Field trip with the steering committee to examine existing
initiatives and explore GFSs and processes in the catchment.• Develop profiles of each GFS.• A series of workshops with key stakeholders and relevant
staff to examine issues relating to:- Implementation- R&D- Monitoring.
• Prepared a draft plan for community consultation including:- Presentation to and discussion with CMA Board and the
Land Issues FC- Presentation to and appraisal by DSE state-wide salinity
planning team- A series of seven targeted briefing and discussion
sessions across the region attended by about 150people
- Formal submissions/responses from key Landcare groupsand interested individuals.
The steering committee, with help from the consultants,collated and assessed feedback from the briefing submissions,formal submissions and DSE appraisal. The draft plan wasmodified and expanded accordingly to deal with the issuesraised during the public consultation phase.This plan represents the culmination of the process.
1.3 SOCIAL ISSUES AND SALINITYMANAGEMENT
1.3.1 SOCIAL DRIVERS AND NATURALRESOURCE MANAGEMENTDuring 2002 Charles Sturt University undertook a socialresearch study to gain a better understanding of the socialdrivers of catchment management in the Wimmera Region. Aswell as providing insights to the social drivers, the studyprovides a baseline of social indicators for the catchment. It isenvisaged that a repeat study will be undertaken in 2007 tomeasure changes in these indicators.The study report highlights many issues of relevance to salinitymanagement including:
1.3.1.1 Issues/Values• Four of the top five priority issues relate to social rather
than NRM aspects• Dryland Salinity was only rated as important by 15% of
respondents• Major NRM issues relate to reduced river and stream flows,
weeds and pest animals, and recreational impacts• Most landholders expressed a desire to hand on their
property in “better condition”

P A G E 1 3
1.3.1.2 Knowledge• Low awareness of the returns from farm forestry• Low knowledge of the extent of original native vegetation
cover• Low knowledge of the extent and management of dryland
salinity. However, landholders showed good awareness ofsalt-affected areas on their property
• Higher knowledge was significantly linked to the adoption ofcurrent recommended practices for conservation
1.3.1.3 Uptake of Programs and Current Recommended Practices • High adoption of:
- Pest plant and animal control works- Watering stock off stream- Conservation tillage- Planting trees and shrubs
• High concern about the effectiveness of many currentrecommended practices, particularly relating to habitatconservation, even among those that had trialed therecommended practice
• Low confidence in scientists’ knowledge of how to managedryland salinity
• Factors linked to adopting current recommended practicesinclude:- Landcare and Topcrop membership- Involvement in government-funded works- Involvement in property planning- Knowledge of current recommended practices and their
implementation- Landholder identified saline areas
• No linkage between profitability and uptake of currentrecommended practices
• Half the respondents would be interested in taking on extrarevegetation works under the increased cost sharingarrangements proposed ($1000 per ha plus an annualpayment)
1.3.2 IMPLICATIONSThere are many implications of the findings of the social driversstudy and the Project Steering Committee has consideredthese in developing the implementation phase of this actionplan. Throughout the implementation of this plan, these issueswill need to be continually addressed and given dueconsideration.
The key issues considered in developing this plan include:1. Salinity will struggle to gain attention as an issue in its own
right. The future focus of a salinity plan needs to link salinityto a broader regional socio-economic picture. As a result,all future salinity management initiatives will need to bedeveloped and implemented while considering theirinteraction with the socio-economic structure of the region.Some of these considerations will be:• What threat does salinity pose to the priority social
issues identified in the study?• What are the social opportunities from implementing
salinity management options, employment and newindustries?
• How can salinity management be linked more closelywith regional development?
2. In an NRM context the major concern in relation to salinitywill be its impact on river and stream flows and theassociated impact on recreational values.
3. The desire of landholders to leave their property in “bettercondition” provides a major opportunity. There is a need tobetter understand landholders’ definition of “bettercondition” and potentially influence this desire to includebroader off-site NRM impacts of land use.
4. Farm forestry and the potential returns need to be betterunderstood and promoted if commercial/semi-commercialrevegetation options are to be promoted effectively.
5. Landcare,Topcrop and government programs have a strongimpact on adoption of current recommended practices; canthese mechanisms of delivery be strengthened to appeal toa broader cross-section of landholders?
6. Property Planning is strongly linked to adopting currentrecommended practices; can property planning thereforeplay a role in promoting salinity management in the future?
7. There is a need to further increase knowledge of NRMissues and management options. Community education islikely to continue to provide a good return on investment
1.4 SALINITY THREATS TO THE WIMMERAREGION
The Wimmera RCS identified the following nine key groups ofassets in the Wimmera Region:1. Wetlands and streams of the Wimmera River Basin2. Terminal lakes of the Wimmera River Basin3. Wetlands and streams of the Millicent Coast Basin4. Groundwater5. Remnant Vegetation6. Agricultural Land7. Parks and Reserves8. State Forests9. Heritage SitesAssets one to six are considered to be at most risk from thethreat of salinity along with the region’s major utilityinfrastructure including road, rail transmission lines and urbanwater supplies.While biodiversity is not recognised as being at risk, implicit ineach of these asset groups are the biodiversity valuessupported within each of the assets.

P A G E 1 4
PART ONE: SALINITY IN THE WIMMERA REGION
1.4.1 AGRICULTURAL LAND
1.4.1.1 Current SituationNational Land and Water Resources Audit (NLWRA) dataindicates that 96,400 ha of the region currently has water tableswithin two metres of the surface and that even at lowerestimates, 56,000 ha of the region is at high risk of salinity.Current discharge maps for the region show almost 22,000 ha,or just over 1% of the region, as visibly affected to some degreeby salinity. This includes almost 6000 ha of severely impactedland.
1.4.1.2 Future ProjectionsAt the lower limit of trend estimate, NLWRA data indicates astabilisation of the area of land with watertables within twometres of the surface and possibly a slight fall by 2050. At theupper limit of trend values the area with high watertableswould increase to 160,000 ha, which represents 8% of theagricultural land in the catchment. More detail on the area ofland affected by salinity is in Table 3.
1.4.2 INFRASTRUCTURE
1.4.2.1 Road, Rail and Transmission LinesNLWRA data indicates that almost 650 km of roads in theregion are currently within areas with watertables at less thantwo metres. As shown in Table 4, under the low trendestimates the length of roads at risk will remain at similar levelsuntil 2020, however, at the high trend estimates more than 900km of roads will be at risk.
TABLE 4: INFRASTRUCTURE AFFECTED BY SALINITYIN THE WIMMERA
2020 EstimatesInfrastructure Item (km) 1998 lower upperRoad
Highway sealed 19.9 18.3 32.6Major road sealed 65.9 68.4 102.2Major road unsealed 153.8 157.9 220.3Other road sealed 101.4 102.0 152.6Other road unsealed 170.5 169.4 219.1Vehicular track 130.0 128.4 204.6
Railway 13.4 14.0 16.9Transmission Line 4.1 3.6 19.3Source: NLWRA 2001; Sinclair Knight Merz 2001
TABLE 3:AREA OF LAND AFFECTED BY SALINITY IN THE WIMMERA
Groundwater Flow System Area Affected by Salinity (ha)Low Moderate High Total
Intermediate flow systems in alluvial plains 2,951 1,281 263 4,495Intermediate flow systems in fractured rocks (sedimentary and metamorphic) 128 49 0 177Local and intermediate flow systems in deeply weathered fractured rocks 45 131 4 179(sedimentary and metamorphic)Local flow systems in colluvium (Grampians Sandstone) 6 0 0 6Local flow systems in deeply weathered granite (low relief) 25 10 0 35Local flow systems in highly fractured rocks (sedimentary and metamorphic) 5 0 0 15Local flow systems in sand dunes (Lowan Formation) 1,816 280 1,204 3,301Local flow systems in weathered granite (high relief) 8 0 0 8Regional flow systems in limestone overlain by local flow systems in 349 0 4 353Woorinen sedimentsRegional flow systems in Parilla Sands overlain by local flow systems in 6,109 807 2,508 9,423Woorinen sedimentsGroundwater Flow Systems - No Data 1,948 208 1,563 3,719Total 13,399 2,765 5,547 21,711Source: Generated from Wimmera CMA GIS data sets.
P A G E 1 5
1.4.3 WIMMERA RIVER
1.4.3.1 Water QualityThe quality of surface water in the Wimmera’s rivers andstreams is generally rated as fair to poor. Current flow-weighted average stream salinity levels range between 488 and680 mS/cm and are expected to marginally worsen as shown inTable 5.
TABLE 5: CURRENT AND PREDICTED STREAMSALINITY LEVELS
Gauging Station Salinity (mS/cm)2000 2020 2050
Wimmera R at Horsham 488 488 490Wimmera R at Lochiel 680 682 687Wimmera R upstream 680 684 691of Lake HindmarshSource: NLWRA 2001; Sinclair Knight Merz 2001
Flow-weighted salinity is a good indication of the averagesalinity per megalitre (ML) of flow. But in the context of waterquality, actual salinity levels can provide a better indication ofthe potential impacts on key assets such as flora, fauna andagricultural use. Mean daily salinities in Wimmera River in 2002(SKM 2003) ranged from 1425 electrical conductivity (EC) atHorsham to 16,189 at Tarranyurk. There are also deep pools inthe Wimmera River between Horsham and Lake Hindmarshthat contain water between 40,000 EC and 50,000 EC and aredevoid of oxygen.
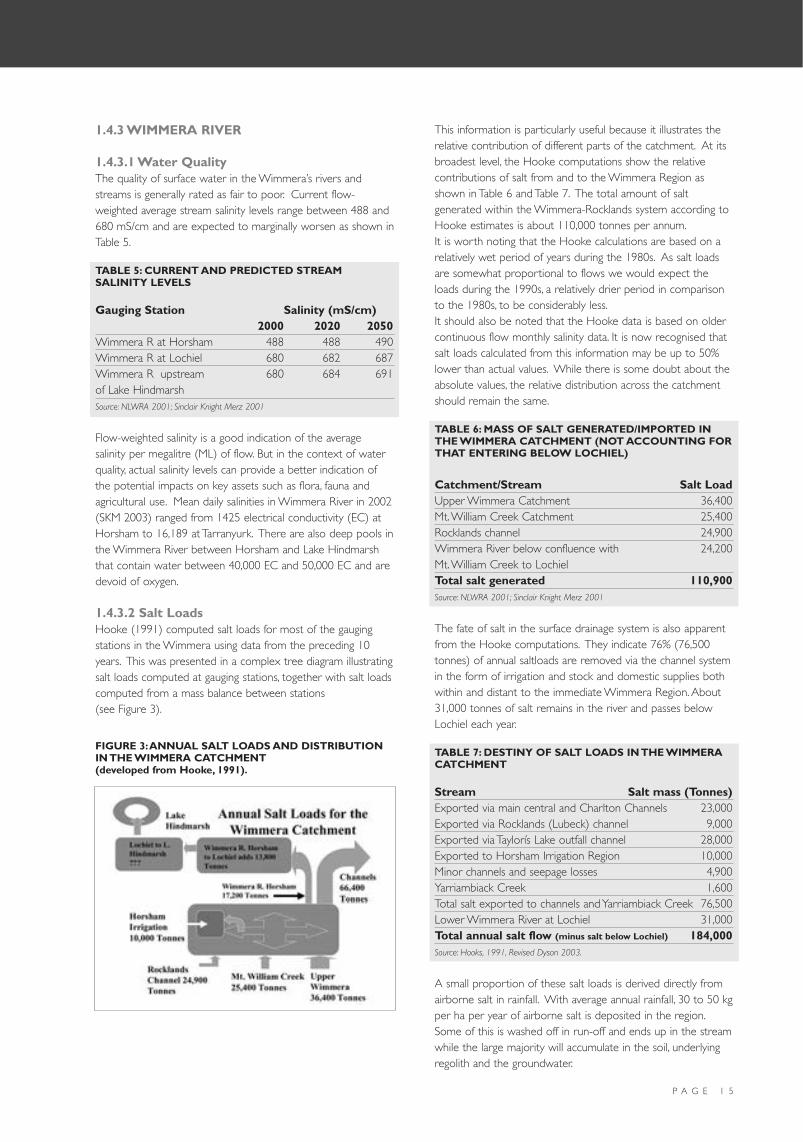
1.4.3.2 Salt LoadsHooke (1991) computed salt loads for most of the gaugingstations in the Wimmera using data from the preceding 10years. This was presented in a complex tree diagram illustratingsalt loads computed at gauging stations, together with salt loadscomputed from a mass balance between stations(see Figure 3).
This information is particularly useful because it illustrates therelative contribution of different parts of the catchment. At itsbroadest level, the Hooke computations show the relativecontributions of salt from and to the Wimmera Region asshown in Table 6 and Table 7. The total amount of saltgenerated within the Wimmera-Rocklands system according toHooke estimates is about 110,000 tonnes per annum.It is worth noting that the Hooke calculations are based on arelatively wet period of years during the 1980s. As salt loadsare somewhat proportional to flows we would expect theloads during the 1990s, a relatively drier period in comparisonto the 1980s, to be considerably less.It should also be noted that the Hooke data is based on oldercontinuous flow monthly salinity data. It is now recognised thatsalt loads calculated from this information may be up to 50%lower than actual values. While there is some doubt about theabsolute values, the relative distribution across the catchmentshould remain the same.
TABLE 6: MASS OF SALT GENERATED/IMPORTED INTHE WIMMERA CATCHMENT (NOT ACCOUNTING FORTHAT ENTERING BELOW LOCHIEL)
Catchment/Stream Salt LoadUpper Wimmera Catchment 36,400Mt.William Creek Catchment 25,400Rocklands channel 24,900Wimmera River below confluence with 24,200Mt.William Creek to LochielTotal salt generated 110,900Source: NLWRA 2001; Sinclair Knight Merz 2001
The fate of salt in the surface drainage system is also apparentfrom the Hooke computations. They indicate 76% (76,500tonnes) of annual saltloads are removed via the channel systemin the form of irrigation and stock and domestic supplies bothwithin and distant to the immediate Wimmera Region. About31,000 tonnes of salt remains in the river and passes belowLochiel each year.
TABLE 7: DESTINY OF SALT LOADS IN THE WIMMERACATCHMENT
Stream Salt mass (Tonnes)Exported via main central and Charlton Channels 23,000Exported via Rocklands (Lubeck) channel 9,000Exported via Taylorís Lake outfall channel 28,000Exported to Horsham Irrigation Region 10,000Minor channels and seepage losses 4,900Yarriambiack Creek 1,600Total salt exported to channels and Yarriambiack Creek 76,500Lower Wimmera River at Lochiel 31,000Total annual salt flow (minus salt below Lochiel) 184,000Source: Hooks, 1991, Revised Dyson 2003.
A small proportion of these salt loads is derived directly fromairborne salt in rainfall. With average annual rainfall, 30 to 50 kgper ha per year of airborne salt is deposited in the region.Some of this is washed off in run-off and ends up in the streamwhile the large majority will accumulate in the soil, underlyingregolith and the groundwater.
FIGURE 3:ANNUAL SALT LOADS AND DISTRIBUTIONIN THE WIMMERA CATCHMENT(developed from Hooke, 1991).

P A G E 1 6
PART ONE: SALINITY IN THE WIMMERA REGION
1.4.4 WIMMERA MALLEE PIPELINE PROJECTThe Wimmera Mallee Pipeline Project aims to pipe the existing,highly-inefficient channel system that supplies 120,000 ML ofwater to 5500 primary producers and 29,000 urban watercustomers in 36,000 towns across the region. At present,about 103,000 ML of that water is lost in delivering 17,000 MLfor end use.The project has four key aims:1. To save water currently lost through evaporation and
seepage.2. To use water saved through a piped system to maximise
community benefits.These benefits include social, economicand environmental.
3. To provide better quality water for intended uses.4. To provide a secure and reliable water supply.Successful implementation of the project will result in significantquantities of water becoming available for environmental flowsin the Wimmera River. The completion of both the NorthernMallee and Wimmera Mallee pipelines is expected to generatewater savings of 148,000 ML per annum (see Table 8).
TABLE 8: EXPECTED WATER SAVINGS FROM THENORTHERN MALLEE AND WIMMERA MALLEEPIPELINES
Environmental Other Total Flows Uses Savings
NMP 35,000 20,000 55,000WMP 83,000 10,000 93,000Total 118,000 30,000 148,000Source: Wimmera Mallee Pipeline Project - Interim Business Case
It is expected that 118,000 ML will be made available forenvironmental flows in the Glenelg and Wimmera catchments.With the implementation of the Wimmera Mallee PipelineProject, much of the salt currently exported through thechannel system will be retained within the WimmeraCatchment. This will have implications for the use ofenvironmental flows and ultimately the salt load reaching LakeHindmarsh.These environmental flows have the potential to significantlyimpact on water quality in the river. On one hand they havethe potential to dilute salt concentrations and potentiallyreduce the impact of groundwater intrusions from the regionalParilla system. However, the flows will bring with them extrasalt loads from the GFS in the upper catchments which arecurrently diverted into the channel system.Management of any future environmental flows also raisesmajor R&D questions in terms of the best combination of sizeof flows, timing of flows and the source of water for the flows.Implementation of the pipeline project will also reduce therecharge resulting from channel seepage/leakage. Currentestimates suggest that the current channel network contributesabout 5-6% of the total Wimmera catchment recharge.
1.4.5 FLORA AND FAUNANLWRA data estimates that 9% of the region’s threatened floraspecies and 11% of its threatened fauna species are in areaswith shallow watertables. Under current trends this is notexpected to change significantly by 2020.It is estimated that in the worst case scenario, 16 species offlora and 10 species of fauna could have more than 50% oftheir records in areas of shallow watertables by 2050. Thesespecies include the Eastern Curlew, Freckled Duck, FreshwaterCatfish, Golden Perch, Magpie Goose and UnspeckledHardyhead.
1.4.6 WETLANDS OF THE REGIONThe Millicent Coast Basin within the Wimmera Region containsover 3000 wetlands; about 25% of Victoria's wetlands.Thewetlands in this area are valued for their ecological significance,heritage, amenity, tourist and recreational value 7. Most arelocated in the south-western area and occur in chains that formthe natural surface water drainage system of the area, insteadof a more defined river system. These wetland chains generallystart near the Glenelg River catchment in the south and flownorth-west towards Little Desert National Park.These wetlands have significant environmental values andprovide key habitat for flora and fauna.Due to the location of wetlands in the landscape and therelatively flat landscape, the watertable does not need to risefar to put them at risk from salinity. Consequently they areoften the first environmental feature to be affected. Wetlandsmay be best referred to as “windows to the watertable”. Manywetlands in the Douglas Depression were naturally saline atpre-European settlement, but there are now many in theEdenhope area that have become more saline as a result ofchanged land management practices since European settlement.An example of an affected wetland is Brickies Swamp, south ofEdenhope.
1.4.7 ECOLOGICAL VEGETATION CLASSESEcological Vegetation Classes (EVC) is a system of classifyingplant communities.These communities usually consist of agroup of species that regularly occur together, and may bedefined on the basis of floristics, life-forms, reproductivestrategies, climate, landscape position, soil type and hydrology.An assessment is then made about the conservation status ofEVC to determine management priorities and activities.The extent of EVC for each conservation status in each GFS inthe Wimmera can be seen in Table 8B.
1.4.8 IMPACTS OF SALINITY MANAGEMENTOPTIONS UPON FLORA AND FAUNASome current salinity management options such as phalaris andtall wheat grass have the potential to be invasive to adjoiningland. Grant incentives are only to be used in accordance withthe Wimmera CMA incentive grant guidelines. Any new salinitycontrol biological option must be evaluated for its invasivenesspotential and appropriate action taken based on thatevaluation.
7 WCMA, 2003.Wimmera Regional Catchment Strategy.Wimmera Catchment Management Authority, Horsham.
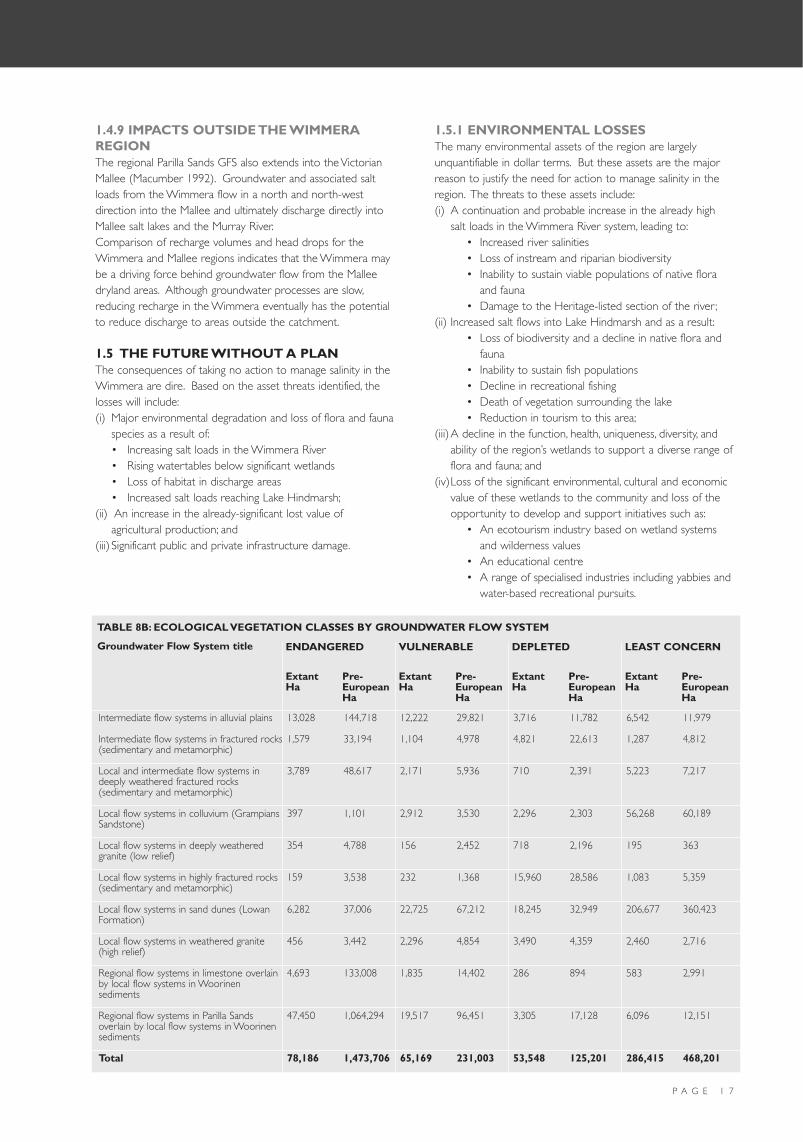
TABLE 8B: ECOLOGICAL VEGETATION CLASSES BY GROUNDWATER FLOW SYSTEM
Groundwater Flow System title
ExtantHa
Pre-EuropeanHa
ExtantHa
Pre-EuropeanHa
ExtantHa
Pre-EuropeanHa
ExtantHa
Pre-EuropeanHa
ENDANGERED VULNERABLE DEPLETED LEAST CONCERN
Intermediate flow systems in alluvial plains
Intermediate flow systems in fractured rocks(sedimentary and metamorphic)
Local and intermediate flow systems indeeply weathered fractured rocks(sedimentary and metamorphic)
Local flow systems in colluvium (GrampiansSandstone)
Local flow systems in deeply weatheredgranite (low relief)
Local flow systems in highly fractured rocks(sedimentary and metamorphic)
Local flow systems in sand dunes (LowanFormation)
Local flow systems in weathered granite(high relief)
Regional flow systems in limestone overlainby local flow systems in Woorinensediments
Regional flow systems in Parilla Sandsoverlain by local flow systems in Woorinensediments
Total
13,028
1,579
3,789
397
354
159
6,282
456
4,693
47,450
78,186
144,718
33,194
48,617
1,101
4,788
3,538
37,006
3,442
133,008
1,064,294
1,473,706
12,222
1,104
2,171
2,912
156
232
22,725
2,296
1,835
19,517
65,169
29,821
4,978
5,936
3,530
2,452
1,368
67,212
4,854
14,402
96,451
231,003
3,716
4,821
710
2,296
718
15,960
18,245
3,490
286
3,305
53,548
11,782
22,613
2,391
2,303
2,196
28,586
32,949
4,359
894
17,128
125,201
6,542
1,287
5,223
56,268
195
1,083
206,677
2,460
583
6,096
286,415
11,979
4,812
7,217
60,189
363
5,359
360,423
2,716
2,991
12,151
468,201
P A G E 1 7
1.4.9 IMPACTS OUTSIDE THE WIMMERAREGIONThe regional Parilla Sands GFS also extends into the VictorianMallee (Macumber 1992). Groundwater and associated saltloads from the Wimmera flow in a north and north-westdirection into the Mallee and ultimately discharge directly intoMallee salt lakes and the Murray River.Comparison of recharge volumes and head drops for theWimmera and Mallee regions indicates that the Wimmera maybe a driving force behind groundwater flow from the Malleedryland areas. Although groundwater processes are slow,reducing recharge in the Wimmera eventually has the potentialto reduce discharge to areas outside the catchment.
1.5 THE FUTURE WITHOUT A PLANThe consequences of taking no action to manage salinity in theWimmera are dire. Based on the asset threats identified, thelosses will include:(i) Major environmental degradation and loss of flora and fauna
species as a result of:• Increasing salt loads in the Wimmera River• Rising watertables below significant wetlands• Loss of habitat in discharge areas• Increased salt loads reaching Lake Hindmarsh;
(ii) An increase in the already-significant lost value ofagricultural production; and
(iii) Significant public and private infrastructure damage.
1.5.1 ENVIRONMENTAL LOSSESThe many environmental assets of the region are largelyunquantifiable in dollar terms. But these assets are the majorreason to justify the need for action to manage salinity in theregion. The threats to these assets include:(i) A continuation and probable increase in the already high
salt loads in the Wimmera River system, leading to:• Increased river salinities• Loss of instream and riparian biodiversity• Inability to sustain viable populations of native flora
and fauna• Damage to the Heritage-listed section of the river;
(ii) Increased salt flows into Lake Hindmarsh and as a result:• Loss of biodiversity and a decline in native flora and
fauna• Inability to sustain fish populations• Decline in recreational fishing• Death of vegetation surrounding the lake• Reduction in tourism to this area;
(iii)A decline in the function, health, uniqueness, diversity, andability of the region’s wetlands to support a diverse range offlora and fauna; and
(iv)Loss of the significant environmental, cultural and economicvalue of these wetlands to the community and loss of theopportunity to develop and support initiatives such as:
• An ecotourism industry based on wetland systems and wilderness values
• An educational centre• A range of specialised industries including yabbies and
water-based recreational pursuits.
P A G E 1 8
PART ONE: SALINITY IN THE WIMMERA REGION
1.5.2 LOST AGRICULTURAL PRODUCTIONThe current cost of lost agricultural production is estimated tobe $2.3 million per annum, calculated as the basis of grossmargin forgone. This is an average of $94 lost per ha of salt-affected land. With a conservative estimate of a steady 1% perannum rise in the area of salt-affected land in the region, thiscost would increase to $2.8 million by 2020 (see Table 9).These losses represent less than 0.5% of the current grossvalue of agricultural production from the region.
1.5.3 INFRASTRUCTURE LOSSESThe Murray Darling Basin Commission and the NationalDryland Salinity Program funded a three-year research projectentitled “Determining the full costs of dryland salinity across theMurray Darling Basin” (Wilson 2002). Results of this research issummarised in Table 10.This project looked at the costs and impacts on:• Local Government - increased repair and maintenance,
water treatment, construction costs, preventative works andshortened lifespan of infrastructure;
• Households and businesses - costs of saline water suppliesand high saline watertable damage to buildings; and
• State Government and Utilities - increased repair andmaintenance, water treatment, construction costs,preventative works and shortened lifespan of infrastructure,education, research and extension.
TABLE 10:ANNUAL NON-AGRICULTURAL COSTS OFDRYLAND SALINITY IN THE WIMMERA
Non-agricultural costs Costs Sub-totalsHouseholds and BusinessesSaline town water supply 4,663,924High saline watertable damage 2,676,710Total 7,340,634Local GovernmentRepairs and Maintenance 1,032,772Construction 59,414Reduced Lifespan 2,345,858Preventative Works 0Total 3,438,044State Government and UtilitiesRepairs and Maintenance 4,744,755Reduced Lifespan 1,892,257Other 642,990Total 7,280,002
Total Infrastructure Costs 18,058,680Source:Wilson 2002
TABLE 9: ESTIMATED COST OF AGRICULTURAL PRODUCTION LOST AS A RESULT OF SALINITY IN THE WIMMERA
Severity of SalinityLow Moderate High Total
Current Area Salinity (ha) 7,012 3,903 5,841 24,669% of Gross Margin Lost 50% 75% 100%Current Gross Margin Loss ($) 443,416 430,829 875,475 2,341,7682020 Area @ 1% p.a. increase (ha) 8,387 4,669 6,987 29,5082020 Gross Margin Loss ($) 530,391 515,336 1,047,197 2,801,099
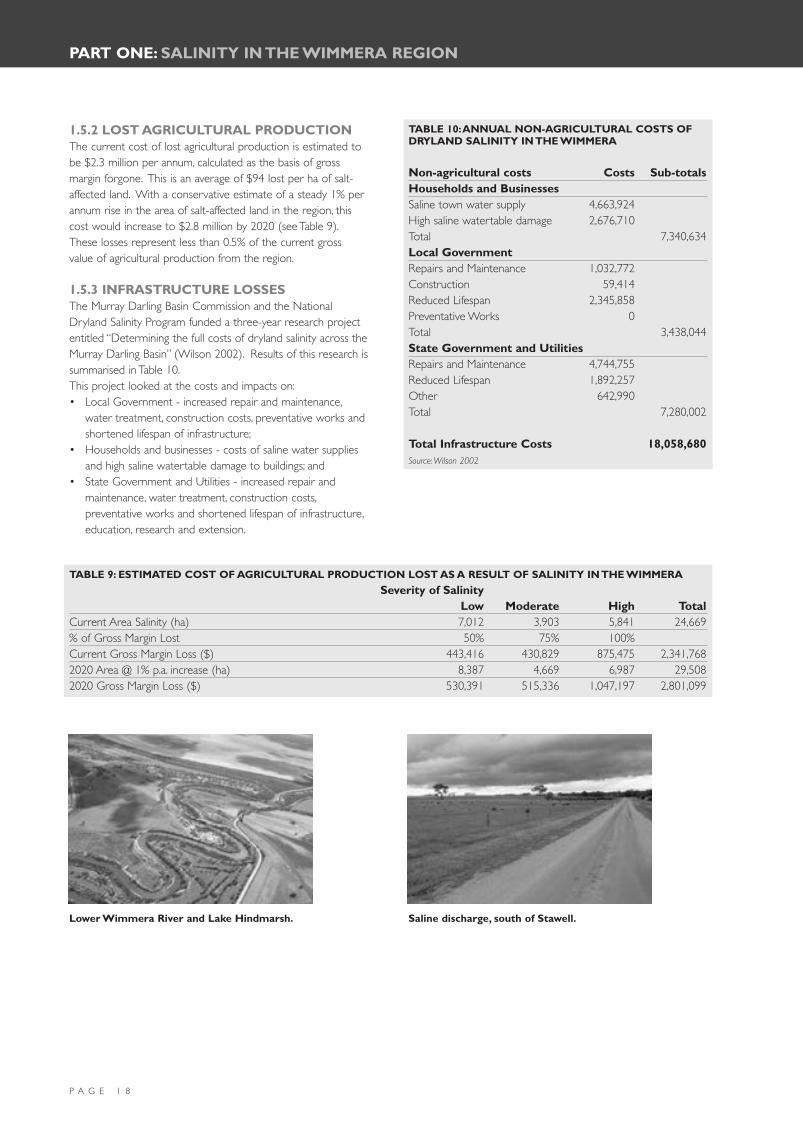
Saline discharge, south of Stawell.Lower Wimmera River and Lake Hindmarsh.

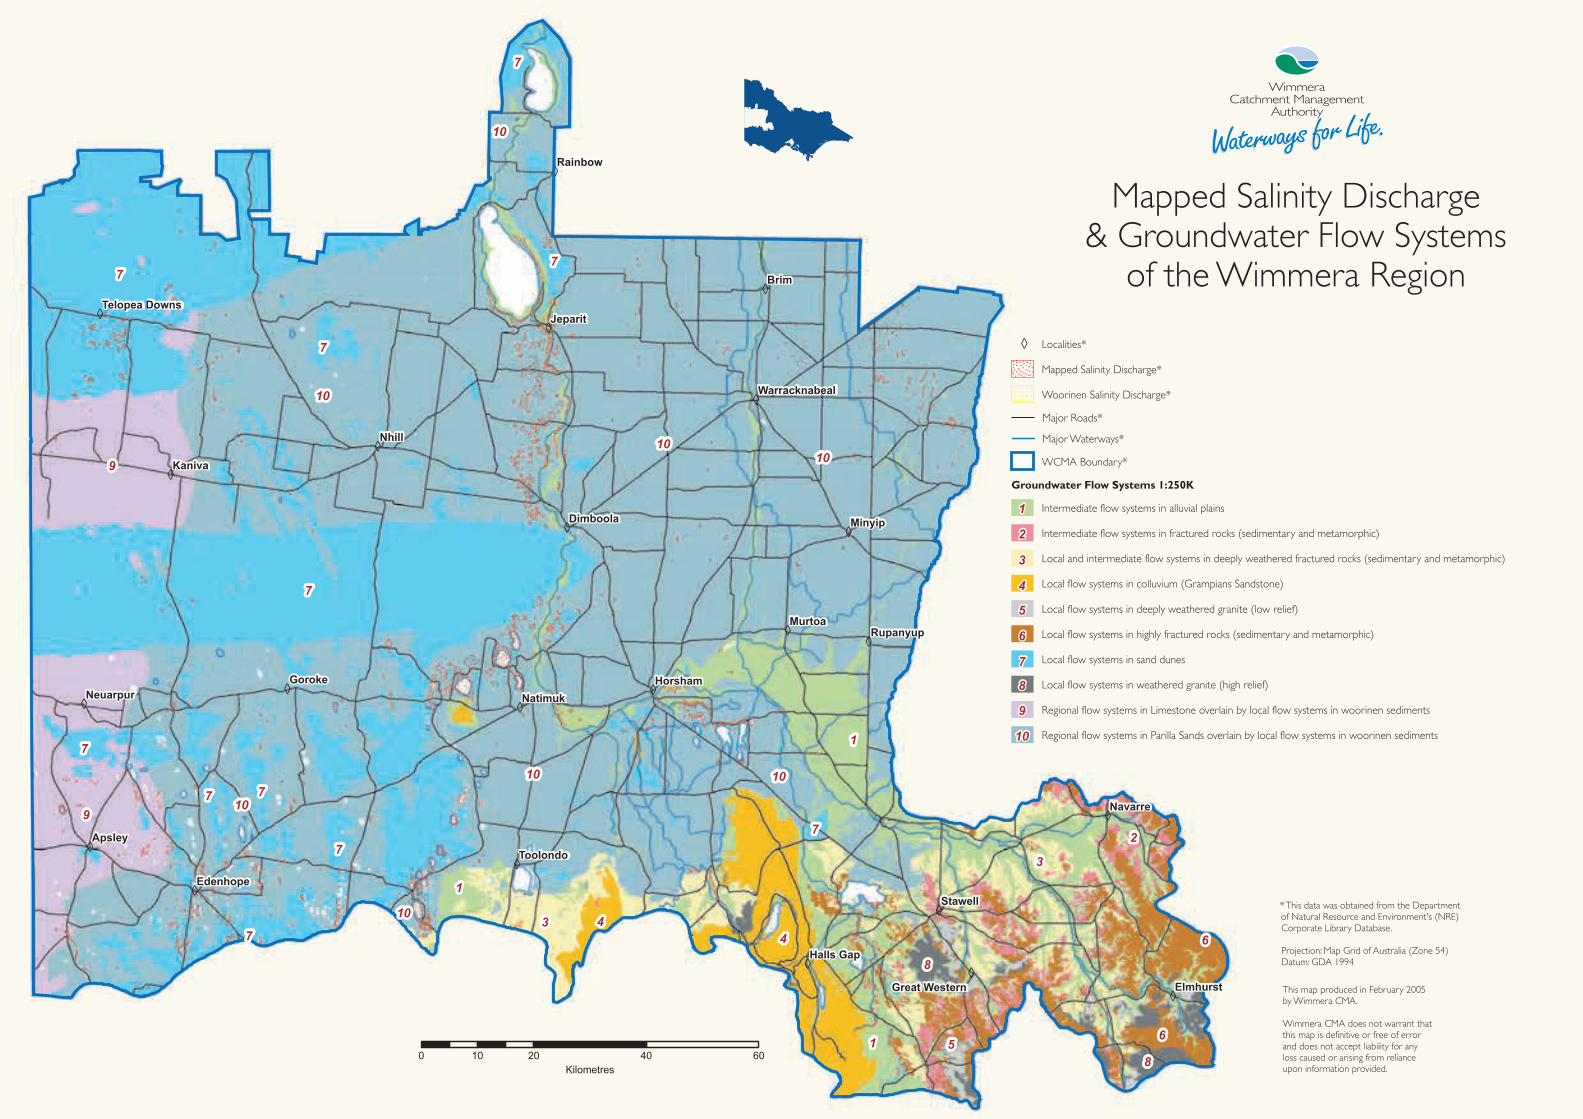
2.1 INTRODUCTIONOn the basis of similar groundwater systems occurring withinsimilar geological, geomorphic and climatic settings, the NLWRAdefined and mapped at a 1:5,000,000 scale the GFSs acrossAustralia (Figure 4). This approach has provided theopportunity to investigate areas in which similar managementoptions could be applied.
FIGURE 4: GROUNDWATER FLOW SYSTEMS OFAUSTRALIA
The GFS approach was further refined during 2000-2003 forthe Murray Darling Basin with 1:2,000,000 scale mapsdeveloped, (figure 5).
FIGURE 5: GROUNDWATER FLOW SYSTEMS OF THEMURRAY DARLING BASIN
Similar to other catchments within the Murray Basin, theWimmera Region comprises a suite of different geological andgeomorphic terrains with a diverse range of GFSs (Murray-Darling Basin Commission 2003). Each GFS causes or has thepotential to cause dryland salinity. The nature of groundwatermovement through each of these systems, and the manner inwhich each interacts with the surface hydrology, dictates therange of options that might be applied to either mitigate ormanage salinity both now and in the future.
P A G E 1 9
PART TWO: GROUNDWATER FLOW SYSTEMS IN THE WIMMERA REGION
2.1.1 SCALES OF GFSSGFSs may be grouped according to the scale of their geologicaland geomorphic attributes (Coram et al. 2001) Regional GFSs function over very large distances (>50 km),similar in scale to river basins, and are termed “Regional”. TheseGFSs have high storage capacity and permeability and respondvery slowly to increased groundwater recharge.Intermediate GFSs occur across a number of sub-catchments (20,000-30,000 ha) and cause groundwaterdischarge at some point lower in the main catchment. TheseGFSs function over rather large distances (up to 20-30 km) butless than regional systems. They have moderate storagecapacity and permeability and slowly respond to increasedrecharge (take longer to “fill” than local GFSs).Local GFSs occur within small sub-catchments (<2,000-3,000ha) and function over smaller distances (5-10 km). These GFSsgenerally have low water storage capacity and permeability andrapidly respond to increased intake of groundwater.
2.1.2 SALINITY MANAGEMENT OPTIONS
2.1.2.1 Salinity Management TriageIn considering possible options to manage salinity there arethree possible alternatives:1 Options that seek to reduce the impact of current salinity
issues within a “reasonable” timeframe.2 Options that seek to avoid future salinity impacts.3 Options that seek to adapt to saline environs.Given that GFSs behave differently, it is likely that more thanone management option will be required to address salinity.Salinity cannot be “fixed” quickly, but requires a combination ofprevention, treatment and improvement of symptoms. Inaddition, management strategies need to be cost-effective andeasy to implement.Salinity can be addressed through a combination ofmanagement options:• Biological (eg. manage groundwater recharge using native
plant revegetation, agro-forestry or high water-use crops);• Engineering (eg. drains, pumps, water diversion systems); and• Living with salt (eg. salt-tolerant plants for forestry, stock
feed, saline aquaculture, extraction of high grade salt, use ofnative grasses).
The scale of GFSs is particularly important when planningbiological management of groundwater recharge. The largerthe GFS, the greater the volume of groundwater and thegreater the scale of intervention required. Conversely,revegetation of areas with smaller GFSs may generate thedesired reduction in groundwater recharge with lessintervention and in less time.Other characteristics must also be considered since theresponse of local GFSs to recharge-reduction strategies mayvary. For example, where the permeability of an aquifer is verypoor, movement of groundwater through the system may berestricted. As a result, watertable levels in the lower parts ofthe catchment may change over long time-frames.

P A G E 2 0
PART TWO: GROUNDWATER FLOW SYSTEMS IN THE WIMMERA REGION
2.2 REGIONAL FLOW SYSTEMS IN THEPARILLA SANDS
2.2.1 OVERVIEWDuring early Tertiary times, 60 million years ago, extensivesubsidence began to occur to the west of the present DividingRange in south-eastern Australia. A broad shallow depressionopened up across a vast region stretching from the easternsector of South Australia through western and northernVictoria and southern NSW. The depression, now filled withsediment, is known as the Murray Basin.In the Wimmera Region, early development of the MurrayBasin saw sediment derived from erosion of the uplandsdeposited over the floor of the deepening depression. Later,during the period from 32 to 12 million years ago, the seaentered from the south west through South Australia andextended 400 km inland, drowning ancient river valleys andsediments. During this inundation an extensive layer oflimestone precipitated from the shallow sea. The MurrayGroup Limestone now forms an extensive regional aquiferwest of the Wimmera River. In the most westerly areas of theWimmera Region, and in adjacent South Australia, thegroundwater found within the aquifer is fresh and is animportant resource for irrigation, stock watering and domesticuse. Further west in the vicinity of the Murray River in SouthAustralia, groundwater in the aquifer is more saline and causesextensive salinity in some regions, particularly along the trenchof the Murray River.The sea inundated the region a second time about six millionyears ago, and finally retreated from the basin about two millionyears ago. During the retreat, vast amounts of fine-grained sandwere deposited as north-south trending stranded beach ridges.These sediments, known as the Parilla Sand, form theuppermost aquifer of the Murray Basin (see Figure 6). TheParilla Sand may be up to 50 m thick, and is separated from theunderlying Murray Group Limestone by a clay layer. The saltconcentration of the groundwater in the Parilla Sand aquiferranges from 5000 mg/L in the south to more than 35,000 mg/Lin the north.The Parilla Sand is quite permeable; groundwater moves freelythrough it and readily finds its own level in the landscape.Accordingly, the watertable is very flat over large regions,irrespective of local relief.
2.2.2 SALINITY PROCESSESGroundwater discharge and salinity occurs where the level ofthe land lies below or within two metres of the regionalwatertable. In many places this occurs naturally, such as atMitre Lake near Mount Arapiles and within the salt lake chainsof the Douglas Depression. Where the groundwater surfacehas risen because of an increase in groundwater recharge dueto native vegetation clearing, the area of saline groundwaterdischarge has increased as more of the lower landscape hasbeen affected. These salt lakes provide a natural evaporationbasin; for example the 200 ha Mitre Lake would provide 2000to 3000 ML/yr groundwater evaporation.Rivers and streams represent lower points of the landscape.These are often impacted by saline discharge from regionalgroundwater. They are very prone to salinity, and the discharge
of the saline groundwater from the Parilla Sand into theWimmera River north of Horsham is a most graphic exampleof environmental damage caused by this process. The deeperpools of the river, which have traditionally been principalbreeding grounds for fish and other freshwater aquatic species,now contain saline, deoxygenated groundwater that threatensthe ecological viability of the river.
FIGURE 6: CROSS-SECTION OF THE REGIONAL FLOWSYSTEM IN PARILLA SANDS
FIGURE 7: CROSS-SECTION OF THE REGIONAL FLOWSYSTEM IN PARILLA SANDS IN EDENHOPE AREA
Sample bottle on left is highly saline and anoxicwater from deep pool at Polkemmet.

P A G E 2 1
2.2.3 IMPACTS OUTSIDE THE WIMMERAREGIONThe regional Parilla Sands GFS also extends into the VictorianMallee (Macumber 1992). Groundwater and associated saltloads from the Wimmera flow in a north and north-westdirection into the Mallee and ultimately discharge directly intothe Mallee salt lakes and the Murray River.Comparison of recharge volumes and head drops for theWimmera and Mallee regions indicates that the WimmeraRegion may be a driving force behind groundwater flow fromthe Mallee dryland areas. Although groundwater processes areslow, reducing recharge in the Wimmera eventually has thepotential to reduce discharge to areas outside the catchment.
2.2.4 ASSET THREATSThe regional Parilla GFS poses a major threat to key WimmeraCatchment assets including:• Wimmera River - A contribution of 17,000 tonnes of salt to
the river between Horsham and Lochiel. The contributionbetween Lochiel and Hindmarsh is unquantified, but isestimated to be at least another 17,000 tonnes
• Wetlands in the Edenhope area• Water quality in Lake Wallace and Lake Hindmarsh• Mosquito Creek - in particular the upper reaches • Loss of small areas of agricultural land on the Wimmera
River floodplain• Urban salinity issues in and around Jeparit• Water quality in the Murray Group Limestone
TABLE 11: SNAPSHOT OF THE REGIONAL FLOWSYSTEM IN PARILLA SANDS
Total Area of System (ha) 1,194,395Percentage of Wimmera Region 51.0%Area of Mapped Discharge (ha) 9,423Discharge as % of System 0.8%Discharge as % of Wimmera Salinity 43.4%Woody Vegetation 24,006% of GFS 2.4%
2.2.5 MANAGEMENT OPTIONS
2.2.5.1 Biological Control of GroundwaterRechargeThe dynamics of regional groundwater flow within thetransmissive Parilla Sand aquifer affords little support foroptions that involve a reduction in groundwater rechargeaccruing from biological intervention. This is because:(a) The scale of land use change required to affect significantrecharge reduction is large in comparison to the areasexperiencing the problems;(b) In most instances, recharge occurs episodically in responseto years when high rainfall occurs; and(c) The regional nature of groundwater flow is likely to sustainelevated groundwater pressures and the present groundwaterdischarge irrespective of any lessening of recharge.Therefore, the focus should be on R&D into productiveperennial plants for these areas to maintain productivity in anincreasingly-saline environment.Over the last 10 years, the Hindmarsh Landcare Network hasachieved significant progress in developing options forproductive use of saline lands. Farmers in the area haveintegrated trees and salt bush plantings into their farmmanagement to address saline scolds. Anecdotal evidencesuggests they are starting to achieve productivity benefits.
2.2.5.2 Engineering Where dryland salinity associated with Parilla Sands threatensimportant assets such as the infrastructure of regional towns orimportant environmental assets (eg. wetlands), the only optionto artificially lower groundwater may be to adopt engineeringtechniques such as groundwater pumping or surface/subsurfacedrainage. But care needs to be taken when adopting thisstrategy to ensure that adequate allowance is made for thedisposal of saline water. This may call for construction ofevaporation basins.
FIGURE 8:WINDMILL TRIAL OF GROUNDWATERPUMPING OF THE REGIONAL FLOW SYSTEM INPARILLA SANDS

P A G E 2 2
PART TWO: GROUNDWATER FLOW SYSTEMS IN THE WIMMERA REGION
2.2.5.3 Living With SalinityThe range of productive and innovative options for living withsalinity is quite diverse for the saline regional groundwatersystems of the Murray Basin in Victoria.A plentiful supply of groundwater with high salinity affordsmany different options. These include the more conventionalagricultural options such as forage production from halophyticvegetation, largely saltbush, through to salt land pastures thatinclude Tall Wheat Grass and Puccinellia.Equally, a range of other more niche-market options areavailable, and although many of these remain in their infancy,they are being developed throughout Australia.Among these less conventional options are:• Distichlis, a north American halophyte with grain, pasture,
turf and fodder species;• Production of algal products such as beta-carotene and
seaweed, and from the more saline groundwater, salt andmineral production; and
• Saline aquaculture industry.Those interested in pursuing productive options for living withdryland salinity can refer to a study commissioned by theNational Dryland Salinity Program. Outcomes of the OptionsFor The Productive Use Of Salinity (OPUS) project can befound on the National Dryland Salinity Website atwww.ndsp.gov.au.
2.2.6 MANAGEMENT RECOMMENDATIONSManagement recommendations to minimise the impacts ofsalinity on the regional flow system in Parilla Sands are in Table12 . Recommendations to minimise the impacts of salinity onthe regional flow system in Parilla Sands in the Edenhope areaare in Table 13.
2.2.6.1 Implementation OpportunitiesThe regional scale of the Parilla GFS and its limitedresponsiveness to change restricts the implementation optionsavailable over the next five years. Initiatives in this GFS willneed to focus on the short to medium-term protection of highvalue assets, identifying longer-term options and developingopportunities based on saline agriculture and groundwater.Future implementation activities should focus on:• Raising community awareness of the regional nature of the
GFS, the inability to “fix the problem” with currentknowledge and farming systems and new opportunities thatmight exist;
• Research and investigation of the management options inthe near-river zone including electromagnetic studies;
• Developing an environmental services package for near-riverintervention works if appropriate;
• Linkages with the Wimmera Mallee Pipeline Project toensure appropriate use of environmental flows to minimisethe impact of salt loads on river ecosystems;
• Public sector investment in groundwater pumping and salinepool pumping to protect high value assets;
• Demonstrating and promoting new industries based onsaline groundwater use;
• Further research and investigation of the recharge andwater-quality filtering role of the Wimmera River floodplainand developing management options to potentially providegreater volume of clean water direct to the river; and
• Implementing saline agriculture opportunities on salt-affected lands including the use of salt bush and other salt-tolerant species.
TABLE 12: MANAGEMENT RECOMMENDATIONS TO MINIMISE THE IMPACTS OF SALINITY ON THE REGIONAL FLOWSYSTEM IN PARILLA SANDS
Option Location in the landscape Adoption requiredGroundwater pumping for watertable control Consistent with location of assets Intervention consistent with aquifer
properties and assetsSaline agriculture Salt-affected lands Selective establishment on and around
discharge areasEnterprises based upon saline groundwater Consistent with groundwater pumping Consistent with realising sufficient
for asset protection groundwater to support salineenterprises
TABLE 13: MANAGEMENT RECOMMENDATIONS TO MINIMISE THE IMPACTS OF SALINITY ON THE REGIONAL FLOWSYSTEM IN PARILLA SANDS IN EDENHOPE AREA
Option Location in the landscape Adoption requiredSurface Water Management Edenhope Area Surface water drainage management
plan around Edenhope and Lake Wallace
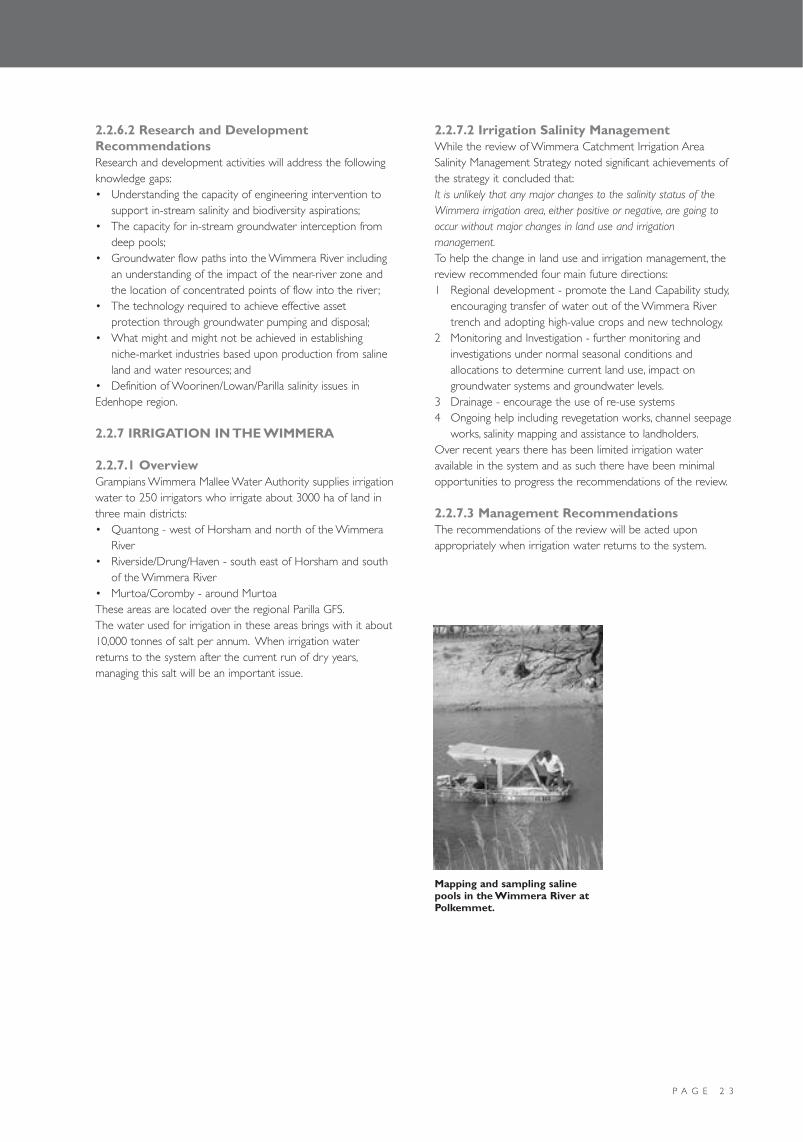
P A G E 2 3
2.2.6.2 Research and DevelopmentRecommendationsResearch and development activities will address the followingknowledge gaps:• Understanding the capacity of engineering intervention to
support in-stream salinity and biodiversity aspirations;• The capacity for in-stream groundwater interception from
deep pools;• Groundwater flow paths into the Wimmera River including
an understanding of the impact of the near-river zone andthe location of concentrated points of flow into the river;
• The technology required to achieve effective assetprotection through groundwater pumping and disposal;
• What might and might not be achieved in establishingniche-market industries based upon production from salineland and water resources; and
• Definition of Woorinen/Lowan/Parilla salinity issues inEdenhope region.
2.2.7 IRRIGATION IN THE WIMMERA
2.2.7.1 OverviewGrampians Wimmera Mallee Water Authority supplies irrigationwater to 250 irrigators who irrigate about 3000 ha of land inthree main districts:• Quantong - west of Horsham and north of the Wimmera
River• Riverside/Drung/Haven - south east of Horsham and south
of the Wimmera River• Murtoa/Coromby - around MurtoaThese areas are located over the regional Parilla GFS.The water used for irrigation in these areas brings with it about10,000 tonnes of salt per annum. When irrigation waterreturns to the system after the current run of dry years,managing this salt will be an important issue.
2.2.7.2 Irrigation Salinity ManagementWhile the review of Wimmera Catchment Irrigation AreaSalinity Management Strategy noted significant achievements ofthe strategy it concluded that:It is unlikely that any major changes to the salinity status of theWimmera irrigation area, either positive or negative, are going tooccur without major changes in land use and irrigationmanagement.To help the change in land use and irrigation management, thereview recommended four main future directions:1 Regional development - promote the Land Capability study,
encouraging transfer of water out of the Wimmera Rivertrench and adopting high-value crops and new technology.
2 Monitoring and Investigation - further monitoring andinvestigations under normal seasonal conditions andallocations to determine current land use, impact ongroundwater systems and groundwater levels.
3 Drainage - encourage the use of re-use systems4 Ongoing help including revegetation works, channel seepage
works, salinity mapping and assistance to landholders.Over recent years there has been limited irrigation wateravailable in the system and as such there have been minimalopportunities to progress the recommendations of the review.
2.2.7.3 Management RecommendationsThe recommendations of the review will be acted uponappropriately when irrigation water returns to the system.
Mapping and sampling salinepools in the Wimmera River atPolkemmet.
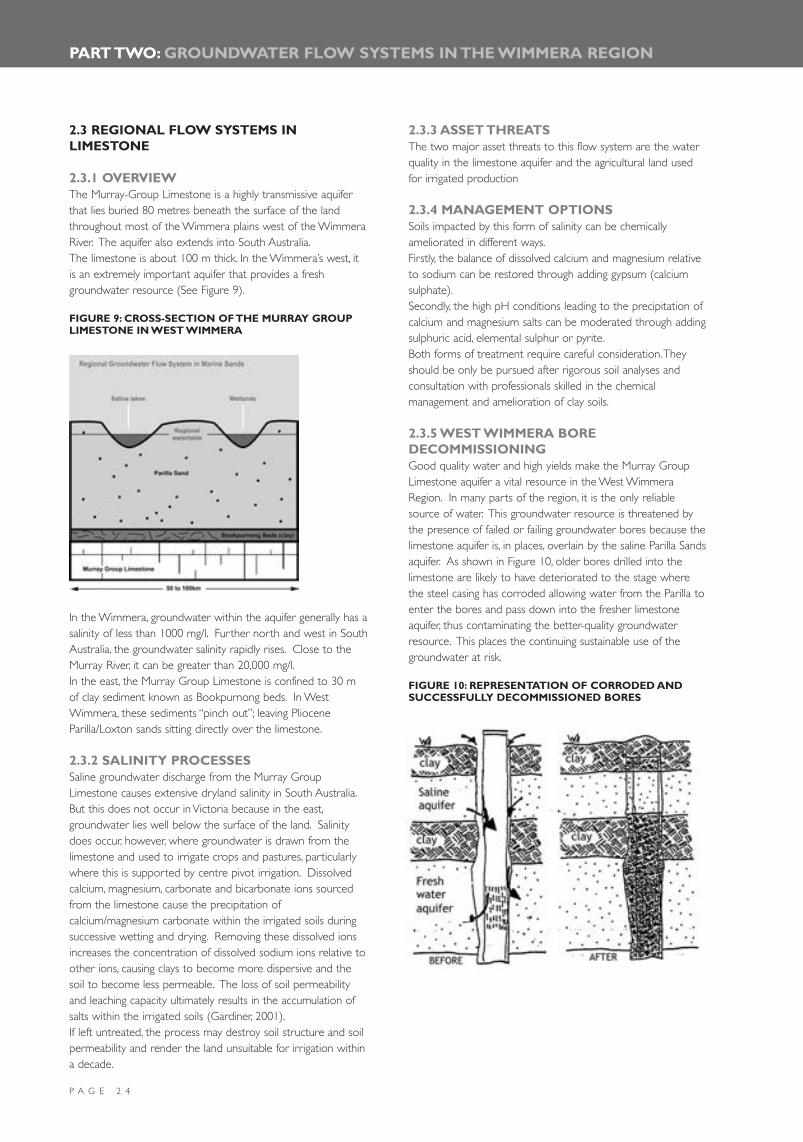
P A G E 2 4
PART TWO: GROUNDWATER FLOW SYSTEMS IN THE WIMMERA REGION
2.3 REGIONAL FLOW SYSTEMS INLIMESTONE
2.3.1 OVERVIEWThe Murray-Group Limestone is a highly transmissive aquiferthat lies buried 80 metres beneath the surface of the landthroughout most of the Wimmera plains west of the WimmeraRiver. The aquifer also extends into South Australia.The limestone is about 100 m thick. In the Wimmera’s west, itis an extremely important aquifer that provides a freshgroundwater resource (See Figure 9).
FIGURE 9: CROSS-SECTION OF THE MURRAY GROUPLIMESTONE IN WEST WIMMERA
In the Wimmera, groundwater within the aquifer generally has asalinity of less than 1000 mg/l. Further north and west in SouthAustralia, the groundwater salinity rapidly rises. Close to theMurray River, it can be greater than 20,000 mg/l.In the east, the Murray Group Limestone is confined to 30 mof clay sediment known as Bookpurnong beds. In WestWimmera, these sediments “pinch out”; leaving PlioceneParilla/Loxton sands sitting directly over the limestone.
2.3.2 SALINITY PROCESSESSaline groundwater discharge from the Murray GroupLimestone causes extensive dryland salinity in South Australia.But this does not occur in Victoria because in the east,groundwater lies well below the surface of the land. Salinitydoes occur, however, where groundwater is drawn from thelimestone and used to irrigate crops and pastures, particularlywhere this is supported by centre pivot irrigation. Dissolvedcalcium, magnesium, carbonate and bicarbonate ions sourcedfrom the limestone cause the precipitation ofcalcium/magnesium carbonate within the irrigated soils duringsuccessive wetting and drying. Removing these dissolved ionsincreases the concentration of dissolved sodium ions relative toother ions, causing clays to become more dispersive and thesoil to become less permeable. The loss of soil permeabilityand leaching capacity ultimately results in the accumulation ofsalts within the irrigated soils (Gardiner, 2001).If left untreated, the process may destroy soil structure and soilpermeability and render the land unsuitable for irrigation withina decade.
2.3.3 ASSET THREATSThe two major asset threats to this flow system are the waterquality in the limestone aquifer and the agricultural land usedfor irrigated production
2.3.4 MANAGEMENT OPTIONSSoils impacted by this form of salinity can be chemicallyameliorated in different ways.Firstly, the balance of dissolved calcium and magnesium relativeto sodium can be restored through adding gypsum (calciumsulphate).Secondly, the high pH conditions leading to the precipitation ofcalcium and magnesium salts can be moderated through addingsulphuric acid, elemental sulphur or pyrite.Both forms of treatment require careful consideration.Theyshould be only be pursued after rigorous soil analyses andconsultation with professionals skilled in the chemicalmanagement and amelioration of clay soils.
2.3.5 WEST WIMMERA BOREDECOMMISSIONINGGood quality water and high yields make the Murray GroupLimestone aquifer a vital resource in the West WimmeraRegion. In many parts of the region, it is the only reliablesource of water. This groundwater resource is threatened bythe presence of failed or failing groundwater bores because thelimestone aquifer is, in places, overlain by the saline Parilla Sandsaquifer. As shown in Figure 10, older bores drilled into thelimestone are likely to have deteriorated to the stage wherethe steel casing has corroded allowing water from the Parilla toenter the bores and pass down into the fresher limestoneaquifer, thus contaminating the better-quality groundwaterresource. This places the continuing sustainable use of thegroundwater at risk.
FIGURE 10: REPRESENTATION OF CORRODED ANDSUCCESSFULLY DECOMMISSIONED BORES

P A G E 2 5
A failed bore needs to be sealed or “decommissioned” to:• Prevent contamination of groundwater;• Conserve yield and groundwater pressure (uncontrolled
flow from an artesian bore can deplete the resource andincrease the pumping costs of surrounding users);
• Prevent inter-aquifer flow - pristine aquifers can beprotected from uncontrolled flow from a more salineaquifer ; and
• Eliminate physical hazards (old bores are hazardous tochildren, animals and machinery).
Any bore that is damaged or beyond repair should bedecommissioned. In particular, those bores older than 20 yearsand not in current use, constructed from steel casing, damagedor corroded, pumping sand, yielding saltier/poorer quality water,flowing uncontrollably, de-watering quickly, silted, collapsed orblocked, replaced by another bore or not needed.Grampians Wimmera Mallee Water Authority is managing aproject to identify all bores in West Wimmera that should bedecommissioned. A similar four-year decommissioning projecthas recently been completed in the Mallee Region. The dualaims of the West Wimmera project are to develop a prioritisedlist of bores requiring decommissioning and promote publicawareness of the issue. A list of registered bores from theState Groundwater Management system, and potentiallyunregistered wind pump bores using GIS analysis, has beencreated. This list totals 2835 bores. The list was ranked basedon bore material type, bore age and salinity and head differencebetween the limestone and parilla aquifers. Of these, thehighest priority bores, 471 in total, have been ranked as followsin Table 14:
2.3.6 MANAGEMENT RECOMMENDATIONSThe public awareness campaign to help identify bores whichmay require decommissioning is about to start and will bedone through distributing pamphlets via mail drops andadvertising in local newspapers. Local drilling contractors arebeing contacted and GIS analysis is also being employed to helpidentify unlicensed bores drilled before the Groundwater Act(1969).
2.4 LOCAL FLOW SYSTEMS IN WOORINENFORMATION
2.4.1 OVERVIEWThe most recent phase of sediment deposits within theWimmera plains has occurred cyclically over the past 32,000years (Douglas & Ferguson Ed 1976). During this time, theclimate has oscillated between temperate, high-rainfallconditions and periods of great aridity. During the arid times,lakes and other surface water systems dried; leaving elevatedwatertables, and numerous saline groundwater discharge zones.This highly saline environment destabilised clays, and strongprevailing winds carried them as aeolian sediment westwardwhere they were ultimately deposited as a veneer, or sheet ofsediment, comprising low relief dunes or mounds. Furthernorth, beyond the Wimmera, the same episodes of aeolianactivity resulted in considerable re-working of coarser grainedalluvium and formation of extensive Mallee dunefields.
FIGURE 11: CROSS-SECTION OF A LOCAL FLOWSYSTEM IN THE WOORINEN FORMATION
TABLE14: MANAGEMENT RECOMMENDATIONS TO 471 HIGH-PRIORITY BORES
Priority Number of Bores CharacteristicsHighest Priority 26 All constructed from corrodible material, average age is 40 years,
average salinity difference between MGL and Parilla is 2300 mg/L TDS and average head difference between MGL and Parilla is 5.6 m
Very High Priority 37 All constructed from corrodible material, average age is 42, average salinity difference between MGL and Parilla is 1020 mg/L TDS and average head difference between MGL and Parilla is 4.6 m
High Priority 69 All constructed from corrodible material, average age is 40, average salinity difference between MGL and Parilla is 620 mg/L TDS and average head difference between MGL and Parilla is 6.4 m
Moderately High Priority 339 All constructed from corrodible material, average age is 41, and averagehead difference between MGL and Parilla is 6.8 m

P A G E 2 6
PART TWO: GROUNDWATER FLOW SYSTEMS IN THE WIMMERA REGION
2.4.2 SALINITY PROCESSThe Woorinen Formation comprises very localised shallowperched groundwater systems (Hocking 1999). Evaporation oflow salinity groundwater in waterlogged discharge areas causessoil salinity in numerous locations scattered throughout theeastern sector of the Wimmera Plains. This form of salinity ismost common in the Warracknabeal area.
2.4.3 ASSET THREATSThis salinity poses a threat only to small areas of agriculturalland and a minor risk to remnant vegetation in low-lying areasand at the break of slope. In very wet years some overlandflow might go to local creeks resulting in a minor contributionto salt loads.
2.4.4 MANAGEMENT OPTIONS
2.4.4.1 Biological Pasture and cropland agronomyThe very localised nature of GFSs within the WoorinenFormation lend them to treatments that involve reducinggroundwater recharge through biological means.The most effective treatments involve establishing deep-rootedperennial plants, particularly lucerne. Where soil conditionssupport active growth, this plant with its deep rooted systemand moderate salinity tolerance is an excellent choice indewatering of local GFSs. It affords one of the greatest optionsfor salinity management within cropping terrain, where it isgrown in a pasture phase of the rotation, or incorporatedthrough inter-cropping.Simple manipulation of annual crops alone, whilst providingsome opportunities for improved water use and increasedproduction is less likely to deliver the water use requirementsthat can be gained from perennial plants.Trees and woody vegetationUsing trees in salinity management has potential, but muchgreater salinity management is likely to be achieved where treesare used in combination with widespread adoption of pasturessuch as lucerne.The shallow and perched nature of the local GFS, combinedwith generally low to moderate salinity groundwater affords anopportunity for trees and woody vegetation to be used in beltsor small plantations above zones of saline groundwaterdischarge. The aim is for vegetation to either use water thathas accumulated below the discharge regions or to interceptgroundwater migrating down slope.
2.4.4.2 Engineering The main engineering option to manage salinity within theWoorinen Formation involves avoiding waterlogging throughimprovements in surface and subsurface drainage. The
imminent piping of the channel system through this area willresult in significant changes to surface water movement andgroundwater recharge. This alteration of drainage needs to bedone with consideration to achieving salinity managementbenefits.Groundwater pumping is unlikely to be effective, as the claysoils would not provide sufficient yield.
2.4.4.3 Living With SalinityTraditional salt-tolerant pastures including Tall Wheat Grass andPuccinellia afford opportunities for production from saline soilsin less degraded landscapes, whilst Saltbush and otherhalophytes provide opportunities on more severely affectedsoils.
2.4.5 MANAGEMENT RECOMMENDATIONSTable 15 details management options for achieving a 50%reduction in recharge for the Woorinen GFS.
2.4.5.1 Implementation OpportunitiesAs the Woorinen Formation comprises very localised shallowperched groundwater systems, benefits of improved salinitymanagement will largely occur on site. The key focus ofimplementation activities related to this GFS will therefore needto provide information and knowledge to support individuals toimplement changes within their farming systems.Key initiatives which could support management change on thisGFS include:• Collating and distributing an information package with latest
knowledge of agro-forestry, lucerne and revegetationalternatives for the area.
• Linking into the Wimmera Mallee pipeline farm planninginitiative.
• An extension resource with a lucerne focus.• Establishing demonstration sites covering:
- High water use crops;- Salt-tolerant farm forestry;- Agro-forestry (eucalyptus oil, broom bush and wattle
seeds);- Electric fencing and stock management;- Lucerne in crop rotations;- Capture and use of surface water for on-
farm/biodiversity purposes;- Capture and use of subsurface flows while still fresh.
2.4.5.2 Research and DevelopmentRecommendationsPotential R&D to investigate the impact of toxic elements inthe root zone on production of some alkaline soils.
TABLE 15 RECOMMENDED MANAGEMENT OPTIONS TO ACHIEVE A 50% REDUCTION IN RECHARGE FOR THEWOORINEN GROUNDWATER FLOW SYSTEM
Option Location within catchment Proportion of the CatchmentLucerne Lower to mid slopes At least 20% of catchmentAgro-forestry - interception Lower slopes and affected areas Generally less than 5 %Improved surface drainage Lower slopes Generally less than 5 %
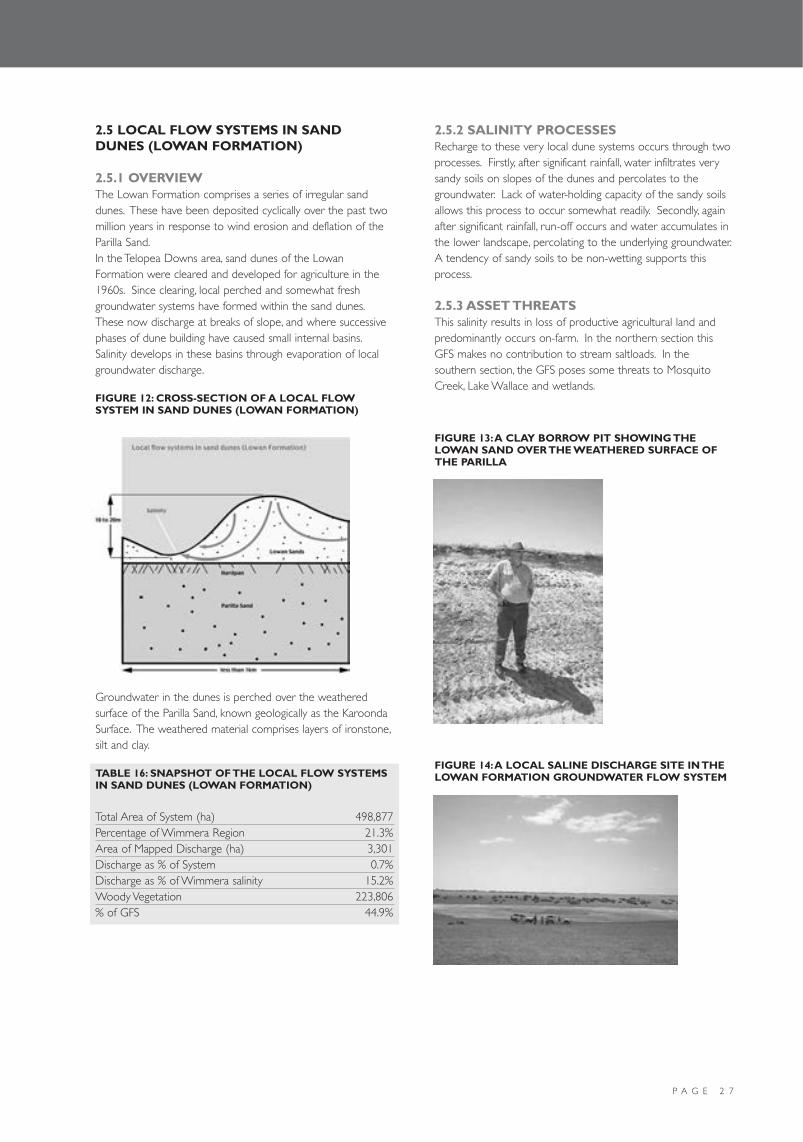
P A G E 2 7
2.5 LOCAL FLOW SYSTEMS IN SANDDUNES (LOWAN FORMATION)
2.5.1 OVERVIEWThe Lowan Formation comprises a series of irregular sanddunes. These have been deposited cyclically over the past twomillion years in response to wind erosion and deflation of theParilla Sand.In the Telopea Downs area, sand dunes of the LowanFormation were cleared and developed for agriculture in the1960s. Since clearing, local perched and somewhat freshgroundwater systems have formed within the sand dunes.These now discharge at breaks of slope, and where successivephases of dune building have caused small internal basins.Salinity develops in these basins through evaporation of localgroundwater discharge.
FIGURE 12: CROSS-SECTION OF A LOCAL FLOWSYSTEM IN SAND DUNES (LOWAN FORMATION)
Groundwater in the dunes is perched over the weatheredsurface of the Parilla Sand, known geologically as the KaroondaSurface. The weathered material comprises layers of ironstone,silt and clay.
TABLE 16: SNAPSHOT OF THE LOCAL FLOW SYSTEMSIN SAND DUNES (LOWAN FORMATION)
Total Area of System (ha) 498,877Percentage of Wimmera Region 21.3%Area of Mapped Discharge (ha) 3,301Discharge as % of System 0.7%Discharge as % of Wimmera salinity 15.2%Woody Vegetation 223,806% of GFS 44.9%
2.5.2 SALINITY PROCESSESRecharge to these very local dune systems occurs through twoprocesses. Firstly, after significant rainfall, water infiltrates verysandy soils on slopes of the dunes and percolates to thegroundwater. Lack of water-holding capacity of the sandy soilsallows this process to occur somewhat readily. Secondly, againafter significant rainfall, run-off occurs and water accumulates inthe lower landscape, percolating to the underlying groundwater.A tendency of sandy soils to be non-wetting supports thisprocess.
2.5.3 ASSET THREATSThis salinity results in loss of productive agricultural land andpredominantly occurs on-farm. In the northern section thisGFS makes no contribution to stream saltloads. In thesouthern section, the GFS poses some threats to MosquitoCreek, Lake Wallace and wetlands.
FIGURE 13:A CLAY BORROW PIT SHOWING THELOWAN SAND OVER THE WEATHERED SURFACE OFTHE PARILLA
FIGURE 14:A LOCAL SALINE DISCHARGE SITE IN THELOWAN FORMATION GROUNDWATER FLOW SYSTEM

P A G E 2 8
PART TWO: GROUNDWATER FLOW SYSTEMS IN THE WIMMERA REGION
2.5.4 MANAGEMENT OPTIONS
2.5.4.1 Biological Perennial plantsThese small, perched, local flow systems are readily managedthrough biological means where perennial vegetation can beestablished. The main limiting factor is poor water-holdingcapacity of the soils. Where this can be overcome, establishingdeep-rooted pastures such as lucerne provides an excellentoption for salinity management with potential for both rechargemitigation, and to use groundwater in evapo-transpiration.Trees and agro-forestryA more permanent solution may involve establishing“interceptor” belts immediately above salt-affected areas.Thiswould involve a lesser requirement for intensive managementthat might suit needs of absentee land owners. It is possiblethat suitable tree/shrub species with capacity to act asphreatophytes, could harvest groundwater through vegetativeuse leaving less water available to discharge in the lowerlandscape.
2.5.4.2 Engineering The most appealing engineering option involves harvesting clayfrom the weathered surface of the Parilla Sand andincorporating it within surface soils on the dunes. This improveswater-holding capacity and water entry to soils, and providesvegetation with greater opportunity to use rainfall. It, in turn,affords less opportunity for deep drainage and groundwaterrecharge.
2.5.4.3 Living With Salinity Living with salt options are probably of a lesser requirement inthese localised groundwater systems as they are very amenableto recharge management treatments. A range of salt-tolerantgrasses are available, however, that could be established onsaline lands.
2.5.5 MANAGEMENT RECOMMENDATIONS
TABLE 17: MANAGEMENT RECOMMENDATIONS TOACHIEVE A 50% REDUCTION IN RECHARGE FORLOCAL FLOW SYSTEMS IN SAND DUNES
Option Location within Proportion ofcatchment catchment
Lucerne Lower to mid At least 50% slopes of catchment
Agro-forestry Lower slopes and Generally less- interception affected areas than 10%Clay spreading General throughout At least 50%
catchment
2.5.5.1 Implementation OpportunitiesThe processes operating in the Lowan Formation GFS are verylocal with few off-site impacts from any resulting salinity. Thereis limited justification to provide financial incentives on the basisof community benefit.
2.5.5.1.1 Northern SectionMany landholders in northern areas of the Lowan FormationGFS particularly around Telopea Downs have trialed andadopted clay spreading. Telopea Downs Agricultural andLandcare Group prepared the information package “BestManagement Practices for Non-wetting Sands” to assist farmersconsidering adoption of clay spreading.Future implementation should:• Provide information and technical support for those
considering clay spreading• Support equipment-sharing arrangements• Identify potential for low interest loans• Demonstrate low rainfall forestry options (sugar gums,
eucalyptus oils) and/or Tagasaste as low maintenance,extensive management options which could appeal toabsentee landholders.
2.5.5.1.2 Southern SectionClay spreading is still a relatively new option in southernsections of the Lowan Formation GFS below the Little Desert.As such potential exists to establish and monitor of a series ofdemonstration sites to test;• Productivity benefits• Impact on recharge rates• Different clay application ratesCommercial forestry (blue gum and pine plantations) currentlyextend into this area but are not often located in the bestareas for salinity management. Developing linkages withplantation companies and providing information has thepotential to facilitate better outcomes.Some off-site (public) impacts of salinity are found in thesouthern area and depending on demonstration site outcomes,cost-sharing assistance for clay spreading and othermanagement options could be considered.
2.5.5.2 Research and DevelopmentRecommendationsInvestigate clay spreading and associated farming systemchanges on recharge in the southern section of the Lowansands.
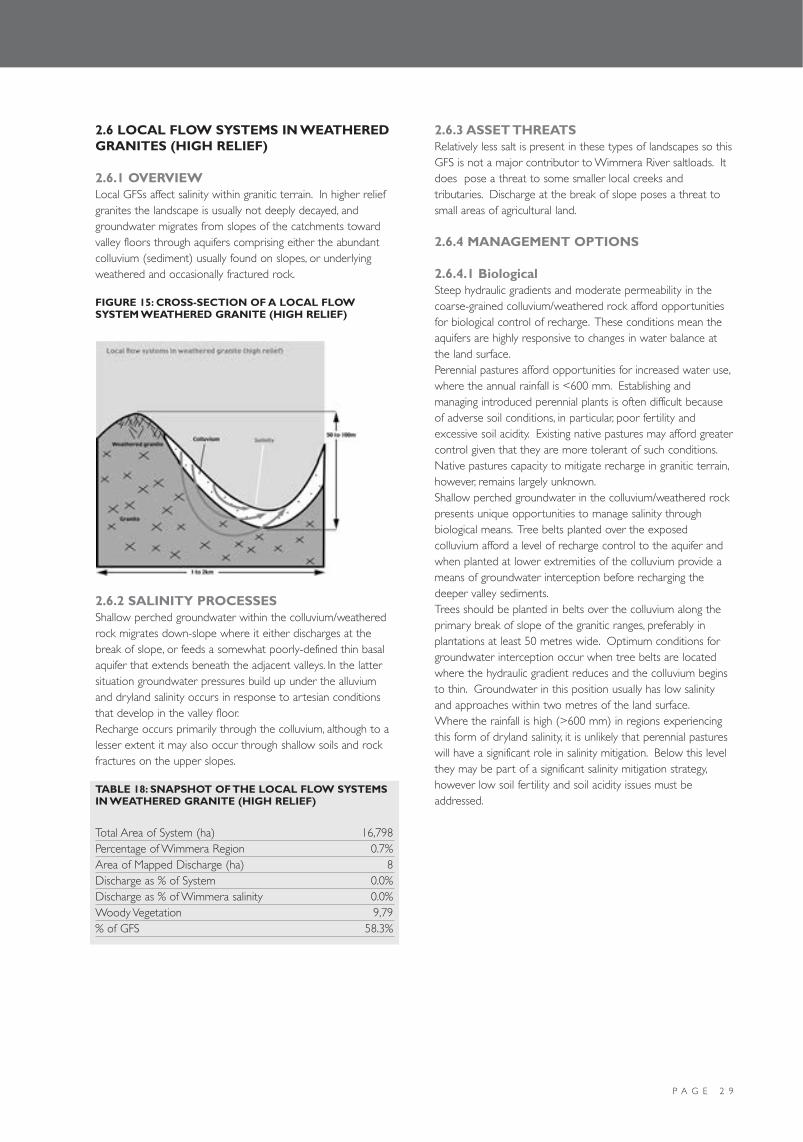
P A G E 2 9
2.6 LOCAL FLOW SYSTEMS IN WEATHEREDGRANITES (HIGH RELIEF)
2.6.1 OVERVIEWLocal GFSs affect salinity within granitic terrain. In higher reliefgranites the landscape is usually not deeply decayed, andgroundwater migrates from slopes of the catchments towardvalley floors through aquifers comprising either the abundantcolluvium (sediment) usually found on slopes, or underlyingweathered and occasionally fractured rock.
FIGURE 15: CROSS-SECTION OF A LOCAL FLOWSYSTEM WEATHERED GRANITE (HIGH RELIEF)
2.6.2 SALINITY PROCESSESShallow perched groundwater within the colluvium/weatheredrock migrates down-slope where it either discharges at thebreak of slope, or feeds a somewhat poorly-defined thin basalaquifer that extends beneath the adjacent valleys. In the lattersituation groundwater pressures build up under the alluviumand dryland salinity occurs in response to artesian conditionsthat develop in the valley floor.Recharge occurs primarily through the colluvium, although to alesser extent it may also occur through shallow soils and rockfractures on the upper slopes.
TABLE 18: SNAPSHOT OF THE LOCAL FLOW SYSTEMSIN WEATHERED GRANITE (HIGH RELIEF)
Total Area of System (ha) 16,798Percentage of Wimmera Region 0.7%Area of Mapped Discharge (ha) 8Discharge as % of System 0.0%Discharge as % of Wimmera salinity 0.0%Woody Vegetation 9,79% of GFS 58.3%
2.6.3 ASSET THREATSRelatively less salt is present in these types of landscapes so thisGFS is not a major contributor to Wimmera River saltloads. Itdoes pose a threat to some smaller local creeks andtributaries. Discharge at the break of slope poses a threat tosmall areas of agricultural land.
2.6.4 MANAGEMENT OPTIONS
2.6.4.1 Biological Steep hydraulic gradients and moderate permeability in thecoarse-grained colluvium/weathered rock afford opportunitiesfor biological control of recharge. These conditions mean theaquifers are highly responsive to changes in water balance atthe land surface.Perennial pastures afford opportunities for increased water use,where the annual rainfall is <600 mm. Establishing andmanaging introduced perennial plants is often difficult becauseof adverse soil conditions, in particular, poor fertility andexcessive soil acidity. Existing native pastures may afford greatercontrol given that they are more tolerant of such conditions.Native pastures capacity to mitigate recharge in granitic terrain,however, remains largely unknown.Shallow perched groundwater in the colluvium/weathered rockpresents unique opportunities to manage salinity throughbiological means. Tree belts planted over the exposedcolluvium afford a level of recharge control to the aquifer andwhen planted at lower extremities of the colluvium provide ameans of groundwater interception before recharging thedeeper valley sediments.Trees should be planted in belts over the colluvium along theprimary break of slope of the granitic ranges, preferably inplantations at least 50 metres wide. Optimum conditions forgroundwater interception occur when tree belts are locatedwhere the hydraulic gradient reduces and the colluvium beginsto thin. Groundwater in this position usually has low salinityand approaches within two metres of the land surface.Where the rainfall is high (>600 mm) in regions experiencingthis form of dryland salinity, it is unlikely that perennial pastureswill have a significant role in salinity mitigation. Below this levelthey may be part of a significant salinity mitigation strategy,however low soil fertility and soil acidity issues must beaddressed.
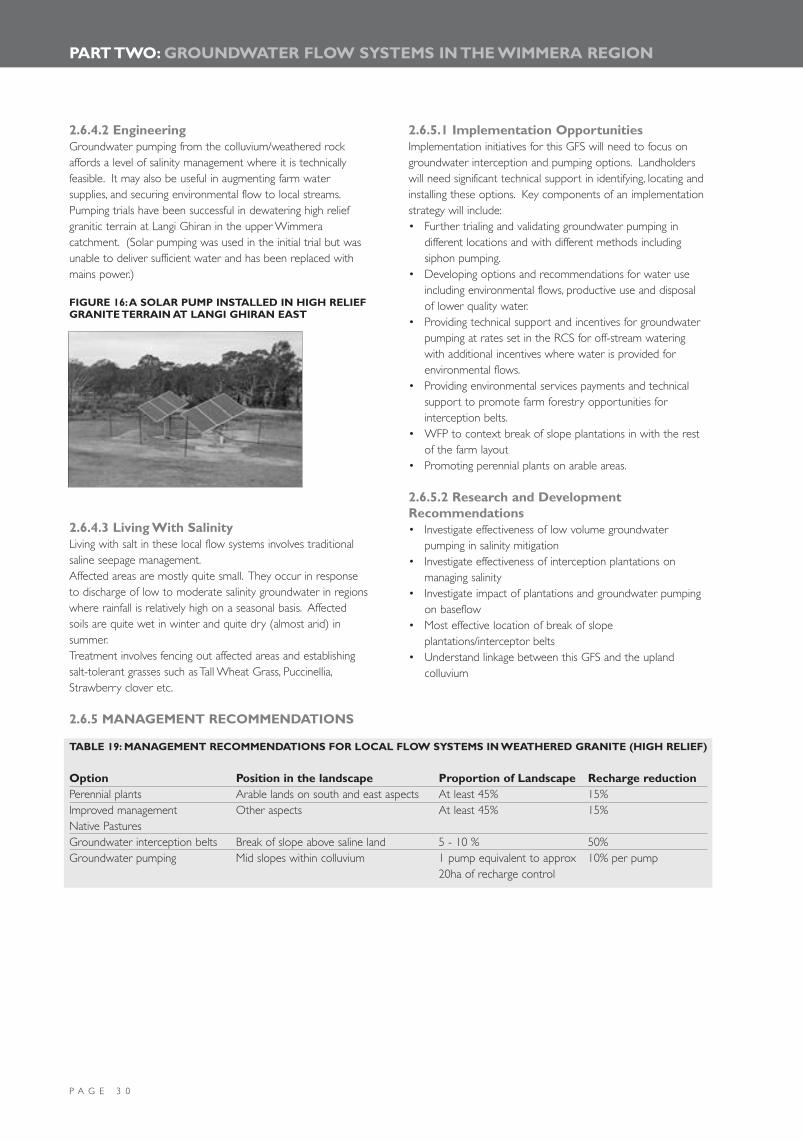
P A G E 3 0
PART TWO: GROUNDWATER FLOW SYSTEMS IN THE WIMMERA REGION
2.6.4.2 Engineering Groundwater pumping from the colluvium/weathered rockaffords a level of salinity management where it is technicallyfeasible. It may also be useful in augmenting farm watersupplies, and securing environmental flow to local streams.Pumping trials have been successful in dewatering high reliefgranitic terrain at Langi Ghiran in the upper Wimmeracatchment. (Solar pumping was used in the initial trial but wasunable to deliver sufficient water and has been replaced withmains power.)
FIGURE 16:A SOLAR PUMP INSTALLED IN HIGH RELIEFGRANITE TERRAIN AT LANGI GHIRAN EAST
2.6.4.3 Living With SalinityLiving with salt in these local flow systems involves traditionalsaline seepage management.Affected areas are mostly quite small. They occur in responseto discharge of low to moderate salinity groundwater in regionswhere rainfall is relatively high on a seasonal basis. Affectedsoils are quite wet in winter and quite dry (almost arid) insummer.Treatment involves fencing out affected areas and establishingsalt-tolerant grasses such as Tall Wheat Grass, Puccinellia,Strawberry clover etc.
2.6.5 MANAGEMENT RECOMMENDATIONS
2.6.5.1 Implementation OpportunitiesImplementation initiatives for this GFS will need to focus ongroundwater interception and pumping options. Landholderswill need significant technical support in identifying, locating andinstalling these options. Key components of an implementationstrategy will include:• Further trialing and validating groundwater pumping in
different locations and with different methods includingsiphon pumping.
• Developing options and recommendations for water useincluding environmental flows, productive use and disposalof lower quality water.
• Providing technical support and incentives for groundwaterpumping at rates set in the RCS for off-stream wateringwith additional incentives where water is provided forenvironmental flows.
• Providing environmental services payments and technicalsupport to promote farm forestry opportunities forinterception belts.
• WFP to context break of slope plantations in with the restof the farm layout
• Promoting perennial plants on arable areas.
2.6.5.2 Research and DevelopmentRecommendations• Investigate effectiveness of low volume groundwater
pumping in salinity mitigation• Investigate effectiveness of interception plantations on
managing salinity• Investigate impact of plantations and groundwater pumping
on baseflow• Most effective location of break of slope
plantations/interceptor belts• Understand linkage between this GFS and the upland
colluvium
TABLE 19: MANAGEMENT RECOMMENDATIONS FOR LOCAL FLOW SYSTEMS IN WEATHERED GRANITE (HIGH RELIEF)
Option Position in the landscape Proportion of Landscape Recharge reductionPerennial plants Arable lands on south and east aspects At least 45% 15%Improved management Other aspects At least 45% 15%Native PasturesGroundwater interception belts Break of slope above saline land 5 - 10 % 50%Groundwater pumping Mid slopes within colluvium 1 pump equivalent to approx 10% per pump
20ha of recharge control

P A G E 3 1
2.7 LOCAL FLOW SYSTEMS IN DEEPLYWEATHERED GRANITE (LOW RELIEF)
2.7.1 OVERVIEWLocal GFSs function within low relief granitic terrain in theupper Wimmera catchment.The low relief of these otherwise granitic landscapes reflectsdeep weathering. The rock has been exposed to the elementsover very long periods of geological time, and intensely decayedand chemically altered in the uppermost 20 to 50 metres.Much of the regolith (material above solid rock) is now formedof the decay products, largely kaolin rich clay. Chemicalalteration, combined with erosion over long periods of time,has resulted in landscapes that are often quite subdued, andgently undulating.These clay rich landscapes commonly contain appreciableamounts of salt.They are not easily leached of ions introducedthrough rainfall over the millennia. Salt accumulation occursthrough salt exclusion in the root zone of deep-rooted nativevegetation during transpiration.
FIGURE 17: CROSS-SECTION OF A LOCAL FLOWSYSTEM IN DEEPLY WEATHERED GRANITE (LOWRELIEF)
2.7.2 SALINITY PROCESSESGroundwater flow through deeply weathered low reliefgranites is more sluggish, largely because the fine-grainedregolith (material overlying solid rock) is poorly permeable(Stauffacher 2000). Often the most permeable part of thelandscape is the deepest parts of the regolith whereweathering has been less complete. Here groundwater is ableto migrate through cracks created by preferential mineralweathering.Recharge occurs on the mid to upper slopes of sub-catchmentsand discharge occurs in valleys and at breaks of slope.Recharge occurs generally throughout the catchment, and doesnot occur to a greater extent in areas where rock outcrops, asis the case in fractured rock systems.
TABLE 20: SNAPSHOT OF THE LOCAL FLOW SYSTEMSIN DEEPLY WEATHERED GRANITES (LOW RELIEF)
Total Area of System (ha) 9,876Percentage of Wimmera Region 0.4%Area of Mapped Discharge (ha) 35Discharge as % of System 0.4%Discharge as % of Wimmera salinity 0.2%Woody Vegetation 1,099% of GFS 11.1%
2.7.3 ASSET THREATSThese landscapes commonly contain appreciable amounts ofsalts and are considered a major contributor to Wimmera Riversaltloads. They also pose a potential risk to surface waterquality, which is a significant asset in many of these areas. Someearly signs of urban salinity exist around the township ofStawell.
2.7.4 MANAGEMENT OPTIONS
2.7.4.1 Biological Perennial plant options might be effective where rainfall is lessthan about 600 mm. Again, as with high relief granites,significant issues with soil acidity and soil fertility must beaddressed. Opting to improve management of native grasspastures may ultimately prove more efficient.Considerable subdivision/rural lifestyle farming occurs in theseareas. Many of these people will not be interested in pastureimprovement given the associated management and labourinputs. It is likely to be more effective to target agro-forestryopportunities at these landholders.Targeted tree planting affords a moderate benefit where treebelts can be established as interceptor belts on lower slopes(Clifton and Dyson 1998). Trees with a higher level of salttolerance are required, and should be established parallel to theslope immediately above groundwater discharge zones. It isnecessary to ensure that belts are established a few metres inelevation above discharge sites to avoid saline water loggingand salt accumulation in the root zone.

P A G E 3 2
PART TWO: GROUNDWATER FLOW SYSTEMS IN THE WIMMERA REGION
2.7.4.2 Engineering Groundwater pumping is only likely to be effective where lowvolume groundwater pumping might be applied to protect highvalue assets.Generally, the low transmissivity of granite landscapes isproblematic when considering traditional groundwater pumpingoptions. Low volume groundwater pumping using air lifttechnology has been used with some success in thesecircumstances. Saline groundwater disposal remains animportant issue when planning to undertake dewatering ofsaline landscapes.In lower slope areas better management of drainage isconsidered important to reduce effects of run-off onto salt-affected lands.
2.7.4.3 Living With SalinityTreatment involves fencing out affected areas and establishingsalt-tolerant grasses such as Tall Wheat Grass, Puccinellia,Strawberry clover etc.
2.7.5 MANAGEMENT RECOMMENDATIONS
TABLE 21: MANAGEMENT RECOMMENDATIONS FORLOCAL FLOW SYSTEMS IN DEEPLY WEATHEREDGRANITES (LOW RELIEF)
Option Position in the Proportion of Rechargelandscape Landscape Reduction
Native mid to upper At least 45% 23%Pastures slopesPerennial mid to lower At least 45% 23%plants slopesInterceptor Breaks of slope 5-10% 30%belts (agro above saline-forestry) lands
2.7.5.1 Implementation OpportunitiesMany implementation initiatives for this GFS will be similar tothose required for the high relief granite GFS. The focus in thelow relief granites will be on establishing perennial plants andagro-forestry interceptor belts. Key components will:• Provide environmental service payments and technical
support to promote farm forestry opportunities forinterception (break of slope) belts.
• Promote perennial plants on arable areas for larger scalecommercial landholders.
• Provide incentives for groundwater pumping to protect highvalue assets.
2.7.5.2 Research and DevelopmentRecommendationsInvestigate the extent to which saltloads can be managedthrough alternative land and water management
2.8 LOCAL FLOW SYSTEMS IN HIGHLYFRACTURED ROCKS
2.8.1 OVERVIEWMuch of the Wimmera uplands comprise folded and fracturedsedimentary and metamorphic rocks, often referred to asmetasediments. The fractured rock behaves as an aquifer withcapacity to store and transmit groundwater (Dyson 1983).Thegroundwater system operates within rock open fractures, whichare generally restricted to the upper 50 to 100 metres of thelandscape.Where there is substantial relief (greater than 50 metres) thefractured rock aquifer breaks into local flow cells associatedwith each hill or range. Under these circumstances aquiferpermeability follows the general shape of the landscape.Groundwater movement through the steeper hills is restrictedby less permeable rocks in the hill cores.
2.8.2 SALINITY PROCESSESThe aquifer is steeply inclined as is the hydraulic gradient drivinggroundwater flow. Where the land surface slope substantiallyreduces in the footslopes the reduction in hydraulic gradientfrequently results in groundwater discharge. This occursbecause the reduced gradient allows for more groundwater toflow into the break of slope, than can flow beyond it.
FIGURE 18: CROSS-SECTION OF A LOCAL FLOWSYSTEM IN FRACTURED ROCK

P A G E 3 3
Where the groundwater is saline, as is often the case in thesesedimentary rocks, saline seeps may develop from increasedrecharge following native vegetation clearing and agriculturalpursuits.Groundwater recharge occurs seasonally, over the winterperiod. More rainfall than evaporation during this periodresults in both run-off and infiltration, and where infiltrationexceeds the soil’s water-holding capacity, deep percolation tothe underlying fractured rock adds to groundwater volume.This process tends to operate throughout the landscape wherenative vegetation has been removed, but is usually moresignificant locally on upper slopes and crests where soils areshallow and very permeable.
TABLE 22: SNAPSHOT OF THE LOCAL FRACTUREDROCK GROUNDWATER FLOW SYSTEMS
Total Area of System (ha) 39,065Percentage of Wimmera Region 1.7%Area of Mapped Discharge (ha) 15Discharge as % of System 0.0%Discharge as % of Wimmera salinity 0.0%Woody Vegetation 17,363% of GFS 44.4%
2.8.3 ASSET THREATSThis GFS is considered to make a significant contribution toWimmera River saltloads and poses a threat to riparianvegetation along many creeks and tributaries.The discharge areas although relatively small threaten high valueagricultural land including vineyards.
2.8.4 MANAGEMENT OPTIONS
2.8.4.1 Biological Local fractured rock aquifer systems lend themselves well totreatment for salinity mitigation. They are moderatelypermeable, generally comprise groundwater at the lower endof the range of salinities that effect degradation, and togetherwith steep hydraulic gradients comprise systems consideredhighly “responsive”. That is, they should respond well andquickly to changes in land management that effect a lowerrecharge.The main options for recharge reduction are:• Regenerating and establishing native trees/shrubs on non-
arable upper slopes and hill crests.• Retaining and enhancing native pastures tolerant of soil
acidity and summer drought in the mid slopes, andestablishing more traditional introduced perennial plants inmore productive regions of the lower slopes.
Note: The extent to which native pastures will mitigaterecharge in this terrain remains largely unknown. They arerecommended on the basis that they afford a perennial plantoption offering persistence in the face of adverse soil with poorwater-holding capacity and extreme soil acidity.Selective revegetation of discrete parts of the catchmentprobably afford the greatest opportunity for salinitymanagement, with the added potential advantage of meetingbroader natural resources management targets. Areas to betargeted would include those zones where excessivegroundwater recharge in non-arable lands comprises asignificant part of the landscape. Eg. Slopes >20% as in theWimmera Steep Hill Country Plan.Some fractured rock systems might lend themselves toplantation forestry, (on slopes of >20% other issues withharvesting, roads and soil loss that limit the application of farmforestry to these terrains) particularly in higher rainfall areas.This activity would need to be pursued with some degree ofcaution, as the resulting reduction in run-off associated with theforestry may reduce water yield to the broader catchment, andeven enhance stream salinity through reduction in dilutionflows.
2.8.4.2 Engineering In many instances groundwater associated with local fracturedrock aquifers is not highly saline, particularly within the mid toupper slope regions. Equally the fracture permeability providessome opportunity for limited groundwater harvesting for stockand domestic purposes. In some instances even very smallscale irrigation may be possible. Aquifer dewatering throughgroundwater pumping is, thus, a salinity management option,particularly where extracted groundwater can be used tosupplement farm water supplies and provide some limitedeconomic advantages within a farming operation.
2.8.4.3 Living With SalinityRelatively high rainfall and low groundwater salinity producesgroundwater seepages that are most frequently at the wetterand less saline end of the soil salinity spectrum. These areaslend themselves well to treatment with more traditional salt-tolerant grasses such as Tall Wheat Grass, Puccinellia, Paspalum,Strawberry Clover etc.
Steep ridge, shallow soils, high recharge areaeast of Elmhurst.

2.8.5 MANAGEMENT RECOMMENDATIONS
2.8.5.1 Implementation OpportunitiesClear off-site impacts exist in this GFS particularly with waterquality. Incentives will play a key role in facilitating land use andmanagement change. The need to tailor-management optionsto different parts of the landscape will necessitate working withindividual landholders to assess options and develop actionplans.The key components of an implementation strategy willinclude:• Communicating GFS principles, highlighting the potential to
have a local impact.• A community facilitator/technical resource to work with and
support landholders in developing management plans.• Environmental service payments.• Encouraging contracting services to provide skills and
labour necessary for implementation.• Further research and investigation of potential for native
pastures, salt-tolerant native grasses and the economics andenvironmental costs of off-site impacts.
• Developing detailed GFS maps for the area (1:25,000) to beincluded in extension materials.
2.8.5.2 Research and DevelopmentRecommendationsUnderstanding the ability of native grasses to managegroundwater recharge to fractured rock aquifers.
P A G E 3 4
PART TWO: GROUNDWATER FLOW SYSTEMS IN THE WIMMERA REGION
TABLE 23: MANAGEMENT RECOMMENDATIONS FOR LOCAL FRACTURED ROCK GROUNDWATER FLOW SYSTEMS
Option Position in the landscape Proportion of Landscape Recharge ReductionRevegetation/ regeneration >20% slope 10-20 % 24%Trees/shrubs on high recharge landsNative pasture Steeper hill slopes(10-20% slope) 50-60 % 21%Introduced high input perennial plants Lower slopes (10-20%) in the 10 - 20% 5%
more productive lands - southand east aspects
Groundwater pumping Lower slopes Asset protection and augmentfarm water supplies
Saline agriculture Salt affected lands 100% of affected areas
2.9 INTERMEDIATE GROUNDWATER FLOWSYSTEMS IN FRACTURED ROCKS
2.9.1 OVERVIEWIntermediate GFSs occur within fractured sedimentary rocks ofthe Great Dividing Ranges where deep weathering is absentand relief is less steep. Groundwater is able to flowuninterrupted through the rock fractures over considerabledistances, perhaps as much as 20 to 30 kilometres or more(Dyson 1983). Intermediate systems will often partiallydischarge within the upper catchments, particularly where theregional hydraulic gradient changes immediately belowcatchment headwaters. The highly folded and fracturedsedimentary rocks of the upper Wimmera catchment containvast amounts of salt stored within the rock matrix. This diffusesinto the groundwater, giving it a salinity ranging from as little as3,000 mg/l to more than 12,000 mg/l.As in other regions throughout southern Australia groundwaterhas risen in response to land clearing over the past 150 years.The increase in groundwater discharge through fractured rockaquifers of the uplands has resulted in substantial increases instream saltloads. Many streams now export in more than 5000tonnes of salt each year from catchments that are less than ahundred square kilometres in area.The saltload from many catchments comprising fractured rockranges from 200 to 600 Kg/Ha per year. This is at least anorder of magnitude greater than the mass of salt introducedannually through rainfall.
FIGURE 19: CROSS-SECTION OF AN INTERMEDIATEFLOW SYSTEM IN FRACTURED ROCKS
Groundwater levels more than one metre aboveground surface, Frenchmans.
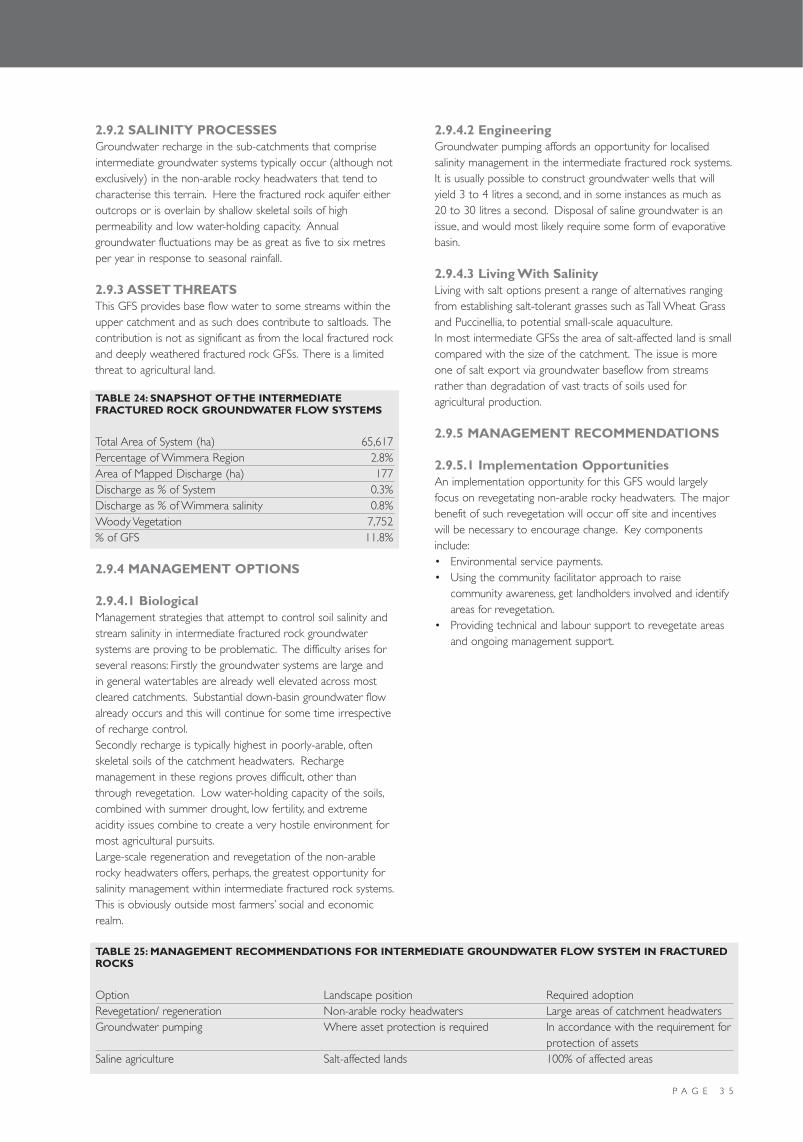
2.9.2 SALINITY PROCESSESGroundwater recharge in the sub-catchments that compriseintermediate groundwater systems typically occur (although notexclusively) in the non-arable rocky headwaters that tend tocharacterise this terrain. Here the fractured rock aquifer eitheroutcrops or is overlain by shallow skeletal soils of highpermeability and low water-holding capacity. Annualgroundwater fluctuations may be as great as five to six metresper year in response to seasonal rainfall.
2.9.3 ASSET THREATSThis GFS provides base flow water to some streams within theupper catchment and as such does contribute to saltloads. Thecontribution is not as significant as from the local fractured rockand deeply weathered fractured rock GFSs. There is a limitedthreat to agricultural land.
TABLE 24: SNAPSHOT OF THE INTERMEDIATEFRACTURED ROCK GROUNDWATER FLOW SYSTEMS
Total Area of System (ha) 65,617Percentage of Wimmera Region 2.8%Area of Mapped Discharge (ha) 177Discharge as % of System 0.3%Discharge as % of Wimmera salinity 0.8%Woody Vegetation 7,752% of GFS 11.8%
2.9.4 MANAGEMENT OPTIONS
2.9.4.1 Biological Management strategies that attempt to control soil salinity andstream salinity in intermediate fractured rock groundwatersystems are proving to be problematic. The difficulty arises forseveral reasons: Firstly the groundwater systems are large andin general watertables are already well elevated across mostcleared catchments. Substantial down-basin groundwater flowalready occurs and this will continue for some time irrespectiveof recharge control.Secondly recharge is typically highest in poorly-arable, oftenskeletal soils of the catchment headwaters. Rechargemanagement in these regions proves difficult, other thanthrough revegetation. Low water-holding capacity of the soils,combined with summer drought, low fertility, and extremeacidity issues combine to create a very hostile environment formost agricultural pursuits.Large-scale regeneration and revegetation of the non-arablerocky headwaters offers, perhaps, the greatest opportunity forsalinity management within intermediate fractured rock systems.This is obviously outside most farmers’ social and economicrealm.
2.9.4.2 EngineeringGroundwater pumping affords an opportunity for localisedsalinity management in the intermediate fractured rock systems.It is usually possible to construct groundwater wells that willyield 3 to 4 litres a second, and in some instances as much as20 to 30 litres a second. Disposal of saline groundwater is anissue, and would most likely require some form of evaporativebasin.
2.9.4.3 Living With SalinityLiving with salt options present a range of alternatives rangingfrom establishing salt-tolerant grasses such as Tall Wheat Grassand Puccinellia, to potential small-scale aquaculture.In most intermediate GFSs the area of salt-affected land is smallcompared with the size of the catchment. The issue is moreone of salt export via groundwater baseflow from streamsrather than degradation of vast tracts of soils used foragricultural production.
2.9.5 MANAGEMENT RECOMMENDATIONS
2.9.5.1 Implementation OpportunitiesAn implementation opportunity for this GFS would largelyfocus on revegetating non-arable rocky headwaters. The majorbenefit of such revegetation will occur off site and incentiveswill be necessary to encourage change. Key componentsinclude:• Environmental service payments.• Using the community facilitator approach to raise
community awareness, get landholders involved and identifyareas for revegetation.
• Providing technical and labour support to revegetate areasand ongoing management support.
TABLE 25: MANAGEMENT RECOMMENDATIONS FOR INTERMEDIATE GROUNDWATER FLOW SYSTEM IN FRACTUREDROCKS
Option Landscape position Required adoptionRevegetation/ regeneration Non-arable rocky headwaters Large areas of catchment headwatersGroundwater pumping Where asset protection is required In accordance with the requirement for
protection of assetsSaline agriculture Salt-affected lands 100% of affected areas
P A G E 3 5
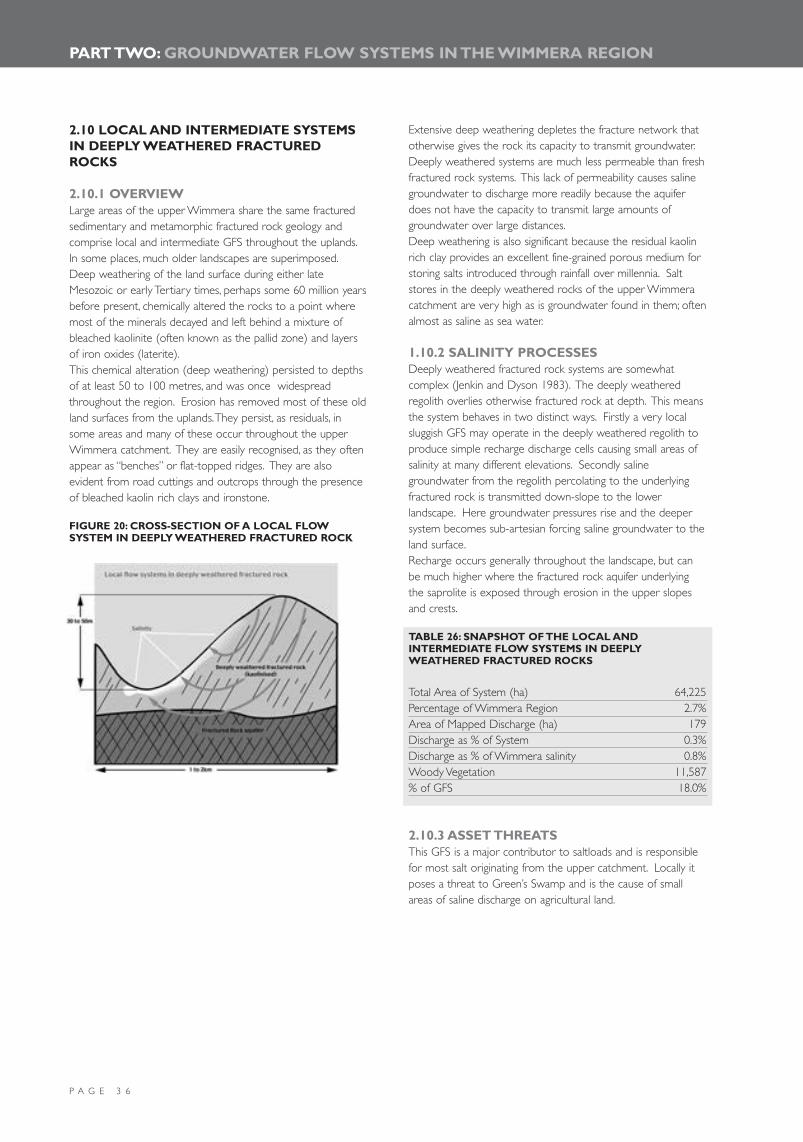
P A G E 3 6
PART TWO: GROUNDWATER FLOW SYSTEMS IN THE WIMMERA REGION
2.10 LOCAL AND INTERMEDIATE SYSTEMSIN DEEPLY WEATHERED FRACTURED ROCKS
2.10.1 OVERVIEWLarge areas of the upper Wimmera share the same fracturedsedimentary and metamorphic fractured rock geology andcomprise local and intermediate GFS throughout the uplands.In some places, much older landscapes are superimposed.Deep weathering of the land surface during either lateMesozoic or early Tertiary times, perhaps some 60 million yearsbefore present, chemically altered the rocks to a point wheremost of the minerals decayed and left behind a mixture ofbleached kaolinite (often known as the pallid zone) and layersof iron oxides (laterite).This chemical alteration (deep weathering) persisted to depthsof at least 50 to 100 metres, and was once widespreadthroughout the region. Erosion has removed most of these oldland surfaces from the uplands.They persist, as residuals, insome areas and many of these occur throughout the upperWimmera catchment. They are easily recognised, as they oftenappear as “benches” or flat-topped ridges. They are alsoevident from road cuttings and outcrops through the presenceof bleached kaolin rich clays and ironstone.
FIGURE 20: CROSS-SECTION OF A LOCAL FLOWSYSTEM IN DEEPLY WEATHERED FRACTURED ROCK
Extensive deep weathering depletes the fracture network thatotherwise gives the rock its capacity to transmit groundwater.Deeply weathered systems are much less permeable than freshfractured rock systems. This lack of permeability causes salinegroundwater to discharge more readily because the aquiferdoes not have the capacity to transmit large amounts ofgroundwater over large distances.Deep weathering is also significant because the residual kaolinrich clay provides an excellent fine-grained porous medium forstoring salts introduced through rainfall over millennia. Saltstores in the deeply weathered rocks of the upper Wimmeracatchment are very high as is groundwater found in them; oftenalmost as saline as sea water.
1.10.2 SALINITY PROCESSESDeeply weathered fractured rock systems are somewhatcomplex (Jenkin and Dyson 1983). The deeply weatheredregolith overlies otherwise fractured rock at depth. This meansthe system behaves in two distinct ways. Firstly a very localsluggish GFS may operate in the deeply weathered regolith toproduce simple recharge discharge cells causing small areas ofsalinity at many different elevations. Secondly salinegroundwater from the regolith percolating to the underlyingfractured rock is transmitted down-slope to the lowerlandscape. Here groundwater pressures rise and the deepersystem becomes sub-artesian forcing saline groundwater to theland surface.Recharge occurs generally throughout the landscape, but canbe much higher where the fractured rock aquifer underlyingthe saprolite is exposed through erosion in the upper slopesand crests.
TABLE 26: SNAPSHOT OF THE LOCAL ANDINTERMEDIATE FLOW SYSTEMS IN DEEPLYWEATHERED FRACTURED ROCKS
Total Area of System (ha) 64,225Percentage of Wimmera Region 2.7%Area of Mapped Discharge (ha) 179Discharge as % of System 0.3%Discharge as % of Wimmera salinity 0.8%Woody Vegetation 11,587% of GFS 18.0%
2.10.3 ASSET THREATSThis GFS is a major contributor to saltloads and is responsiblefor most salt originating from the upper catchment. Locally itposes a threat to Green’s Swamp and is the cause of smallareas of saline discharge on agricultural land.
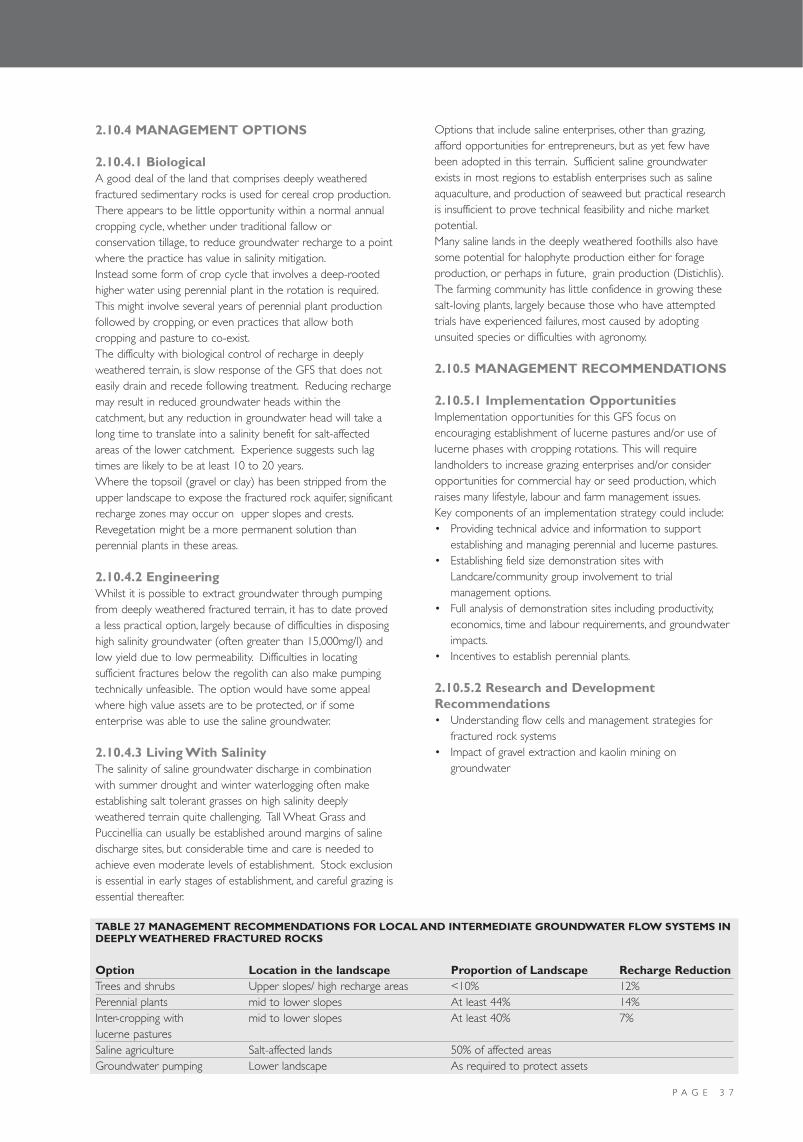
P A G E 3 7
2.10.4 MANAGEMENT OPTIONS
2.10.4.1 Biological A good deal of the land that comprises deeply weatheredfractured sedimentary rocks is used for cereal crop production.There appears to be little opportunity within a normal annualcropping cycle, whether under traditional fallow orconservation tillage, to reduce groundwater recharge to a pointwhere the practice has value in salinity mitigation.Instead some form of crop cycle that involves a deep-rootedhigher water using perennial plant in the rotation is required.This might involve several years of perennial plant productionfollowed by cropping, or even practices that allow bothcropping and pasture to co-exist.The difficulty with biological control of recharge in deeplyweathered terrain, is slow response of the GFS that does noteasily drain and recede following treatment. Reducing rechargemay result in reduced groundwater heads within thecatchment, but any reduction in groundwater head will take along time to translate into a salinity benefit for salt-affectedareas of the lower catchment. Experience suggests such lagtimes are likely to be at least 10 to 20 years.Where the topsoil (gravel or clay) has been stripped from theupper landscape to expose the fractured rock aquifer, significantrecharge zones may occur on upper slopes and crests.Revegetation might be a more permanent solution thanperennial plants in these areas.
2.10.4.2 Engineering Whilst it is possible to extract groundwater through pumpingfrom deeply weathered fractured terrain, it has to date proveda less practical option, largely because of difficulties in disposinghigh salinity groundwater (often greater than 15,000mg/l) andlow yield due to low permeability. Difficulties in locatingsufficient fractures below the regolith can also make pumpingtechnically unfeasible. The option would have some appealwhere high value assets are to be protected, or if someenterprise was able to use the saline groundwater.
2.10.4.3 Living With SalinityThe salinity of saline groundwater discharge in combinationwith summer drought and winter waterlogging often makeestablishing salt tolerant grasses on high salinity deeplyweathered terrain quite challenging. Tall Wheat Grass andPuccinellia can usually be established around margins of salinedischarge sites, but considerable time and care is needed toachieve even moderate levels of establishment. Stock exclusionis essential in early stages of establishment, and careful grazing isessential thereafter.
Options that include saline enterprises, other than grazing,afford opportunities for entrepreneurs, but as yet few havebeen adopted in this terrain. Sufficient saline groundwaterexists in most regions to establish enterprises such as salineaquaculture, and production of seaweed but practical researchis insufficient to prove technical feasibility and niche marketpotential.Many saline lands in the deeply weathered foothills also havesome potential for halophyte production either for forageproduction, or perhaps in future, grain production (Distichlis).The farming community has little confidence in growing thesesalt-loving plants, largely because those who have attemptedtrials have experienced failures, most caused by adoptingunsuited species or difficulties with agronomy.
2.10.5 MANAGEMENT RECOMMENDATIONS
2.10.5.1 Implementation OpportunitiesImplementation opportunities for this GFS focus onencouraging establishment of lucerne pastures and/or use oflucerne phases with cropping rotations. This will requirelandholders to increase grazing enterprises and/or consideropportunities for commercial hay or seed production, whichraises many lifestyle, labour and farm management issues.Key components of an implementation strategy could include:• Providing technical advice and information to support
establishing and managing perennial and lucerne pastures.• Establishing field size demonstration sites with
Landcare/community group involvement to trialmanagement options.
• Full analysis of demonstration sites including productivity,economics, time and labour requirements, and groundwaterimpacts.
• Incentives to establish perennial plants.
2.10.5.2 Research and DevelopmentRecommendations• Understanding flow cells and management strategies for
fractured rock systems• Impact of gravel extraction and kaolin mining on
groundwater
TABLE 27 MANAGEMENT RECOMMENDATIONS FOR LOCAL AND INTERMEDIATE GROUNDWATER FLOW SYSTEMS INDEEPLY WEATHERED FRACTURED ROCKS
Option Location in the landscape Proportion of Landscape Recharge ReductionTrees and shrubs Upper slopes/ high recharge areas <10% 12%Perennial plants mid to lower slopes At least 44% 14%Inter-cropping with mid to lower slopes At least 40% 7%lucerne pasturesSaline agriculture Salt-affected lands 50% of affected areasGroundwater pumping Lower landscape As required to protect assets
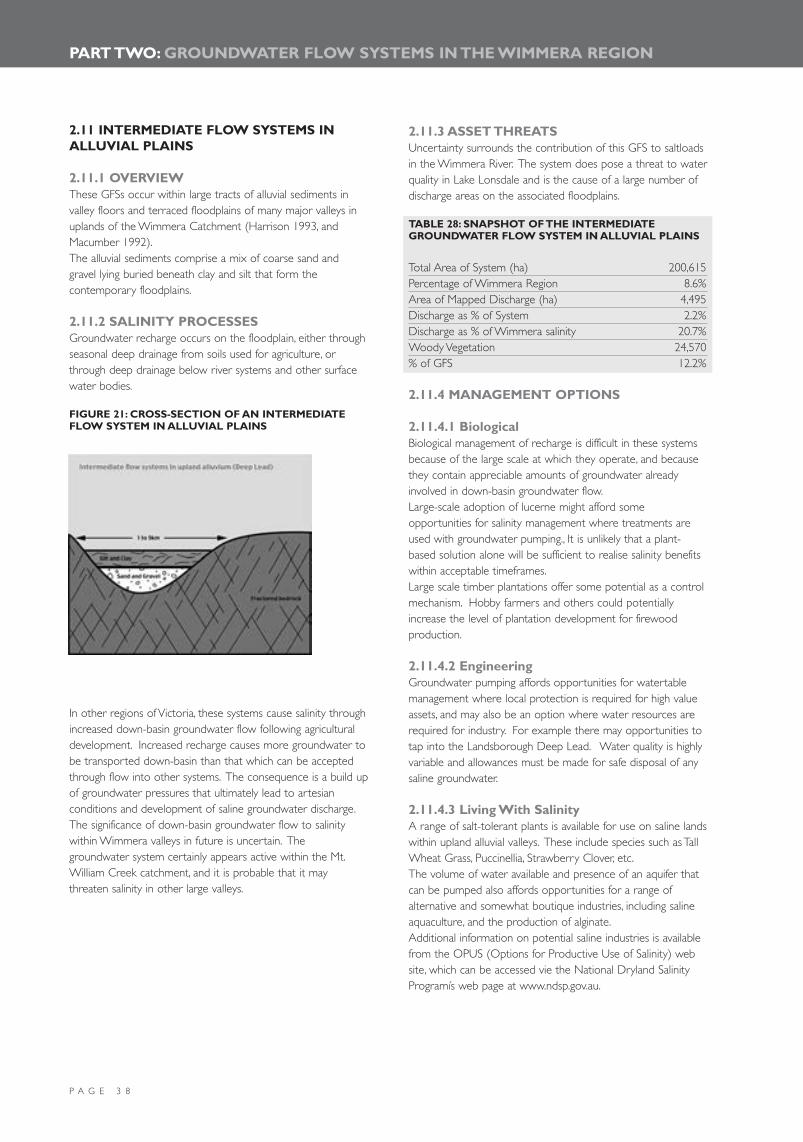
P A G E 3 8
PART TWO: GROUNDWATER FLOW SYSTEMS IN THE WIMMERA REGION
2.11 INTERMEDIATE FLOW SYSTEMS INALLUVIAL PLAINS
2.11.1 OVERVIEWThese GFSs occur within large tracts of alluvial sediments invalley floors and terraced floodplains of many major valleys inuplands of the Wimmera Catchment (Harrison 1993, andMacumber 1992).The alluvial sediments comprise a mix of coarse sand andgravel lying buried beneath clay and silt that form thecontemporary floodplains.
2.11.2 SALINITY PROCESSESGroundwater recharge occurs on the floodplain, either throughseasonal deep drainage from soils used for agriculture, orthrough deep drainage below river systems and other surfacewater bodies.
FIGURE 21: CROSS-SECTION OF AN INTERMEDIATEFLOW SYSTEM IN ALLUVIAL PLAINS
In other regions of Victoria, these systems cause salinity throughincreased down-basin groundwater flow following agriculturaldevelopment. Increased recharge causes more groundwater tobe transported down-basin than that which can be acceptedthrough flow into other systems. The consequence is a build upof groundwater pressures that ultimately lead to artesianconditions and development of saline groundwater discharge.The significance of down-basin groundwater flow to salinitywithin Wimmera valleys in future is uncertain. Thegroundwater system certainly appears active within the Mt.William Creek catchment, and it is probable that it maythreaten salinity in other large valleys.
2.11.3 ASSET THREATSUncertainty surrounds the contribution of this GFS to saltloadsin the Wimmera River. The system does pose a threat to waterquality in Lake Lonsdale and is the cause of a large number ofdischarge areas on the associated floodplains.
TABLE 28: SNAPSHOT OF THE INTERMEDIATEGROUNDWATER FLOW SYSTEM IN ALLUVIAL PLAINS
Total Area of System (ha) 200,615Percentage of Wimmera Region 8.6%Area of Mapped Discharge (ha) 4,495Discharge as % of System 2.2%Discharge as % of Wimmera salinity 20.7%Woody Vegetation 24,570% of GFS 12.2%
2.11.4 MANAGEMENT OPTIONS
2.11.4.1 Biological Biological management of recharge is difficult in these systemsbecause of the large scale at which they operate, and becausethey contain appreciable amounts of groundwater alreadyinvolved in down-basin groundwater flow.Large-scale adoption of lucerne might afford someopportunities for salinity management where treatments areused with groundwater pumping., It is unlikely that a plant-based solution alone will be sufficient to realise salinity benefitswithin acceptable timeframes.Large scale timber plantations offer some potential as a controlmechanism. Hobby farmers and others could potentiallyincrease the level of plantation development for firewoodproduction.
2.11.4.2 Engineering Groundwater pumping affords opportunities for watertablemanagement where local protection is required for high valueassets, and may also be an option where water resources arerequired for industry. For example there may opportunities totap into the Landsborough Deep Lead. Water quality is highlyvariable and allowances must be made for safe disposal of anysaline groundwater.
2.11.4.3 Living With SalinityA range of salt-tolerant plants is available for use on saline landswithin upland alluvial valleys. These include species such as TallWheat Grass, Puccinellia, Strawberry Clover, etc.The volume of water available and presence of an aquifer thatcan be pumped also affords opportunities for a range ofalternative and somewhat boutique industries, including salineaquaculture, and the production of alginate.Additional information on potential saline industries is availablefrom the OPUS (Options for Productive Use of Salinity) website, which can be accessed vie the National Dryland SalinityProgramís web page at www.ndsp.gov.au.
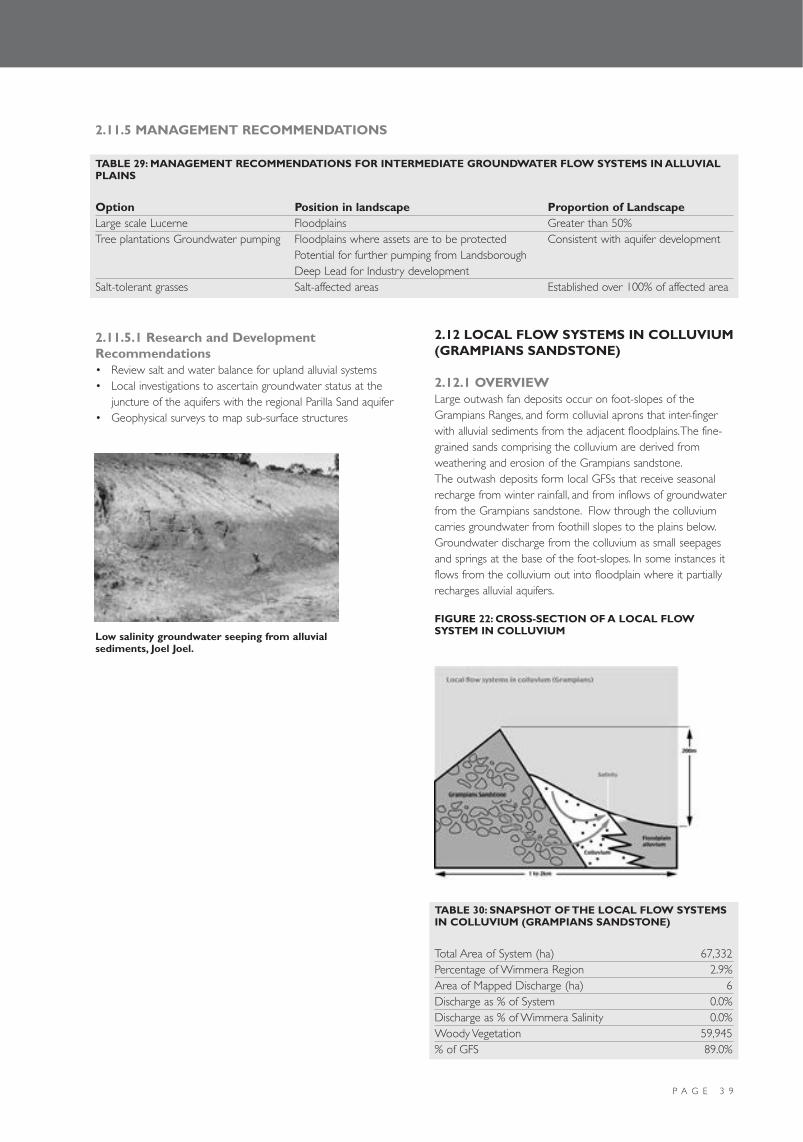
2.11.5 MANAGEMENT RECOMMENDATIONS
2.11.5.1 Research and DevelopmentRecommendations• Review salt and water balance for upland alluvial systems• Local investigations to ascertain groundwater status at the
juncture of the aquifers with the regional Parilla Sand aquifer• Geophysical surveys to map sub-surface structures
P A G E 3 9
2.12 LOCAL FLOW SYSTEMS IN COLLUVIUM(GRAMPIANS SANDSTONE)
2.12.1 OVERVIEWLarge outwash fan deposits occur on foot-slopes of theGrampians Ranges, and form colluvial aprons that inter-fingerwith alluvial sediments from the adjacent floodplains.The fine-grained sands comprising the colluvium are derived fromweathering and erosion of the Grampians sandstone.The outwash deposits form local GFSs that receive seasonalrecharge from winter rainfall, and from inflows of groundwaterfrom the Grampians sandstone. Flow through the colluviumcarries groundwater from foothill slopes to the plains below.Groundwater discharge from the colluvium as small seepagesand springs at the base of the foot-slopes. In some instances itflows from the colluvium out into floodplain where it partiallyrecharges alluvial aquifers.
FIGURE 22: CROSS-SECTION OF A LOCAL FLOWSYSTEM IN COLLUVIUM
TABLE 30: SNAPSHOT OF THE LOCAL FLOW SYSTEMSIN COLLUVIUM (GRAMPIANS SANDSTONE)
Total Area of System (ha) 67,332Percentage of Wimmera Region 2.9%Area of Mapped Discharge (ha) 6Discharge as % of System 0.0%Discharge as % of Wimmera Salinity 0.0%Woody Vegetation 59,945% of GFS 89.0%
TABLE 29: MANAGEMENT RECOMMENDATIONS FOR INTERMEDIATE GROUNDWATER FLOW SYSTEMS IN ALLUVIALPLAINS
Option Position in landscape Proportion of LandscapeLarge scale Lucerne Floodplains Greater than 50%Tree plantations Groundwater pumping Floodplains where assets are to be protected Consistent with aquifer development
Potential for further pumping from LandsboroughDeep Lead for Industry development
Salt-tolerant grasses Salt-affected areas Established over 100% of affected area
Low salinity groundwater seeping from alluvialsediments, Joel Joel.
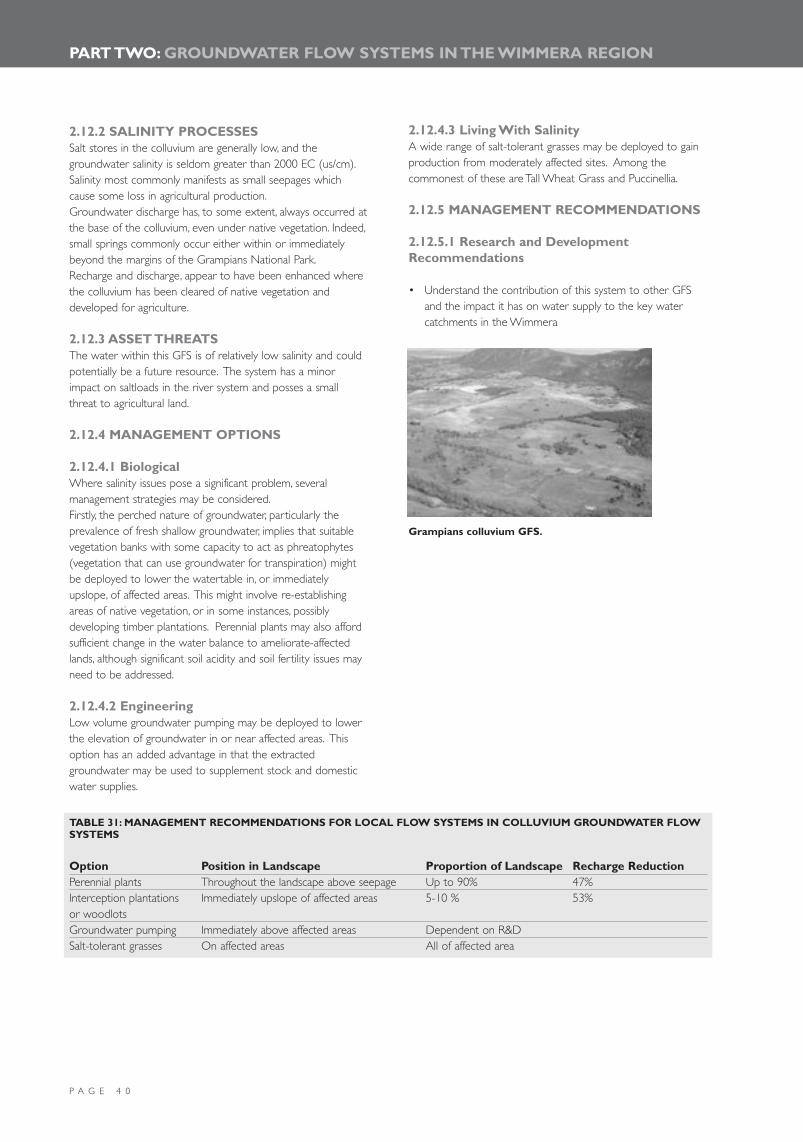
P A G E 4 0
PART TWO: GROUNDWATER FLOW SYSTEMS IN THE WIMMERA REGION
2.12.2 SALINITY PROCESSESSalt stores in the colluvium are generally low, and thegroundwater salinity is seldom greater than 2000 EC (us/cm).Salinity most commonly manifests as small seepages whichcause some loss in agricultural production.Groundwater discharge has, to some extent, always occurred atthe base of the colluvium, even under native vegetation. Indeed,small springs commonly occur either within or immediatelybeyond the margins of the Grampians National Park.Recharge and discharge, appear to have been enhanced wherethe colluvium has been cleared of native vegetation anddeveloped for agriculture.
2.12.3 ASSET THREATSThe water within this GFS is of relatively low salinity and couldpotentially be a future resource. The system has a minorimpact on saltloads in the river system and posses a smallthreat to agricultural land.
2.12.4 MANAGEMENT OPTIONS
2.12.4.1 Biological Where salinity issues pose a significant problem, severalmanagement strategies may be considered.Firstly, the perched nature of groundwater, particularly theprevalence of fresh shallow groundwater, implies that suitablevegetation banks with some capacity to act as phreatophytes(vegetation that can use groundwater for transpiration) mightbe deployed to lower the watertable in, or immediatelyupslope, of affected areas. This might involve re-establishingareas of native vegetation, or in some instances, possiblydeveloping timber plantations. Perennial plants may also affordsufficient change in the water balance to ameliorate-affectedlands, although significant soil acidity and soil fertility issues mayneed to be addressed.
2.12.4.2 Engineering Low volume groundwater pumping may be deployed to lowerthe elevation of groundwater in or near affected areas. Thisoption has an added advantage in that the extractedgroundwater may be used to supplement stock and domesticwater supplies.
2.12.4.3 Living With SalinityA wide range of salt-tolerant grasses may be deployed to gainproduction from moderately affected sites. Among thecommonest of these are Tall Wheat Grass and Puccinellia.
2.12.5 MANAGEMENT RECOMMENDATIONS
2.12.5.1 Research and DevelopmentRecommendations
• Understand the contribution of this system to other GFSand the impact it has on water supply to the key watercatchments in the Wimmera
TABLE 31: MANAGEMENT RECOMMENDATIONS FOR LOCAL FLOW SYSTEMS IN COLLUVIUM GROUNDWATER FLOWSYSTEMS
Option Position in Landscape Proportion of Landscape Recharge ReductionPerennial plants Throughout the landscape above seepage Up to 90% 47%Interception plantations Immediately upslope of affected areas 5-10 % 53%or woodlotsGroundwater pumping Immediately above affected areas Dependent on R&DSalt-tolerant grasses On affected areas All of affected area
Grampians colluvium GFS.
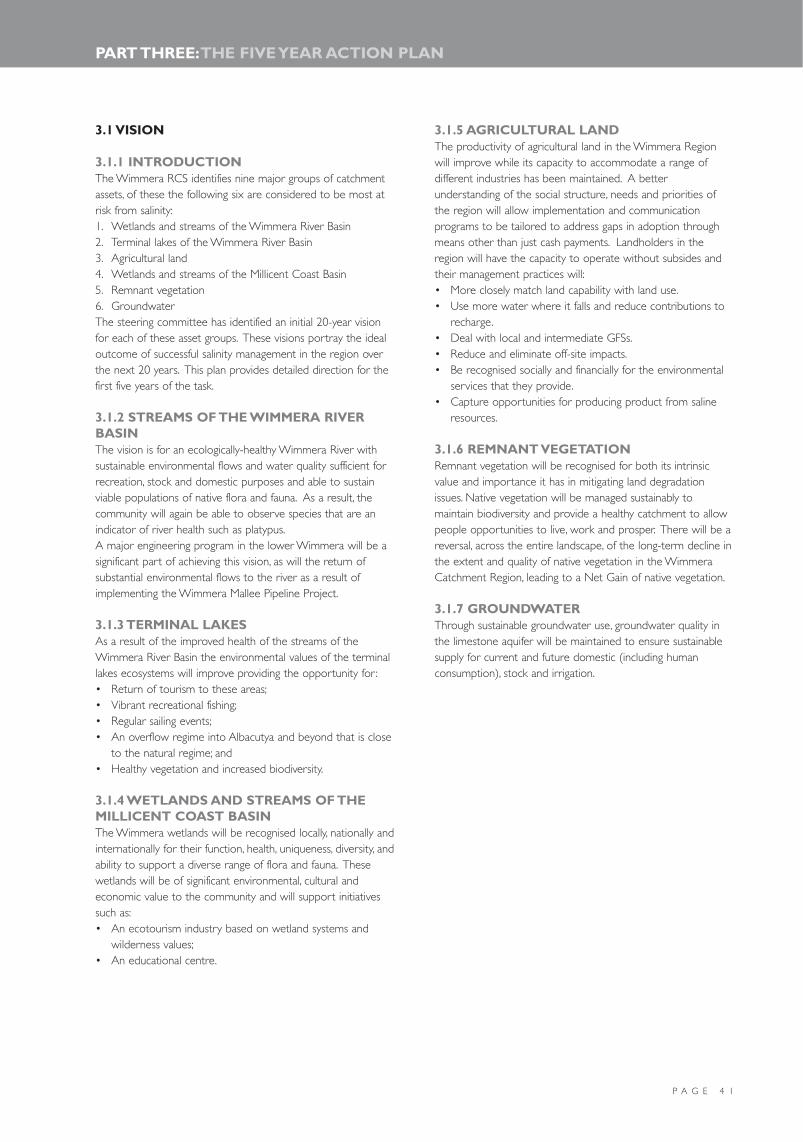
P A G E 4 1
PART THREE:THE FIVE YEAR ACTION PLAN
3.1 VISION
3.1.1 INTRODUCTIONThe Wimmera RCS identifies nine major groups of catchmentassets, of these the following six are considered to be most atrisk from salinity:1. Wetlands and streams of the Wimmera River Basin2. Terminal lakes of the Wimmera River Basin3. Agricultural land4. Wetlands and streams of the Millicent Coast Basin5. Remnant vegetation6. GroundwaterThe steering committee has identified an initial 20-year visionfor each of these asset groups. These visions portray the idealoutcome of successful salinity management in the region overthe next 20 years. This plan provides detailed direction for thefirst five years of the task.
3.1.2 STREAMS OF THE WIMMERA RIVERBASINThe vision is for an ecologically-healthy Wimmera River withsustainable environmental flows and water quality sufficient forrecreation, stock and domestic purposes and able to sustainviable populations of native flora and fauna. As a result, thecommunity will again be able to observe species that are anindicator of river health such as platypus.A major engineering program in the lower Wimmera will be asignificant part of achieving this vision, as will the return ofsubstantial environmental flows to the river as a result ofimplementing the Wimmera Mallee Pipeline Project.
3.1.3 TERMINAL LAKESAs a result of the improved health of the streams of theWimmera River Basin the environmental values of the terminallakes ecosystems will improve providing the opportunity for:• Return of tourism to these areas;• Vibrant recreational fishing;• Regular sailing events;• An overflow regime into Albacutya and beyond that is close
to the natural regime; and• Healthy vegetation and increased biodiversity.
3.1.4 WETLANDS AND STREAMS OF THEMILLICENT COAST BASINThe Wimmera wetlands will be recognised locally, nationally andinternationally for their function, health, uniqueness, diversity, andability to support a diverse range of flora and fauna. Thesewetlands will be of significant environmental, cultural andeconomic value to the community and will support initiativessuch as:• An ecotourism industry based on wetland systems and
wilderness values;• An educational centre.
3.1.5 AGRICULTURAL LANDThe productivity of agricultural land in the Wimmera Regionwill improve while its capacity to accommodate a range ofdifferent industries has been maintained. A betterunderstanding of the social structure, needs and priorities ofthe region will allow implementation and communicationprograms to be tailored to address gaps in adoption throughmeans other than just cash payments. Landholders in theregion will have the capacity to operate without subsides andtheir management practices will:• More closely match land capability with land use.• Use more water where it falls and reduce contributions to
recharge.• Deal with local and intermediate GFSs.• Reduce and eliminate off-site impacts.• Be recognised socially and financially for the environmental
services that they provide.• Capture opportunities for producing product from saline
resources.
3.1.6 REMNANT VEGETATIONRemnant vegetation will be recognised for both its intrinsicvalue and importance it has in mitigating land degradationissues. Native vegetation will be managed sustainably tomaintain biodiversity and provide a healthy catchment to allowpeople opportunities to live, work and prosper. There will be areversal, across the entire landscape, of the long-term decline inthe extent and quality of native vegetation in the WimmeraCatchment Region, leading to a Net Gain of native vegetation.
3.1.7 GROUNDWATERThrough sustainable groundwater use, groundwater quality inthe limestone aquifer will be maintained to ensure sustainablesupply for current and future domestic (including humanconsumption), stock and irrigation.

InvestmentClassificationImplementation
Research andDevelopment
Co-investment
Groundwater Flow System
Local flow systems in deeplyweathered granite (low relief)Local flow systems in highly fracturedrocksLocal and intermediate flow systemsin deeply weathered fractured rock.
Regional flow systems in Parilla SandsLocal flow systems in weatheredgranite (high relief)Intermediate flow systems in alluvialplainsLocal flow systems in colluvium(Grampians Sandstone)
Local flow systems in sand dunes(Lowan Sands)Local flow systems in WoorinensedimentsIntermediate flow systems infractured rocks
Rationale
These GFSs pose a major threat to key assets, management optionsare relatively well understood and have the potential to influence thesystem in the short term.While there are still some R&D questions relating to these systemsthey would be the focus for public investment in implementationinitiatives.
While these GFSs pose significant threats to key assets there is limitedcapacity of current management options to influence these systems.If assets are to be protected in the long term management optionswill need to be developed for these GFSs. Therefore these systemswill be the focus for public investment in R&D
These systems pose limited threats to public assets, however availablemanagement options could have a significant influence in the veryshort term.Public investment in these systems should focus providing informationand initiatives to facilitate private investment for private gain.These systems provide the potential for quick benefits for broadersalinity management in the Wimmera region.
TABLE 32: INVESTMENT CLASSIFICATION OF WIMMERA REGION GROUNDWATER FLOW SYSTEMS
P A G E 4 2
PART THREE:THE FIVE YEAR ACTION PLAN
3.2 INVESTMENT CLASSIFICATION OFGROUNDWATER FLOW SYSTEMS
3.2.1 INVESTMENT CLASSIFICATIONFRAMEWORK
3.2.1.1 Groundwater Flow SystemCharacteristicsEach GFS in the Wimmera was assessed on the basis of thefollowing four key characteristics:1. Asset threat - the contribution of the GFS to saltloads in
the Wimmera River and/or threat posed to significantcatchment assets.
2. Public Benefit - the proportion of benefits which accrue tothe public from managing the GFS.
3. Capacity to influence - the technical, social and economiccapacity of available management options to influence theGFS.
4. Timeframe - the timeframe required for managementoptions to have a measurable impact on the GFS.• Very Short Term - 1 to 10 years• Short Term - 10 to 30 years• Medium Term - 30 to 50 years• Long Term - 50 to 100 plus years
3.2.1.2 Investment ClassificationsThe investment classification for each GFS was then set on thebasis of a mix of characteristics.• Implementation (priority GFS for strategic public investment
in implementation initiatives) - GFS is a major contributor tosaltloads and/or poses a major threat to a significant asset.There is medium to significant capacity to influence the GFSin the short to medium term and benefits will largely accrueto the public.
• Research and Development - GFS is a major contributor tosaltloads and/or poses a major threat to a significant asset.However there is limited capacity to influence the GFSand/or any influence will occur over the medium to longterm; or- GFS is a medium contributor to saltloads and/or poses a
medium threat to a significant asset and there is mediumto significant capacity to influence the GFS in the shortto medium term.
• Co-Investment - GFS is a medium to low contributor tosaltloads and/or poses a medium to low threat to asignificant asset, the timeframe for influence is in themedium to long term and/or the benefits largely accrue toprivate individuals. Future salinity management investmentwill focus on providing support to encourage and facilitateinvestment and implementation of works by privatelandholders and other funding sources. This could includeinvestment in demonstration, communication and extensionactivities.
Table 32 provides a summary of the investmentclassification of each GFS and rationale behind theclassification. Further detail on the assessmentagainst each GFS characteristic is provided inTable 33.

P A G E 4 3
GFS
Local flowsystems in sanddunes (LowanSands North)
Local flowsystems in sanddunes (LowanSands South)
Local flowsystems inWoorinensediments
Regional flowsystems in ParillaSands
Regional flowsystems in ParillaSands (MillicentCoast Basin)
Local flowsystems inweatheredgranites (highrelief)
Local flowsystems in deeplyweatheredgranites (lowrelief)
Local flowsystems in highlyfractured rocks
Intermediateflow systems infractured rocks
Local andintermediateflow systems indeeplyweatheredfractured rocks
Asset Threat
MinorSome loss of agricultural land indepressions and limited threat tonative vegetation
Minor to MediumPoses some threat to LakeWallace, Edenhope water supplyand Mosquito Creek
MinorSmall areas of agricultural landand some remnant vegetation inlow lying areas.Potentially some overland flow tocreeks in wet years
MajorMajor contributor of saltloads tothe Wimmera River. Posesthreats to wetlands in the regionand Lake Hindmarsh. Cause ofurban salinity in the Jeparit area.
Medium to MajorPoses threats to wetlands inEdenhope area, Lake Wallace andMosquito Creek.
Minor to MediumLess salt in landscape so overallnot a major contributor, howevermay pose a threat to somesmaller creeks and tributaries.Some agricultural landthreatened at break of slope
MajorMajor contributor to saltloadsand potential risk to surfacewater quality. Some early signs ofurban salinity around Stawell
MajorSignificant contribution tosaltloads and threat to high valueagricultural land, includingvineyards. Also poses a threat toriparian vegetation
MediumMaking a contribution to saltloadsbut not as significant as otherGFS. Threat to base flow waterquality
Limited threat to agricultural landMajorContributes most of the saltoriginating from the uppercatchment. Poses a threat toGreens swamp and is the causeof small discharge areas
% BenefitsAccruing tothe Public5%
35%
10%
90%+
90%
90%
80%
75%
90%
70%
Capacity to Influence
SignificantSome social constraints due toabsentee landholders
MediumNot as well understood as thenorthern area. Limitedcommunity drive to tackleproblem and a lack ofinfrastructure to tackle clayspreading
Medium to SignificantWell understood technically butthere are economic and socialconstraints to incorporatinglucerne into cropping system
LimitedMajor options involve engineeringinterventions and there are manyR&D questions unanswered
MediumPotential for surface drainage andsome revegetation opportunities
MediumGroundwater interception is stillin the trial phase and is capitalintensive. Other options mayreduce run-off in an area wheresurface water is a significant asset
MediumMuch of the area has poor soilsand granite outcrops which maylimit the capacity to establishperennial plant and trees
Medium to SignificantFurther R&D required on theability of native pastures toinfluence the system.
LimitedLong flow paths and inertia inthese systems. System not verywell understood in the Wimmera
MediumFurther R&D required to identifysuitable locations for lucerne andinterceptor belts and need todeal with economic and socialconstraints to lucerne adoption.
Timescale forInfluence
Very Short Term
Very Short Term
Very Short Term
Long Term
Short to Medium Term
Short Term
Short to Medium Term
Short Term
Long Term
Short Term
InvestmentClassification
Co-Investment
Co-Investment
Co-Investment
R&D
Implementation/R&D
R&D
Implementation
Implementation
Co-Investment
Implementation
TABLE 33:ASSESSMENT OF THE CHARACTERISTICS AND PRIORITY LEVELS OF GROUNDWATER FLOW SYSTEMS INTHE WIMMERA

P A G E 4 4
PART THREE:THE FIVE YEAR ACTION PLAN
3.3 HOW IS IT ALL GOING TO HAPPEN?
The plan for the future is based on the following four majorcomponents:1. Management Arrangements2. Implementation Strategy3. Research and Development Needs4. Monitoring and Evaluation
3.3.1 MANAGEMENT ARRANGEMENTS
3.3.1.1 Current ArrangementsManagement of the previous Wimmera Catchment Salinity Planwas co-ordinated through the CMA with funding allocationsand monitoring of implementation undertaken by the LandIssues FC. Technical expertise and services to supportimplementation were provided by the Catchment andAgricultural Services division of DPI and hydrogeologicalsupport was provided by CLPR and SKM.To support the review of the previous plan and developmentof a second generation plan a steering committee has beenestablished which includes representatives from:• Wimmera CMA Board• Land Issues Committee• DPI• Wimmera CMA staff• Grampians Wimmera Mallee Water Authority• Hydrogeological input from CLPR and SKM on an
as-needed basisThis steering committee has provided a forum for the range ofpotential stakeholders/providers in the new plan. The grouphas shared knowledge and understanding, developed ownershipof the process and, as such, provides a useful model for futuremanagement arrangements.
3.3.1.2 Future Management ModelThe proposed model builds on strengths of the currentmanagement arrangements and strengthens the steeringcommittee’s role in providing technical direction. The keycomponents of this management model are:CMASet catchment priorities through the RCS, establish budgets, co-ordinate implementation of the plan by providing executivesupport to the Land Issues FC, monitor strategic direction andcommunicate to stakeholders and providers.Land Issues Functional CommitteeReceive advice and project bids from the technical group,allocate funds against priorities, provide advice to CMA duringpriority setting process, provide direction to the TechnicalGroup and monitor implementation against targets.Technical Working GroupConsisting of DPI, Hydrogeological providers, Land Issues FC,Program Manager and Research Manager. The group wouldmeet 3-4 times per year to share information/ideas acrossdisciplines, develop joint understanding, resolve technical issues,provide advice to Land Lssues FC and ensure technical merit ofproject bids submitted to this committee.
GFS
Intermediateflow systems inalluvial plains
Local flowsystems incolluvium -(GrampiansSandstone)
Asset Threat
MediumUncertain of the contribution tosaltloads in the Wimmera River,but poses a threat to the waterquality in Lake Lonsdale. Loss oflarge areas of agricultural land onthe floodplains
MinorSome threat to agricultural land.Low EC water in the system is apotentially a resource whichcould be utilised in the future
% BenefitsAccruing tothe Public75%
25%
Capacity to Influence
MediumUncertainties remain about thescale and hydraulics of thesystem. R&D required to gain abatter understanding of thesystem
SignificantOptions available for plantationforestry and groundwaterpumping
Timescale forInfluence
Medium Term
Short to Medium Term
InvestmentClassification
R&D
Co-Investment
TABLE 33 CONTINUED:ASSESSMENT OF THE CHARACTERISTICS AND PRIORITY LEVELS OF GROUNDWATER FLOWSYSTEMS IN THE WIMMERA
Staff involved in plan implementationon a field tour inspecting groundwaterpumping near Jeparit.
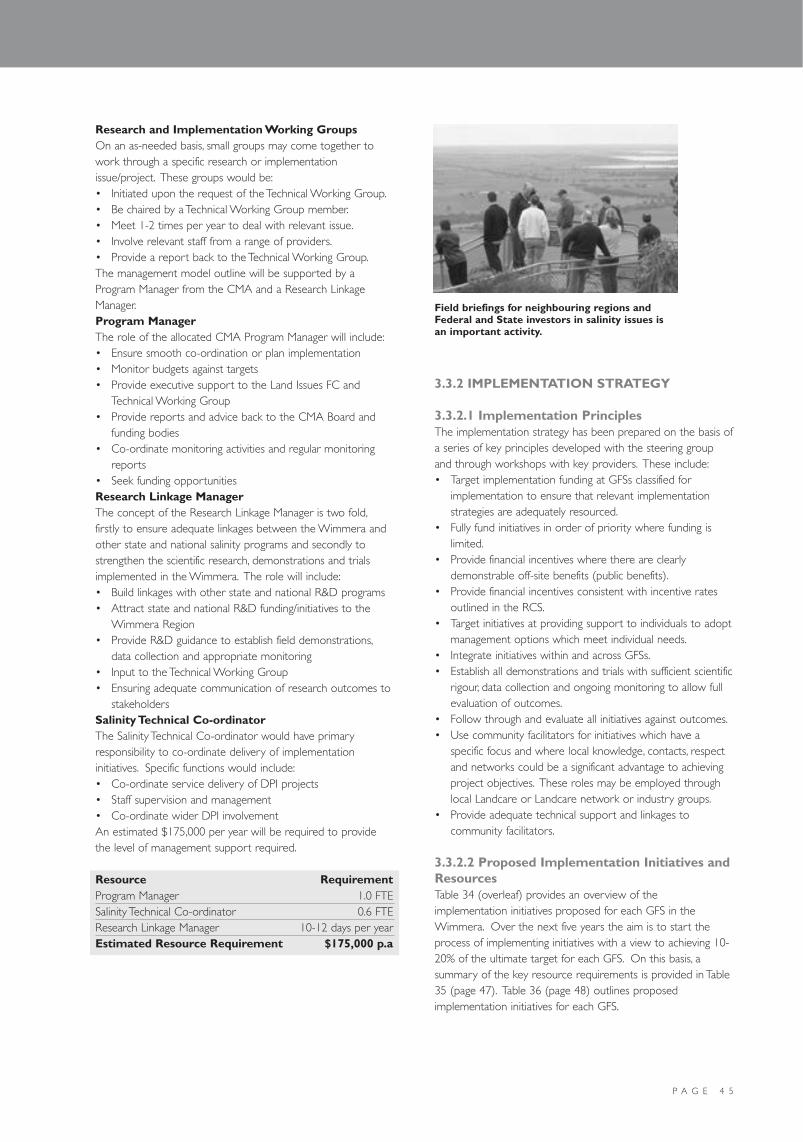
P A G E 4 5
Research and Implementation Working GroupsOn an as-needed basis, small groups may come together towork through a specific research or implementationissue/project. These groups would be:• Initiated upon the request of the Technical Working Group.• Be chaired by a Technical Working Group member.• Meet 1-2 times per year to deal with relevant issue.• Involve relevant staff from a range of providers.• Provide a report back to the Technical Working Group.The management model outline will be supported by aProgram Manager from the CMA and a Research LinkageManager.Program ManagerThe role of the allocated CMA Program Manager will include:• Ensure smooth co-ordination or plan implementation• Monitor budgets against targets• Provide executive support to the Land Issues FC and
Technical Working Group• Provide reports and advice back to the CMA Board and
funding bodies • Co-ordinate monitoring activities and regular monitoring
reports• Seek funding opportunitiesResearch Linkage ManagerThe concept of the Research Linkage Manager is two fold,firstly to ensure adequate linkages between the Wimmera andother state and national salinity programs and secondly tostrengthen the scientific research, demonstrations and trialsimplemented in the Wimmera. The role will include:• Build linkages with other state and national R&D programs• Attract state and national R&D funding/initiatives to the
Wimmera Region• Provide R&D guidance to establish field demonstrations,
data collection and appropriate monitoring• Input to the Technical Working Group• Ensuring adequate communication of research outcomes to
stakeholdersSalinity Technical Co-ordinatorThe Salinity Technical Co-ordinator would have primaryresponsibility to co-ordinate delivery of implementationinitiatives. Specific functions would include:• Co-ordinate service delivery of DPI projects• Staff supervision and management• Co-ordinate wider DPI involvement An estimated $175,000 per year will be required to providethe level of management support required.
Resource RequirementProgram Manager 1.0 FTESalinity Technical Co-ordinator 0.6 FTEResearch Linkage Manager 10-12 days per yearEstimated Resource Requirement $175,000 p.a
3.3.2 IMPLEMENTATION STRATEGY
3.3.2.1 Implementation PrinciplesThe implementation strategy has been prepared on the basis ofa series of key principles developed with the steering groupand through workshops with key providers. These include:• Target implementation funding at GFSs classified for
implementation to ensure that relevant implementationstrategies are adequately resourced.
• Fully fund initiatives in order of priority where funding islimited.
• Provide financial incentives where there are clearlydemonstrable off-site benefits (public benefits).
• Provide financial incentives consistent with incentive ratesoutlined in the RCS.
• Target initiatives at providing support to individuals to adoptmanagement options which meet individual needs.
• Integrate initiatives within and across GFSs.• Establish all demonstrations and trials with sufficient scientific
rigour, data collection and ongoing monitoring to allow fullevaluation of outcomes.
• Follow through and evaluate all initiatives against outcomes.• Use community facilitators for initiatives which have a
specific focus and where local knowledge, contacts, respectand networks could be a significant advantage to achievingproject objectives. These roles may be employed throughlocal Landcare or Landcare network or industry groups.
• Provide adequate technical support and linkages tocommunity facilitators.
3.3.2.2 Proposed Implementation Initiatives andResourcesTable 34 (overleaf) provides an overview of theimplementation initiatives proposed for each GFS in theWimmera. Over the next five years the aim is to start theprocess of implementing initiatives with a view to achieving 10-20% of the ultimate target for each GFS. On this basis, asummary of the key resource requirements is provided in Table35 (page 47). Table 36 (page 48) outlines proposedimplementation initiatives for each GFS.
Field briefings for neighbouring regions andFederal and State investors in salinity issues isan important activity.
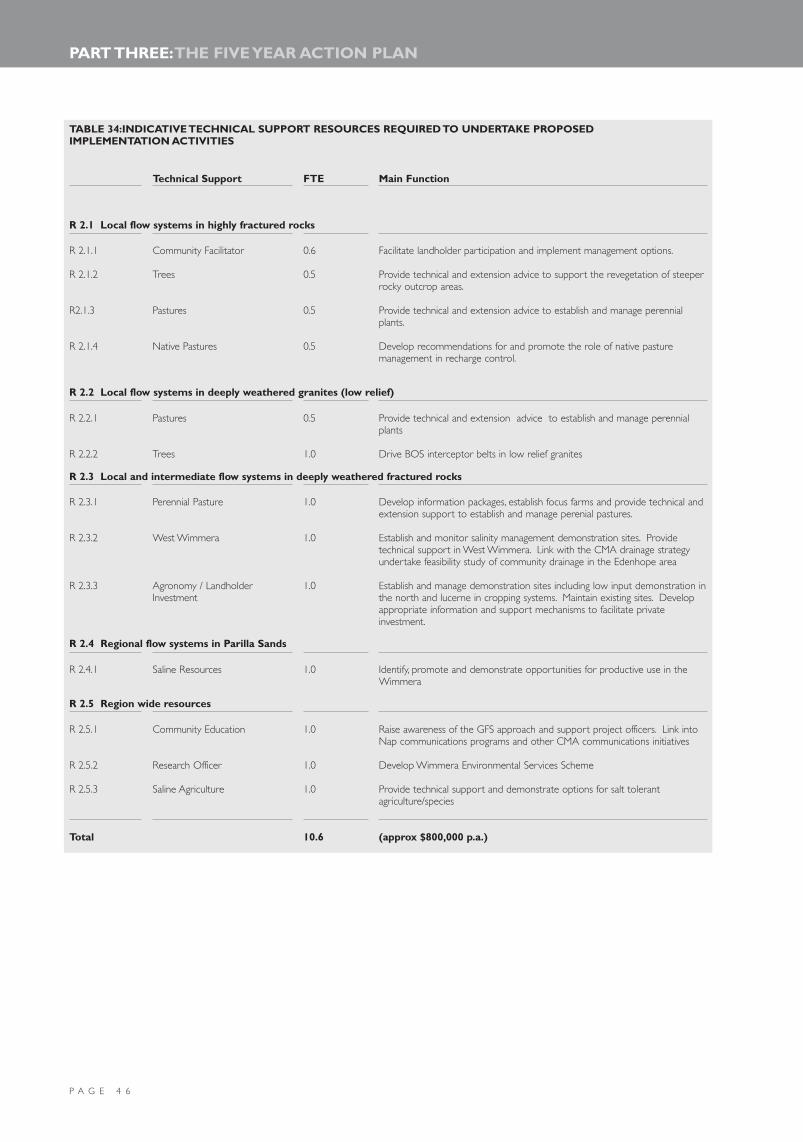
P A G E 4 6
PART THREE:THE FIVE YEAR ACTION PLAN
R 2.1.1
R 2.1.2
R2.1.3
R 2.1.4
R 2.2.1
R 2.2.2
R 2.3.1
R 2.3.2
R 2.3.3
R 2.4.1
R 2.5.1
R 2.5.2
R 2.5.3
Total
Technical Support
Community Facilitator
Trees
Pastures
Native Pastures
Pastures
Trees
Perennial Pasture
West Wimmera
Agronomy / LandholderInvestment
Saline Resources
Community Education
Research Officer
Saline Agriculture
FTE
0.6
0.5
0.5
0.5
0.5
1.0
1.0
1.0
1.0
1.0
1.0
1.0
1.0
10.6
Main Function
Facilitate landholder participation and implement management options.
Provide technical and extension advice to support the revegetation of steeperrocky outcrop areas.
Provide technical and extension advice to establish and manage perennialplants.
Develop recommendations for and promote the role of native pasturemanagement in recharge control.
Provide technical and extension advice to establish and manage perennialplants
Drive BOS interceptor belts in low relief granites
Develop information packages, establish focus farms and provide technical andextension support to establish and manage perenial pastures.
Establish and monitor salinity management demonstration sites. Providetechnical support in West Wimmera. Link with the CMA drainage strategyundertake feasibility study of community drainage in the Edenhope area
Establish and manage demonstration sites including low input demonstration inthe north and lucerne in cropping systems. Maintain existing sites. Developappropriate information and support mechanisms to facilitate privateinvestment.
Identify, promote and demonstrate opportunities for productive use in theWimmera
Raise awareness of the GFS approach and support project officers. Link intoNap communications programs and other CMA communications initiatives
Develop Wimmera Environmental Services Scheme
Provide technical support and demonstrate options for salt tolerantagriculture/species
(approx $800,000 p.a.)
TABLE 34:INDICATIVE TECHNICAL SUPPORT RESOURCES REQUIRED TO UNDERTAKE PROPOSEDIMPLEMENTATION ACTIVITIES
R 2.1 Local flow systems in highly fractured rocks
R 2.2 Local flow systems in deeply weathered granites (low relief)
R 2.3 Local and intermediate flow systems in deeply weathered fractured rocks
R 2.4 Regional flow systems in Parilla Sands
R 2.5 Region wide resources

P A G E 4 7
R 3.1.1
R 3.1.2
R3.2.1
R3.2.2
R 3.3.1
R 3.3.2
R 3.3.3
R 3.3.4
R 3.4.1
R3.4.2
R 3.5.1
R 3.6.1
R 3.6.2
R 3.6.3
Total
Activity
Revegetation grants - Trees
Environmental Services Scheme
Revegetation grants - BOS trees
Environmental Services Scheme
Revegetation grants - Pastures
Revegetation grants- Trees
Environmental Services Scheme
Applied R&D
Applied R&D
Applied R&D
Applied R&D
Communication Resources
Revegetation - Discharge
Applied R&D
Fundingrequiredover fiveyears ($)
1,000,000
250,000
330,000
50,000
250,000
550,000
60,000
50,000
100,000
50,000
30,000
100,000
60,000
80,000
2,960,000
Description
900ha of trees and native vegetation establishment and approximately 100kmof fencing.
Funding to support change in land use from agriculture to providingenvironmental services for public benefits
200ha of BOS plantations and 50km of fencing
Funding to support change in land use from agriculture to providingenvironmental services for public benefits
2,800ha of perennial pastures
500ha trees and native vegetation and 60km of fencing
Funding to support change in land use from agriculture to providingenvironmental services for public benefits
Develop information packages, establish focus farms to support theestablishment and management of perennial pastures.
Undertake initial feasibility study into potential for surface drainage schemes inthe Edenhope area
Establish and monitor salinity management demonstration sites.
Establish and manage demonstration sites including low input demonstration inthe north and lucerne in cropping systems. Maintain existing sites.
Develop and distribute communication materials
1,000ha of salt-tolerant species established on and around discharge sites
Establish & monitor demo sites for discharge management and saline agriculture
TABLE 35: INDICATIVE FIVE YEAR GRANT/WORKS BUDGET REQUIRED TO UNDERTAKE PROPOSED IMPLEMENTATIONACTIVITIES
R 3.1 Local flow systems in highly fractured rocks
R 3.2 Local flow systems in deeply weathered granites (low relief)
R 3.3 Local and intermediate flow systems in deeply weathered fractured rocks
R 3.4 Regional flow systems in Parilla (Edenhope area) and local flow systems in sand dunes (Lowan Sands south)
R 3.5 Local flow systems in sand dunes (Lowan Sands North) and local flow systems in Woorinen sediments
R 3.6 Region-wide resources

P A G E 4 8
PART THREE:THE FIVE YEAR ACTION PLAN
GFS Priority
Implementation
Implementation
Implementation
R&D
Implementation
R&D
Management Recom-mendations
Revegetation of non-arable areasNative pastures onsteeper slopes Perennial plants on lowerslopesSaline agriculturePumping for assetprotection
Perennial plantsRevegetation of highrecharge areasSaline agriculturePumping for assetprotection
Perennial plantsInterceptor beltsPumping for assetprotection
Groundwater pumpingNear river revegetationSaline agricultureProductive use of salineresources
Proposed Implementation Initiatives
R 4.1.1 Develop a regional framework for EnvironmentalService payments which adds local detail, credit values andassessment procedures to the state frameworkR 4.1.2 Local facilitator to identify relevant local landholders,involve them in a process of developing suitablemanagement options for their land and assistimplementation.R 4.1.3 Technical support to assist local facilitatorTrees/agro-forestryNative pasture managementPerennial plantsR 4.1.4 Incentives to establish interception beltsR 4.1.5 Develop and distribute 1:25000 GFS mapsR 4.1.6 Communicate the GFS approach and potential forlocal impact
R 4.2.1 Provide incentives for lucerne in high priority areas.Paid in two instalments based on the Mallee and NorthCentral modelsR 4.2.2 Perennial plants Technical Support OfficerDevelop information packageEstablish focus farms to cover grazing management, andcropping rotations with full production and economic figures.R 4.2.3 Technical support to identify high recharge areas fortrees and provide establishment advice and incentives.
R 4.3.1 Incentives for break of slope interceptor belts (useof higher rates where there are biodiversity or othermultiple benefits)R 4.3.2 Technical Support Officer - TreesEngage Landcare and other existing groupsIntegrate initiative into existing Local action plansIdentify BOS areas and landholdersOrganise logistics and physically drive projectBuild links with other vegetation initiativesR 4.3.3 General Perennial plant advice and information
R 4.4.1 Community Awareness/Education OfficerRaise awareness of GFS approachWork with Landcare groups, media & schoolsProvide support to program managersInitial focus on priority GFSsR 4.4.2 West Wimmera Technical Support OfficerSupport CMA Drainage Strategy and develop options forEdenhope areaEstablish and maintain clay spreading demonstration sitesPromote agro-forestry and pasture opportunitiesPromote saline agriculture opportunitiesR 4.4.3 Build linkages to pipeline project & identifyappropriate environmental flowsR 4.4.4 Technical Support - Productive Use of SalineResourcesIdentify Wimmera opportunitiesPromote new industries/opportunitiesDemonstration sites for new industries
Linkages
Stateenvironmentalservicesproject
Region-widecommunicationprogram
Othervegetationplans
Pastureextension inother Gasís
CMACommunications,Waterwatch
CMACommunityDrainageStrategy
Pipeline Project
Existing NHTproject
ResourceRequirements
Full timeresearch officerfor 2 years
3 days/weekfor 5 years
Full timeproject officerfor 3 years
Full time for 5years
3 days perweek for 3years
Full time for 5years
Full timeproject officerfor 5 years
TABLE 36: PROPOSED IMPLEMENTATION INITIATIVES FOR EACH GROUNDWATER FLOW SYSTEM
R 4.1 Local flow systems in highly fractured rocks
R 4.2 Local and intermediate flow systems in deeply weathered fractured rocks
R 4.3 Local flow systems in deeply weathered granites (low relief)
R 4.4 Regional flow systems in Parilla Sands

P A G E 4 9
GFS Priority
R&D
R&D
Co invest
Co invest
Co Invest
Management Recom-mendations
Perennial plantsGroundwater interceptiontree beltsGroundwater pumping(interception)
Large scale deep rootedperennial plantestablishmentTimber plantationsGroundwater pumpingSalt tolerant grasses
Agro-forestry -interceptionClay spreadingProtection of remnantsEstablishshelterbelts/corridorsLucerne/Tagasaste
Agro-forestry -interceptionClay spreadingLucerne
LucerneAgro-forestry -interceptionImproved surface drainage
Proposed Implementation Initiatives
R 4.5.1 Incentives for groundwater pumping if researchproves favourableR 4.5.2 General technical support for BOS interceptorbelts/farm forestryR 4.5.3 Incentives to establish interception beltsR 4.5.4 General Perennial plant advice
R 4.6.1 Lucerne Technical Support OfficerR 4.6.2 General perennial plant technical supportR 4.6.3 Tech support - trees/farm forestry
R 4.7.1 Establish and manage a low input demonstrationsite for agro-forestry interceptionR 4.7.2 Provide clay spreading information & technicalsupportR 4.7.3 Develop support mechanisms for clay spreadingincluding equipment sharing options and encourageprovision of interest rate support
R 4.8.1 Build linkages with plantation companiesR 4.8.2 Establish 2-3 demonstration sites & subsequentinformation packages
R 4.9.1 Establish links to WM pipeline farm planningprogramR 4.9.2 Establish demonstration sites includinghigh water use cropsAgro-forestryLucerne & stock managementR 4.9.3 General lucerne extension support
Linkages
Pumping R&Dproject
clay spreadingresearch in SA
ResourceRequirements
TABLE 36 CONTINUED: PROPOSED IMPLEMENTATION INITIATIVES FOR EACH GROUNDWATER FLOW SYSTEM
R 4.5 Local flow systems in weathered granite (high relief)
R 4.6 Intermediate flow systems in alluvial plains
R 4.7 Local flow systems in sand dunes (Lowan Sands Nth)
R 4.8 Local flow systems in sand dunes (Lowan Sands South)
R 4.9 Local flow systems in Woorinen sediments
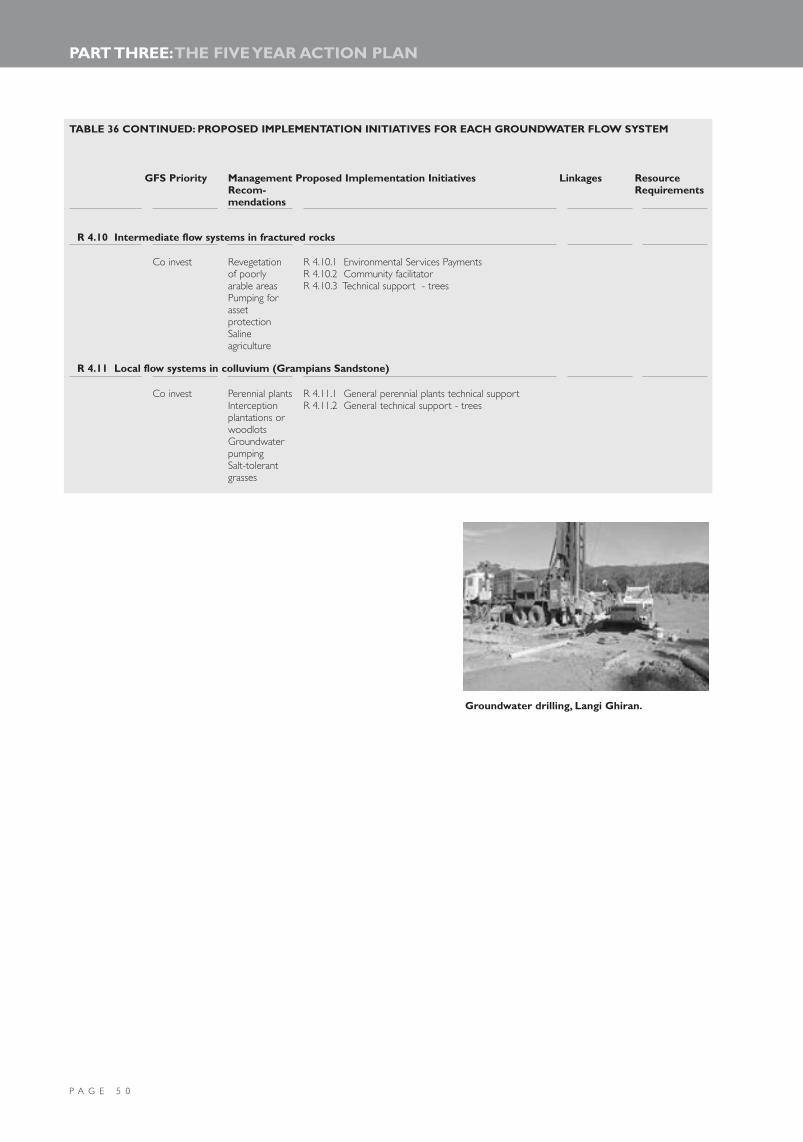
P A G E 5 0
PART THREE:THE FIVE YEAR ACTION PLAN
GFS Priority
Co invest
Co invest
ManagementRecom-mendations
Revegetationof poorlyarable areasPumping forassetprotectionSalineagriculture
Perennial plantsInterceptionplantations orwoodlotsGroundwaterpumpingSalt-tolerantgrasses
Proposed Implementation Initiatives
R 4.10.1 Environmental Services PaymentsR 4.10.2 Community facilitatorR 4.10.3 Technical support - trees
R 4.11.1 General perennial plants technical supportR 4.11.2 General technical support - trees
Linkages ResourceRequirements
TABLE 36 CONTINUED: PROPOSED IMPLEMENTATION INITIATIVES FOR EACH GROUNDWATER FLOW SYSTEM
R 4.10 Intermediate flow systems in fractured rocks
R 4.11 Local flow systems in colluvium (Grampians Sandstone)
Groundwater drilling, Langi Ghiran.
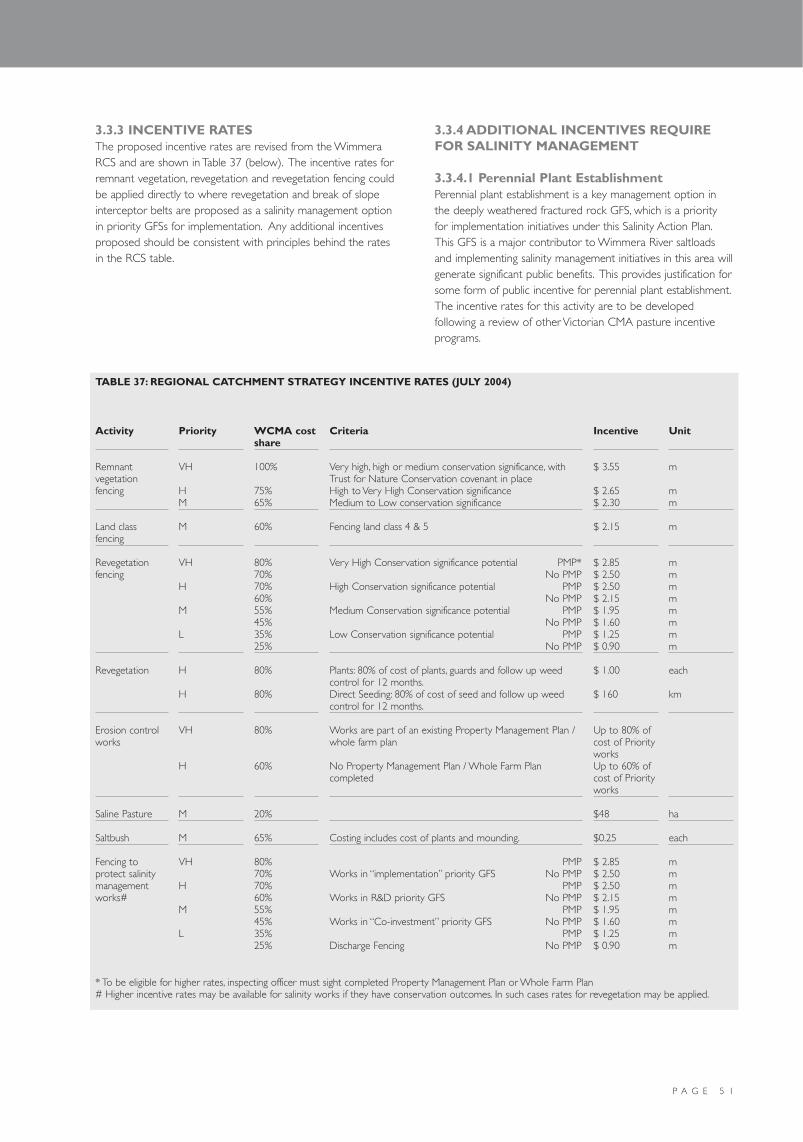
P A G E 5 1
3.3.3 INCENTIVE RATESThe proposed incentive rates are revised from the WimmeraRCS and are shown in Table 37 (below). The incentive rates forremnant vegetation, revegetation and revegetation fencing couldbe applied directly to where revegetation and break of slopeinterceptor belts are proposed as a salinity management optionin priority GFSs for implementation. Any additional incentivesproposed should be consistent with principles behind the ratesin the RCS table.
3.3.4 ADDITIONAL INCENTIVES REQUIREFOR SALINITY MANAGEMENT
3.3.4.1 Perennial Plant EstablishmentPerennial plant establishment is a key management option inthe deeply weathered fractured rock GFS, which is a priorityfor implementation initiatives under this Salinity Action Plan.This GFS is a major contributor to Wimmera River saltloadsand implementing salinity management initiatives in this area willgenerate significant public benefits. This provides justification forsome form of public incentive for perennial plant establishment.The incentive rates for this activity are to be developedfollowing a review of other Victorian CMA pasture incentiveprograms.
Activity
Remnantvegetationfencing
Land classfencing
Revegetationfencing
Revegetation
Erosion controlworks
Saline Pasture
Saltbush
Fencing toprotect salinitymanagementworks#
Priority
VH
HM
M
VH
H
M
L
H
H
VH
H
M
M
VH
H
M
L
WCMA costshare
100%
75%65%
60%
80%70%70%60%55%45%35%25%
80%
80%
80%
60%
20%
65%
80%70%70%60%55%45%35%25%
Criteria
Very high, high or medium conservation significance, withTrust for Nature Conservation covenant in placeHigh to Very High Conservation significance Medium to Low conservation significance
Fencing land class 4 & 5
Very High Conservation significance potential PMP*No PMP
High Conservation significance potential PMPNo PMP
Medium Conservation significance potential PMPNo PMP
Low Conservation significance potential PMPNo PMP
Plants: 80% of cost of plants, guards and follow up weedcontrol for 12 months.Direct Seeding: 80% of cost of seed and follow up weedcontrol for 12 months.
Works are part of an existing Property Management Plan /whole farm plan
No Property Management Plan / Whole Farm Plancompleted
Costing includes cost of plants and mounding.
PMPWorks in “implementation” priority GFS No PMP
PMPWorks in R&D priority GFS No PMP
PMPWorks in “Co-investment” priority GFS No PMP
PMPDischarge Fencing No PMP
Incentive
$ 3.55
$ 2.65$ 2.30
$ 2.15
$ 2.85 $ 2.50$ 2.50 $ 2.15$ 1.95$ 1.60$ 1.25$ 0.90
$ 1.00
$ 160
Up to 80% ofcost of Priorityworks Up to 60% ofcost of Priorityworks
$48
$0.25
$ 2.85 $ 2.50$ 2.50 $ 2.15$ 1.95$ 1.60$ 1.25$ 0.90
Unit
m
mm
m
mmmmmmmm
each
km
ha
each
mmmmmmmm
TABLE 37: REGIONAL CATCHMENT STRATEGY INCENTIVE RATES (JULY 2004)
* To be eligible for higher rates, inspecting officer must sight completed Property Management Plan or Whole Farm Plan# Higher incentive rates may be available for salinity works if they have conservation outcomes. In such cases rates for revegetation may be applied.

P A G E 5 2
PART THREE:THE FIVE YEAR ACTION PLAN
3.3.5 RESEARCH AND DEVELOPMENTNEEDS
3.3.5.1 GFS Knowledge Gaps and Research andDevelopment NeedsThe R&D background paper discusses the knowledge gaps andR&D needs for each GFS. These are summarised in Table 38(page 55).
3.3.5.2 Priority Research and DevelopmentNeedsThe priority needs for R&D within the Wimmera focus onidentifying the salt and water balance of both catchments andGFSs. Groundwater systems can be grouped into three broadcategories on the basis of the current information base andunderstanding of salinity processes:1. Well Understood - systems where the information base
and understanding of salinity processes is sufficiently welladvanced to be confident in recommending salinitymanagement strategies.
2. Developing Understanding - systems where processesof salt generation are clear but their ability to be managed isuncertain.
3. Theoretical - groundwater systems where understandingof both landscape processes and their potential to bemanaged for salinity mitigation remains largely theoretical.
A well-structured salt and water balance program is neededwithin an overall research and development portfolio for theWimmera Region. It should be management focussed, drivenby the need to resolve questions about the performance oflandscapes and groundwater systems to ascribe bestmanagement practices. The program should, in the firstinstance, address those areas where salinity has a significantimpact in regions where the hydrological processes involved insalt generation and best management practices are least clear.Region-wide R&D needs are summaraised in Table 39(page 57).
3.3.5.3 Landscape Processes atCatchment/Groundwater Flow System LevelFour main areas have significant salinity issues and considerableuncertainties regarding best management practices.These are:(a) The Mount William Creek catchment;(b) Local flow systems in low relief deeply weathered
granites;(c) Local flow systems in deeply weathered fractured
sedimentary rocks; and (d) Sub-regional (intermediate) flow systems in upland
alluvium.These four systems have very large salt stores, and contributelarge quantities of salt to the streams of the Wimmera.
3.3.5.3.1 Mount William Creek CatchmentThe Mount William Creek Catchment comprises a complexarray of GFSs. Local GFSs with high salt stores discharge saltsto the surface catchment, local flow systems low in salinity alsoappear to feed groundwater into a sub-regional system, and thesub-regional system appears to partially discharge at the lowerextremities of the catchment. Equally the sub-regional systemappears to have potential to recharge the upper extremities ofthe regional Parilla Sand aquifer.The Mount William Creek catchment generates some 20,000tonnes of salt per annum, and is a significant salt source in theWimmera Region. The catchment also generates largequantities of down-basin groundwater flow. The componentsalt loads and contribution for each GFS in the catchment andthe fate of both salt and groundwater remain largely unknown.In the absence of this knowledge, it is difficult to ascribe formsof management that specifically target salt reduction within adefined timeframe.Recommendation: Apply salt and water balance principles togetherwith groundwater modelling to ascertain the aggregate waterbalance based on the performance of the component GFSs
3.3.5.3.2 Local Flow Systems in Low ReliefGranites (deeply weathered)The understanding of deeply weathered granite systems is wellestablished in southern Australia, although it is subject to localvariation based on geological and geomorphic conditions. Thehigh salt store and low permeability of these systems makethem particularly troublesome from a management perspective.They do not respond well to recharge management, becausegroundwater flow is sluggish, and recedes very slowly. Equallythese systems are difficult to manage from an engineeringperspective because they seldom have sufficient permeability toallow for groundwater pumping or drainage. Research isneeded to resolve uncertainty about contribution of salt loadsto regional streams and the capacity for this to be managedthrough either biological or engineering means.Recommendation: Apply salt and water balance principles togetherwith numerical modelling to further ascertain the water balance ofcatchments comprising this GFS and where control managementshould be applied.

P A G E 5 3
3.3.5.3.3 Local Flow Systems in DeeplyWeathered Fractured Sedimentary RockThe hydro-geological setting for this landscape provides for arange of flow cells that operate from a very localised paddockscale through to something approaching a sub-regional scale.Like the low relief granite systems the terrain is deeplyweathered, with a high salt store. At depth the weathered lowpermeability regolith gives way to a fractured rock aquifer.The difficulties with managing this system are similar to those inmanaging deeply weathered granitic terrain in that thelandscape has low permeability and groundwater flow occurs ata range of scales.The landscape presents as a partially-dissected tableland. Insome places it has well developed soils capable of acceptingdeep-rooted perennial vegetation such as lucerne, while inother areas soil development is negligible and the land surfacecomprises outcropping kaolin rich clays formed fromdecomposing sedimentary rocks.The sluggish nature of the GFS, poor soil conditions in much ofthe area, and high salt stores all point toward real difficulties inunderstanding how this flow system might be best managed toreduce the salinity impact.As with the other priority flow systems, answers to how thissystem might be best managed will only be realised through abetter understanding of the water and salt balance.Recommendation: Apply salt and water balance principles togetherwith numerical modelling to further ascertain the water balance ofcatchments comprising this GFS.
3.3.5.3.4 Sub-regional Flow Systems in UplandAlluviumSimilar to the Mount William Creek catchment, most of thelarge upland valley floodplains comprise alluvial aquifers thattransmit considerable volumes of groundwater down-basin.The water balance of these systems is not well understood andthe threat they pose from a salinity perspective is largelyunknown.Along the northern margins of the uplands, the alluvial aquifersmerge with the marine sediments of the Parilla Sand, and havesome potential to recharge this regional aquifer. The extent towhich this occurs, and the hydro-geological circumstances atthe juncture of the two systems, however, remains largelyunknown.Recommendation: Apply salt and water balance principles togetherwith groundwater modelling to further ascertain the water balanceof catchments comprising this GFS.
3.3.6 CATCHMENT SALT AND WATERBALANCES Considerable information exists for the Wimmera Regionproviding insight into spatial distribution of salt generationthroughout the catchment.The information exists as discretedata sets and has not been assembled and analysed to supportan understanding of relationships between salinity and dynamicsof groundwater processes that impact on salt wash-off andbase flow processes.In-stream salinity is reported either as saltloads, averageconcentrations, or flow-weighted averages.These are allconcepts that tend to be constructed for indicative andcomparative purposes.They are very useful, but provide littleinsight into understanding spatial and temporal variability thataffords the opportunity to correlate salinity status withcatchment groundwater processes and potential managementactivities.The stream-flow information does not informmanagement decisions.Salinity flow relationships need to be better analysed so thatsalt generation in streams can be better correlated with thephysical processes operating within GFSs. Salinity and flow dataneed to be segmented and analysed on the basis of (a) low-flow and high salinity circumstances, (b) moderate flow andmoderate to high salinity circumstances, and (c) high flow andlow salinity circumstances. This would provide a much greaterinsight into catchment processes, and a much greater insightinto how salt export might be managed to avoid the mostdamaging flows and opportunities to achieve end of valleysalinity targets.Recommendation: Further analyses of stream-flow data to link saltflow processes to landscape processes, and to determine theextent to which conjunctive management might be practised tomitigate stream salinity and salt loads
Aerial view of Great WesternPaired Catchment trial site.
P A G E 5 4
PART THREE:THE FIVE YEAR ACTION PLAN
3.3.7 BIOLOGICAL MANIPULATION OFWATER BALANCE OF CATCHMENTS
3.3.7.1 Lucerne and Other Introduced PerennialPlantsWhilst understanding of the performance of landscapes in thecontext of GFSs has increased markedly over recent years,knowledge of the ability of farming systems to deliver requiredchanges in landscape hydrology is lacking in many areas. Therelationship between soils, water and vegetation with aparticular emphasis on root zone hydrology remains a highpriority for further R&D.Dryland lucerne continues to be regarded as the optimumpasture for recharge management, largely because it has beenused successfully for these purposes in many regionsthroughout Australia and North America. Indeed lucernegrown at Burkes Flat in the Avoca catchment, and at Marnoo inthe Avon-Richardson catchment during the latter half of the1980s demonstrate that in the right groundwater system theplant can lower groundwater levels by up to five metres.The difficulty with lucerne is that it cannot be growneverywhere. It requires fertile soils free from waterlogging andsoil acidity issues, as it is quite prone to aluminium andmanganese toxicity issues.Practical applied research and development is required todemonstrate lucerne’s performance in recharge mitigation inGFSs where this option is appropriate. This requirementextends equally to using other introduced perennial grasseswith potential for salinity management.
3.3.7.2 Native GrassesThere is a high reliance on summer active native grasses inmanaging recharge in the more marginal agricultural lands ofthe Wimmera uplands. The extent to which such pastures havethe capacity to mitigate, reduce, or impact on landscapehydrology remains largely conjecture.The option has beenwidely promoted throughout eastern Australia, but littlescientific information is available to support the assertion.There is a clear need to gather information on theperformance of native grasses in recharge mitigation. Thisresearch is likely to be both expensive and exacting, and it isrecommended that this area of endeavour be explored inconjunction with partners such as the CRC for CatchmentHydrology, or the CRC for Plant Based Solutions.
3.3.7.3 Engineering Options to Protect AssetsApplying engineering options, including groundwater pumping, islikely to play a significant role in salinity management and assetprotection in the Wimmera in future.They have application inmanaging groundwater levels where regional watertablesthreaten both natural and man made assets and infrastructurewithin the trench of the Wimmera River.Equally, engineering options have considerable potential inavoiding salinity in the weathered granites of the uplands. Herepumping can remove fresh groundwater from the flow systemwhilst it is in transit to the lower catchment, taking it out of theflow system before it has the opportunity to add to salinityissues.The main R&D issues focus on proving the application for thetechnology and developing standards and protocols forapplications.
3.3.7.4 Productive Use An extensive range of options are now available with potentialto realise profitable returns from industries and enterprises thatfocus on gaining production from saline land and waterresources. These range from the more conventionalapproaches involving the growth of halophytic vegetation andsalt-tolerant grasses on affected soils through saline aquaculture,alginate production from seaweed, saline horticulture, mineralharvesting, and even energy generation.Most of these industries are very specialised, and fill particularniche markets. Equally most of them are in their infancy and inneed of financial and technical support to prove their viability.This area of research and development is particularly significantin regional systems where it can be applied in conjunction withengineering strategies that release saline groundwater throughgroundwater pumping.Recommendation: Research and development focussing onproduction from saline land and water resources, particularly inthose regional systems where few other options are available, andwhere groundwater pumping realises a saline groundwater resource

P A G E 5 5
GFSPriority
R&D
R&D
R&D
Implementation
Knowledge Gaps
Understanding the capacity of engineeringintervention to support in-stream salinity andbiodiversity aspirations
Knowledge of the capacity for in-streamgroundwater interception from deep pools
Knowledge of groundwater flow paths into theriver including understanding the impact of thenear river zone and location of concentratedpoints of flow into the river
Understanding technology required to achieveeffective asset protection through groundwaterpumping and disposal
Practical knowledge of what might and mightnot be achieved in establishing niche marketindustries based upon production from salineland and water resources
The effectiveness of low volume groundwaterpumping in salinity mitigationThe effectiveness of interception plantations onmanaging salinityThe impact of plantations and groundwaterpumping on baseflow
Most effective location of break of slopeplantations/interceptor beltsUnderstanding linkage between this GFS andthe upland colluvium
Understanding salinity risk and implications forland and water management within theWimmera catchment
Understanding the ability of native grasses tomanage groundwater recharge to fracturedrock aquifers
R&D needs
Technologies required to achieve salinity andbiodiversity related outcomes
Understanding whether in-stream dewateringpresents a practical means of realising salinity andbiodiversity outcomes
Greater understanding of technology required tooptimise pumping yields in concert withevaporative capacity of small scale disposal basins
Field evaluation and testing of promisingtechnologies
Evaluating technology, developing standards &protocols for salinity management, water use andother natural resource management issuesTools to identify the optimum positioning in thelandscape for groundwater pumpingInstrumented trials to report on impact ofgroundwater pumping and interception plantationson groundwater elevations and baseflow
Review salt and water balance for upland alluvialsystems
Local investigations to ascertain groundwater statusat the juncture of the aquifers with the regionalParilla Sand aquiferGeophysical surveys to map sub surface structures
Need to understand the hydrology of nativegrasses as it applies to recharge management withinfractured rock aquifers
Potentialpartners
CRC forCatchmentHydrologyCSIRO (Landand Water)
CRC forCatchmentHydrologyCSIRO (Landand Water)
CRC forCatchmentHydrology
CRC forPolymerResearchCRC for PlantBasedSolutions?SA Centre forInnovation?
CRC forLandscape,Environmentand MineralExploration
CRC LEME(Land,Environment,MineralExploration)
CRC for PlantBasedSolutionsCRC forCatchmentHydrologyAgricultureVictoriaMurray-DarlingBasinCommission
TABLE 38:ASSESSMENT OF GROUNDWATER FLOW SYSTEM KNOWLEDGE GAPS, RESEARCH AND DEVELOPMENTNEEDS AND POTENTIAL RESEARCH PARTNERS
R 5.1 Regional flow systems in Parilla sands
R 5.2 Local flow systems in weathered granite (high relief)
R 5.3 Intermediate flow systems in alluvial plains (deep leads)
R 5.4 Local flow systems in highly fractured rocks

P A G E 5 6
PART THREE:THE FIVE YEAR ACTION PLAN
GFSPriority
Implementation
Implementation
Co-investment
Co-investment
Co-investment
Knowledge Gaps
Extent to which salt loads can be managedthrough alternative land and watermanagement
Understanding flow cells and managementstrategies for fractured rock systemsImpact of gravel extraction and kaolin miningon groundwater
Impact of clay spreading and associatedfarming system changes on recharge in thesouthern section of the Lowan sands
Information products to communicate currentoptions for salinity management
Some uncertainties re root zone hydrology
Understanding the contribution of this systemto other GFSs and the impact it has on watersupply to the key water catchments in theWimmera.
Define Woorinen/Lowan/Parilla salinity issues inthe Edenhope region
R&D needs
Review of contemporary approaches to achieving amore favourable salt and water balance in similarterrain throughout Australia
Establish with greater certainty the nature ofgroundwater flow relative to terrain, and thefeasibility of lucerne for recharge mitigation
Demonstration sites and monitoring of clayspreading in the southern area.
Need to produce fact sheet style information-knowledge transfer productsImpact of clay spreading on water balancePotential post-graduate style projects
Potential R&D to investigate the impact of toxicelements in the root zone on production of somealkaline soils
Understanding the influence of groundwater flowfrom the colluvium on the salt and water balanceof upland alluvial system (specifically Mt.WilliamCreek catchment)
Analyses and review of existing groundwaterinformation, and possible additional shallow drillinginvestigations
Potentialpartners
Department ofAgricultureWesternAustraliaPrimaryindustries andResourcesSouth AustraliaCSIRO (Landand Water)CRC LEMEAgricultureVictoria -Rutherglen
CRC for PlantBasedSolutionsCRC LEME CRC forCatchmentHydrologyCSIRO (Landand Water)
Industrypartners
IndustryRIRDCísLandcaregroups
Industrypartners
WimmeraMallee Water
Local issue
TABLE 38 CONTINUED: ASSESSMENT OF GROUNDWATER FLOW SYSTEM KNOWLEDGE GAPS, RESEARCH ANDDEVELOPMENT NEEDS AND POTENTIAL RESEARCH PARTNERS
R 5.5 Local flow systems in deeply weathered granites (low relief)
R 5.6 Local and intermediate flow systems in deeply weathered fractured rocks
R 5.7 Local flow systems in sand dunes (Lowan Formation)
R 5.8 Local flow systems in Woorinen sediments
R 5.9 Local flow systems in colluvium (Grampians Sandstone)

P A G E 5 7
Knowledge gaps
Understanding the processes by which salt enters WimmerastreamsUnderstanding the impact and timing of high salinity - low tomoderate flowsOpportunities to better manage the low to moderate flow- high salinity stream-flow regimesAppreciation of surface water - groundwater interactions forGFSsAppreciation of the role of soils and impact of root zoneprocesses in the context of groundwater recharge
Availability of accurate data on the current extent andseverity of discharge.
Impact of native grass pastures on landscape hydrologyThe role and best management of lucerne and otherintroduced perennial plants in achieving salinity management
Understanding the capacity to develop alternative nicheindustries based upon saline resources
Native salt-tolerant plants as alternatives to Tall Wheat Grassand Puccinellia.
Further understand the groundwater processes operatingand potential impact of management options at abroadscale.
Current and potential impact of salinity on local governmentinfrastructurePotential management strategies/intervention options toprotect local government infrastructure
Current extent of biodiversity assetsPre 1750’s biodiversity of the regionSalinity threat to biodiversity assets for various managementscenariosBiodiversity and ecological values of the Wimmera River
R&D needs
Further analyses of stream flow and salinity data tobetter understand the potential to managesaltloads and stream salinityModelling of surface water & groundwaterinteractions at the scale of individual GFSsSimulation modelling and practical applied researchand development trials to ascertain optimisefarming systems for recharge mitigationApplied R&D to ascertain the impact of variouspasture management strategies on the waterbalance and groundwater elevationsApply remote airborne geophysics to further definelandscape hydrology and hydro-geologyDevelop a digital elevation model for the region
Applied research and development in support ofentrepreneurs
Investigate, trial and demonstrate native salt-tolerant alternatives.
Investment in groundwater modelling, to improveunderstanding, and develop a decision assistant,communication tool.
Detailed GIS mapping and modelling of potentialsalinity discharge in relation to local governmentinfrastructure to assist in future decisions relating toinfrastructure design, locations, management andmaintenance
A detailed study of the Wimmera Region’sbiodiversity significance and potential impacts of arange of salinity outcomes on the extent andquality of biodiversity assets. Including identifyingthe full benefits of the biodiversity and ecology ofthe river
Potentialpartners
CRC forCatchmentHydrologyCSIRO (Landand Water)
LocalGovernment
TABLE 39: REGION-WIDE RESEARCH AND DEVELOPMENT NEEDS
R 5.10 Assessment of the salt and water balance of Groundwater Flow Systems in the Wimmera Region
R 5.11 Optimum management of groundwater recharge in appropriate groundwater flow systems
R 5.12 Options for productive use of saline land and water resources
R 5.13 Local Government Information Support
R 5 14 Assessment of Wimmera Region Biodiversity Assets
P A G E 5 8
PART THREE:THE FIVE YEAR ACTION PLAN
3.3.8 MONITORING AND EVALUATION
3.3.8.1 Monitoring Principles• Eventually relate all monitoring activities to a GFS.• Establish over time an appropriate minimum level of
monitoring for each GFS including:• A representative set of groundwater bores to cover the
different climate, land uses and management options thatexist for the GFS;
• A gauging station at the outfall of the GFS to monitorsaltloads, flow rates and salt concentrations; and
• A database of known land use change in the GFS eg.pasture establishment, interceptor belts, groundwaterpumps etc.
• Establish a set of targets for each GFS to cover NRMoutcomes and works implemented. These should include:• NRM targets - discharge area, saltload, salt concentration
thresholds (e.g. Under X EC for Y% of the time); and• Works Targets - area desired of management change.
• Prepare annual monitoring reports which link NRM andworks targets for each GFS.
3.3.8.2 Evaluation Principles• The Technical Working Group will provide the Land Issues
FC with an annual evaluation of the plan’s implementation.This evaluation will include:• An overview of the works implemented;• An assessment of the effectiveness of works
implemented on the basis of monitoring data;• Progress on research and development initiatives;• A review of other relevant state and federal initiatives
and their implications to the Wimmera; and • An overview of changes in the knowledge and
understanding of each GFS and the implications for theinitiatives outlined in the salinity plan.
• After five years the Land Issues FC will commission anindependent review and evaluation of this salinity actionplan including assessments of:• Effectiveness of works implemented;• Effectiveness of the delivery mechanisms used;• Appropriateness of the cost-sharing arrangements;• Success of the R&D initiatives in addressing knowledge
gaps;• Social impact and changes in social structure in the
region through a repeat of the CSU study;• Effectiveness of the monitoring program;• Progress towards achieving outputs identified in the plan;• Potential for the plan to impact on future salt loads and
potential environmental benefits; and• Availability of new knowledge and technology and how
these might be applied to improve salinity managementin the Wimmera.
Knowledge gaps
Incorporating social data (CSU study) into the developmentof implementation and communication initiativesLimited understanding of opportunities to modify attitudesto different landscape values and practice changeLack of suitable incentive measures other than of financialgrantsChange in social indicators over timeAs salinity will struggle to gain attention as an issue in itsown right, how to link salinity in to the broader regionalsocio-economic picture.What threat does salinity pose to priority social issuesidentified in the study?What opportunity does the desire of landholders to leavetheir property in ëbetter conditioní for adoption of salinitymanagement practices?
Limited understanding of suitability of lucerne within upperWimmera landscapes
R&D needs
Further social investigations and testing of incentiveopportunities based on social characteristics of theregionInvestigating social networks and learningmechanisms/forums such as Topcrop and Landcareand their role in driving implementationRepeat of the CSU study after 5 years ofimplementationInvestigate how future salinity managementinitiatives need to be developed and implementedwith due consideration of their interaction with theregion’s socio-economic structure.What are the social opportunities fromimplementing salinity management options,employment, new industries, etcHow can salinity management be linked moreclosely with regional development?There is a need to better understand landholdersídefinition of “better condition”.
A detailed study and assessment of the suitability oflucerne for the range of GFSs and landscapeswithin the Wimmera Region.
Potentialpartners
TABLE 39 CONTINUED: REGION-WIDE RESEARCH AND DEVELOPMENT NEEDS
R 5.15 Socio - Economic Assessment
R 5.16 Lucerne Suitability Assessment Report

P A G E 5 9
3.3.8.3 Bore Monitoring NetworkAt least 717 bores or piezometers have been constructedthroughout the Wimmera over the last two decades. Of these,677 are monitored on a regular basis. Bores are monitored ata range of intervals in accordance with priorities developedunder a 2000 review of groundwater monitoring. Thefrequency of bore monitoring is outlined in Table 40.
TABLE 40: GROUNDWATER MONITORING- WIMMERA REGION
Frequency of monitoring Number of bores/piezometersMonthly 289Quarterly 295Bi-annually 73Annually 20Total 677
Groundwater bores/piezometers and piezometers aremonitored by a range of agencies with responsibilities thatrange from catchment/salinity management, through to waterresource management and R&D. Groundwater data is collectedby DPI (Centre for Land Protection Research), GrampiansWimmera Mallee Water Authority, and SKM.Groundwater monitoring has been established for a widevariety of purposes. These include meeting requirements tomonitor groundwater resources in the West Wimmera’sfreshwater aquifers, research and investigations to understandlandscape groundwater processes from a salinity perspective,and monitoring to determine the impact of land use and bestland management practices on salinity management andmitigation.The wide array of purposes for establishing groundwatermonitoring has led to considerable geographic diversity in boreplacement. This diversity is illustrated in Table 41.
3.3.8.3.1 Lower WimmeraFrom the general perspective of monitoring groundwatersystems, and assessing trends that have implications in terms ofsalinity risk, the coverage afforded by bores in the lowerWimmera is generally quite good. The regional networkprovides an understanding of the flow regime within theregional - Murray-Darling Basin aquifers, including localinfluences from recharge within, for example, the floodplain ofthe lower Wimmera River.The adequacy of the bore network in the Lower Wimmera is afunction of both the large number of wells, and thepredominantly regional nature of the groundwater systems.Variability in the landscape-groundwater systems is much lessthan that found in the Wimmera uplands’ GFSs.Groundwater monitoring is also adequate from a perspectiveof understanding local GFSs in superficial sediments of both theLowan and Woorinen formations that overlie the regionalaquifers of the Lower Wimmera. Additional monitoring wouldbe beneficial in recording the performance of local salinitymitigation strategies and providing feedback to participatinglandholders and the regional Landcare network.
TABLE 41: BORE LOCATION BY AQUIFER AND GROUNDWATER FLOW SYSTEM - WIMMERA REGION
Aquifer Groundwater Flow System No. of bores
UPLANDSFractured metasediments Includes Local GFS in highly fractured rock, Local and Intermediate GFS in deeply 72
weathered fractured rock and Intermediate GFS in fractured rockGranites Includes Local GFS in weathered granites and Local GFS in deeply weathered granites 30Grampians Colluvium Local GFS in colluvium (Grampians Sandstone) 11Tertiary Gravels Local perched GFS in hill-slope gravel deposits 10
LOWER WIMMERA (PLAINS)Parilla Sands Regional GFS in Parilla Sands 233Shepparton Formation Local GFS in alluvial sediments (a) 250Renmark Formation Regional GFS in alluvial aquifers 41Murray-Group Limestone Regional GFS in Murray Group Limestone 56Blanchetown Clay Local GFS in alluvial clay deposits 10Coonambidgal Formation Local GFS in alluvial sediments (b) 4
P A G E 6 0
PART THREE:THE FIVE YEAR ACTION PLAN
3.3.8.3.2 Upper WimmeraEstablishing bores and piezometers in the Upper Wimmeracatchment has occurred to a much lesser extent than in theLower Wimmera, with only 123 bores/piezometersconstructed. This represents 15% of total bores in theWimmera Region. Clearly the reason for this lesser amounthas to do with (a) greater emphasis on groundwater resourcesmonitoring in the Western Wimmera, (b) greater interest,historically, in understanding regional aquifers of the Murray-Darling Basin, and (c) technical difficulties in establishinggroundwater wells in the often rocky upland terrain.Of the 123 bores and piezometers established throughout theuplands 72 are recorded as being located in fracturedmetasediments. This means that they are located either within(a) Local GFS in fractured rocks, (b) Local GFS in deeplyweathered fractured rocks, or within (c) Intermediate GFS infractured rocks. The proportion of bores in each GFS remainsuncertain, however, this should be resolved in the immediatefuture through producing a 1:100,000- scale map of the GFSsof the Upper Wimmera Catchment.Some 30 bores/piezometers are recorded as being in thegranites of the uplands, including both the Local GFS inWeathered Granites and Local GFS in Deeply WeatheredGranites. As with the fractured rock GFS, the question ofwhich bores lie within which GFS will be resolved withproduction of the 1:100,000 GFS map for the UpperCatchment.Of the remaining upland bores/piezometers, 10 exist within theTertiary Gravel deposits generally formed over deeplyweathered fractured rocks, and a further 11 are within theLocal GFS in Grampians Colluvium.
3.3.8.3.3 Millicent Coast BasinMost bores have been installed since 1995, with only a fewhaving installed in the 1980s. Key points about groundwatermonitoring are:Most bores in the South-West Wimmera (area aroundEdenhope and Mosquito Creek) are monitored on a quarterlybasis by DPI. Regular monitoring is yet to be addressed in theTelopea Downs area.The best coverage of salinity monitoring bores in the MillicentCoast is in the Edenhope area and the Mosquito CreekCatchment. About 35 bores are monitored, most in the ParillaSands GFS. Initially most bores were established in or neardischarge areas which revealed little information aboutgroundwater processes occurring elsewhere in the widerlandscape.The network has since been enhanced so that thereare transects covering cross-sections of the landscape.A small number of bores is in the Lowan Sands South GFS onthe catchment divide near Kadnook, between the Wimmeraand Glenelg-Hopkins CMA areas. These bores providebackground monitoring prior to an area being planted out to alarge Blue Gum Plantation. This is one of the few places inVictoria where this scenario is known to exist and is one of themain reasons why these sites are continuing to be monitored.In the Telopea Downs area, the bore monitoring network isonly known to have two bores established near the TelopeaDowns Hall in 1999, with another four established some timeago at a salinity treatment trial site by the local Landcare group,west of the Telopea Downs Hall. These are situated in theLowan Sands North GFS.A small number of bores also exist in the sandy lunette on theeastern side of White Lake and are continuing to be monitoredby DPI. These were established in about 1989 as part ofpasture trials. In more recent times, mineral sands mining in thearea has resulted in more bores to monitor groundwatermovement. A distinction also needs to be made betweenmonitoring for salinity management and that associated withaquifer management (ie. the limestone and border zonemonitoring).
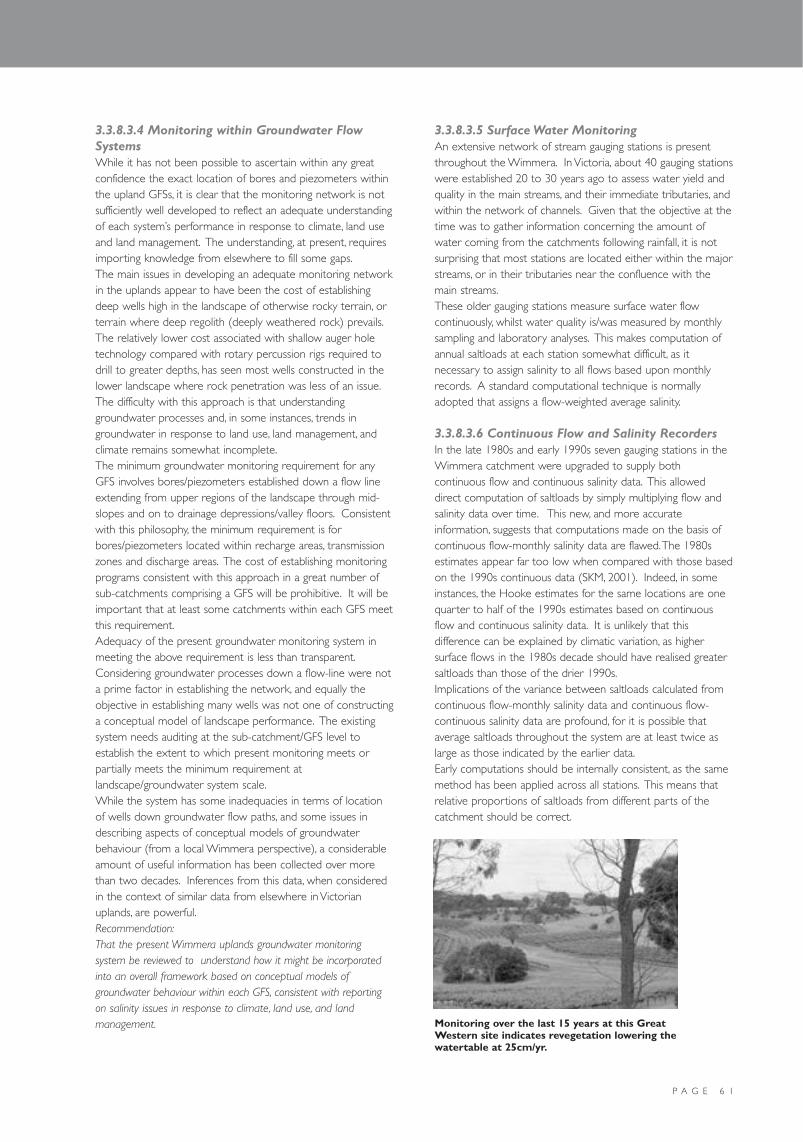
P A G E 6 1
3.3.8.3.4 Monitoring within Groundwater FlowSystemsWhile it has not been possible to ascertain within any greatconfidence the exact location of bores and piezometers withinthe upland GFSs, it is clear that the monitoring network is notsufficiently well developed to reflect an adequate understandingof each system’s performance in response to climate, land useand land management. The understanding, at present, requiresimporting knowledge from elsewhere to fill some gaps.The main issues in developing an adequate monitoring networkin the uplands appear to have been the cost of establishingdeep wells high in the landscape of otherwise rocky terrain, orterrain where deep regolith (deeply weathered rock) prevails.The relatively lower cost associated with shallow auger holetechnology compared with rotary percussion rigs required todrill to greater depths, has seen most wells constructed in thelower landscape where rock penetration was less of an issue.The difficulty with this approach is that understandinggroundwater processes and, in some instances, trends ingroundwater in response to land use, land management, andclimate remains somewhat incomplete.The minimum groundwater monitoring requirement for anyGFS involves bores/piezometers established down a flow lineextending from upper regions of the landscape through mid-slopes and on to drainage depressions/valley floors. Consistentwith this philosophy, the minimum requirement is forbores/piezometers located within recharge areas, transmissionzones and discharge areas. The cost of establishing monitoringprograms consistent with this approach in a great number ofsub-catchments comprising a GFS will be prohibitive. It will beimportant that at least some catchments within each GFS meetthis requirement.Adequacy of the present groundwater monitoring system inmeeting the above requirement is less than transparent.Considering groundwater processes down a flow-line were nota prime factor in establishing the network, and equally theobjective in establishing many wells was not one of constructinga conceptual model of landscape performance. The existingsystem needs auditing at the sub-catchment/GFS level toestablish the extent to which present monitoring meets orpartially meets the minimum requirement atlandscape/groundwater system scale.While the system has some inadequacies in terms of locationof wells down groundwater flow paths, and some issues indescribing aspects of conceptual models of groundwaterbehaviour (from a local Wimmera perspective), a considerableamount of useful information has been collected over morethan two decades. Inferences from this data, when consideredin the context of similar data from elsewhere in Victorianuplands, are powerful.Recommendation:That the present Wimmera uplands groundwater monitoringsystem be reviewed to understand how it might be incorporatedinto an overall framework based on conceptual models ofgroundwater behaviour within each GFS, consistent with reportingon salinity issues in response to climate, land use, and landmanagement.
3.3.8.3.5 Surface Water Monitoring An extensive network of stream gauging stations is presentthroughout the Wimmera. In Victoria, about 40 gauging stationswere established 20 to 30 years ago to assess water yield andquality in the main streams, and their immediate tributaries, andwithin the network of channels. Given that the objective at thetime was to gather information concerning the amount ofwater coming from the catchments following rainfall, it is notsurprising that most stations are located either within the majorstreams, or in their tributaries near the confluence with themain streams.These older gauging stations measure surface water flowcontinuously, whilst water quality is/was measured by monthlysampling and laboratory analyses. This makes computation ofannual saltloads at each station somewhat difficult, as itnecessary to assign salinity to all flows based upon monthlyrecords. A standard computational technique is normallyadopted that assigns a flow-weighted average salinity.
3.3.8.3.6 Continuous Flow and Salinity RecordersIn the late 1980s and early 1990s seven gauging stations in theWimmera catchment were upgraded to supply bothcontinuous flow and continuous salinity data. This alloweddirect computation of saltloads by simply multiplying flow andsalinity data over time. This new, and more accurateinformation, suggests that computations made on the basis ofcontinuous flow-monthly salinity data are flawed.The 1980sestimates appear far too low when compared with those basedon the 1990s continuous data (SKM, 2001). Indeed, in someinstances, the Hooke estimates for the same locations are onequarter to half of the 1990s estimates based on continuousflow and continuous salinity data. It is unlikely that thisdifference can be explained by climatic variation, as highersurface flows in the 1980s decade should have realised greatersaltloads than those of the drier 1990s.Implications of the variance between saltloads calculated fromcontinuous flow-monthly salinity data and continuous flow-continuous salinity data are profound, for it is possible thataverage saltloads throughout the system are at least twice aslarge as those indicated by the earlier data.Early computations should be internally consistent, as the samemethod has been applied across all stations. This means thatrelative proportions of saltloads from different parts of thecatchment should be correct.
Monitoring over the last 15 years at this GreatWestern site indicates revegetation lowering thewatertable at 25cm/yr.

TABLE 42: EXTRA MONITORING INFRASTRUCTURE REQUIRED
Gro
undw
ater
Flo
w S
yste
m
Sur
face
Wat
er M
onit
orin
g
Cos
t
Aug
er h
ole
piez
omet
ers
Cos
t
Rot
ary/
mud
bor
es &
pie
zom
eter
s
Gro
undw
ater
Flo
w S
yste
m
Tota
l Cos
t
PART THREE:THE FIVE YEAR ACTION PLAN
3.3.8.5.2 Capacity to Inform Salinity Mitigation The present surface water-monitoring network affords littleopportunity to provide information to help understandlandscape-stream interactions, except at the broadest levelwhere it provides indicative information on relative saltloadsarising from large parts of the catchment. The difficulty lies inthe fact that most gauging stations are in the lower catchmentwithin main streams or main tributaries immediately above theconfluence with main streams. At this point salinity is stronglybuffered by large surface water flows relative to salt flows.Equally gauging stations most often measure combined saltloadsfrom several different GFSs.These issues, when combined withthose arising from different flow-salinity technologies, indicatethe present system does not afford opportunities to relate saltin-stream flow to the function of landscape-groundwaterprocesses within GFS. Project Platypus funds a series ofgauging stations within the upper catchment which providevaluable information and where these are located withinrelevant GFS options for their continued funding need to beexplored.A functional understanding of relationships between stream saltflows and salinity processes within landscapes is only likely to beachieved where continuous flow-continuous salinity stations canbe established at the point where stream-flow exits a GFS.Recommendation:Consider establishing at least an additional two gauging stations inthe Upper Wimmera catchment at sites consistent with monitoringsalt flows generated by landscape processes. These should beestablished to monitor salinity processes within local GFS in deeplyweathered granites, and local GFS in deeply weathered fracturedrocks.
3.3.8.5.3 Millicent Coast Surface water flow in the Millicent Coast area is mainlydominated with wetland systems that flow in a north-westerlydirection and stream systems that flow west into SA. Keypoints about these are:1. Due to the location of wetlands in the landscape, they will
probably be one of the first environmental features to showthe effects of any changes to salinity. Monitoring vegetationchanges and changing water salinity levels is a valuable wayof detecting early warning signs of emerging salinity trends.To date, the only regular wetland monitoring is salt andwater levels of Lake Wallace at Edenhope by GrampiansWimmera Mallee Water.
2. Four sub-catchments in the Millicent Coast all straddle thestate border and have well defined creek systems that flowinto South Australia. To date, there is no regular surfacewater monitoring of these waterways, with the exception ofthe Mosquito Creek which is monitored by the Departmentof Land,Water, Biodiversity and Conservation at Struan.
3. Potential exists to develop joint surface water monitoringprograms for these cross-border tributaries, especially giventhat the Morambro Creek area just over the border west ofFrances has been declared a Water Supply Protection Area.
4. The Mosquito Creek is also significant in that it is the mostdegraded of all the creek systems in the West Wimmera(particularly the upper part of the northern branch) andflows westerly over the border into the Ramsar-listed BoolLagoon in SA.
P A G E 6 2
Local GFS in sand dunes (Lowan Sands) - - 5 $3500 - $3,500Local GFS in Woorinen Formation - - 0 - - - -Regional GFS in Parilla Sands - - - - 5 $30,000 $30,000Local GFS in highly Fractured Rock 1 $15,000 - - 10 $60,000 $75,000Local GFS in weathered granites (high relief) 1 $15,000 - - 12 $60,000 $75,000Local GFS in deeply weathered granites 1 $15,000 - - 10 $60,000 $75,000(Low Relief)Local/Intermediate GFS in Deeply 1 $15,000 - - 10 $60,000 $75,000Weathered Fractured RockIntermediate GFS in Fractured Rock - - - - 2 $12,000 $12,000Intermediate GFS in Alluvial plains - - - - 10 $100,000 $100,000Local GFS in Colluvium -Grampians Sandstone - - - - 5 $30,000 $30,000Totals 4 $60,000.00 5 $3500.00 64 $412,000.00 $472,000.00
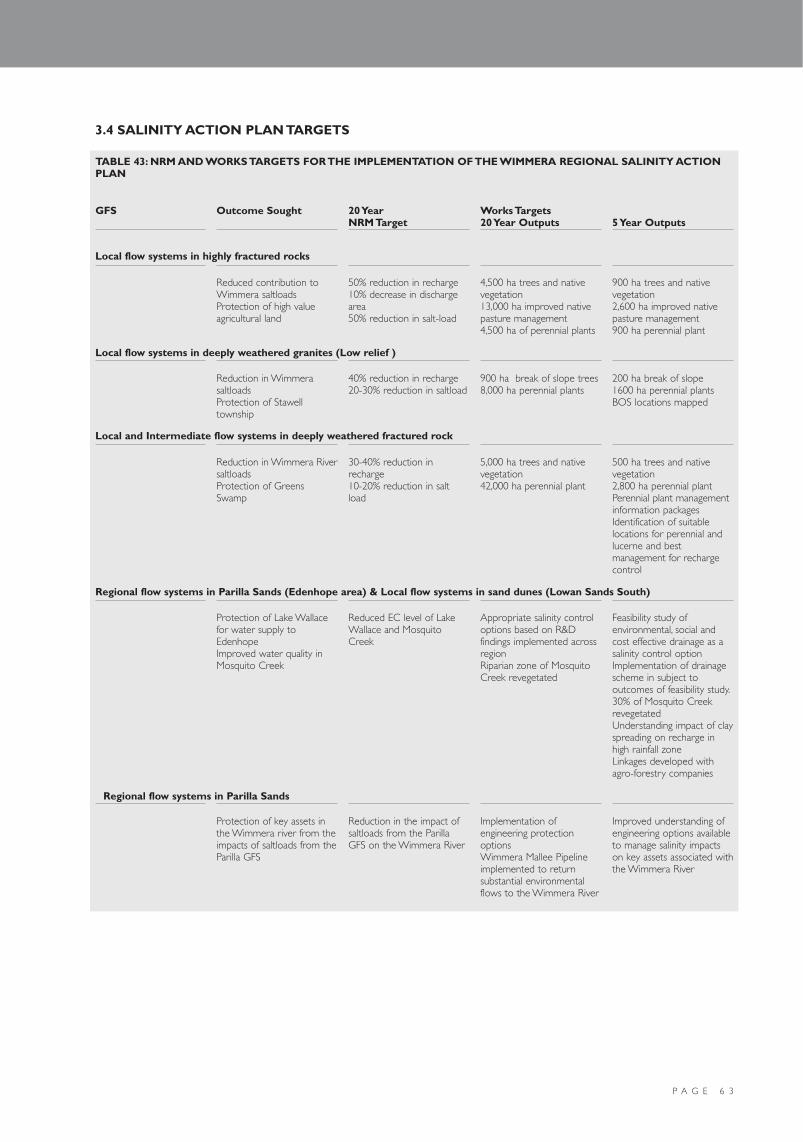
P A G E 6 3
3.4 SALINITY ACTION PLAN TARGETS
GFS Outcome Sought
Reduced contribution toWimmera saltloadsProtection of high valueagricultural land
Reduction in WimmerasaltloadsProtection of Stawelltownship
Reduction in Wimmera RiversaltloadsProtection of GreensSwamp
Protection of Lake Wallacefor water supply toEdenhopeImproved water quality inMosquito Creek
Protection of key assets inthe Wimmera river from theimpacts of saltloads from theParilla GFS
20 YearNRM Target
50% reduction in recharge10% decrease in dischargearea50% reduction in salt-load
40% reduction in recharge20-30% reduction in saltload
30-40% reduction inrecharge10-20% reduction in saltload
Reduced EC level of LakeWallace and MosquitoCreek
Reduction in the impact ofsaltloads from the ParillaGFS on the Wimmera River
Works Targets20 Year Outputs
4,500 ha trees and nativevegetation13,000 ha improved nativepasture management4,500 ha of perennial plants
900 ha break of slope trees8,000 ha perennial plants
5,000 ha trees and nativevegetation42,000 ha perennial plant
Appropriate salinity controloptions based on R&Dfindings implemented acrossregionRiparian zone of MosquitoCreek revegetated
Implementation ofengineering protectionoptionsWimmera Mallee Pipelineimplemented to returnsubstantial environmentalflows to the Wimmera River
5 Year Outputs
900 ha trees and nativevegetation2,600 ha improved nativepasture management900 ha perennial plant
200 ha break of slope1600 ha perennial plantsBOS locations mapped
500 ha trees and nativevegetation2,800 ha perennial plantPerennial plant managementinformation packagesIdentification of suitablelocations for perennial andlucerne and bestmanagement for rechargecontrol
Feasibility study ofenvironmental, social andcost effective drainage as asalinity control optionImplementation of drainagescheme in subject tooutcomes of feasibility study.30% of Mosquito CreekrevegetatedUnderstanding impact of clayspreading on recharge inhigh rainfall zoneLinkages developed withagro-forestry companies
Improved understanding ofengineering options availableto manage salinity impactson key assets associated withthe Wimmera River
TABLE 43: NRM AND WORKS TARGETS FOR THE IMPLEMENTATION OF THE WIMMERA REGIONAL SALINITY ACTIONPLAN
Local flow systems in highly fractured rocks
Local flow systems in deeply weathered granites (Low relief )
Local and Intermediate flow systems in deeply weathered fractured rock
Regional flow systems in Parilla Sands (Edenhope area) & Local flow systems in sand dunes (Lowan Sands South)
Regional flow systems in Parilla Sands

P A G E 6 4
PART THREE:THE FIVE YEAR ACTION PLAN
3.4.1 PUBLIC INVESTMENT REQUIREMENTSOver the next five years an indicative annual public investmentof $2.4 million p.a. will be required to start implementing theWimmera Regional Salinity Action Plan.
TABLE 44 INDICATIVE ANNUAL PUBLIC INVESTMENTREQUIRED TO IMPLEMENT PROPOSED FIVE-YEARPROGRAM OF ACTIVITIES
Item Staff (FTE) Cost $mManagement and Co-ordination 1.7 0.2Implementation Support 10.6 0.8Works and applied Research 0.6(average annual budget)R&D 0.6Monitoring 0.2Total Plan 12.3 2.4
3.5 COST-BENEFIT ANALYSIS
3.5.1 QUANTIFIABLE COSTSThe quantifiable costs considered in this analysis included:• Costs of implementing the 20-year works targets in each
GFS classified for implementation• Agricultural production forgone on areas revegetated with
trees• Costs associated with implementing the 20-year discharge
treatment targets• Costs of managing, providing implementation support,
undertaking research and development and monitoringimplementation of the plan.
A breakdown of the present value of these costs over the next30 years is provided in the Background Paper - EconomicAnalysis of Salinity Threats to the Wimmera Region, Madden2004.
3.5.2 QUANTIFIABLE BENEFITSWe have been able to quantify the six main potential benefitsof implementing the Wimmera Regional Salinity Action Plan.1. Agricultural Loss Avoided - We have assumed that
implementing the plan will be sufficient to halt the expected1% p.a. increase in Wimmera area affected by salinity.
2. Infrastructure Loss Avoided - infrastructure costs arecurrently estimated at $18 million p.a. The analysis assumesthat implementing the plan will stop these losses increasingby 0.5% p.a. into the future.
3. Perennial Pasture Productivity Gain - Adopting perennialpastures is estimated to improve gross margins by aconservative $30/ha.
4. Native Pasture Productivity Gain - estimated to be $5 perhectare more than the costs of implementing improvedmanagement
5. Waterway Tourism Losses Avoided - the total number ofvisits to waterways in the Wimmera catchment has beenestimated at 340,000 visitors per annum, with a total valueof over $7.5 million. Taking a conservative approach wehave estimated the impact of future deterioration of waterquality as a result of salinity reducing this tourism to thearea by 1% p.a.
6. Protection of Wetland Capital Value - benefits of protectingthe ecological, social and productive capacity of wetlands aredifficult to quantify. Recent estimates place the capital valueof stock of natural capital associated with the region’swetlands at about $140 million. We have assumed thatimplementing the Wimmera Regional Salinity Action Planwill prevent this value from declining by 0.5% p.a.
3.5.3 QUANTIFIABLE COST-BENEFITANALYSISAn analysis of the quantifiable costs and benefits ofimplementing the salinity plan over the next 30 years is shownin Table 45. At a 4% discount rate the costs have a presentvalue of $56.7 million while expected benefits are worth apresent value of $68.2 million. As such, the benefits outweighthe costs and the plan has a net present value of $11.5 millionand a benefit cost ratio of 1.2.At a discount rate of 8% (which implies a higher preference forbenefits or dollars now than in the future) the net presentvalue is reduced to 0.1 million and the benefit cost ratio is 1.0,implying the benefits of implementation just outweigh the costsinvolved.While we have attempted to quantify some environmentalbenefits of implementing the plan it is unlikely that we havecaptured them all. We expect that there are other potentialbenefits relating to:• Improved water quality• Protecting the ecology and biodiversity of the Wimmera• Reduced salinity in the Wimmera River and Lake Hindmarsh• Biodiversity benefits of increased native vegetation in the
priority GFS.• Protecting and improving key EVCsIf these benefits could be quantified they would furtherimprove the net present value and benefit cost ratio ofimplementing the plan.Quantifiable benefits and costs of implementing this plan aresummarised in Table 45.
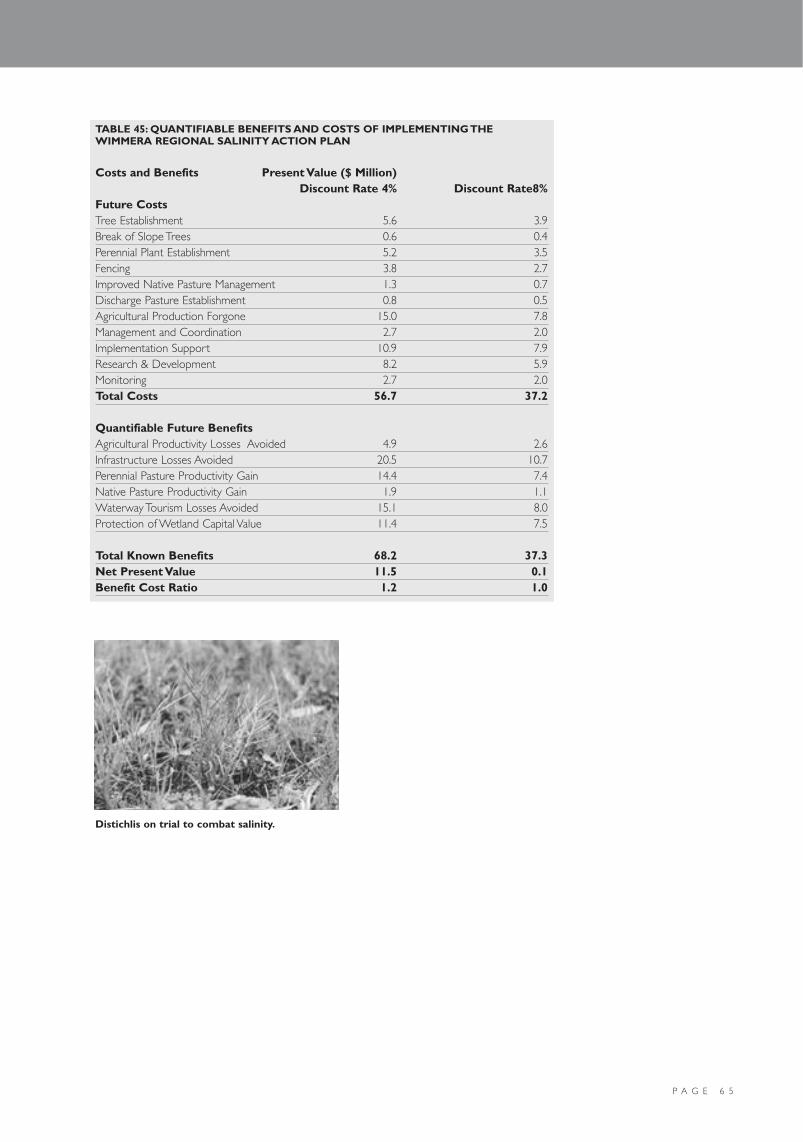
P A G E 6 5
TABLE 45: QUANTIFIABLE BENEFITS AND COSTS OF IMPLEMENTING THEWIMMERA REGIONAL SALINITY ACTION PLAN
Costs and Benefits Present Value ($ Million)Discount Rate 4% Discount Rate8%
Future CostsTree Establishment 5.6 3.9Break of Slope Trees 0.6 0.4Perennial Plant Establishment 5.2 3.5Fencing 3.8 2.7Improved Native Pasture Management 1.3 0.7Discharge Pasture Establishment 0.8 0.5Agricultural Production Forgone 15.0 7.8Management and Coordination 2.7 2.0Implementation Support 10.9 7.9Research & Development 8.2 5.9Monitoring 2.7 2.0Total Costs 56.7 37.2
Quantifiable Future BenefitsAgricultural Productivity Losses Avoided 4.9 2.6Infrastructure Losses Avoided 20.5 10.7Perennial Pasture Productivity Gain 14.4 7.4Native Pasture Productivity Gain 1.9 1.1Waterway Tourism Losses Avoided 15.1 8.0Protection of Wetland Capital Value 11.4 7.5
Total Known Benefits 68.2 37.3Net Present Value 11.5 0.1Benefit Cost Ratio 1.2 1.0
Distichlis on trial to combat salinity.

P A G E 6 6
REFERENCES
Clifton, C.A. & Dyson, P.R. 1998, Farm Forestry in the Southern
Murray-Darling Basin: Role in the Management of Dryland Salinity
and Groundwater Resources, proceedings of International
Groundwater Conference 1998.
Coram, J. E. Dyson, P. R. Houlder P. A. & Evans W. R. 1999,Australian Groundwater Flow Systems Contributing to DrylandSalinity, Report to National Land and Water Resources Audit,Bureau of Rural Sciences.
Douglass, J.G. & Ferguson J.A. 1976, Geology of Victoria,Geological Society of Australia.
Dyson, P.R. 1983, Dryland Salting and Groundwater Discharge inthe Victorian Uplands, proceedings of the Royal Society ofVictoria,Volume 95.
Gardiner, B. & J. 2000, Best Practice Management of Centre Pivotsin the West Wimmera, Report to the West Wimmera ShireCouncil.
Harrison, A. 1993, Hydrogeological Assessment of SalinityProcesses - Mt William Creek Catchment, Rural WaterCommission, Unpublished Report No. 1993/21.
Hocking, M. 1999, What is Causing Salinity on the WimmeraPlains? Technical Report, Centre for Land Protection Research,Department of Natural Resources and Environment.
Hooke, D. 1992, Stream Salinity and Saltloads for the WimmeraCatchment, Rural Water Commission.
Jenkin, J.J. & Dyson, P.R. 1983, Groundwater and Soil SalinisationNear Bendigo, Victoria, Collected Case Studies in Hydrogeology,Geological Society of Australia, Special Publication Number 11.
Macumber, P.G. 1992, Interactions Between Groundwater andSurface Systems in Northern Victoria, Department ofConservation and Environment.
Madden, 2004, Economic Analysis of Salinity Threats to theWimmera Region, Background Paper for Wimmera RegionalSalinity Action Plan.
Murray-Darling Basin Commission, 2003, A Regional InformationPackage for Dryland Salinity Management in the Wimmera,Publication from MDBC ‘TOOLs’ Project.
Stauffacher, M. et al. 2000, Assessment of Salinity ManagementOptions for Wanilla, Eyre Peninsula, CSIRO Land and Water,Technical Report 1/00, for the National Land and WaterResources Audit.
Walker, G. Gilfedder, M. Evans, R. Dyson, P. & Stauffacher, M. A.2003, Groundwater Flow Systems Framework for SalinityManagement, in Prep.
Wilson, 1999, Dryland Salinity:What Are The Impacts And How DoWe Value Them? MDBC Canberra.
Wilson, 2002, The Current Impacts and Costs to Non-AgriculturalStakeholders, the Environment and Cultural Heritage: VictorianMallee and Wimmera-Avon River Catchment.

P A G E 6 7
BIBLIOGRAPHY
WIMMERA SALINITY RESEARCH,INVESTIGATIONS ANDMONITORING BIBLIOGRAPHY
1992• Wimmera Catchment Salinity Management Plan,
Department of Natural Resources & Environment, 1992.
1994• Mount William Creek Catchment-Analysis of Bore
Hydrographs,Wimmera Mallee Water, 1994.
1995• Dock Lake Salinity Investigation,Wimmera Mallee Water &
Sinclair Knight Merz, 1995• Groundwater Levels in the Mt William Creek Catchment
and Irrigation Areas-Wimmera Salinity Management Plan,Wimmera Malleee Water, 1995.
• Groundwater Trends in the Lower Wimmera Catchment,Centre for Land Protection Research, 1995.
• Groundwater Trends in the Upper Wimmera Catchment,Centre for Land Protection Research, 1995.
• Salinity Trends in Lake Hindmarsh,Victoria, Centre for LandProtection Research, 1995.
• Stream EC Surveys of the Mosquito Creek Catchment-1995, Centre for Land Protection Research, 1995
• Stream EC Surveys of the Upper Wimmera Catchment-1994/5, Centre for Land Protection Research, 1995.
1996• Costs of Salinity Control Options for the Upper Wimmera
Catchment, Department of Natural Resources &Environment, 1995/96.
• Groundwater Trends in the Wimmera-1995/6, ACommunity Groundwater monitoring Report for theWimmera, 1996.
• Hydrological Investigation of Processes causing Salinity in theLaharum/Wartook Area,Wimmera Mallee Water, SinclairKnight Merz, 1996.
• Potential Recharge Map of the Six Mile Creek Catchment,Centre for Land Protection Research, 1996.
1997• Computer Modelling the Effect of Perennial Pastures on
Recharge and Groundwater Levels in the Mount WilliamCreek and Upper Wimmera Catchments,Wimmera MalleeWater, Sinclair Knight Merz, 1997.
• Great Western Salinity Control Option Trial-Comparison ofGroundwater and Surface Water Regimes in the Trial Sub-Catchments,Wimmera Mallee Water, Sinclair Knight Merz,1997.
• Groundwater Drilling in the Millicent Coast for theWimmera Salinity Management Plan-1996/7, Centre forLand Protection Research, 1997.
• Groundwater Level Changes in the Wimmera-1996/7,Centre for Land Protection Research, 1997.
• Groundwater Trends and Discharge along the LowerWimmera River, Centre for Land Protection Research, 1997
• Hydrological Investigation of Processes Causing Salinity inthe Laharum/Wartook Area-Recharge Mapping Within theLaharum/Wartook Area, Wimmera Mallee Water, SinclairKnight Merz, 1997
• Hydrological Investigation of Processes Causing Salinity inthe Laharum/Wartook Area, Report on May 1997 DrillingInvestigations,Wimmera Mallee Water, Sinclair Knight Merz,1997.
• Monitoring Productivity of Different Pasture Types in theWimmera Catchment, Department Natural Resources andEnvironment, Horsham, 1997.
• Radiometric Imagery in Potential Recharge Mapping in theUpper Wimmera, Centre for Land Protection, 1997
• Salinity Control Option Trials at Great Western, SiteSelection and Recharge Mapping,Wimmera Mallee Water,Sinclair Knight Merz, 1997.
• Stream Salinity Monitoring in the Wimmera-Data QualityAssessment for 1997.Wimmera Mallee Water, SinclairKnight Merz, 1997.
• S233 Wimmera Stream Salinity Monitoring,Wimmera RiverEnvironmental Flow Impact Assessment,Wimmera MalleeWater, Sinclair Knight Merz, 1997.
• Wimmera Region Surface Water Salinity-Data Validation for1996,Wimmera Mallee Water, Sinclair Knight Merz, 1997.
• Wimmera Salinity Plan Review,Wimmera CSIG, 1997.
1998• Assessment of Salinity Risk in the West Wimmera, Centre
for Land Protection Research, 1998.• Laharum/Wartook Investigation-Engineering and Agronomic
Salinity Control Options,Wimmera Mallee Water, SinclairKnight Merz, 1998.
• Review of the Wimmera Salinity Funded MonitoringNetwork, Sinclair Knight Merz for Wimmera Mallee Water,and Centre for Land Protection Research, 1998, draft.
• Study of Engineering Salinity Control Options for the LowerWimmera River Area, Sinclair Knight Merz, 1998.
• S233 Wimmera Stream Salinity Monitoring- Documentationof Mike 11 & Salipool Models,Wimmera Mallee Water,Sinclair Knight Merz, 1998.
P A G E 6 8
BIBLIOGRAPHY
1999• Action Plan for Steep Hill Country Management, Sinclair
Knight Merz, 1999.• What is Causing Salinity on the Wimmera Plains? Centre for
Land Protection Research, 1999.• Mt Zero Channel Leakage Investigation: Laharum/Wartook
Area, Sinclair Knight Merz, 1999.• Stream Salinity Monitoring in the Wimmera-Data Quality
Assessment for 1998, Sinclair Knight Merz, 1999.• Investigation of the Use of Multi-date Satellite Imagery for
Pasture Mapping in the Mt William Creek Catchment,Victoria, Sinclair Knight Merz, 1999.
2000• Factors Causing Salting in the Greens Creek Catchment,
Upper Wimmera, Centre for Land Protection Research,2000.
• Salinity Risk on the Wimmera Plains, Centre for LandProtection Research, 2000.
• Saltload Estimates from the Upper Wimmera Steep HillCountry, 2000.
• Modeling of Groundwater Pumping and On-FarmEvaporative Disposal in the Wimmera, Sinclair Knight Merz,2000.
• Stream Salinity Monitoring in the Wimmera - Data QualityAssessment for 1999, Sinclair Knight Merz, 2000.
2001• Salinity Risk on the Wimmera Plains, Centre for Land
Protection Research, Report no. 72 2001.• Wimmera Salinity Management Plan Groundwater Trend
Assessment, Sinclair Knight Merz, March 2001.• Feasibility of Groundwater Pumping from Granite Slopes,
Centre for Land Protection Research Technical Report no.71, June 2001.
• Wimmera Salinity Management Plan GroundwaterMonitoring,Wimmera Irrigation Area Groundwater TrendAssessment, Centre for Land Protection Research, March2001.
• Wimmera Salinity Management Plan GroundwaterMonitoring, Bore Maintenance Report 1999/2000, SinclairKnight Merz, March 2001.
2002• Groundwater Characteristics of Granitic Landscapes in the
Upper Wimmera, Centre for Land Protection Research,Technical report No. 93, September 2002.
• Jeparit Wind Pump Land Salinisation Recovery TrialDevelopment and Initial Results, Draft June 2002.
• Shallow Groundwater Trends for the West Wimmera,Centre for Land Protection Research, September 2003
• Stream Salinity Monitoring in the Wimmera RiverCatchment - Data Quality Assessment for 2001, SinclairKnight Merz, August 2002.
• Vegetation Assessment of the Tarranyurk Stream GaugingStation 9415247), Sinclair Knight Merz, July 2002.
2003• A Collation of Hydraulic Conductivities and Other Related
Data to Populate a Wimmera Groundwater Model, Centrefor Land Protection Research, Research report No. 27, May2003.
• Groundwater Trends of the Wimmera, Centre for LandProtection Research, Research Report No. 24, May 2003.
• FLOWTUBE Modelling of Management Options for a SalineDischarge Site in the Upper Wimmera - Holden’s Property,Centre for Land Protection Research, Research Report No.21, May 2003.
• Hydrogeological Appraisal of the Natimuk Catchment,Centre for Land Protection Research, Research Report No.25, May 2003.
• Land and Soil Survey in the Wimmera Region: DataInventory and Evaluation of Methodologies for Soil Mapping,Centre for Land Protection Research, Research Report No.29, 30, 31, March 2003.
• Preliminary Hydrogeological Appraisal of the Lake WallaceCatchment, Centre for Land Protection Research, ResearchReport No. 26, June 2003.
• Stream Salinity Monitoring in the Wimmera RiverCatchment - Data Quality Assessment for 2002, SinclairKnight Merz, July 2003.
• Wimmera River Groundwater Interception SchemeFeasibility Study,Wimmera Catchment ManagementAuthority, Sinclair Knight Merz, June 2003.

P A G E 6 9
GLOSSARY OF TERMS
AEM.Airborne electromagnetic (induction techniques for salinitymapping).agro-forestry.A collective name for land-use systems in which woodyperennials (trees, shrubs) are grown in association withherbaceous plants (crops, pastures) and/or livestock in a spatialarrangement, a rotation, or both, and in which there areecological and economic interactions between the tree and thenon-tree components of the system.aquifer.A porous soil or rock formation, below the surface of theground, that holds water and through which water can move toreach bores and springs.biodiversity.The variety of life forms, plants, animals and micro-organisms,the genes they contain, the ecosystems they form, andecosystem processes.catchment.An area of land supplying water to a watercourse bounded byhills or ridges that direct the flow of water.cyclic salt.The salt derived from oceanic spray transported inland bywinds and deposited by rain.discharge.Groundwater that escapes into a stream bed, lake or ocean, orthrough the land surface.discharge zone.Areas of catchments where groundwater emerges at lowpoints in the landscape.dryland salinity.Saline seepages or salt scalds occurring in rain-fed (non-irrigated) areas caused by changes in land use that affect thegroundwater balance throughout the landscapes.A typicalsituation occurs following the tree clearing from hill slopes,which reduces transpiration and allows an increase in rainfallintake beyond the root zone and a rise in water tables lowerdown the slope. Increased subsurface seepage dissolves salts inthe soil and, with lateral flow through the landscape, movesfrom hill slopes to valley floors. Salty water then surfaces inpatches depending on the geomorphology and topography ofthe site.The salt becomes concentrated by evaporation atthese locations and the normal vegetation is killed.EC units.The electrical conductivity (EC) of water provides a measure ofthe amount of salt dissolved in the water-the higher the ECvalue, the more saline the water. One EC equals one micro-Siemen per centimetre measured at 25 degrees Celsius, orapproximately 0.6 milligrams of salt per litre. 800 EC units is theWorld Health Organization recommended desirable upperlimit for salinity in drinking water.end-of-valley target.A target for the quality and quantity of water at the pointwhere a river leaves a catchment.evapotranspiration.Water returned to the atmosphere by evaporation (by thesun) and by plants emitting water vapour from their leaves.groundwaterThe water in the saturated pores of soil or rock below thewatertable.
Groundwater Flow System.A GFS describes the movement of groundwater in an area andis used as a tool to manage and treat salinity.ICM.Integrated catchment management.The integration of waterand land management activities and the government agenciesinvolved in these activities within a catchment.irrigation salinity.A form of salinity caused by increasing build-up of salts in soilsused for irrigation. It results from raised watertable levels thatbring soil salts into the upper levels of the soil profile, as well asrepeated use of saline river water for irrigation.Landcare.Landcare is a community-based approach to fixingenvironmental problems and protecting the future of ournatural resources.There are now more than 4250 Landcaregroups across Australia. About one in every three rurallandholders is a member of a Landcare group.landholders.Those who own or lease land.land managers.Those who manage land, including farmers, graziers, irrigators,cultural and environmental land holders, councils andgovernment agencies.LWA.Land and Water Australia. LWA is an Australian Governmentresearch and development corporation within the Agriculture,Fisheries and Forestry portfolio. Established in 1990 as the Landand Water Resources Research and Development Corporationunder the Primary Industries and Energy Research andDevelopment Act 1989, LWA invests in research anddevelopment for the productive and sustainable managementof Australia’s land, water and vegetation resources.market mechanisms.Mechanisms that change the market forces for particularcommodities to help achieve the desired natural resourcemanagement outcome.

P A G E 7 0
GLOSSARY OF TERMS
NAP. National Action Plan for Salinity and WaterQuality.Established by the Australian, state and territory governments inNovember 2000, the objectives of the NAP are to enableregional communities and landholders to use coordinated andtargeted action to prevent, stabilise and reverse trends indryland salinity, and to improve water quality. Under the NAP,the Commonwealth funds communities to implementaccredited integrated catchment/region management plansthrough block funding, on a matching basis with the States andTerritories. Twenty-one priority regions have been identifiedunder the Plan. Governments have jointly committed a total of$1.4 billion for the NAP over seven years to 2007-08.NDSP. National Dryland Salinity ProgramThe NDSP was established in 1993 to address the lack ofopportunity for the research community to cooperate acrossdisciplines, organisational boundaries and state borders toaddress the management of dryland salinity. The program’s goalis to research, develop and extend practical approaches toeffectively manage dryland salinity. The program, whichcompleted a second phase in 2003, is managed by Land andWater Australia on behalf of a consortium of organisations. In2003-04 the NDSP will focus on four key areas: policy,production, catchments and networks as part of an acceleratedcommunication and regional consultation process.NHT. Natural Heritage TrustThe Australian Government established the NHT in May 1997to fund environmental protection, sustainable agriculture andnatural resource management.Trust funding totalling $1.4 billionsupported some 12,000 projects and related programs over sixyears to 2001-02. More than 400,000 Australians were involvedin these projects. In the May 2001 Budget, the NHT wasextended with the allocation of an additional $1 billion for afurther five years to 2006-07.Trust funds are delivered at threelevels: national investments, regional investments and a localcomponent to directly fund some community groups. Underthe NHT Extension, states and territories have agreed toprovide matching funding for investments at the regional level.Funding for projects is delivered under four Trust programs:Landcare, Bushcare, Rivercare and Coastcare.The 2004 Budgetprovided an additional $300 million for the NHT to 2007-08,bringing total investment in the Trust to $3.0 billion.NLP. National Landcare ProgramThe objective of the NLP is to increase the engagement ofindustry and resource users in Landcare and NRM activities.The NLP has a focus on sustainable farming and sustainableland management. NLP investments currently consist of acommunity support and a national component.There are 4000Landcare groups, involving 40 per cent of the nationís farmers.In 2003, the NLP received an additional $122 million in fundingfor the three years to 2005-06.The 2004 Budget extended theprogram by providing an additional $80 million ($40 million inboth 2006-07 and 2007-08).
NLWRA. National Land and Water Resources AuditEstablished in 1997, the NLWRA is a $30 million researchprogram funded under the NHT, the objective of which is tofacilitate improved decision making on land and water resourcemanagement issues, particularly by the Australian and stategovernments. Now in its second phase, June 2002-June 2007,the audit will provide data, information and assessments ofAustralia’s land, water and biological resources to supportsustainable development. A core function will be to collatenatural resource information to support the monitoring andevaluation of the NAP and the NHT. Two key auditinformation products are the Australian Natural ResourcesAtlas and the Australian Natural Resources Data Library. Oneof the audit’s principal pieces of research has been theAustralian Dryland Salinity Assessment 2000.public good.A benefit accruing to the community as a whole.private good.A benefit accruing to an individual or individual organisations.PURSL.Productive Use and Rehabilitation of Saline Land.RDC.Research and Development Corporation.recharge.Water that has drained below the root zone of any localvegetation and which is then able to drain downward to add tothe underlying layer of saturated soil, or groundwater.recharge area.An area where water enters the soil and contributes to thegroundwater store. Upper slopes and areas with shallow soilsare common recharge areas. Recharge is maximised where soilsoverlie fractured rocks, where soils are highly permeable, wherevegetation is shallow-rooted or absent, and when rainfallexceeds evapotranspiration.regolith.A general term for the entire layer of fragmental and loose,incoherent or unconsolidated rock material of whatever origin(residual or transported) and of very varied character, thatnearly everywhere forms the surface of the land and overliesor covers the bedrock.riparian.Of, inhabiting, or situated on the bank and floodplain of a river.river salinity.River salinity is caused by saline discharges from dryland,irrigation and urban salinity, and aquifers into creeks and rivers.salinisation.Degradation of the soil or water through the accumulation ofsalts. Land salinisation occurs following the accumulation ofsoluble salts (usually sodium chloride) at or near the soilsurface, to a level that causes degradation.This usually occursthrough the evaporation of groundwater that dischargesthrough the soil surface.Water salinisation usually results fromincreasing salinity of run-off and groundwater.salinity.The concentration of dissolved salts in groundwater or riverwater, usually expressed in EC units.

P A G E 7 1
Salinity Management Triage.In considering possible options to manage salinity there arethree possible alternatives available:1. Options that seek reduce the impact of current salinity
issues within a “reasonable” timeframe2. Options that seek to avoid future salinity impacts3. Options that seek to adapt to saline environssalt scald.An area where salt crystals accumulate on the soil surface,suppressing plant growth and often leading to surface soilerosion which can expose saline subsoils.surface water.Water on the surface of the land, for example, rivers, creeks,lakes, dams and overland flows.urban salinity.Salinity that occurs as a result of urban activities.waterlogging.Saturation of soil with water, resulting from over irrigation,seepage or inadequate drainage.watertable.The upper surface of a layer of soil or rock material that issaturated with water.
This glossary has been compiled from the following source:House of Representatives - Science Overcoming Salinity - 2003

P A G E 7 2