3.3.1 Introduction Engineers and geologists surveying and exploring for hydrocarbons take advantage of numerous measurement and analysis techniques for use in wells in order to investigate underground properties, in particular those relating to the layers believed to be potential hydrocarbon reservoirs. Some of these measurements are direct and are mainly used in the examination of samples recovered during drilling (full hole cores, sidewall cores, cuttings, fluids, etc.); others, instead, are indirect measurements and are used during well in order – through appropriate correlations and adjustments – to arrive at the same physical properties as those that would be produced by direct measurements. Generally speaking, the measurements made in the wells cover a wide variety of properties, which may be either lithological, palaeontological, and geometric (depth, thickness and inclination of the layers, etc.), or else physical (pressure, temperature, type of fluid, density, viscosity, natural or induced radioactivity, velocity of seismic waves, electrical resistivity, electromagnetic propagation, acoustic attenuation, nuclear magnetic relaxation, etc.). These measurements, which in many instances require the use of advanced technologies, can have a significant impact on overall costs and therefore have to be carried out and evaluated with great care, especially when operating in an exploration well. 3.3.2 Control of drilling parameters and geological monitoring: mud logging The first measurements carried out in a well relate to mechanical drilling parameters and geological services. In fact, on each drilling site a service is carried out (usually by a service company) involving picking up and analysis of cuttings, monitoring of the drilling mud, and acquisition and processing of drilling data. This continuous analysis activity, called mud logging, permits real-time detection of the presence of any hydrocarbons in the underground bearing formations. It allows the mud loggers to monitor the operating conditions inside the well constantly, from the beginning of drilling through to arrival at the target depth. The cuttings are brought to the surface in the drilling fluid or mud, from which they are then separated mechanically in shale-shakers, centrifugally in desanders and desilters, or by gravity in decantation pits. The analysis of these cuttings is very important because it makes it possible to identify the type of rock being drilled, and at times can also furnish valuable information about their mineralization. The information provided by the cuttings has the advantage of being almost immediate, and therefore makes it possible to monitor the drilling and plan other special operations, such as, for example, conventional mechanical core sampling (see Section 3.3.3). Moreover, in situations where core sampling is neither technically nor economically feasible, the cuttings brought to the surface by the mud become an even more valuable source of information: in fact, they can be used to carry out a form of direct measurements from which it is also possible to adjust all the indirect measurements taken in the borehole during and after drilling. Moreover, they make possible the majority of the micro-palaeontological investigations. Both the quantity to be collected and the frequency are controlled by the site geologist: the sampling programme is defined on the basis of the sampling interval (which in turn is set out in the geological 355 VOLUME I / EXPLORATION, PRODUCTION AND TRANSPORT 3.3 Measurement and analysis in the well
Transcript
3.3.1 Introduction
Engineers and geologists surveying and exploring forhydrocarbons take advantage of numerous measurementand analysis techniques for use in wells in order toinvestigate underground properties, in particular thoserelating to the layers believed to be potentialhydrocarbon reservoirs. Some of these measurementsare direct and are mainly used in the examination ofsamples recovered during drilling (full hole cores,sidewall cores, cuttings, fluids, etc.); others, instead, areindirect measurements and are used during well in order– through appropriate correlations and adjustments – toarrive at the same physical properties as those thatwould be produced by direct measurements.
Generally speaking, the measurements made in thewells cover a wide variety of properties, which may beeither lithological, palaeontological, and geometric(depth, thickness and inclination of the layers, etc.), orelse physical (pressure, temperature, type of fluid,density, viscosity, natural or induced radioactivity,velocity of seismic waves, electrical resistivity,electromagnetic propagation, acoustic attenuation,nuclear magnetic relaxation, etc.). Thesemeasurements, which in many instances require theuse of advanced technologies, can have a significantimpact on overall costs and therefore have to becarried out and evaluated with great care, especiallywhen operating in an exploration well.
3.3.2 Control of drilling parameters and geological monitoring:mud logging
The first measurements carried out in a well relate tomechanical drilling parameters and geological
services. In fact, on each drilling site a service iscarried out (usually by a service company) involvingpicking up and analysis of cuttings, monitoring of thedrilling mud, and acquisition and processing of drillingdata. This continuous analysis activity, called mudlogging, permits real-time detection of the presence ofany hydrocarbons in the underground bearingformations. It allows the mud loggers to monitor theoperating conditions inside the well constantly, fromthe beginning of drilling through to arrival at the targetdepth.
The cuttings are brought to the surface in thedrilling fluid or mud, from which they are thenseparated mechanically in shale-shakers, centrifugallyin desanders and desilters, or by gravity in decantationpits. The analysis of these cuttings is very importantbecause it makes it possible to identify the type ofrock being drilled, and at times can also furnishvaluable information about their mineralization. Theinformation provided by the cuttings has the advantageof being almost immediate, and therefore makes itpossible to monitor the drilling and plan other specialoperations, such as, for example, conventionalmechanical core sampling (see Section 3.3.3).Moreover, in situations where core sampling is neithertechnically nor economically feasible, the cuttingsbrought to the surface by the mud become an evenmore valuable source of information: in fact, they canbe used to carry out a form of direct measurementsfrom which it is also possible to adjust all the indirectmeasurements taken in the borehole during and afterdrilling. Moreover, they make possible the majority ofthe micro-palaeontological investigations. Both thequantity to be collected and the frequency arecontrolled by the site geologist: the samplingprogramme is defined on the basis of the samplinginterval (which in turn is set out in the geological
355VOLUME I / EXPLORATION, PRODUCTION AND TRANSPORT
3.3
Measurement and analysisin the well
drilling programme) and the type and quantity of thesample to be collected. As far as the types areconcerned, they can be classified as: washed anddried; unwashed and undried; stored in a salinesolution. Normally, about 200 g of material isrecovered at a frequency of between 0.5 and 5 m ofdrilling.
The size of the cuttings varies depending on thenature of the rock and the type of drilling bit beingused. According to the bit used, pieces of clay or marlare relatively big with smoothed edges, whereasarenaceous or calcareous pieces are smaller and havesharper edges. Using diamond drilling bits, or veryworn tricone bits, the cuttings may be very small.Moreover, in this case, the quality is poorer and thesizes of the samples are smaller when the cuttings areground up again at bottomhole, as a result of the use ofunder-powered well pumps with an inadequate cuttingcarrying capacity.
The depth from which the cuttings have come isnot the same as the borehole depth at the time of theircollection on the surface: so account must be taken ofthe progress made by the bit during the time it takesfor the cuttings to reach the surface. As a generalapproximation, calculation of the time taken by thecuttings to reach the surface is based on the circulationrate of the mud. In some cases, however, the differencebetween the time taken by the cuttings to reach thesurface and that taken by the mud (lag time) can varysignificantly, depending particularly on the propertiesof the cuttings, the depth of the borehole, theconditions in the well and the power of the pumps. Itcan be measured fairly accurately by periodicallyinserting into the well some easily identifiabletracking material (markers), which has more or lessthe same rate of travel as the cuttings. Then, the time itwould take for the mud to reach the bottom of the wellis calculated and subtracted from the total timeactually taken by the markers to make the round trip.
In order to obtain information which will be usefulin carrying out the drilling, examination of the cuttingsis performed in such a way as to avoid thecontamination of the material from the zone of interestwith extraneous material which could come loosethrough collapsing of the sidewall of the borehole, andthen become mixed with the cuttings. Generally, thisexamination can be divided into four phases: a)lithological and petrographic examination; b)calcimetry; c) dolomite measurement; d) measurementof chlorides. In addition, the palaeontologicalexamination is also very important: indeedexamination of the fossils makes it possible to obtaindefinitive information about the stratigraphy and thesedimentary environment of the drilled rocks. It isalmost impossible for large sized organisms to be
recovered from the cuttings; so it is necessary to resortto inspection of microfossils which are always presentin the sediment and which consist of microscopicsized organic remains. The most commonlyencountered micro-fossils are foraminifers, singlecelled organisms which are especially useful becauseof their particular stratigraphical distribution.Inspection of the micro-fossils varies depending on thetype of rock being examined. Loose rock – whichincludes clay, sandy clay, lightly hardened sand, claymarl or sandy marl – can be broken up merely bywashing with water: this removes the clay leavingbehind a residue consisting of sand and fossil remains.The washing is carried out on a measured quantity ofcuttings, to enable calculation of the residuepercentage, information which at times can be veryimportant. Above all, examination of the residueinvolves determining the frequency of the mineralsand rock fragments present, as well as the shape of thegranules and their state of preservation. Compactedrocks can only be examined using the thin sectiontechnique, depending on the size of the sample; it isnow possible to carry out this type of operation oneven extremely small-sized fragments.
In mud logging, particular importance is given toboth analysis of the hydrocarbons (liquid and gas)present in the mud, and evaluation of the fluorescenceof the cuttings: it involves the use of important currenttechnology for real-time assessment, during drilling,of the existence or otherwise of potential reservoirs.Indeed, the presence of hydrocarbons can bedetermined by direct observation only when they arepresent in high enough quantities in the drilling mudreturns: petroleum is detectable through characteristiciridescent spots, while gas is identified throughinflammable bubbles which appear on the surface inthe mud pits. The quantity of these bubbles may besufficient to emulsify the mud or even to produce anuncontrolled gas blow-out. When, instead, theevidence of the presence of hydrocarbons is moretenuous, the use of measuring instruments is required:in the case of hydrocarbon liquids a Wood’s lamp isused to make a qualitative assessment and afluorometer for a quantitative assessment. For gaseoushydrocarbons, gas detectors are used to measure thequantities of C1 to C5, H2 and N2, while gaschromatographs and mass spectrometers carry out aquantitative analysis for each of the components C1,C2, C3, i-C4, n-C4, n-C5, and CO2.
With specific reference to quantitative analysis ofthe principal alkane components of the gas mixturepresent in the mud, in recent years there has beenintense research activity to develop mud loggingtechniques which would be able to improve real-timeformation evaluation. In particular, they include the
356 ENCYCLOPAEDIA OF HYDROCARBONS
DRILLING AND COMPLETION OF WELLS
techniques which fall under the heading of Gas WhileDrilling (GWD), or rather the combined use ofquantitative parameters and those actually relating tothe drilling, such as the rate of penetration, weight onthe bit, mud flow rate and borehole diameter.
Analyses similar to those carried out on the drillingfluids to detect the presence of hydrocarbons can alsobe performed on the cuttings. However, the presenceof hydrocarbons in the mud and/or the cuttings (whichcould be caused by a multiplicity of factors such as theporosity and permeability of the rock, the rate ofpenetration, the properties of the drilling mud, etc.)does not in itself constitute proof of the discovery of acommercially viable deposit. Nevertheless, wheneverthey are present they should be evaluated verycarefully, together with the other available data.
With regard to measurements relating tomonitoring of the drilling (see Section 3.3.4 andChapter 3.2), these have to do with the geometry ofthe well (diameters, depth, azimuth and inclination), aswell as measurements of the mechanical propertiesassociated with the drill string (weight, rotation speedand torque applied to the bit, rate of penetration, mudflow-rate, etc.) and, finally, measurements associatedwith the drilling fluid (pressure, temperature, densityand mud flow-rate in and out of the circuit).
3.3.3 Conventional core sampling
Generally the expression conventional core samplingis used to refer to the mechanical operations for therecovering of cylindrical samples from a well, calledcores. This recovery makes it possible to carry out adirect underground inspection at depths scheduled inthe original project. This is done primarily todetermine the lithological, petro-physical andpalaeontological properties of the formations beingdrilled, to ascertain the nature of fluids that may bepresent, as well as to determine the disposition of thestrata and possibly the geomechanical properties of theformations under drilling (see Chapter 4.1). Coresampling should not, however, be thought of as theonly technique available, because as already stated,examination of underground properties can also becarried out with great accuracy through continuousmonitoring of the drilling parameters (see Section3.3.4), and through inspection of the cuttings (seeSection 3.3.2). Conventional core sampling can becarried out through the mechanical recovery of fullhole cores, or of sidewall cores.
Full hole samplingFull hole sampling is carried out using a tool
attached to the end of the drill string called a core
barrel which is used to collect and store the full holecore after it has been cut. The core barrel is screwedabove the coring bit, which is shaped like a circularcrown equipped with cutters. To bring the sample tothe surface the core has first to be cut and storedinside the core barrel, using a technique similar torotary drilling with mud circulation, and then to bringthe drill string back to the surface once the core barrelis full. These operations are rather time consuming,with a corresponding increase in drilling costs. For thisreason full hole cores are recovered only if there arevalid objectives and as infrequently as possible; thewells from which they are taken are referred to as keywells. There are three types of core barrel in generaluse: single tube, double tube and wireline.
The first is basically a tube with strong sidewallsscrewed onto the bottom of the drill string, equipped atits lower end either with a shoe with cutters, or with anactual core bit. The advantage of this type of corebarrel derives from its relative simplicity, although thismay be at the expense of the quality of the core sampleobtained, the percentage recovery and most importantof all, the efficiency and speed of drilling. The maindisadvantage comes from the fact that the core samplecomes into direct contact with the circulating drillingfluid (and can therefore be damaged by being washedaway), and is also subject to possible lateral frictionfrom scraping against the rotating body of the tool.
The double-tube core barrel instead, is composedof two distinct coaxial cylindrical parts: the outermostis connected to the drill string, while the innermost,being detached from the rotary motion of the other,receives the core sample as soon as it has been cut,protecting it from the circulating drilling fluid and thelateral friction resulting from the rotation of the tool(Fig. 1). The achievable recovery varies between 40%and 80%, depending on the rock being sampled, but inany case is superior to that obtainable with single tubecore barrels. To try to increase the recovery, doublecore barrels are available which have the internal core-holder tube lined with a low friction material such asaluminium, fibreglass or PVC (polyvinyl chloride):this provides greater protection for the core sample,especially in soft, loose or fractured formations. Othermethods for increasing the recovery from the sameformations involve the use of core barrels with totallyenclosed core grabbers. This type of core sampling iscarried out in the same way as conventional sampling:at the end of the operation, a mechanism activated bythe pressure of the drilling fluid raises the internal tubea few centimetres, allowing the core grabber to closecompletely, sealing the inner tube. In this way, the riskof the core sample becoming unscrewed and being lostduring the process of being brought to the surface iseliminated. Protection of the core sample, which is
357VOLUME I / EXPLORATION, PRODUCTION AND TRANSPORT
MEASUREMENT AND ANALYSIS IN THE WELL
always necessary, is achieved by the use of core-holders lined with aluminium or fibreglass. Thedouble-tube core barrel can be fitted with either atraditional core bit, or with a diamond bit. The latter,in the case of hard rocks, offers better performance,since it enables almost total recovery of the sample,and is actually the most widely used, due to itsreliability in obtaining long samples (up to more than9 m in a single trip). For loose or very fracturedformations, petroleum technology has introduced a
type of core barrel with a rubber sleeve (rubber sleevecore barrel), which makes it possible to achieveexcellent recovery and better quality samples.Techniques have also been developed to protect thecore sample with gel, conceived and developed aboveall to minimise the problem of both wettabilityalteration and drilling fluid invasion.
Finally, core sampling can also be carried out usingwireline core barrels, which enable the extraction ofthe rock samples through the drill pipe withoutwithdrawing the core barrel. This is made possible byusing a fishing tool which is lowered from the surfaceon a steel wireline to latch onto the inner tube of thecore barrel; with this system the recovery is verysimilar to that using double-tube core barrels, whilethe disadvantage is that the diameter of the obtainablesample is very much smaller than the diameter of theborehole being drilled.
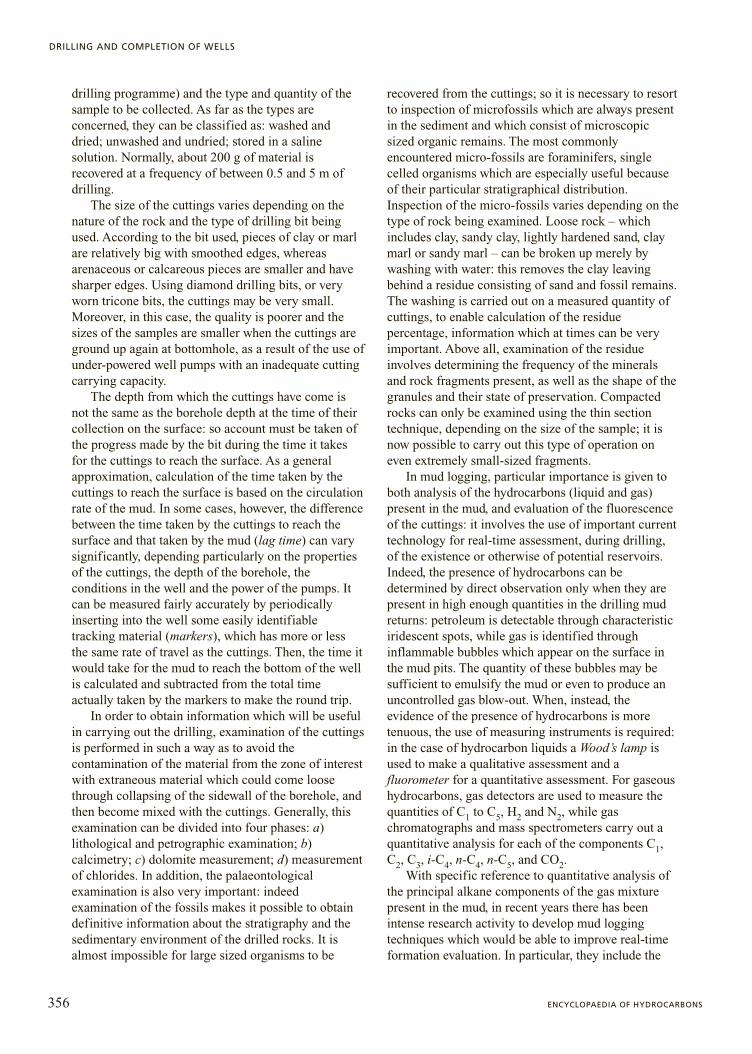
Core sampling using core barrels with either singleor double tubes, whilst being the most widely usedtechnology, has the great inconvenience of being timeconsuming, since extraction of the core samplerequires withdrawal of the entire drill string. Inaddition, the rate of penetration of the core bit isusually slower than that achievable using a traditionaldestructive bit. To try to reduce, even if only partially,the serious increase in drilling times, a technique hasbeen developed which enables conventionaldestructive drilling and wireline core sampling to becarried on simultaneously. This method can be used insituations in which it is difficult to establish inadvance the points at which sampling should becarried out (especially in exploratory boreholes) orwhen conventional sampling is not economicallyfeasible. In this way it is possible to drill and samplealternately, without having to go through the processof withdrawing the drill string to mount the corebarrel. In fact, the full diameter bit can be convertedinto a core bit thanks to the removal of an extractablecentral cylinder: in core sampling mode, the removablecentral cylinder is recovered through the drill pipe, andthe tool operates like a wireline core barrel, and viceversa (Fig. 2).
Sidewall samplingSidewall sampling is carried out with tools that
enable the collection of samples or small cores of rockfrom the sidewalls of a well that has already beendrilled, in the normal direction of the well’s axis.Although the core samples obtained are of reduceddimensions their use is nevertheless increasing, as theycan be used to integrate full hole cores in order toimprove formation evaluation. Sidewall core barrelshave become more widely used since the developmentof the wireline log which makes it possible to identify
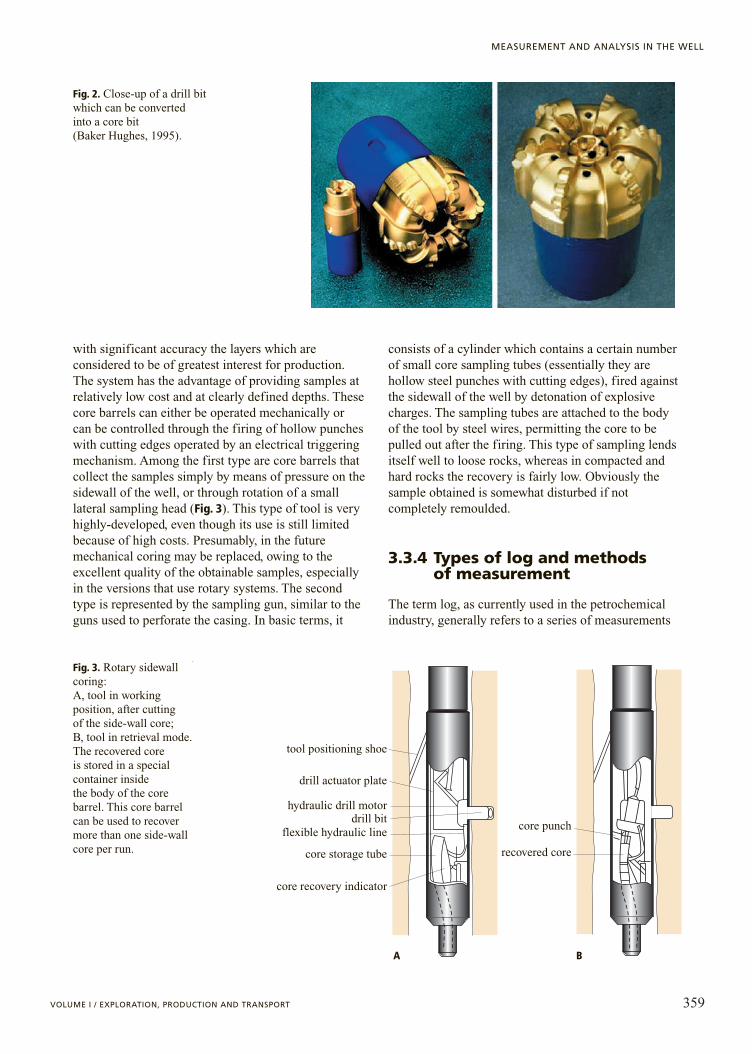
with significant accuracy the layers which areconsidered to be of greatest interest for production.The system has the advantage of providing samples atrelatively low cost and at clearly defined depths. Thesecore barrels can either be operated mechanically orcan be controlled through the firing of hollow puncheswith cutting edges operated by an electrical triggeringmechanism. Among the first type are core barrels thatcollect the samples simply by means of pressure on thesidewall of the well, or through rotation of a smalllateral sampling head (Fig. 3). This type of tool is veryhighly-developed, even though its use is still limitedbecause of high costs. Presumably, in the futuremechanical coring may be replaced, owing to theexcellent quality of the obtainable samples, especiallyin the versions that use rotary systems. The secondtype is represented by the sampling gun, similar to theguns used to perforate the casing. In basic terms, it
consists of a cylinder which contains a certain numberof small core sampling tubes (essentially they arehollow steel punches with cutting edges), fired againstthe sidewall of the well by detonation of explosivecharges. The sampling tubes are attached to the bodyof the tool by steel wires, permitting the core to bepulled out after the firing. This type of sampling lendsitself well to loose rocks, whereas in compacted andhard rocks the recovery is fairly low. Obviously thesample obtained is somewhat disturbed if notcompletely remoulded.
3.3.4 Types of log and methods of measurement
The term log, as currently used in the petrochemicalindustry, generally refers to a series of measurements
359VOLUME I / EXPLORATION, PRODUCTION AND TRANSPORT
MEASUREMENT AND ANALYSIS IN THE WELL
Fig. 2. Close-up of a drill bitwhich can be converted into a core bit (Baker Hughes, 1995).
tool positioning shoe
drill actuator plate
hydraulic drill motor
core punch
recovered core
drill bitflexible hydraulic line
core storage tube
core recovery indicator
Fig. 3. Rotary sidewallcoring: A, tool in workingposition, after cutting of the side-wall core; B, tool in retrieval mode.The recovered core is stored in a specialcontainer inside the body of the corebarrel. This core barrelcan be used to recovermore than one side-wallcore per run.
A B
taken in the well (well logging) carried out in order toascertain subsoil properties. Depending on the depth,the recordings are made with different instruments(sondes) lowered into the well either on a cable (in thisinstance the recordings are usually called wirelinelogs), or by means of the drill string or pipes, in thisinstance carrying out real-time recordings calledMeasuring While Drilling (MWD) or geosteering oreven Logging While Drilling (LWD). Themeasurements recorded relate to the geological,geometrical, geomechanical and petrophysicalexamination and identification of the undergroundformations under drilling.
Wireline logWireline logs are used most effectively in a variety ofapplications, among which are: a) comparison ofdifferent formations between the wells of one field orbetween fields in the same basin; b) identification ofhydrocarbon bearing levels; c) estimation of the netthickness of the mineralized bearing layers (net pay);d) quantitative estimation of various petrophysicalproperties of the mineralized bearing layers.
With reference to the purpose of the survey, threemajor log types can be defined: lithological logs;porosity logs; resistivity logs. The lithological logsreport the recording of the electrical potential generatedin the well by the natural battery formed by the filtrateof the drilling fluid/water in the layer/clay (self potentiallog), or the recording of the natural radioactivity of thesediments (gamma ray log). They make it possible todistinguish the layers of ‘clay’ (impermeable layers atthe top and bottom of the reservoir), from the ‘non-clay’(porous and permeable layers such as sand, sandstone orlimestone, potential locations of reservoirs).
The porosity logs report measurements within theformations of the speed of the elastic waves (soniclog), the absorption of gamma photons (density log),or the energy drop and the absorption of neutrons(neutron log), etc. From the values of the recordedparameters it is possible to determine the porosity,amongst other things, using calculation tables derivedfrom various physical models (see Chapter 4.1).
The resistivity logs can be used as an indirectmeasurements of water saturation (see Chapter 4.1).Nowadays, they provide the values of the electricalresistivity of the rock by means of focused electricalcurrents (laterolog, induction log). There are twofamilies of such logs: very deep investigations (1-2 m),which provide data about ‘virgin’ formations, in otherwords, not contaminated by the filtrate of the drillingfluid; shallow depths of investigation, where they areused for the vertical definition of thin layers (micrologand microlaterolog). Moreover, beside these threemajor log types, new and promising logs based on
Nuclear Magnetic Resonance (NMR) and imagingtechniques are being developed.
The various types of logs available are differentiatedby a number of properties such as vertical resolution,radial depth of investigation, sampling intervals and thestate of the borehole. Vertical resolution is the minimumthickness of a homogenous formation level, in relationto which the average value of a physical parameter,measured at a central point of a log, matches the actualvalue. So the vertical resolution represents theminimum thickness from which a meaningful readingcan be obtained, and it is generally governed by thegeometric properties of the sonde.
The radial depth of the investigation is the radialdistance by the axis of the well, within which thematerial being surveyed has a significant effect on themeasurement being recorded. The radial depth of theinvestigation is also to a large extent governed by thegeometric elements of the sonde. The samplinginterval is the vertical distance between twoconsecutive measurements. In the graphicalrepresentation of the log, the curves are obtained byinterpolating the individual measurements taken ateach sampling interval. Finally, with regard to thecondition of the well, in the majority of loggingoperations it is assumed that the conditions are ideal,in other words that the measurements are taken in ahomogenous, isotropic medium that extends toinfinity, and are carried out within a cylindricalborehole with a constant diameter and filled withhomogenous drilling fluid with known properties.Each type of sonde, however, is designed to operate indistinct and specific borehole conditions, andtherefore the more these conditions deviate from theideal, the less representative the log interpretationbecomes. Hence, the data obtained in a log in a realwell must be corrected before being interpreted, inorder to take account of the environmental conditionsunder which the measurements were taken. Theparameters that have the most significant impact onthe quality of the recorded data are: a) the geometry ofthe borehole; b) the properties of the drilling fluid; c)the temperature of the layer; d) the radial variation ofthe formation’s characteristics.
The recording of the log is carried out by means of acombined tool which basically is comprised of one ormore sondes, a wireline and a mobile unit adapted fortransportation enabling it to be self-sufficient both interms of carrying out and recording the measurementsand in terms of on-site maintenance of the sondes.
The sonde represents leading edge technology,containing all the electronic components dedicated tothe operation of the sensors needed for measuring andthen transmitting the data to the surface. The wirelineis used to supply electrical power to the sonde, to
360 ENCYCLOPAEDIA OF HYDROCARBONS
DRILLING AND COMPLETION OF WELLS
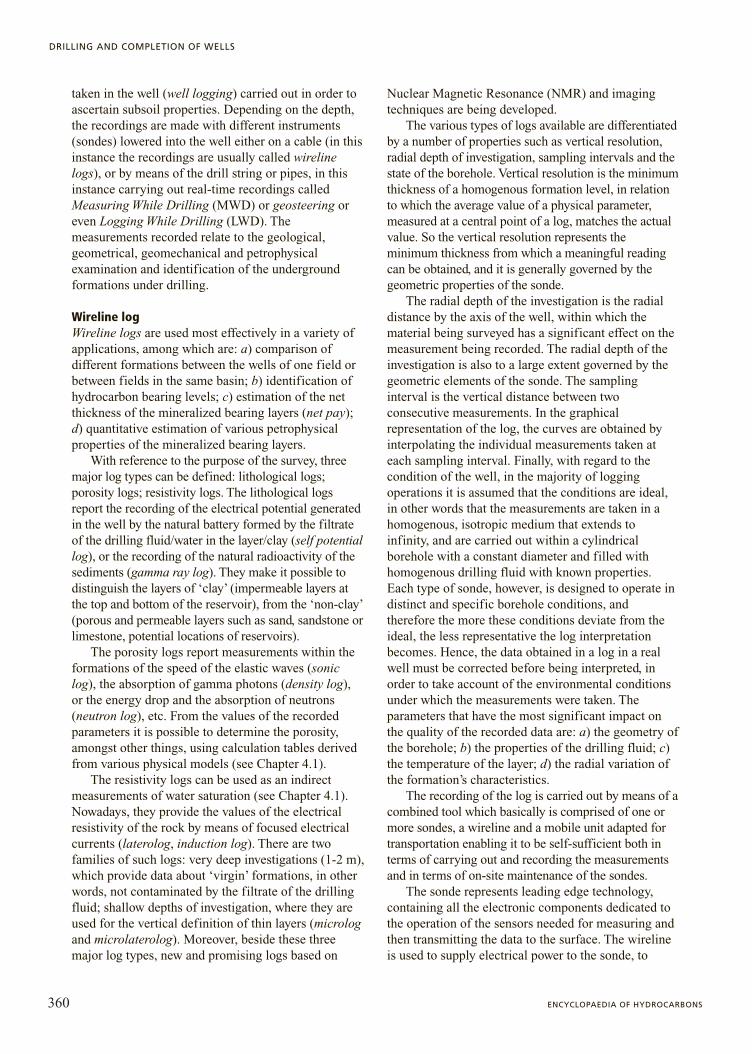
transmit the data to the surface and, obviously, tomanoeuvre the tools within the well. The mobile unitis a complete data checking and processing unit and itcontains: a) the reel on which the wireline is wound;b) a small winch for unwinding and rewinding thewireline; c) a system for measuring the length of thewireline lowered into the well; d) equipment fortelemetry and for initial recognition analysis of thesignals received from the sonde; e) a data processingsystem; f) devices for both analogue and digitalrecording of the measurements taken in the well. Fig. 4shows the layout of the vehicle, the wireline and thesonde during a normal logging operation, carried outat the end of one of the well’s drilling phases.
Recording of the log takes place while the sonde isreturning to the surface, so that a constant tension ismaintained on the wireline, thus ensuring accuratemeasurement of the depth. The lowering of the tool intothe well provides an opportunity to check the depthmeasuring system: the measured depth of the wireline(depth from log) should in fact match, aside from anystretching, the depth measured during drilling (depthfrom drillers). The speed of tool ascent, which variesaccording to the type of log and the precision ofmeasurement required, is accurately controlled and, ifpossible, is kept constant. The description of anunderground geological structure is valueless if it is notaccompanied by an accurate indication of the depth.Monitoring of the depth is therefore fundamental to thesuccess of any well logging, well drilling or wellcompletion. When carrying out a logging operation inan open hole conditions (in other words where thecasing has not yet been set), the wireline is a very usefuldevice for determining depth. To that end, its calibrationis based on the known elasticity of the wireline and onthe verification of the stretching caused by variations ofthe load; by taking these into consideration (along withthe stretch coefficient of the wireline) it is possible tocome up with the actual depth measurement.
Two systems are used for measuring depth – oneusing a calibrated pulley and the other a calibratedwireline – with which it is possible to achieve aprecision approaching the order of 0.01%. The first isbased on the use of a measuring pulley through whichthe wireline runs during the operation, while the secondis based on the use of a wireline that has been markedwith magnetic or radioactive spots in a workshop underworking conditions with an average load.
Transmission of the signals through the wirelinecan be carried out in either analogue or digital formats(the latter is preferable because it reduces interferenceand attenuation of the signal). As far as analysis of therecorded data is concerned, this can be partiallyperformed immediately on-site. Handling of thesignals, therefore, is managed by the calculation andlogging devices installed in the mobile unit. Thecalculation units carry out calibration of the signals,stacking of different logs and calculation of themeasurement details (e.g., lithology, porosity andwater saturation). All the signals coming from thesensors and the measurement values processed by thecalculation unit are recorded on tape and/or magneticdisc. All the recordings are always preceded by adescription of the measurements taken (type of sonde,checks, scale, unit of measure, etc.), information aboutthe well, the drilling fluid, as well as information of amore general nature: this makes up the log header,following the recommended criteria of the API(American Petroleum Institute) standards.
After the operator and the oil company’srepresentative have carried out a quality check, thelogs are used for immediate on-site interpretation,something which is extremely important since itmakes it possible to obtain information for planningthe next on-site operations (setting the casing,identification of depths at which to performproduction tests, identification of portions of casingthat have not been well cemented, advisability ofabandoning the well, etc.). At the end of the loggingoperation, the analogue data (field print), the tapes ormagnetic disks containing the processed andunprocessed data (and if available, the film with theanalogue recordings), are immediately sent to the dataprocessing centre of the oil company and of the datalogging service company which produced the log, forfurther processing and interpretations.
The results of a log are reported as diagrams havingthe depth on the vertical axis and the measurements ofthe parameters on the horizontal (Fig. 5). Generally, thewidth of the chart is sub-divided into a certain number oftracks, in which one or more curves are reported, andwhich have either a linear or a logarithmic scale, thelatter being used when the parameter being measured hasa wide range of values (e.g., measure of resistivity),
361VOLUME I / EXPLORATION, PRODUCTION AND TRANSPORT
MEASUREMENT AND ANALYSIS IN THE WELL
control panels and recorder
cable tension measurement
cable
sonde
depth measurement
cable winch
Fig. 4. Set up of the mobile unit during a logging operation.
while the former is used when the measurementstypically fall within a narrow range of values (e.g.,measure of porosity). It is quite common for logs to berecorded simultaneously on two depth scales: one forcomparison (1:1,000 or 1:500) and one for detail (1:200).
Real-time measuring systems:Measuring While Drilling (MWD)
The MWD system consists of taking certainmeasurements around the bit and transmitting them tothe surface while drilling is in progress. In essence, itinvolves real-time recording and sending of data fromthe bottom hole. The real-time information that is ofmost interest includes the directional parameters(inclination and direction); the drilling parameters
(weight on bit, rotation speed, torque, penetration,etc.); and finally, the petrophysical properties of theformations under investigation. The MWD systemessentially consists of equipment at the bottom holeand another on the surface. The former comprises oneor two sections of drill collars, between which areinstalled the directional sensors – accelerometers andmagnometers which measure elements of thegravitational and magnetic fields, in order todetermine the inclination by respect to the vertical andthe direction by respect to magnetic North – andsensors for collection of the log, as well as electronicinstruments for measuring and transmitting the data.The surface equipment, on the other hand, consists ofa recording system for decoding and processing thedata received from the downhole equipment.
The most important part of the MWD systemconsists of the equipment for transmitting the data,which can be based on either the transmission ofelectromagnetic waves through the drill string, orthrough the generation of pressure waves through themud column.
The electromagnetic MWD system uses an antennamounted inside a drill collar which sends lowfrequency electromagnetic waves in the form of amodulated signal, transmitting the data in binary code.The receiver consists of an antenna fixed in the ground
362 ENCYCLOPAEDIA OF HYDROCARBONS
DRILLING AND COMPLETION OF WELLS
insulatedsection
receiver
antenna
EMtransmitter
Fig. 6. Electromagnetic MWD system.
SP
SP
Induction
Conductivity
Amp 16" Normal
16" Normal
00 4,000
8,0000
4,0000
210
100
00
10100
DEPTH
DEPTH
Linear Grid
Logarithmic Grid
16" Normal
Induction Resistivity40" Spacing
RESISTIVITYW m2/m
RESISTIVITYW m2/m
SHALLOW FOCUSED LOG
MEDIUM INDUCTION LOG
MEDIUM
SHALLOW FOCUSED
DEEP INDUCTION LOG
DEEP
CONDUCTIVITYmS/m
Induction Conductivity40" Spacing
SPmV
Rm=0.7 a 78°Rm=0.64 a 78°
BHT=190° a 10,500
SPmV
20
SP
0.2 1.0 10 100 1,000
0.2 1.0 10 100 1,000
0.2 1.0 10 100 1,000
Fig. 5. Typical log registration. The depth scaleis on the vertical axis, and three recordings(spontaneous potential, electrical resistivity at different investigation depths, and electricalconductivity of the induction log) can be seenon the linear grid, while on the logarithmic gridthere are two recordings (spontaneous potentialand electrical conductivity induction log atdifferent investigation depths) (Western Atlas, 1992).
near the wellhead (Fig. 6). This system offers severaladvantages, for instance, it does not interfere with thedrilling operation; the data can be transmitted evenwhen the drill string is being extracted from the well;and finally, it allows two-way communication, so thatsignals can also be sent to the downhole equipment, inorder to activate or modify both the sequence settingsof the parameters to be gathered and the optimumtransmission rate. Nevertheless, since only lowfrequency electromagnetic waves can be transmittedeffectively, there is a problem of signal attenuationwith this system. Moreover, these frequencies aredifficult to distinguish from those emitted fromelectrical equipment on the surface. Since signalattenuation increases with depth, this type of telemetrytends to be restricted to depths of about 2,000 meter.
Most of the MWD systems currently in operationuse the telemetric transmission system involvingpressure waves in the mud. The main components arehoused in a drill collar located at the bottom of the drillstring, and are comprised of an energy source, sensors,a transmitter and a control system. The surfaceequipment consists of : a) a pressure transducer locatedon the mud standpipe; b) a signal filtering device toreduce the interference produced by the pumps ormotors; c) a processor to decode and interpret thesignals; d) a screen to display the recorded data.
In general there are three transmission systems inuse: positive impulse, negative impulse or continuouswave. The positive impulse system uses a valve whichintercepts the entire flow of mud within the drill string(Fig. 7). This valve is operated by an electronicallycontrolled hydraulic system, and when it is activated itcauses a reduction in the mud flow and an increase in thepressure at the standpipe. In addition, the alternatemotion of the mud creates a series of impulses, whichare modulated using a binary code, that are thenidentified by the pressure transducer and decoded by theprocessor. The messages are transmitted in accordancewith precisely timed sequences, made up of a specificnumber of words, at a very low speed (about 0.4 bit·s–1).
The negative impulse MWD system uses a valvewhich allows part of the mud flow to pass into theannulus, and, when activated, it causes a decrease inthe pressure at the standpipe (Fig. 8). In this case also,the absence or presence of an impulse within a timedsequence makes it possible to create a code which canbe transmitted to the surface. The transmission rate ofthis system is about 1 bit·s–1.
In contrast to these two systems, the continuouswave MWD system is not based on the transmissionof distinct impulses, but on the generation of acontinuous wave (Fig. 9). The modulating device ismade up of a rotary valve (siren), composed of a pairof perforated discs, normally located in the mud flow.The first disc is stationary, while the second isoperated by a motor. The continuous rotation of thesiren interrupts the flow of mud, varying the pressuresinusoidally upstream from the valve, hencegenerating a wave. When the latter reaches thepumps, they respond by trying to maintain a constantload, with the result of increasing the operating
363VOLUME I / EXPLORATION, PRODUCTION AND TRANSPORT
MEASUREMENT AND ANALYSIS IN THE WELL
mud
valve
actuator
time
positive pulse
stan
dpip
e pr
essu
re
downhole motor
Fig. 7. Positive impulse MWD system.
mud
actuator
bypass valve
mud
downhole motor
time
negative pulse
stan
dpip
e pr
essu
re
Fig. 8. Negative impulse MWD system.
rotating disc
time
stan
dpip
e pr
essu
re
phase shift
rotaryvalve
motor
bitvalue(1)
bitvalue(1)
bitvalue(0)
bitvalue(1)
Fig. 9. Continuous wave MWD system.
pressure. A second wave is thus created, this timedirected towards the bottom hole: therefore, as therotation of the siren remains constant, the pressurevaries in a regular and continuous manner, creating astationary wave, which is used as a carrier forsending the data to the surface. During thetransmission, the siren’s rotation speed is made tovary, putting the wave out of phase, as in amodulation process. The surface instruments detectthe shift of phase in the pressure signal and translateit into a binary code. The typical wave frequencyinterval can vary from 1-24 Hz, depending on thetype of well (deep borehole, highly deviated, veryheavy and viscous mud, etc.); in fact, low frequencysignals are less disturbed and more easily detectableat the surface; the transmission rate, which dependson the frequency, can vary between 0.5-12 bit·s–1.
The evolution of MWD systems has prompted thedevelopment of several tools for high resolution real-time data logging. Basically, well-known technologieshave been modified to adapt them to the structureimposed by these systems and to their methods oftransmission. As a result, it has become possible toacquire, not only the geometrical path of the borehole,but also data for drawing initial lithologicalinterpretations. Other modules can be added to the basicMWD system configuration, resulting in a differentsystem, currently called Logging While Drilling (LWD).
Logging While Drilling (LWD) systemsLWD systems allow the recording of a set of logs
during drilling and, as opposed to wireline systems (inwhich the measurements are made after having drilledthe borehole to a certain depth), they take themeasurements and transmit them to the surface whilethe drilling is in progress. Obviously this makes itpossible to optimize the operations in the well andsaves rig time needed to run wireline systems. Thebasic principles of LWD systems for measuringpetrophysical parameters are the same as those forwireline measuring. The fundamental difference lies inthe positioning of the sensors (located within specialsondes which form an integral part of the drill string),and in the processing, interpretation and correction ofthe measurements. From the technological point ofview, the LWD sondes are derived directly from thecorresponding wireline sondes, but adapted for thenew measuring conditions.
Currently, LWD systems include both thedirectional sensors and the modules for recording thelog (permitting to obtain a number of petrophysicalparameters through measurement of resistivity,density, porosity, and gamma ray logging as well assonic type measurements), and can also be used insmall diameter (as small as 12 cm) boreholes. The
trend is to search for equipment of ever smallerdiameter which can tolerate high levels of mudcirculation and can be located as close as possible tothe bit. As a result, they are subjected to hardoperating conditions resulting from the mechanics ofdrilling (impacts, vibrations, etc.) and therefore, theymust be designed and produced to be very robust.
The principal advantages deriving from theacquisition of logs during the drilling cover a widerange of factors: availability of useful information(effectively real-time, the closer the measuringequipment is to the bit) for monitoring the progress ofthe borehole path, for assessing at what levels thecoring samples and/or running casing should becarried out, and for deciding on the need for acquiringother types of log using conventional techniques; thepossibility of taking advantage of the best conditionsfor recording of the logs, that is in presence of reducedinvasion and in condition of the least mechanical andpetrophysical degradation of the formation caused bythe drilling; the possibility of rapidly identifyingproblems in the well such as drill string getting stuckor the presence of abnormal pressure layers.
Transmission of data to the surface in LWDsystems is carried out by means of telemetric channelsin the form of the mud column within the drill string.However, the transmission rate of the data remains thelimiting factor, as it depends on the system, the typeand frequency of the pressure impulses used, as well asthe rate of penetration of the bit (the accuracy of themeasurements is inversely proportional to the rate ofpenetration). To reduce the volume of data to betransmitted, part of it can be processed and/or recordedin a memory at the bottom of the borehole; obviously,in this case the complete measurements are availableonly when the drill string is extracted. As a point ofreference it is useful to remember that with wirelinesystems a transmission rate in the order of 500 kbit·s–1
is achievable, while MWD systems using pressureimpulses have only recently achieved a rate of about12 bit·s–1, even if improvements can be expected. Tohelp overcome this limitation, it is now possible tocommunicate with the instrument from the surface bymeans of which the operator can choose whether toreceive petrophysical data or data on the mechanics ofthe drilling, thereby optimising the use of thetransmission system.
When LWD recordings comprise a relativelycomplete set of logs, it is preferable to speak ofFormation Evaluation While Drilling. As indicated, theactual LWD recordings include measurements ofresistivity (by induction, array induction type, and byfocalised currents, RAB-Anadril type), of spectralgamma ray, of density porosity, of neutron porosity, ofphase caliper and sonic log. Depending on the drill
364 ENCYCLOPAEDIA OF HYDROCARBONS
DRILLING AND COMPLETION OF WELLS
string configuration, the positioning of the LWDequipment is set at between 10 and 30 m above the bit,and even less for particular logs (such as bit resistivity).
The LWD system can be used in vertical,directional and horizontal boreholes, even if in thelatter ones complications of interpretation can arise. Infact, most sondes are conceived for use in radialsymmetry, perpendicular to the plane of stratification;in horizontal wells this symmetry is lacking andalmost always the force of gravity makes the positionof the sonde asymmetrical to the borehole.
The majority of the measurements obtainedthrough LWD systems are of the azimuthal type,that is relative to a precise direction in relation tothe axis of the borehole. In layers that are notperpendicular to the sonde axis and arecharacterized by a good resistivity contrast, themeasurements of azimuthal resistivity (RAB-Anadril), specific gravity and gamma rays canprovide indications of the distance and orientationof the layer in relation to the borehole sidewall. Thepractical value of this type of measurement isevident when monitoring the drilling of highlyinclined boreholes where there is a need to maintaina high degree of precision of the trajectory insideproductive zones of limited thickness (geosteering):in this situation it is necessary for the sensors to bepositioned as closely as possible to the bit.
3.3.5 Borehole seismic
Surface seismic surveys make it possible toreconstruct a representation of the undergroundstructure, permitting geological interpretations(distribution of the stratigraphic sequences, tectoniccontacts etc.). However, these have their limits giventhat often it is impossible to determine exactly thevariations of the frequency spectrum, and the
attenuation and the distortion undergone by theseismic waves as they cross the levels underexamination. An improvement in the interpretativevalue of the data can be achieved by examining theseismic signal directly as it crosses the levels, ratherthan surveying it on the surface. This has been madepossible by the development of specific in-wellseismic measurements called Vertical SeismicProfiles (VSP), in which a signal emitted on thesurface is recorded by a geophone set atprogressively greater depths in the well. The boreholeseismic thus developed makes it possible to obtainboth high resolution images of the area around thepoint of measurement, and data on the elasticitycharacteristics of the rock, and, finally, usefulinformation for stratigraphic interpretation and thestudy of the anisotropy caused by fractures or bystratification.
The borehole seismic prospecting techniquescurrently in use can be viewed as small-scale surveys,when compared with traditional surface techniques.The geophones are lowered into the well to recordboth the downgoing waves (directly from the surfacesource to the geophones, or multiple downgoingreflections), and the upgoing waves (primary andmultiple upgoing reflections). In particular, since afeature of the VSP data is an approximately halvedpropagation path, they are less influenced byattenuation, and so typically the signals are morehighly contrasted than the equivalent ones resultingfrom surface seismic. VSP could be capable ofoffering a more reliable geological interpretation, byimproving the investigation of the formation masslocated laterally to the borehole.
There are three basic types of VSP surveys: thezero-offset VSP; the offset VSP; and the walkaway VSP(Fig. 10). In the first, the geophones are lowered intothe well to different levels while the source is close tothe well’s vertical axis. With this technique – in ideal
365VOLUME I / EXPLORATION, PRODUCTION AND TRANSPORT
MEASUREMENT AND ANALYSIS IN THE WELL
source
receiver
zero-offset VSP
source
receiver
offset VSP
sources
receiver
walkaway VSPFig. 10. Typicalconfiguration of the raypaths of the seismic waves in well surveys: on the left, zero offsetvertical seismic profile(VSP), offset verticalseismic profile (OVSP),walkaway verticalseismic profile.
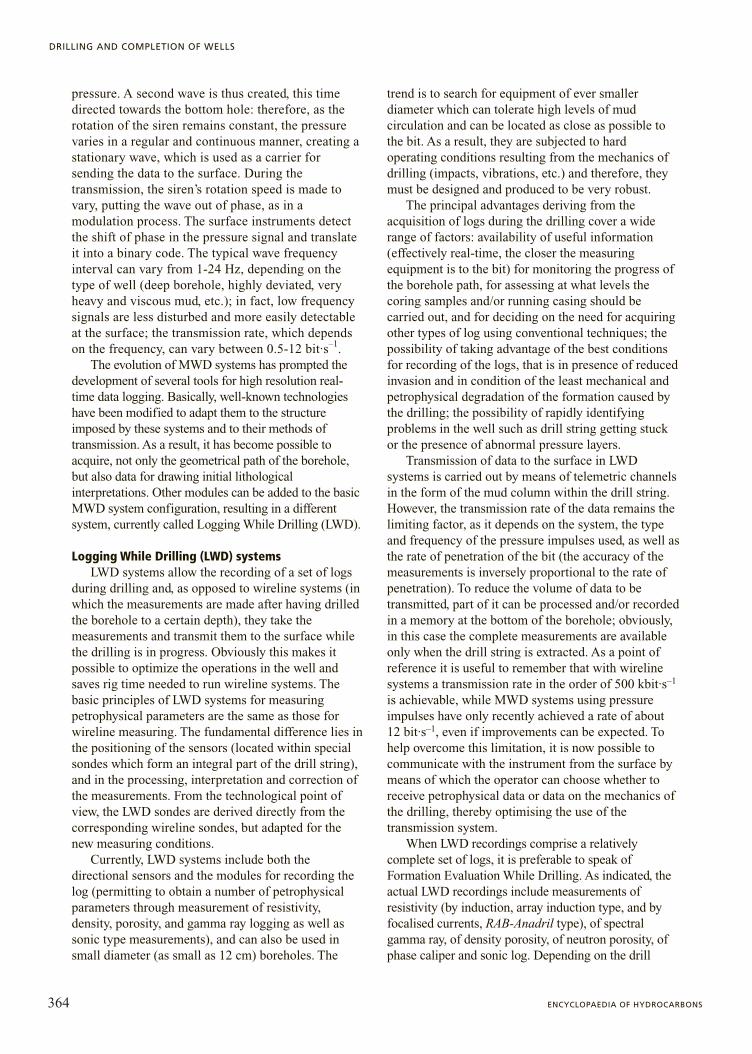
conditions of horizontal stratification, vertical welland source at the wellhead – downgoing and upgoingwaves are recorded along the same vertical path. In thesecond, the geophones are lowered to different levelsin the well while the source is set at a predetermineddistance from the wellhead (offset). With thistechnique, information is provided on the transmissionand reflection properties of the formations at aspecific distance from the well, but not on thestructures directly underneath the well. Finally, thethird type is recorded keeping an array of geophonesin fixed positions in the well and moving the source(variable offset) along a predetermined line that passesclose to the well. Normally five geophone stations areused, while the length of the predetermined linedepends on the depth of the target, and can be ofseveral kilometres. The underground extension to becovered by the walkaway (cover) survey, can becalculated using the formula: X = S z / (d + z) where Xis the cover, S is the offset of the source, d is the depthof the reflector and z the distance between thegeophone and the reflector. The walkaway seismicprofile provides a representation of a vertical patch ofthe subsoil around the well, producing information ofa two-dimensional type (2D). Moreover, takingadvantage of specific grids of walkaway lines (acollection of vertical underground stipes), it is possible
to obtain a complete coverage of the area around thewell, so-called 3D walkaway (Fig. 11). This techniqueis capable of leading to new developments insurveying methodologies, which will provide evermore detailed representations of the subsoil.
Data acquisition and processing The geophone used in the study of the movement
of particles of soil as a seismic wave passes through,consists of a coil and a magnet. The magnet is attachedto the geophone, while the coil, immersed in the fieldgenerated by the magnet, is mounted on a spring.When the geophone is fixed firmly in the ground, aseismic wave makes it oscillate precisely in sympathywith it; this comes about due to the oscillation of thecoil within the magnetic field, which induces in theformer a difference of potential proportional to thespeed of the particles of soil in the direction of the axisof the coil. The geophones must be able to work evenin particularly adverse environmental conditions, andusually they are constructed to withstand pressures inthe order of 130 MPa and temperatures as high as 250°C.
Acquisition of the data is performed after thegeophone has been lowered and fastened to thesidewall to the maximum depth of the borehole. Thena series of seismic impulses is generated on the
366 ENCYCLOPAEDIA OF HYDROCARBONS
DRILLING AND COMPLETION OF WELLS
final result
acquisition 3D VSP
Fig. 11. 3D walkaway VSP carried out in an offshore well: A, during the survey an array of geophones is placed in the well and the seismic energy is emitted at a certain depth below sea level. The geophones are held at fixed depths, while the position of the seismic source varies, being moved along parallel lineswithin an area centred on the well. B, The collected survey data are subsequently processed and assembled to reconstruct a 3D structure based on a typical paraboloid geometric shape whose axis coincides with the axis of the well. The apex of the paraboloid is positioned so as to correspond to the geophones. The underground reconstruction is reliable down to a depth which does not exceed double the depth at which the geophones themselves have been placed (Schlumberger, 1997).
A B
surface, and this operation is repeated raising thegeophone to successive levels at decreasing depths. Anessential requirement of this technique is that therecordings are repeated identically at each level: thatmakes VSP surveys costly in terms of time ofoccupation of the drilling rig. The parameters of thesurvey – such as the offset of the source and the depthintervals of the geophone – must be chosen carefully,in order to define in detail the reflective horizons.
The seismic source can be an airgun, a mechanicalvibrator or a small explosive charge. In the first case, acertain volume of air is made to expandinstantaneously in a small well full of water. Thefrequency spectrum emitted depends on the volume ofair injected, the pressure and the depth of injection.The airgun is often used in offshore surveys (in thiscase the release of air at high pressure is made directlyinto the sea). In the second case, the mechanicalvibrator transmits a low energy vibrational stimulationinto the earth for a few seconds. This device consistsof a mass of about 2,000 kg driven by a hydraulicvibrator, which is in turn controlled by a continuoussinusoidal signal of variable frequency. Finally, thegeneration of the seismic impulse by an explosive(always the least used) is based on the detonation of acharge in a small well full of water. Although thistechnique provides a wide spectrum of frequencies,the signal is not always repeatable because thegeometry of the well changes after a few firings.
The seismic sources generate waves that spreadthrough the underground formations (volume waves)and over the surface of the ground (surface waves). Inthe specific case of the in-well seismic survey, thevolume waves are of primary interest. In this case, thecorresponding longitudinal waves (P) and transversalwaves (S) are characterized by frequencies that rangefrom 5 to 200 Hz and can therefore be picked up bythe geophones. As it is well-known, for P waves themovement of the particles of the material takes placein the direction of propagation of the wave, while for Swaves it takes place in the orthogonal direction (from ahorizontal component SH and a vertical componentSV). The acoustic energy generated at ground level isrefracted and reflected through the undergroundstratifications and recorded by the geophones situatedin the well. In an elastic and homogenous medium, theplanar waves (P, SH, SV) spread independently of eachother, when the direction of propagation is orthogonalto the stratification. In practice, however, rarely is thedirection of propagation perpendicular to thestratification; in this case, new waves are generatedaccording to the separation surfaces. An incidence Pwave generates transmitted and reflected P and SVwaves, while an SV wave also generates P waves.Normally, the number of conversions increases with
the increase in the difference between the acousticimpedances of the two mediums in contact and withthe increase in the angle of incidence by respect to thevertical. In the case of a walkaway marine survey, thesea bed presents a significant difference in impedance,which converts part of the P incidence energy intotransmitted SV energy.
The purpose of processing the VSP data is toextract the signal generated from the reflectingsurfaces and plot their geometric trend in a vertical bi-dimensional section. The image produced contains theprofile of the well and indicates the lateral extensionof the physical characteristics discovered. Theprocedure for processing the data coming from theVSP walkaway, which will be briefly described lateron, can, in principle, be considered valid also for offsetand zero-offset VSP surveys. The procedure can beoutlined in the following way:
1) Amplitude correction: in a first step all thetracks are reproduced to the same strength,compensating for the diminution of the strength of theincidence signal in accordance with the depth, thepossible changes in energy levels of the source, andany variations in the bonding between the geophonesand the formation. In a second step the actualamplitudes are restored: every track is multiplied by anappropriate gain factor, in accordance with the time;
2) Velocity filtration: the operation which separatesthe signal of the downgoing wave (considered adisturbance, and therefore to be eliminated) from thatof the upgoing wave, which reaches the receiver afterbeing reflected upwards by the underground layers;
3) Deconvolution: operation intended to eliminateunwanted signals of multiple reflections (generated inthe subsoil) and effects of surface instruments(distortions of phase, etc.). This starts with thedowngoing waves obtained from the velocity filter andis repeated on the upgoing waves;
4) Construction of the speed model (ray tracing):information about velocities through the subsoil arerecorded in a model created in the planning phase, andredefined using information derived from dataobtained. It is important, in each case, to check thatthe velocity values are compatible with the VSP transittimes recorded along the axis of the well. Ray tracingis a vital step towards completion of the dataprocessing;
5) Migration (or final step): The seismic signalsare positioned in relation to the points from which theyhave been generated. From the deconvolution phase afield of primary reflections is obtained (that is withoutmultiple reflections), represented by variations ofamplitude along each track (identified by thecoordinates of the source and the time of recording).The reflections obtained must be relocated (made to
367VOLUME I / EXPLORATION, PRODUCTION AND TRANSPORT
MEASUREMENT AND ANALYSIS IN THE WELL
migrate), so as to be represented in a system ofcoordinates of depth/radial distance from the axis ofthe well.
3.3.6 Fluid sampling and pressuremeasuring
The sampling of the reservoir fluids is particularlyuseful in describing the reservoir from athermodynamic point of view. Recovery of arepresentative sample of reservoir fluid sometimesinvolves long, costly and complex operations.However, only by a correct sampling and a correctlaboratory analysis of the behaviour of the fluids inrelation to pressure, temperature and density, is itpossible to classify the reservoir precisely in relationto thermodynamics (see Chapter 4.2). The sample of areservoir fluid can be taken either from the bottom ofthe well, or at the surface (at the wellhead). The firsttype of sample recovery is used when a single liquidphase exists, as in the case of a reservoir ofundersaturated oil, in which the initial pressure of thereservoir is above bubble pressure (no gas has yet beenreleased from the oil). On the other hand, in the caseof a reservoir of saturated oil, the sample is taken atthe surface, because bubbles of gas have start toappear from the oil (the pressure of the reservoir is
below the bubble point of the oil) it is not possible tosample a mixture (oil + gas) at the bottom of the wellthat exactly reflects the proportion of oil and of gas inthe reservoir fluid mixture. In this case, use is made ofa surface gas/oil separator which, in certain workingconditions of the well (stabilised conditions), is able toestablish what the exact gas/oil ratio is on the basis ofwhich to recombine a mixture which will berepresentative of the reservoir fluid. Consequently, thesamples of gas and oil (gasoline) have to be takensimultaneously using surface bombs fitted with avalve at each end and filled beforehand with a suitableliquid (water or mercury). The samples are taken fromthe separator at a constant pressure, releasing theliquid from the bombs very slowly.
Having clarified these aspects, the samplingtechniques for a monophase liquid fluid (oil) at thebottom of the well are set out below. In the past, thesamplers consisted essentially of a filling chamberequipped with valves which were set in the openposition while the apparatus was being lowered to thedesired depth. On reaching this level the valves wereclosed mechanically by the dropping of a weight fromthe surface and by a timing device located inside thesampler itself. More recently, the samplers haveusually been combined with apparatus of a morecomplex nature involving the use of packers thatpermit the isolation of the test level, one or morefilling chambers (into which are drawn off several aten equal depth or of different levels), pressure gaugesand a motorisation unit, consisting of an electricallydriven motor, or a hydraulically activated unit.Moreover, this equipment is able to record localpressure measurements within the pores of theformation and therefore to carry out production tests,as in the case of the Formation Interval Tester (FIT)and the Repeat Formation Tester (RFT). A schematicrepresentation of the working principles of an RFT isshown in Fig. 12. The instrument, which works in openhole (that is where the casing has not yet been run) isable to carry out selective formation tests, to take amaximum of two samples of reservoir fluid each timeit is lowered into the well (the FIT on the other hand, isable to carry out only one sampling for each trip intothe well), and to carry out any desired number ofpressure measurements at the same number of pointsalong the profile of the well. The reservoir fluid isdrawn up by means of two piston/cylinder systems, soas to allow for two separate samples that simulate twoproduction tests with a capacity ratio of 1:5. Duringthe drawing up phase, pressure measurements aretaken until the end of the operation and sent to thesurface through the wireline. The instrument isequipped with two sampling chambers of volumesvarying from 5 l to 50 l.
368 ENCYCLOPAEDIA OF HYDROCARBONS
DRILLING AND COMPLETION OF WELLS
valve
pretest chambers
chamber 1(slow rate)chamber 2(fast rate)
valve
pressure gauge
filterfilter probe
piston
filter probe
equalizing valve(to mud column)
(to upper samplechamber)
(to lower samplechamber)
packer
mud cake
Fig. 12. Schematic of the basic components of a Repeat Formation Tester (RFT) (Chierici, 1989).
The most recent development for production test isthe Modular Dynamics Formation Tester (MDFT), anintegrated instrument that enables the sampling andanalysis of several specimen of reservoir fluids and thecompletion of dynamic measurements of pressuregradients, by means of piezoelectric sensors. Theinstrument can be assembled in various configurationsaccording to the purpose for which the measurementsare required. The samples are taken directly throughtwo opposed pistons that are pushed into theformation. The instrument, which only works in openholes, has two packers to isolate specific intervals,such as fractured or highly permeable layers, from theaction of the mud. A sample, taken from the isolatedzone, is analysed directly by the instrument using anoptical sensor based on the fluid absorption of visibleor infrared light and by employing a sensor thatmeasures the fluid’s electrical conductivity. Ahydraulic circuit is used to activate the pistons and thepackers, and to remove the fluid samples from theinstrument. Electrical power for the electronic part ofthe instrument is supplied by a battery. The recordingof the pressure gradient is used to evaluate thepermeability of the formation.
3.3.7 Production tests
Production tests are measurements that are carried outin producing wells that are flowing, to determine thenature of the flowing fluid and the productive capacityof the hydrocarbon bearing formations. In particular,the main properties to be determined are: a) thepermeability; b) the productive capacity; c) the skineffect (damage to or reduction in the permeability ofthe formation following the drilling); d) theproductivity index; e) the static pressure of thereservoir; f) the radius of drainage of the well; g)identification of barriers to permeability, faults, etc.The basic principle for carrying out a production testconsists of isolating the part of the formation to betested from the effect of the column of mud (which isalways present in a well), and exposing it toatmospheric pressure or to a pressure which is nevergreater than that in the formation (except in the casewhere ones injects fluids into the formation). The wellcan be set into various production conditions(monitoring continually the pressure, temperature,capacity, specific gravity, etc.) taking account of thetime available and other information considerednecessary. In particular, there are three types of tests:the single flowing procedure, that is a flowing period(draw down pressure) followed by a shut-in period ofthe well and a subsequent build-up of pressure; thedouble flowing procedure, that is an initial flow rate,
an initial build-up, a second flow rate and a finalbuild-up (which constitutes the most important phaseof the test); multi-point tests, that is a series of flowrates and build-ups at different flow rates (theserequire a very long execution time, but enable more in-depth studies of the reservoir).
However, this description is limited to a synopsisof the production tests, with particular reference todescriptions of the types of tests and the necessaryinstrumentation in the well and/or on the surface. Amore detailed discussion of the aspects of theory andinterpretation is offered in Chapter 4.4.
Various types of tests can be used depending on thetechnical condition of the well (open hole, cased hole),the properties of the formation to be tested (knownlithology and permeability) and the formation fluids(water, oil and/or gas). As regards the technicalcondition of the well, production tests in cased holewells (previously perforated hydraulic continuitybetween the formation and the borehole) are preferableto tests in open holes as they are more reliable andsafer, avoiding the problem of the borehole’s sidewallscollapsing and offering a greater guarantee of the thepacker seal.
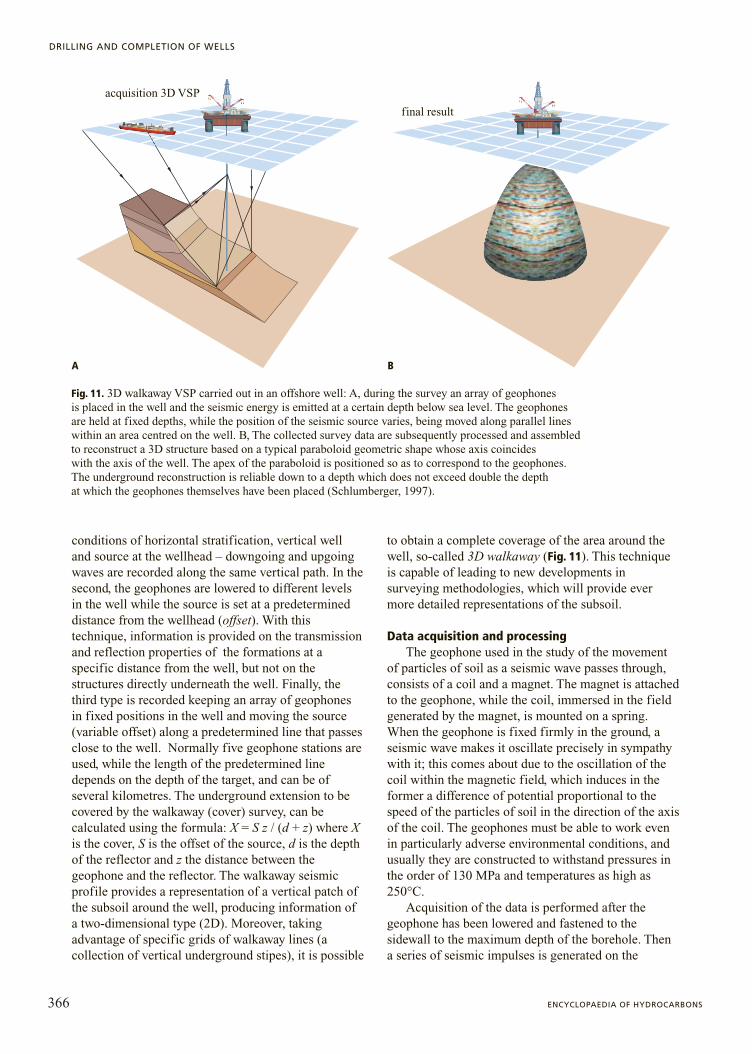
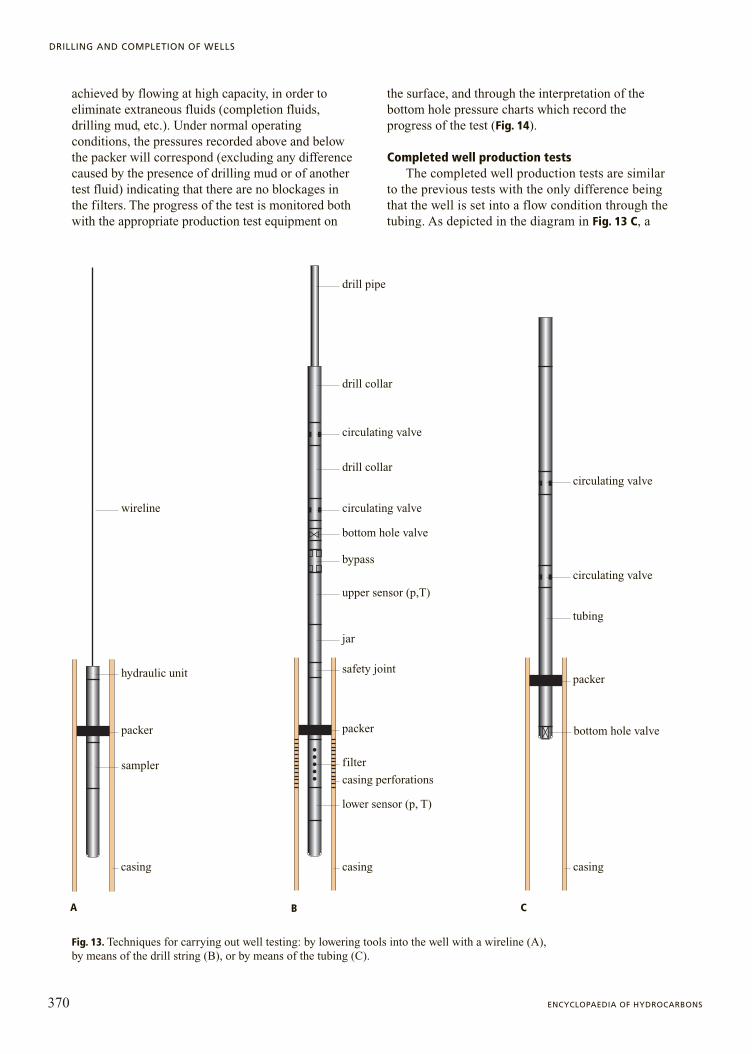
The production tests can be performed using avariety of techniques (Fig. 13): lowering tools into thewell by means of a wireline, by means of the drillstring (Drill Sten Testing, DST), or in the case of acompleted well, by means of the production tubing.
Wireline production testsProduction tests carried out with a wireline were
introduced to obtain information in a short time, andhave proved particularly useful in situations wherethere is a need for quick qualitative and quantitativeassessments. FIT, RFT and MDFT are typicalexamples of wireline instruments. Generally, theseinstruments feature a hydraulic or electrical controlunit, a packer sealing system and a sampling unit(Fig. 13 A). They operate as described in Section 3.3.6.
Production tests through the drill string (DST)Production tests using the drill string, defined as
Drill Stem Tests (DST), involve putting the well inproduction by using the drill string itself. Therefore,this is practicable only when the well is being drilled,either as open hole or as completed hole. Fig. 13 Bshows the layout of the instruments needed for thetest. Basically, a packer, two sensors for recordingpressure/temperature (one in the section above thepacker and the other in the section below), and aseries of auxiliary units (filters, jars, circulationvalves, etc.) are lowered with the drill pipe. Then, thewell is set into flow condition, after having carriedout the so-called flushing operation which is
369VOLUME I / EXPLORATION, PRODUCTION AND TRANSPORT
MEASUREMENT AND ANALYSIS IN THE WELL
achieved by flowing at high capacity, in order toeliminate extraneous fluids (completion fluids,drilling mud, etc.). Under normal operatingconditions, the pressures recorded above and belowthe packer will correspond (excluding any differencecaused by the presence of drilling mud or of anothertest fluid) indicating that there are no blockages inthe filters. The progress of the test is monitored bothwith the appropriate production test equipment on
the surface, and through the interpretation of thebottom hole pressure charts which record theprogress of the test (Fig. 14).
Completed well production testsThe completed well production tests are similar
to the previous tests with the only difference beingthat the well is set into a flow condition through thetubing. As depicted in the diagram in Fig. 13 C, a
370 ENCYCLOPAEDIA OF HYDROCARBONS
DRILLING AND COMPLETION OF WELLS
hydraulic unit
wireline
packer
sampler
A B C
drill pipe
drill collar
drill collar
bottom hole valve
bypass
casing perforations
casingcasing casing
packer
upper sensor (p,T)
lower sensor (p, T)
circulating valve
circulating valve
jar
bottom hole valve
packer
tubing
circulating valve
circulating valve
filter
safety joint
Fig. 13. Techniques for carrying out well testing: by lowering tools into the well with a wireline (A), by means of the drill string (B), or by means of the tubing (C).
A B C
packer, a bottom valve, and a series of circulationvalves are lowered through the tubing. Then, to thisbottom hole equipment, is added the test tree: a) asurface equipment needed to process the producedfluids; b) a choke manifold; c) a heat exchanger orheater to prevent the formation of hydratesfollowing the pressure drop in the choke manifold;d ) a separator for fluids of various densities (oil-gas-water) equipped with instruments measuringthe pressure, temperature and flow-rate of thevarious fluids; e) a burner which enables disposalthrough total combustion of high quantities of oilwithout producing black smoke and/or leaking(especially when at sea); f ) a series of accessories(tanks, pumps, etc.); g) a field laboratory forcarrying out various analyses (assessment of
sediments and sands, specific gravity of oil andgas, water salinity, etc.).
Bibliography
Agip (1980) Attività geologica e di cantiere nella ricerca diidrocarburi, Agip
Allen T.O., Roberts A.P. (1978) Production operation. Wellcompletions, workover and stimulation, Tulsa (OK), Oil &Gas International, 2v.
Chierici G.L. (1994-1995) Principles of petroleum reservoirengineering, Berlin, Springer, 2v.
Desbrandes R. (1985) Encyclopedia of well logging, Paris,Technip.
Hill A.D. (1998) Production logging. Theoretical andinterpretative elements, Richardson (TX), Society ofPetroleum Engineers.
Jorden J.R., Campbell F.L. (1984-1986) Well logging, NewYork, Henry L. Doherty Memorial Fund of the AmericanInstitute of Mining, Metallurgical, and Petroleum Engineers,2v.; v. I: Rock properties, borehole environment, mud andtemperature logging; v. II: Electric and acoustic logging.
Luthi S.M. (2001) Geological well logs. Their use in reservoirmodelling, Berlin, Springer.
Macini P., Mesini E. (1998) Alla ricerca dell’energia. Metodidi indagine per la valutazione delle georisorse fluide,Bologna, CLUEB.
References
Baker Hughes (1995) Coring applications and technology,Houston (TX), Baker Hughes.
Chierici G.L. (1989) Princìpi di ingegneria dei giacimentipetroliferi, Agip, 2v.
Western Atlas (1992) Introduction to wireline log analysis,Houston (TX), Western Atlas International.
Ezio MesiniDipartimento di Ingegneria Chimica,
Mineraria e delle Tecnologie AmbientaliUniversità degli Studi di Bologna
Bologna, Italy.
371VOLUME I / EXPLORATION, PRODUCTION AND TRANSPORT
MEASUREMENT AND ANALYSIS IN THE WELL
pres
sure
time
a bAD
E
C
F
I
B G H
Fig. 14. Typical example of a bottom hole pressure chart recorded by DST. Line a-b, which corresponds to atmospheric pressure, is called the baseline. Line A-B corresponds to the trip in the holeof the drill-string; the course of the line is not straightbecause of the pauses needed for adding the drill-pipesduring the trip. Point B marks the insertion of a packer and the pressure corresponds with the initial hydrostatic pressure. The packer is opened at point C and the pressure falls until at point D there is a flow of reservoir fluid which ends at point E. The reservoir pressure rises until it stabilises at F. When the packer is opened, the line G-Hrepresents the final hydrostatic pressure, while the line H-Irepresents the extraction from the hole of the drill string.