3.3-1 3.3 Tanglewood II Stormwater Pond Retrofit 3.3.1 Introduction The Tanglewood II Stormwater Pond retrofit project was constructed in 2001. The project site is located just south of the end of Schubert Drive in Fairland, Maryland. The pond drains into an unnamed tributary of the Tanglewood Tributary, which flows to the Little Paint Branch and is classified as a Use I stream. Figure 3.3.1 depicts the location of the Tanglewood II site. The goal of the project was to upgrade the existing pond facility in order to reduce peak storm flows and velocities, and reduce the concentration of pollutants in stormwater runoff that eventually reaches the stream. The project also served to increase wetland coverage in the area. Figure 3.3.2 shows the Tanglewood II stormwater pond in 1998 prior to construction and Figure 3.3.3 shows the pond in 2005, four years after its retrofit.
Transcript
3.3-1
3.3 Tanglewood II Stormwater Pond Retrofit
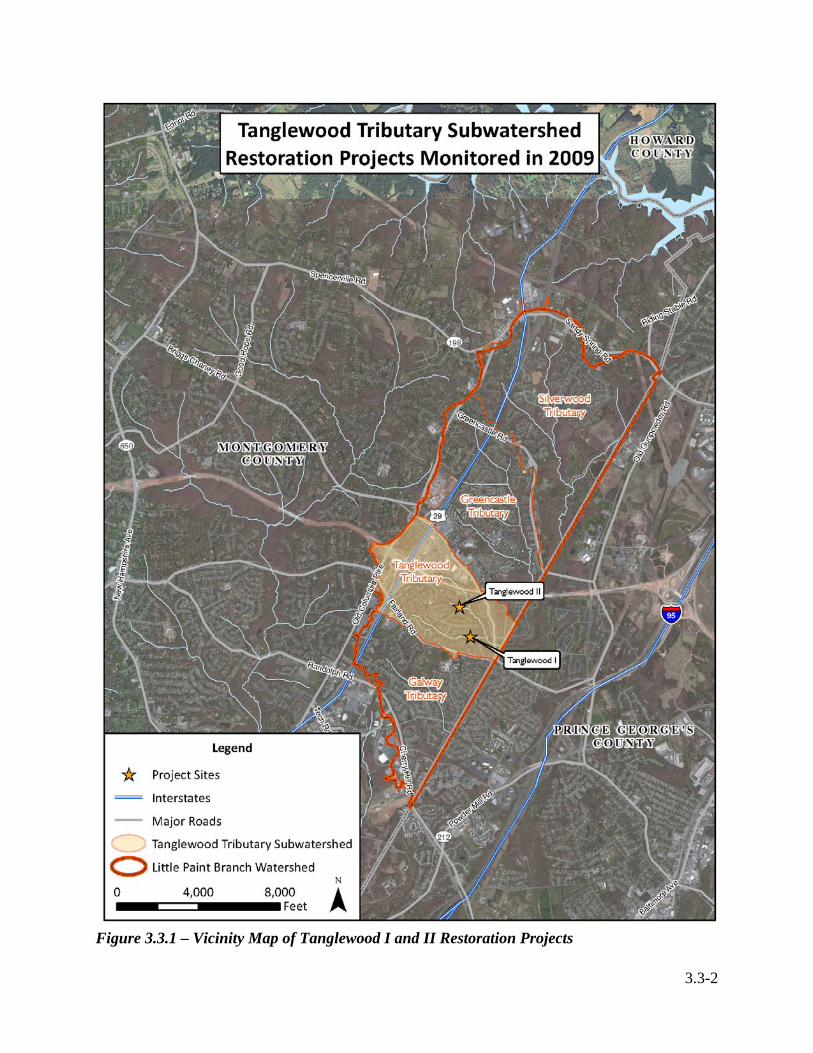
3.3.1 Introduction The Tanglewood II Stormwater Pond retrofit project was constructed in 2001. The project site is located just south of the end of Schubert Drive in Fairland, Maryland. The pond drains into an unnamed tributary of the Tanglewood Tributary, which flows to the Little Paint Branch and is classified as a Use I stream. Figure 3.3.1 depicts the location of the Tanglewood II site. The goal of the project was to upgrade the existing pond facility in order to reduce peak storm flows and velocities, and reduce the concentration of pollutants in stormwater runoff that eventually reaches the stream. The project also served to increase wetland coverage in the area. Figure 3.3.2 shows the Tanglewood II stormwater pond in 1998 prior to construction and Figure 3.3.3 shows the pond in 2005, four years after its retrofit.
3.3-2
Figure 3.3.1 – Vicinity Map of Tanglewood I and II Restoration Projects
3.3-3
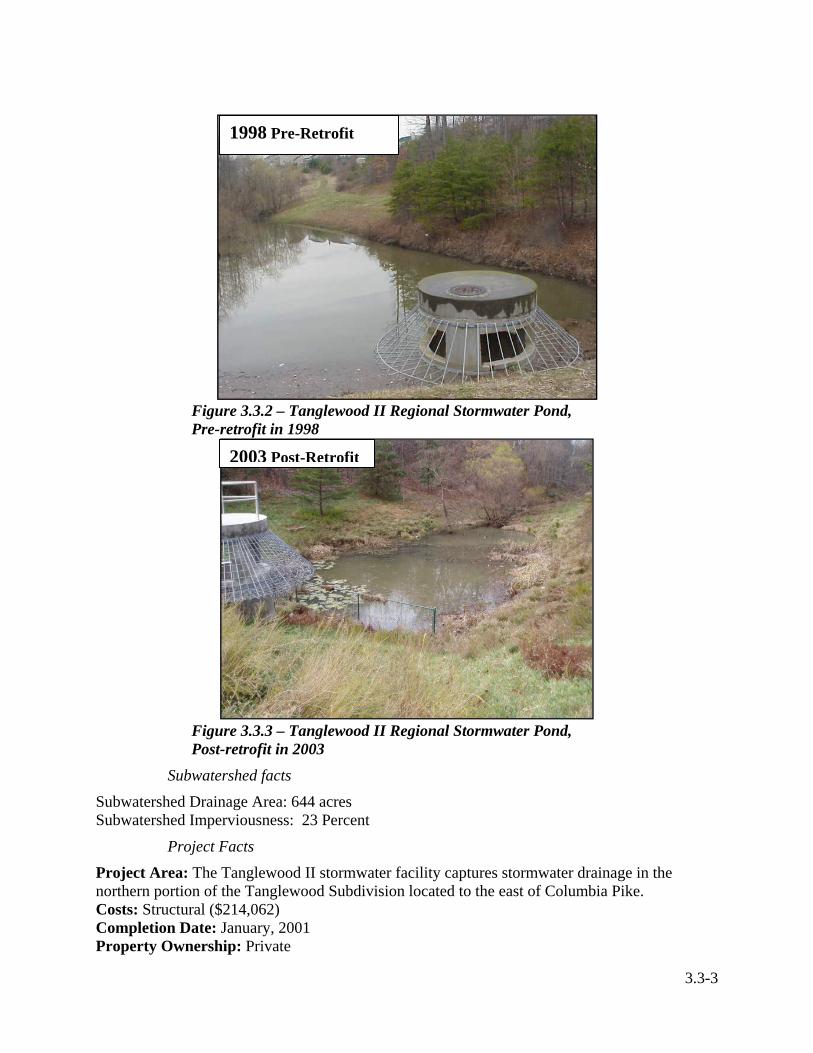
Figure 3.3.2 – Tanglewood II Regional Stormwater Pond, Pre-retrofit in 1998
Figure 3.3.3 – Tanglewood II Regional Stormwater Pond, Post-retrofit in 2003
Project Area: The Tanglewood II stormwater facility captures stormwater drainage in the northern portion of the Tanglewood Subdivision located to the east of Columbia Pike. Costs: Structural ($214,062) Completion Date: January, 2001 Property Ownership: Private
1998 Pre-Retrofit
2003 Post-Retrofit
3.3-4
Project Selection
The Anacostia River Watershed Restoration Agreement of 1987 committed Montgomery County and other local and state governments to take steps to restore streams within the Anacostia River basin that have been damaged by intense urbanization. Some sections of Little Paint Branch and its tributaries have experienced impairments to stream biodiversity as watershed development has caused changes in the volume of water in Little Paint Branch during storms, streambank erosion, and reduced water quality. Studies conducted under the Anacostia watershed restoration effort have identified seventeen potential sites in Little Paint Branch where remedial projects could be undertaken. The Tanglewood II pond retrofit project is one of these seventeen projects identified. Figure 3.2.1 in the Tanglewood I report shows the location of Tanglewood II retrofit project and others in the Tanglewood tributary.
Pre-Restoration Conditions
Prior to the retrofit of Tanglewood II, the pond filled during storms and drained down over a period of one to three days. There was very limited aquatic vegetation within and along the pond’s perimeter to help absorb the nutrients from the stormwater runoff.
Restoration Actions Taken
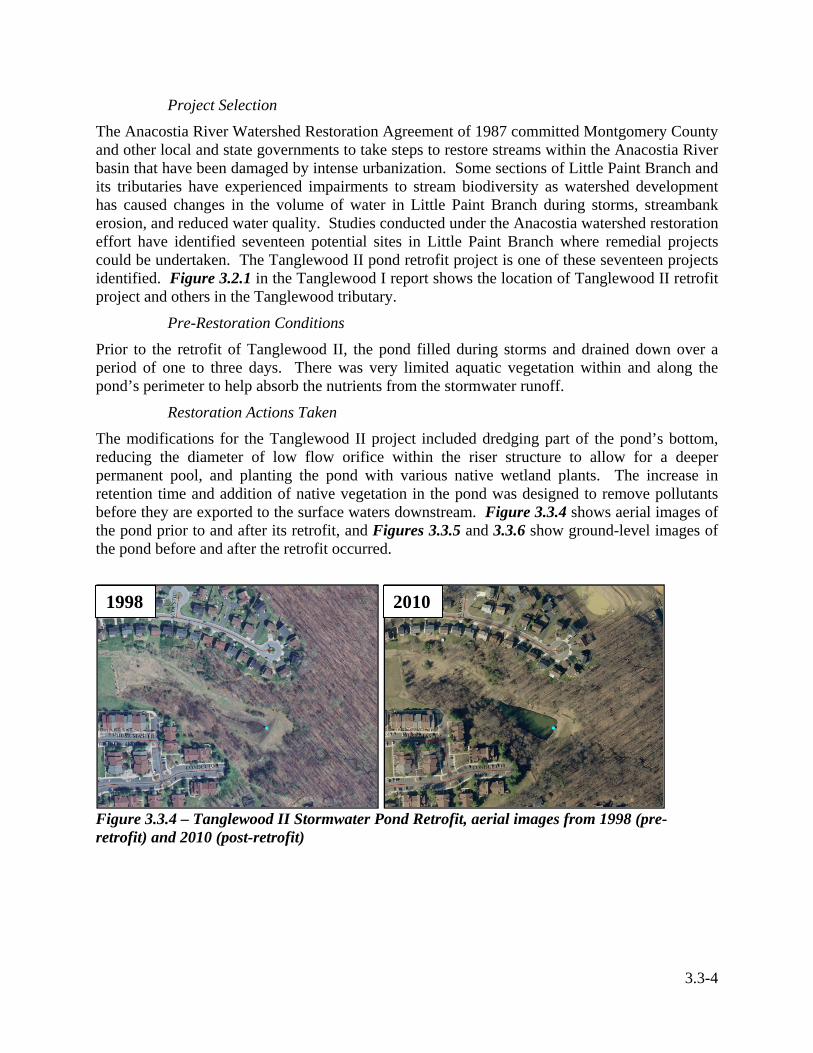
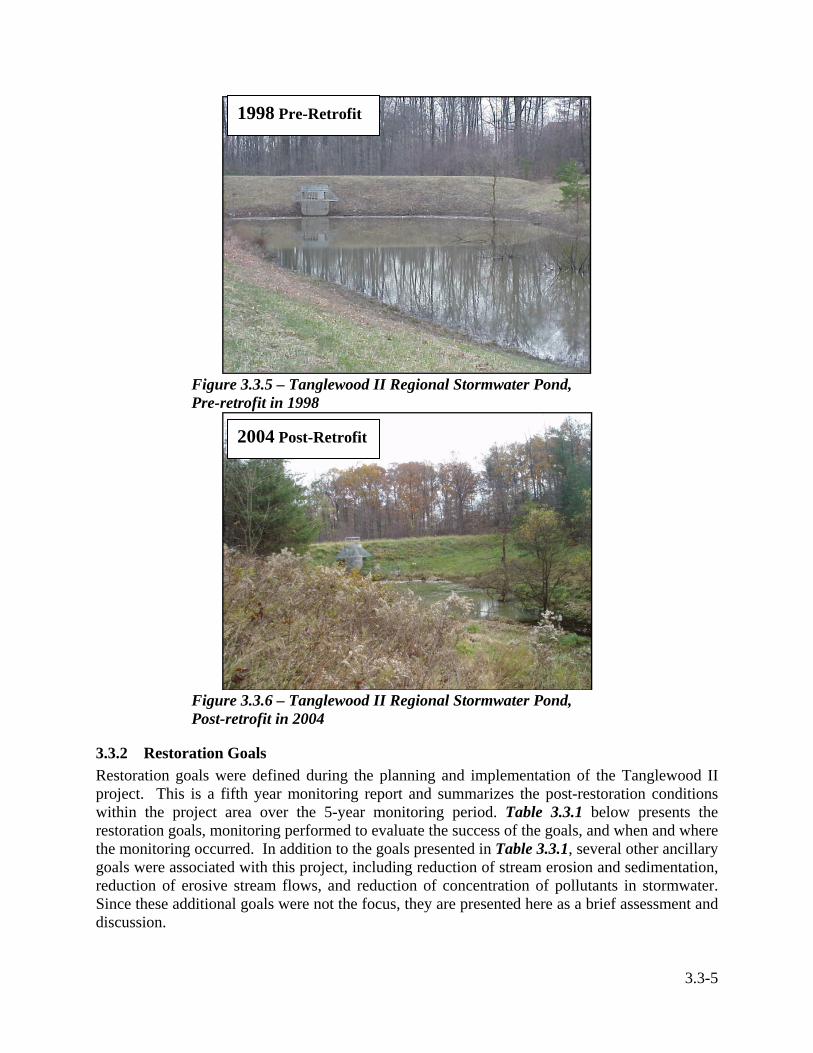
The modifications for the Tanglewood II project included dredging part of the pond’s bottom, reducing the diameter of low flow orifice within the riser structure to allow for a deeper permanent pool, and planting the pond with various native wetland plants. The increase in retention time and addition of native vegetation in the pond was designed to remove pollutants before they are exported to the surface waters downstream. Figure 3.3.4 shows aerial images of the pond prior to and after its retrofit, and Figures 3.3.5 and 3.3.6 show ground-level images of the pond before and after the retrofit occurred.
Figure 3.3.4 – Tanglewood II Stormwater Pond Retrofit, aerial images from 1998 (pre-retrofit) and 2010 (post-retrofit)
1998 2010
3.3-5
Figure 3.3.5 – Tanglewood II Regional Stormwater Pond, Pre-retrofit in 1998
Figure 3.3.6 – Tanglewood II Regional Stormwater Pond, Post-retrofit in 2004
3.3.2 Restoration Goals Restoration goals were defined during the planning and implementation of the Tanglewood II project. This is a fifth year monitoring report and summarizes the post-restoration conditions within the project area over the 5-year monitoring period. Table 3.3.1 below presents the restoration goals, monitoring performed to evaluate the success of the goals, and when and where the monitoring occurred. In addition to the goals presented in Table 3.3.1, several other ancillary goals were associated with this project, including reduction of stream erosion and sedimentation, reduction of erosive stream flows, and reduction of concentration of pollutants in stormwater. Since these additional goals were not the focus, they are presented here as a brief assessment and discussion.
1998 Pre-Retrofit
2004 Post-Retrofit
3.3-6
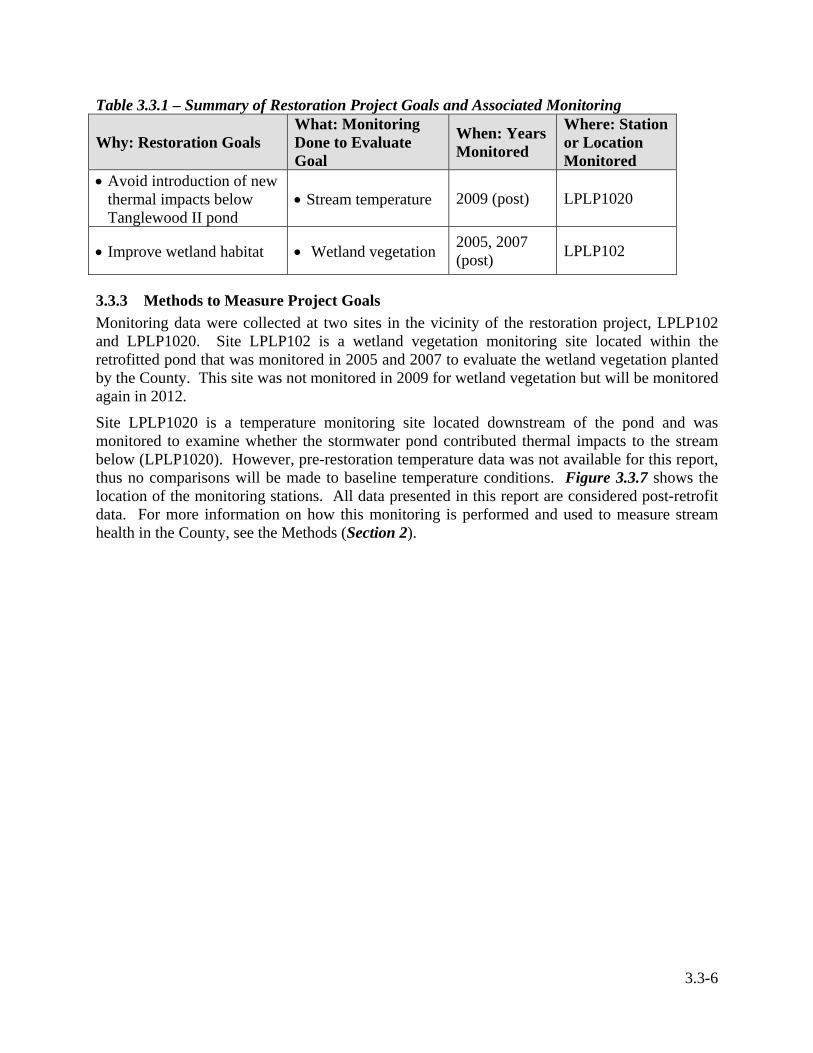
Table 3.3.1 – Summary of Restoration Project Goals and Associated Monitoring
Why: Restoration Goals What: Monitoring Done to Evaluate Goal
When: Years Monitored
Where: Station or Location Monitored
• Avoid introduction of new thermal impacts below Tanglewood II pond
3.3.3 Methods to Measure Project Goals Monitoring data were collected at two sites in the vicinity of the restoration project, LPLP102 and LPLP1020. Site LPLP102 is a wetland vegetation monitoring site located within the retrofitted pond that was monitored in 2005 and 2007 to evaluate the wetland vegetation planted by the County. This site was not monitored in 2009 for wetland vegetation but will be monitored again in 2012.
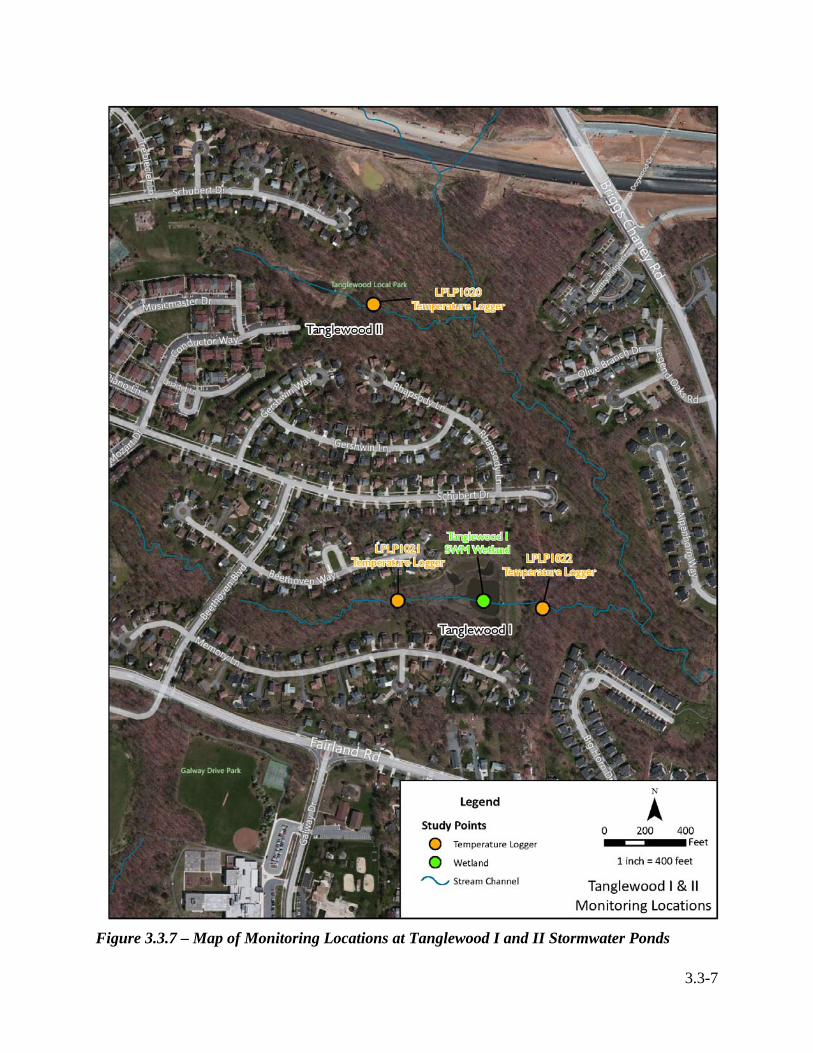
Site LPLP1020 is a temperature monitoring site located downstream of the pond and was monitored to examine whether the stormwater pond contributed thermal impacts to the stream below (LPLP1020). However, pre-restoration temperature data was not available for this report, thus no comparisons will be made to baseline temperature conditions. Figure 3.3.7 shows the location of the monitoring stations. All data presented in this report are considered post-retrofit data. For more information on how this monitoring is performed and used to measure stream health in the County, see the Methods (Section 2).
3.3-7
Figure 3.3.7 – Map of Monitoring Locations at Tanglewood I and II Stormwater Ponds
3.3-8
3.3.4 Results and Analysis
Temperature
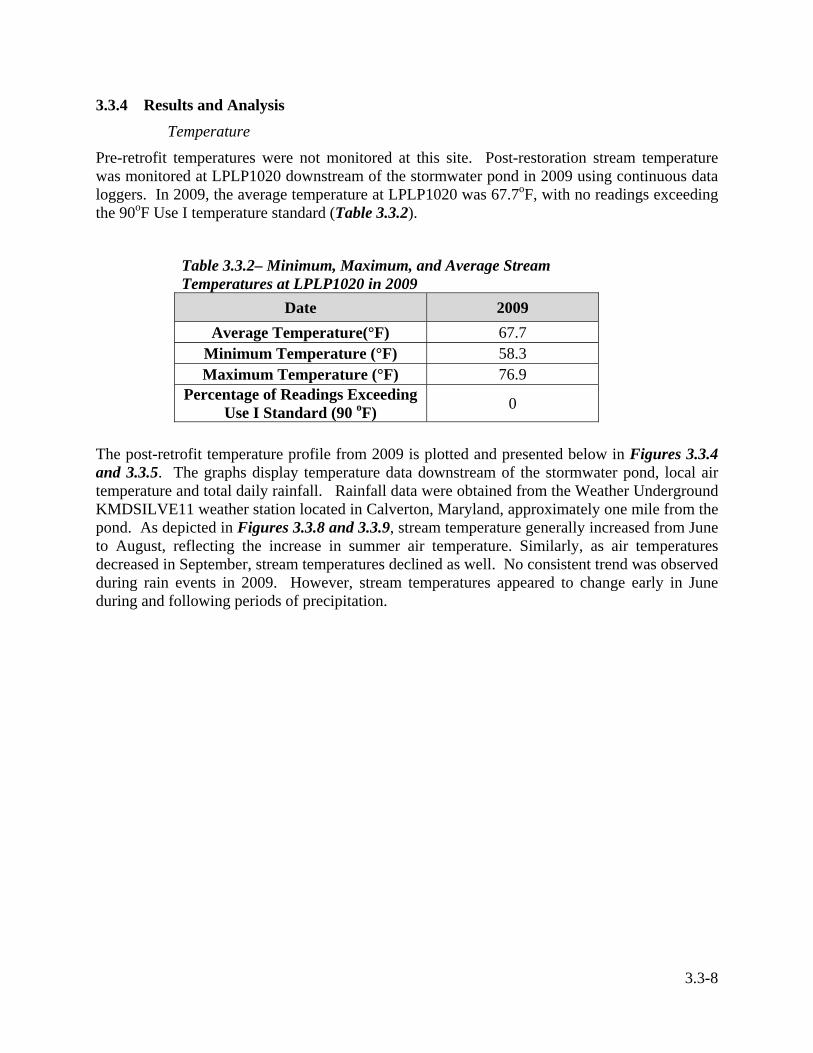
Pre-retrofit temperatures were not monitored at this site. Post-restoration stream temperature was monitored at LPLP1020 downstream of the stormwater pond in 2009 using continuous data loggers. In 2009, the average temperature at LPLP1020 was 67.7oF, with no readings exceeding the 90oF Use I temperature standard (Table 3.3.2).
Table 3.3.2– Minimum, Maximum, and Average Stream Temperatures at LPLP1020 in 2009
Date 2009 Average Temperature(°F) 67.7
Minimum Temperature (°F) 58.3 Maximum Temperature (°F) 76.9
Percentage of Readings Exceeding Use I Standard (90 oF) 0
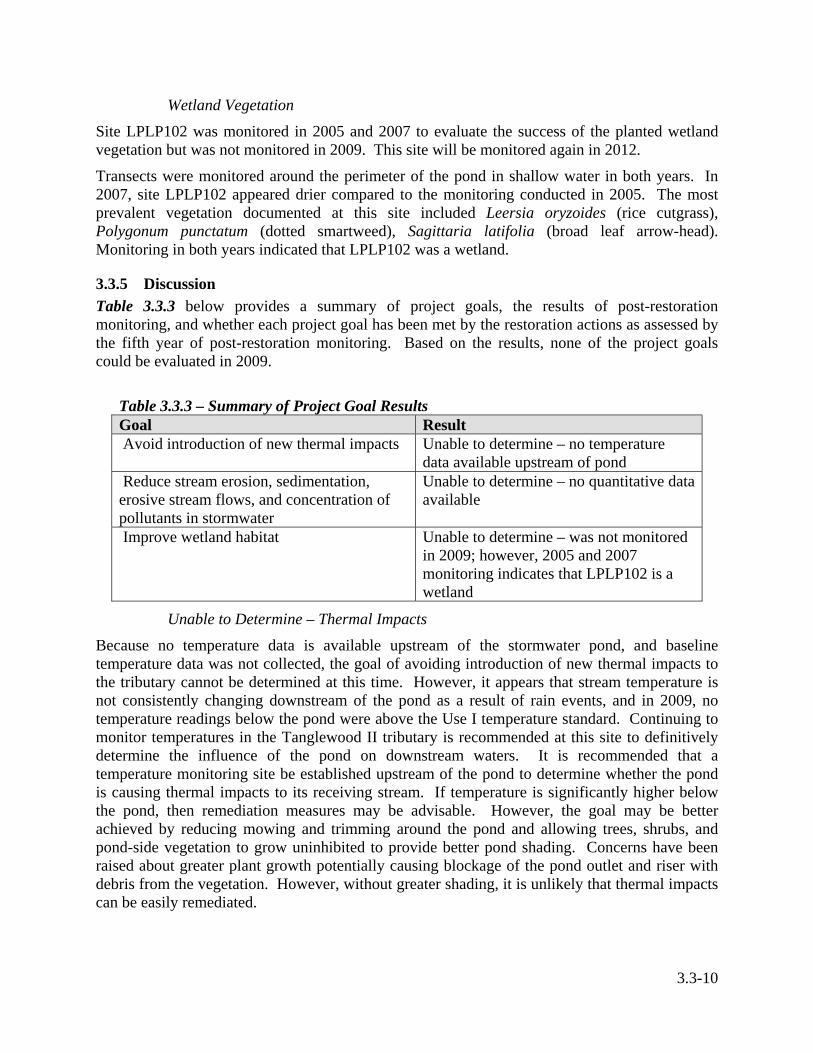
The post-retrofit temperature profile from 2009 is plotted and presented below in Figures 3.3.4 and 3.3.5. The graphs display temperature data downstream of the stormwater pond, local air temperature and total daily rainfall. Rainfall data were obtained from the Weather Underground KMDSILVE11 weather station located in Calverton, Maryland, approximately one mile from the pond. As depicted in Figures 3.3.8 and 3.3.9, stream temperature generally increased from June to August, reflecting the increase in summer air temperature. Similarly, as air temperatures decreased in September, stream temperatures declined as well. No consistent trend was observed during rain events in 2009. However, stream temperatures appeared to change early in June during and following periods of precipitation.
3.3-9
Figure 3.3.8 – Stream Temperature at LPLP1020 from June 1, 2009 through July 31, 2009
Figure 3.3.9 – Stream Temperature at LPLP1020 from August 1, 2009 through September 30, 2009
Tanglewood II Stormwater Pond Temperature Data from June 1, 2009 through July 31, 2009
45
50
55
60
65
70
75
80
85
90
95
06/01/09
06/03/09
06/05/09
06/07/09
06/09/09
06/11/09
06/13/09
06/15/09
06/17/09
06/19/09
06/21/09
06/23/09
06/25/09
06/27/09
06/29/09
07/01/09
07/03/09
07/05/09
07/07/09
07/09/09
07/11/09
07/13/09
07/15/09
07/17/09
07/19/09
07/21/09
07/23/09
07/25/09
07/27/09
07/29/09
07/31/09
Date
Tem
pera
ture
(°F
) 0
0.5
1
1.5
2
2.5
Rain
fall
(in)
Precipitation
Temperature
Air Temp
Tanglewood II Stormwater Pond Temperature Data from August 1, 2009 through September 30, 2009
45
50
55
60
65
70
75
80
85
90
95
8/1/20
09
8/3/20
09
8/5/20
09
8/7/20
09
8/9/20
09
8/11
/200
9
8/13
/200
9
8/15
/200
9
8/17
/200
9
8/19
/200
9
8/21
/200
9
8/23
/200
9
8/25
/200
9
8/27
/200
9
8/29
/200
9
8/31
/200
9
9/2/20
09
9/4/20
09
9/6/20
09
9/8/20
09
9/10
/200
9
9/12
/200
9
9/14
/200
9
9/16
/200
9
9/18
/200
9
9/20
/200
9
9/22
/200
9
9/24
/200
9
9/26
/200
9
9/28
/200
9
9/30
/200
9
Date
Tem
pera
ture
(°F
)
0
0.5
1
1.5
2
2.5
Rain
fall
(in)
Precipitation
Temperature
Air Temp
3.3-10
Wetland Vegetation
Site LPLP102 was monitored in 2005 and 2007 to evaluate the success of the planted wetland vegetation but was not monitored in 2009. This site will be monitored again in 2012.
Transects were monitored around the perimeter of the pond in shallow water in both years. In 2007, site LPLP102 appeared drier compared to the monitoring conducted in 2005. The most prevalent vegetation documented at this site included Leersia oryzoides (rice cutgrass), Polygonum punctatum (dotted smartweed), Sagittaria latifolia (broad leaf arrow-head). Monitoring in both years indicated that LPLP102 was a wetland.
3.3.5 Discussion Table 3.3.3 below provides a summary of project goals, the results of post-restoration monitoring, and whether each project goal has been met by the restoration actions as assessed by the fifth year of post-restoration monitoring. Based on the results, none of the project goals could be evaluated in 2009.
Table 3.3.3 – Summary of Project Goal Results Goal Result Avoid introduction of new thermal impacts Unable to determine – no temperature
data available upstream of pond Reduce stream erosion, sedimentation, erosive stream flows, and concentration of pollutants in stormwater
Unable to determine – no quantitative data available
Improve wetland habitat Unable to determine – was not monitored in 2009; however, 2005 and 2007 monitoring indicates that LPLP102 is a wetland
Unable to Determine – Thermal Impacts
Because no temperature data is available upstream of the stormwater pond, and baseline temperature data was not collected, the goal of avoiding introduction of new thermal impacts to the tributary cannot be determined at this time. However, it appears that stream temperature is not consistently changing downstream of the pond as a result of rain events, and in 2009, no temperature readings below the pond were above the Use I temperature standard. Continuing to monitor temperatures in the Tanglewood II tributary is recommended at this site to definitively determine the influence of the pond on downstream waters. It is recommended that a temperature monitoring site be established upstream of the pond to determine whether the pond is causing thermal impacts to its receiving stream. If temperature is significantly higher below the pond, then remediation measures may be advisable. However, the goal may be better achieved by reducing mowing and trimming around the pond and allowing trees, shrubs, and pond-side vegetation to grow uninhibited to provide better pond shading. Concerns have been raised about greater plant growth potentially causing blockage of the pond outlet and riser with debris from the vegetation. However, without greater shading, it is unlikely that thermal impacts can be easily remediated.
3.3-11
Unable to Determine – Reduction of Stream Erosion and Sedimentation, Erosive Stream flows, and Concentration of Pollutants in Stormwater
The goals of reducing stream erosion and sedimentation, erosive stream flows, and the concentration of pollutants in stormwater runoff are unable to be determined, as no pre- or post-restoration quantitative habitat data are available for this site. However, because the Tanglewood II stormwater pond was designed to remove pollutants and nutrients by increasing the retention time and planting wetland vegetation, nutrient/pollution removal should have improved with the increase in density of wetland vegetation and will likely continue to improve over time. Prior to the pond retrofit, aquatic vegetation was sparse within the pond and along its perimeter, therefore uptake of nutrients from the stormwater runoff was likely low. Subsequent post-retrofit vegetation monitoring in 2005 and 2007 documented that the pond contains functioning wetlands, which were designed ameliorate the effects of pollutants and nutrients.
Unable to Determine – Wetland Vegetation
Because LPLP102 was not monitored in 2009, the goal of improving wetland habitat cannot be determined at this time. However, 2005 and 2007 post-restoration monitoring indicated that this site is a functioning wetland, as described in the County’s Year 1 and Year 3 reports, respectively. The County will monitor this site again in 2012 to determine whether the goal of improving wetland habitat has been met at the end of the monitoring period.
3.3.6 Conclusions Based on the results, it is not possible to determine whether the retrofitted pond is contributing heated water downstream, since a temperature logger was not placed upstream of the stormwater pond. It is recommended that a temperature monitoring site be established upstream of the pond (in addition to the downstream site) to determine whether the pond is causing thermal impacts to its receiving stream. It is also recommended that mowing and trimming be reduced around the pond to allow trees, shrubs, and pond-side vegetation to grow uninhibited to provide better pond shading. Without greater shading, it is unlikely that any thermal impacts can be easily remediated.
Wetland monitoring conducted in 2005 and 2007 indicate that the pond contains functioning wetlands. However, the County will monitor this site again in 2012 to determine whether the goal of improving wetland habitat has been met at the end of the monitoring period. Although the goals of reducing streambank erosion and the concentration of pollutants in stormwater runoff were not measured in 2009 by quantitative or chemical means, the pond was designed to remove pollution and nutrients through retention and wetland vegetation uptake.