323
4. PPC & PERT/CPM 1 4. Production Planning & Control & PERT / CPM
| Date post: | 09-Dec-2015 |
| Category: |
Documents |
| Upload: | awaisjinnah |
| View: | 236 times |
| Download: | 5 times |

4. PPC & PERT/CPM 1
4. Production Planning & Control&
PERT / CPM

4. PPC & PERT/CPM 2
Introduction to Production Planning & Control (PPC)
Inputs from L C Jhamb(especially chapter 5)

4. PPC & PERT/CPM 3
PPC - defined
• Production is “manufacturing of goods and / or services”
• Planning is “the series of related & co-ordinated activities –demand management, aggregate sales & operations planning, process planning, materials management (incl. MRP & Inventory control), Operations scheduling, and others; designed to systematize in advance the manufacturing efforts. Planning aims to utilize resources most effectively, to provide the right goods, at the right time, in the right quantity”
• Control is “the review of work progress, make corrections where required; thus ensuring that the actual is as per plan. Control includes activities such as dispatching, progressing & expediting”
• Overall PPC is thus:– Planning production in advance– Setting the “run-rate” for each item– Fixing starting & end dates for each item– Authorizing shop floor activity by release of production orders– Follow-up, inspect & expedite to stay on course (as per plan)

4. PPC & PERT/CPM 4
Objectives of PPC
• Meet targets of production, as aligned with demand, with available resources
• Provide resources (men, material, machines) of the right quantity, quality at right time.
• Optimum scheduling of facilities
• To achieve balanced flow of production, with co-ordination between all departments
• Ensure conformance to delivery commitments, and make sales aware of any potential difficulties
• Inform all concerned, especially management, well in time, re: difficulties which may crop up

4. PPC & PERT/CPM 5
Regular (essential) Functions of PPC (IMP)
ORDER PREPARATION: includes preparation of work orders, converting them to shop orders & auxiliary orders, release of such orders to appropriate entities
MATERIAL CONTROL: includes making material estimates, indenting, purchasing, follow-up, allocating material to shop orders
PROCESS PLANNING (or ROUTING): includes method of manufacture, operations & their sequences, machine & tool requirements for each activity, defining requirements of supporting equipment – i.e. jigs & fixtures, measuring instruments, …
TOOLS CONTROL: estimating requirement & specifications of tools (e.g. cutting tools), jigs & fixtures, measuring instruments,. Replenishment of non – consumable tools due to wear & tear (e.g. allen keys, spanners, ..)
SCHEDULING: fixing calendar dates of various operations for various job-orders, committing delivery dates to sales & despatch schedules
DISPATCHING: preparation & distribution of shop orders & manufacturing instructions; assigning responsibilities to appropriate persons; authorizing them to perform the work at respective work-centres as per the predefined schedule; authorize them to draw the necessary resources (tools, consumables, material, etc);
PROGRESSING: recording progress of work & comparing with plan
EXPEDITING: identify (and anticipate) delays & interruptions: take corrective actions; inform relevant stake-holders of potential & actual deviations from planned schedules

4. PPC & PERT/CPM 6
Optional Functions of PPC (IMP)
COST ESTIMATION: pre-production cost estimates used for budgeting, pricing & profitability management. Alternatively this could the responsibility of Costing dept. or Industrial Engineering
WORK MEASUREMENT: to estimate the time taken by a qualified worker to perform a task, under given conditions, and at the desired level of performance. Techniques like time & methods study, work sampling, etc. Alternatively this could the responsibility of Industrial Engineering
SUB-CONTRACT: outsourcing work for various reasons! Alternatively this could the responsibility of Materials / Purchase depts.
CAPACITY PLANNING: Estimation of requirements of men & machines to meet the firms planned level of business over the short / medium & long term. Alternatively this could the responsibility of the Engineering dept.
DEMAND MANAGEMENT: making projections of demand for various products, which can become a basis for production planning. Various demand forecasting techniques are used to forecast demand. For the medium term (6-18 months) an “Aggregate Sales & Operations plan” is prepared. Thereon a firm schedule is created (Master Production Schedule). Normally the sales / marketing / product management departments will do this.

4. PPC & PERT/CPM 7
The Order Preparation process – a block diagramMANUFACTURING
METHODS
Order Acceptance (OA) Receive Sales Program
Entry of OA into the system (say ERP)
Raise Work Order
Convert Work order intoShop Order
Shop order – part A
Shop order – Part B
Prepare Production Program
Check on-hand availability
Issue Shop orders
Produced to stock
Produced to order

4. PPC & PERT/CPM 8
4a. Demand Management
4. PPC & PERT/CPM
• Demand Management
• Qualitative Forecasting Methods
• Simple & Weighted Moving Average Forecasts
• Exponential Smoothing
• Simple Linear Regression
• Web-Based Forecasting
OBJECTIVES

4. PPC & PERT/CPM
Demand Management
A
B(4) C(2)
D(2) E(1) D(3) F(2)
Dependent Demand:Raw Materials, Component parts,Sub-assemblies, etc.
Independent Demand:Finished Goods
4. PPC & PERT/CPM
Independent Demand: What a firm can do to manage it?
• Can take an active role to influence demand
• Can take a passive role and simply respond to demand
4. PPC & PERT/CPM
Types of Forecasts
• Qualitative (Judgmental)
• Quantitative– Time Series Analysis– Causal Relationships– Simulation

4. PPC & PERT/CPM
Components of Demand
• Average demand for a period of time
• Trend
• Seasonal element
• Cyclical elements
• Random variation
• Autocorrelation
4. PPC & PERT/CPM
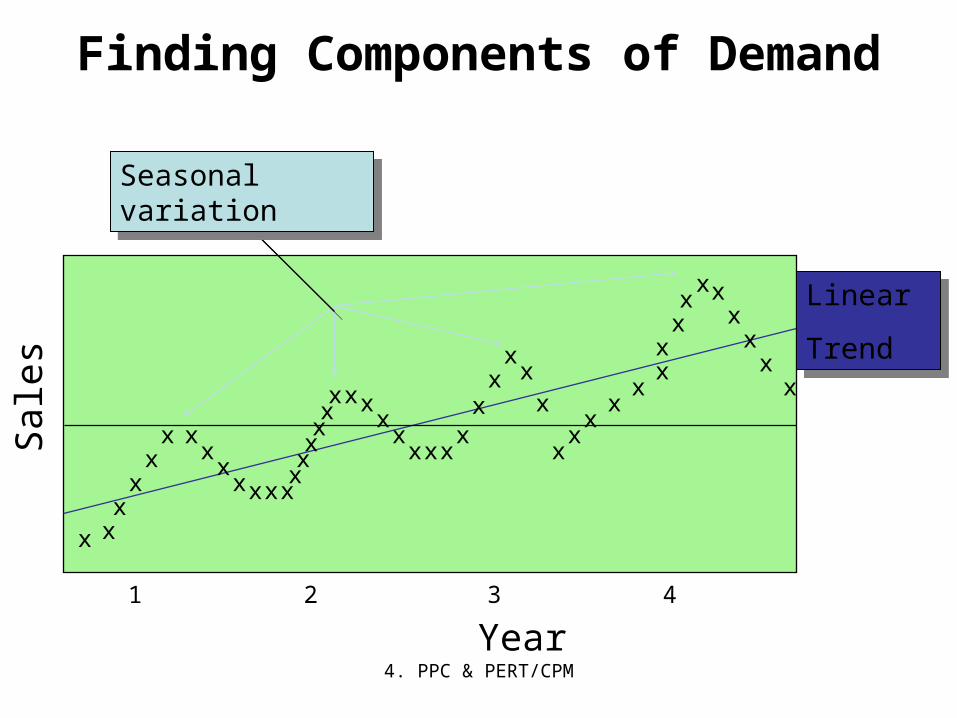
Finding Components of Demand
1 2 3 4
x
x xx
xx
x xx
xx x x x
xxxxxx x x
xx
x x xx
xx
xx
x
xx
xx
xx
xx
xx
xx
x
x
Year
Sal
es
Seasonal variationSeasonal variation
Linear
Trend
Linear
Trend

4. PPC & PERT/CPM 15
Qualitative Methods
Grass Roots
Market Research
Panel Consensus
Executive Judgment
Historical analogy
Delphi Method
Qualitative
Methods

4. PPC & PERT/CPM
Delphi Method
l. Choose the experts to participate representing a variety
of knowledgeable people in different areas
2. Through a questionnaire (or E-mail), obtain forecasts
(and any premises or qualifications for the forecasts)
from all participants
3. Summarize the results and redistribute them to the
participants along with appropriate new questions
4. Summarize again, refining forecasts and conditions, and
again develop new questions
5. Repeat Step 4 as necessary and distribute the final
results to all participants

4. PPC & PERT/CPM
Time Series Analysis
• Time series forecasting models try to
predict the future based on past data
• You can pick models based on:
1. Time horizon to forecast
2. Data availability
3. Accuracy required
4. Size of forecasting budget
5. Availability of qualified personnel

4. PPC & PERT/CPM
Simple Moving Average Formula
F = A + A + A +...+A
ntt-1 t-2 t-3 t-nF =
A + A + A +...+A
ntt-1 t-2 t-3 t-n
• The simple moving average model assumes an average is a good estimator of future behavior
• The formula for the simple moving average is:
Ft = Forecast for the coming period N = Number of periods to be averagedA t-1 = Actual occurrence in the past period for up to “n” periods

4. PPC & PERT/CPM
Simple Moving Average Problem (1)
Week Demand1 6502 6783 7204 7855 8596 9207 8508 7589 892
10 92011 78912 844
F = A + A + A +...+A
ntt-1 t-2 t-3 t-nF =
A + A + A +...+A
ntt-1 t-2 t-3 t-n
Question: What are the 3-week and 6-week moving average forecasts for demand?
Assume you only have 3 weeks and 6 weeks of actual demand data for the respective forecasts
Question: What are the 3-week and 6-week moving average forecasts for demand?
Assume you only have 3 weeks and 6 weeks of actual demand data for the respective forecasts
4. PPC & PERT/CPM
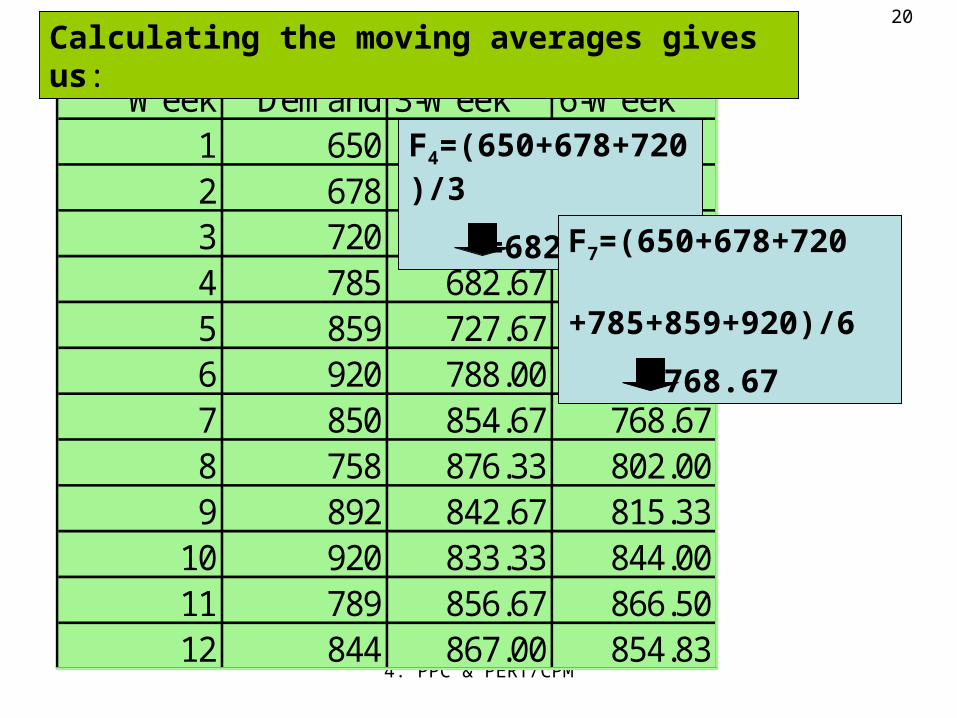
Week Demand 3-Week 6-Week1 6502 6783 7204 785 682.675 859 727.676 920 788.007 850 854.67 768.678 758 876.33 802.009 892 842.67 815.33
10 920 833.33 844.0011 789 856.67 866.5012 844 867.00 854.83
F4=(650+678+720)/3
=682.67F7=(650+678+720 +785+859+920)/6
=768.67
Calculating the moving averages gives us:
©The McGraw-Hill Companies, Inc., 2004
20

4. PPC & PERT/CPM
500
600
700
800
900
1000
1 2 3 4 5 6 7 8 9 10 11 12
Week
Dem
and
Demand
3-Week
6-Week
Plotting the moving averages and comparing them shows how the lines smooth out to reveal the overall upward trend in this example
Plotting the moving averages and comparing them shows how the lines smooth out to reveal the overall upward trend in this example
Note how the 3-Week is smoother than the Demand, and 6-Week is even smoother
Note how the 3-Week is smoother than the Demand, and 6-Week is even smoother

4. PPC & PERT/CPM
Simple Moving Average Problem (2) Data
Week Demand1 8202 7753 6804 6555 6206 6007 575
Question: What is the 3 week moving average forecast for this data?
Assume you only have 3 weeks and 5 weeks of actual demand data for the respective forecasts
Question: What is the 3 week moving average forecast for this data?
Assume you only have 3 weeks and 5 weeks of actual demand data for the respective forecasts
4. PPC & PERT/CPM
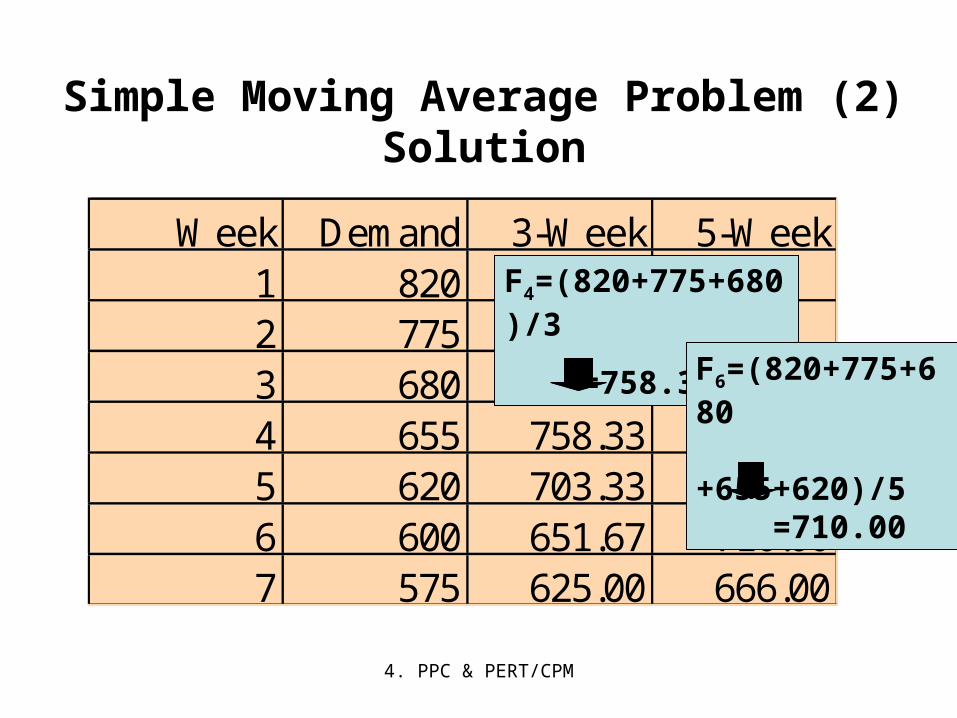
Simple Moving Average Problem (2) Solution
Week Demand 3-Week 5-Week1 8202 7753 6804 655 758.335 620 703.336 600 651.67 710.007 575 625.00 666.00
F4=(820+775+680)/3
=758.33F6=(820+775+680 +655+620)/5 =710.00

4. PPC & PERT/CPM
Weighted Moving Average Formula
F = w A + w A + w A +...+w At 1 t-1 2 t-2 3 t-3 n t-nF = w A + w A + w A +...+w At 1 t-1 2 t-2 3 t-3 n t-n
w = 1ii=1
n
w = 1ii=1
n
While the moving average formula implies an equal weight being placed on each value that is being averaged, the weighted moving average permits an unequal weighting on prior time periods
While the moving average formula implies an equal weight being placed on each value that is being averaged, the weighted moving average permits an unequal weighting on prior time periods
wt = weight given to time period “t” occurrence (weights must add to one)
wt = weight given to time period “t” occurrence (weights must add to one)
The formula for the moving average is:The formula for the moving average is:

4. PPC & PERT/CPM
Weighted Moving Average Problem (1) Data
Weights: t-1 .5t-2 .3t-3 .2
Week Demand1 6502 6783 7204
Question: Given the weekly demand and weights, what is the forecast for the 4th period or Week 4?
Question: Given the weekly demand and weights, what is the forecast for the 4th period or Week 4?
Note that the weights place more emphasis on the most recent data, that is time period “t-1”
Note that the weights place more emphasis on the most recent data, that is time period “t-1”

4. PPC & PERT/CPM
Weighted Moving Average Problem (1) Solution
Week Demand Forecast1 6502 6783 7204 693.4
F4 = 0.5(720)+0.3(678)+0.2(650)=693.4
4. PPC & PERT/CPM
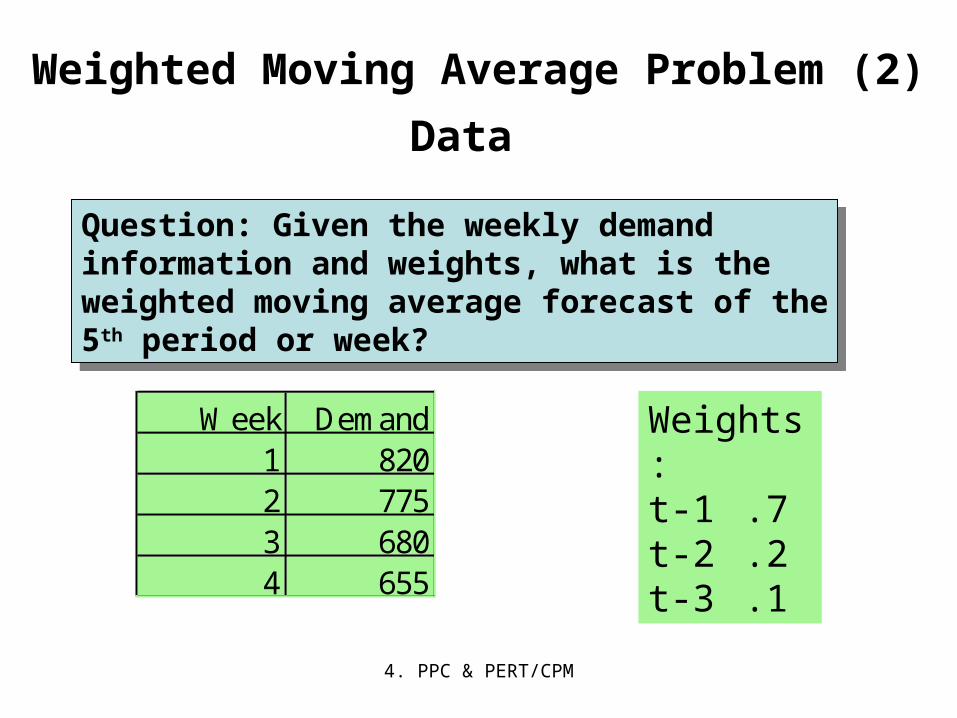
Weighted Moving Average Problem (2) Data
Weights: t-1 .7t-2 .2t-3 .1
Week Demand1 8202 7753 6804 655
Question: Given the weekly demand information and weights, what is the weighted moving average forecast of the 5th period or week?
Question: Given the weekly demand information and weights, what is the weighted moving average forecast of the 5th period or week?

4. PPC & PERT/CPM
Weighted Moving Average Problem (2) Solution
Week Demand Forecast1 8202 7753 6804 6555 672
F5 = (0.1)(755)+(0.2)(680)+(0.7)(655)= 672
4. PPC & PERT/CPM
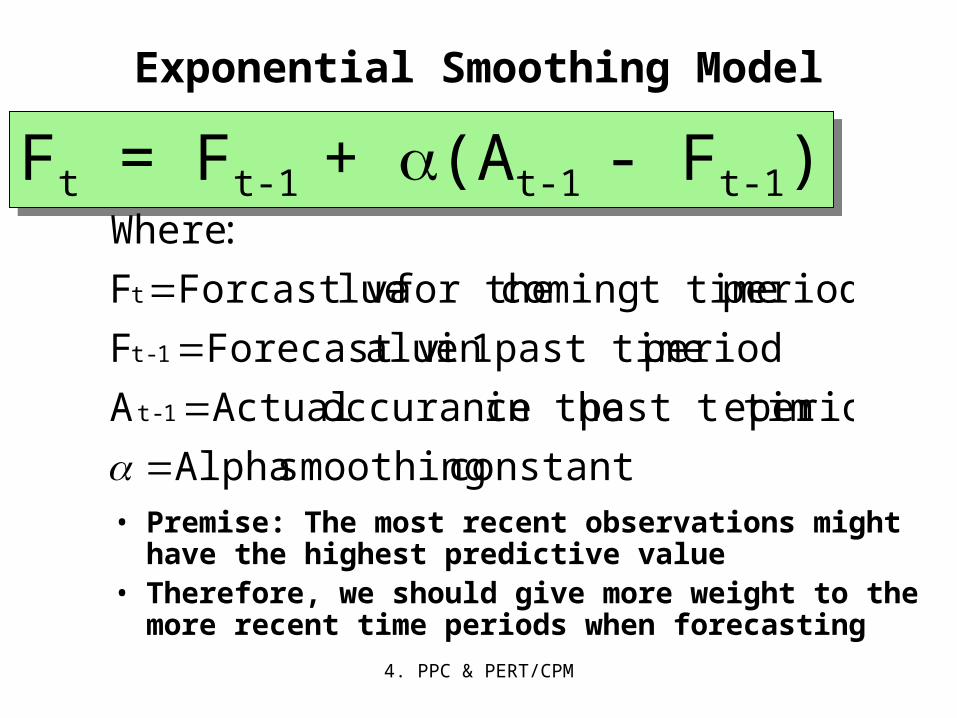
Exponential Smoothing Model
• Premise: The most recent observations might have the highest predictive value
• Therefore, we should give more weight to the more recent time periods when forecasting
Ft = Ft-1 + (At-1 - Ft-1)Ft = Ft-1 + (At-1 - Ft-1)
constant smoothing Alpha
period epast t tim in the occurance ActualA
period past time 1in alueForecast vF
period t timecoming for the lueForcast vaF
:Where
1-t
1-t
t

4. PPC & PERT/CPM
Exponential Smoothing Problem (1) Data
Week Demand1 8202 7753 6804 6555 7506 8027 7988 6899 775
10
Question: Given the weekly demand data, what are the exponential smoothing forecasts for periods 2-10 using =0.10 and =0.60?
Assume F1=D1
Question: Given the weekly demand data, what are the exponential smoothing forecasts for periods 2-10 using =0.10 and =0.60?
Assume F1=D1

4. PPC & PERT/CPM
Week Demand 0.1 0.61 820 820.00 820.002 775 820.00 820.003 680 815.50 793.004 655 801.95 725.205 750 787.26 683.086 802 783.53 723.237 798 785.38 770.498 689 786.64 787.009 775 776.88 728.20
10 776.69 756.28
Answer: The respective alphas columns denote the forecast values. Note that you can only forecast one time period into the future.
Answer: The respective alphas columns denote the forecast values. Note that you can only forecast one time period into the future.
4. PPC & PERT/CPM
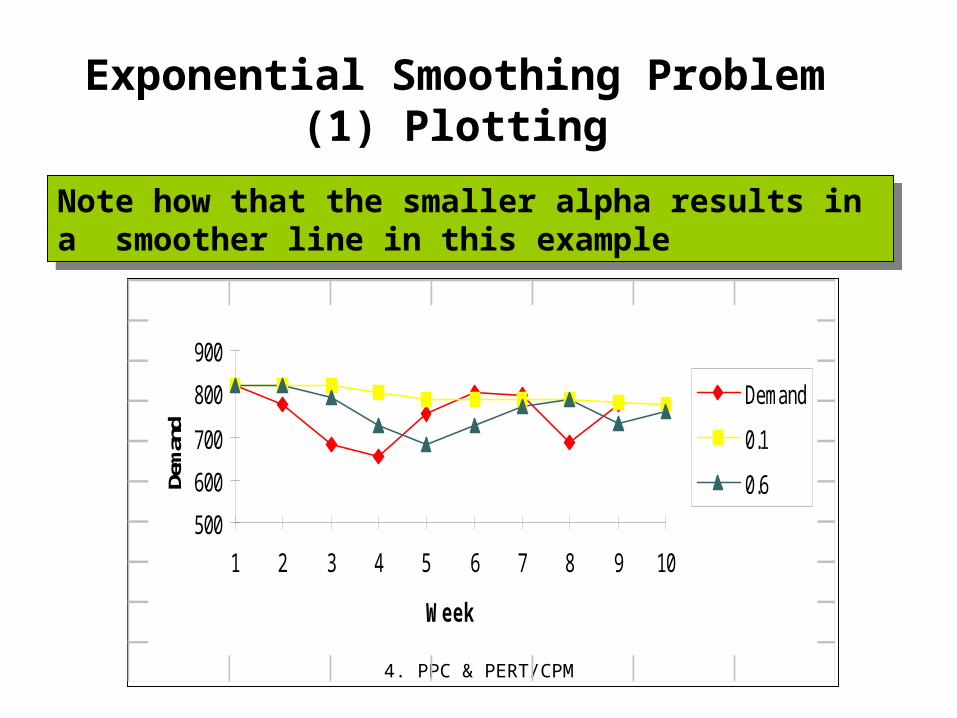
Exponential Smoothing Problem (1) Plotting
500
600
700
800
900
1 2 3 4 5 6 7 8 9 10
Week
Dem
and
Demand
0.1
0.6
Note how that the smaller alpha results in a smoother line in this example
Note how that the smaller alpha results in a smoother line in this example
4. PPC & PERT/CPM
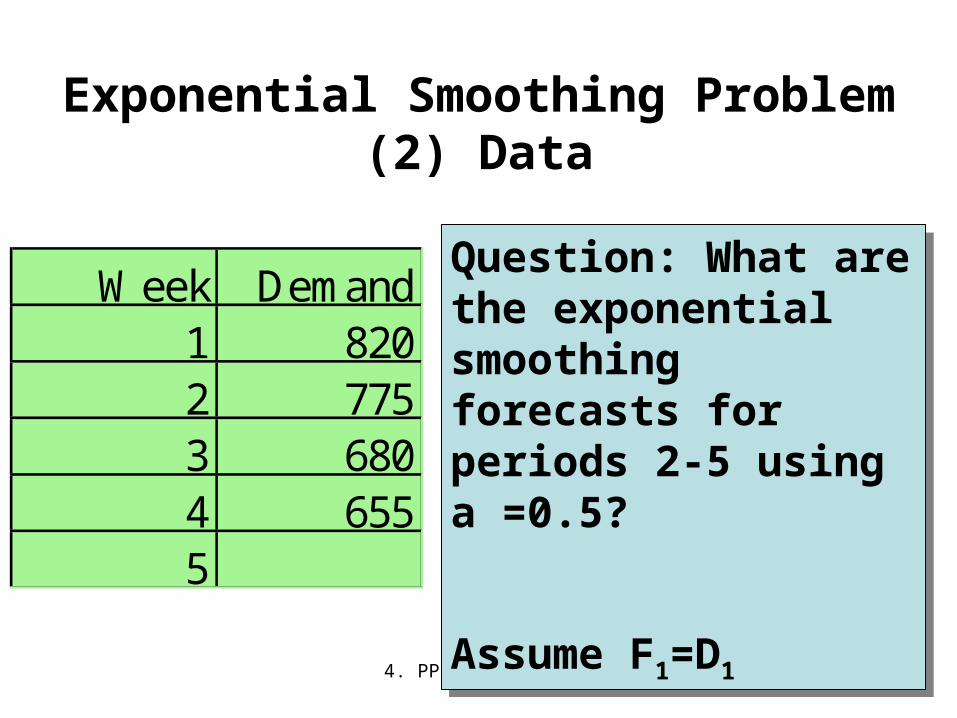
Exponential Smoothing Problem (2) Data
Question: What are the exponential smoothing forecasts for periods 2-5 using a =0.5?
Assume F1=D1
Question: What are the exponential smoothing forecasts for periods 2-5 using a =0.5?
Assume F1=D1
Week Demand1 8202 7753 6804 6555
4. PPC & PERT/CPM
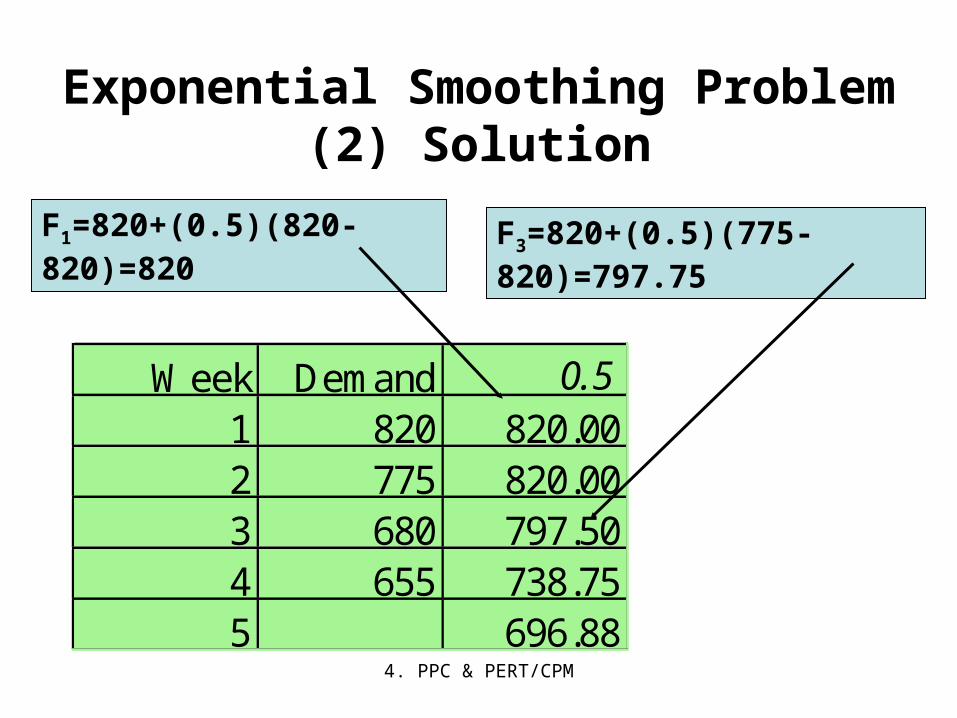
Exponential Smoothing Problem (2) Solution
Week Demand 0.51 820 820.002 775 820.003 680 797.504 655 738.755 696.88
F1=820+(0.5)(820-820)=820 F3=820+(0.5)(775-820)=797.75
4. PPC & PERT/CPM
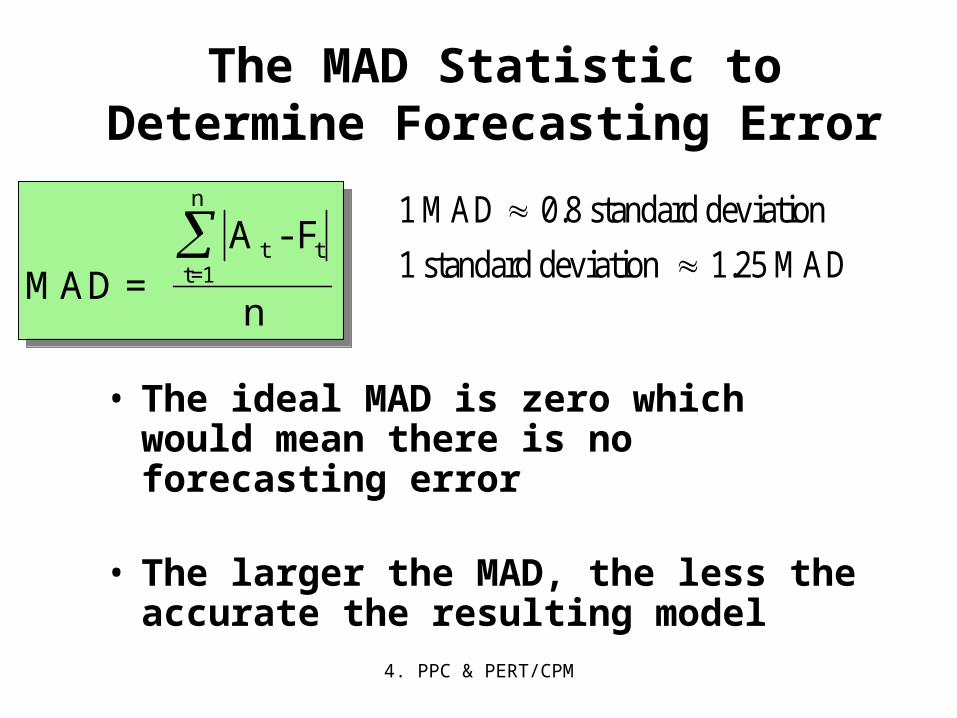
The MAD Statistic to Determine Forecasting Error
MAD = A - F
n
t tt=1
n
MAD =
A - F
n
t tt=1
n
1 MAD 0.8 standard deviation
1 standard deviation 1.25 MAD
• The ideal MAD is zero which would mean there is no forecasting error
• The larger the MAD, the less the accurate the resulting model

4. PPC & PERT/CPM
MAD Problem Data
Month Sales Forecast1 220 n/a2 250 2553 210 2054 300 3205 325 315
Question: What is the MAD value given the forecast values in the table below?
Question: What is the MAD value given the forecast values in the table below?

4. PPC & PERT/CPM
MAD Problem Solution
MAD = A - F
n=
40
4= 10
t tt=1
n
MAD =
A - F
n=
40
4= 10
t tt=1
n
Month Sales Forecast Abs Error1 220 n/a2 250 255 53 210 205 54 300 320 205 325 315 10
40
Note that by itself, the MAD only lets us know the mean error in a set of forecasts
Note that by itself, the MAD only lets us know the mean error in a set of forecasts

4. PPC & PERT/CPM
Tracking Signal Formula
• The Tracking Signal or TS is a measure that indicates whether the forecast average is keeping pace with any genuine upward or downward changes in demand.
• Depending on the number of MAD’s selected, the TS can be used like a quality control chart indicating when the model is generating too much error in its forecasts.
• The TS formula is:
TS =RSFE
MAD=
Running sum of forecast errors
Mean absolute deviationTS =
RSFE
MAD=
Running sum of forecast errors
Mean absolute deviation
4. PPC & PERT/CPM
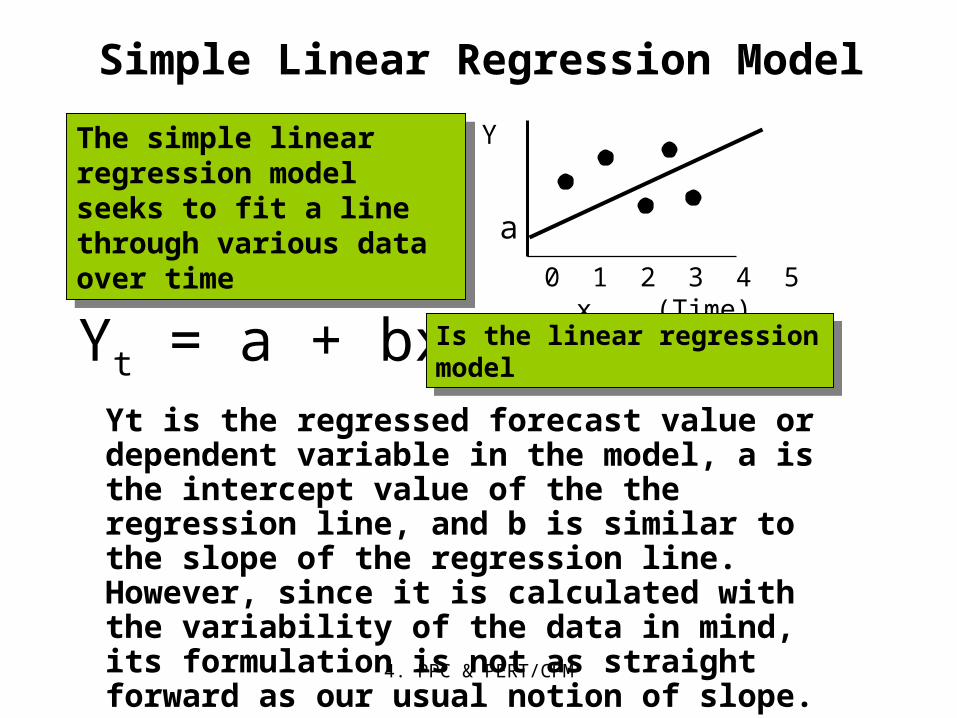
Simple Linear Regression Model
Yt = a + bx0 1 2 3 4 5 x (Time)
YThe simple linear regression model seeks to fit a line through various data over time
The simple linear regression model seeks to fit a line through various data over time
Is the linear regression modelIs the linear regression model
a
Yt is the regressed forecast value or dependent variable in the model, a is the intercept value of the the regression line, and b is similar to the slope of the regression line. However, since it is calculated with the variability of the data in mind, its formulation is not as straight forward as our usual notion of slope.

4. PPC & PERT/CPM
Simple Linear Regression Formulas for
Calculating “a” and “b”
a = y - bx
b =xy - n(y)(x)
x - n(x2 2
)
a = y - bx
b =xy - n(y)(x)
x - n(x2 2
)
4. PPC & PERT/CPM
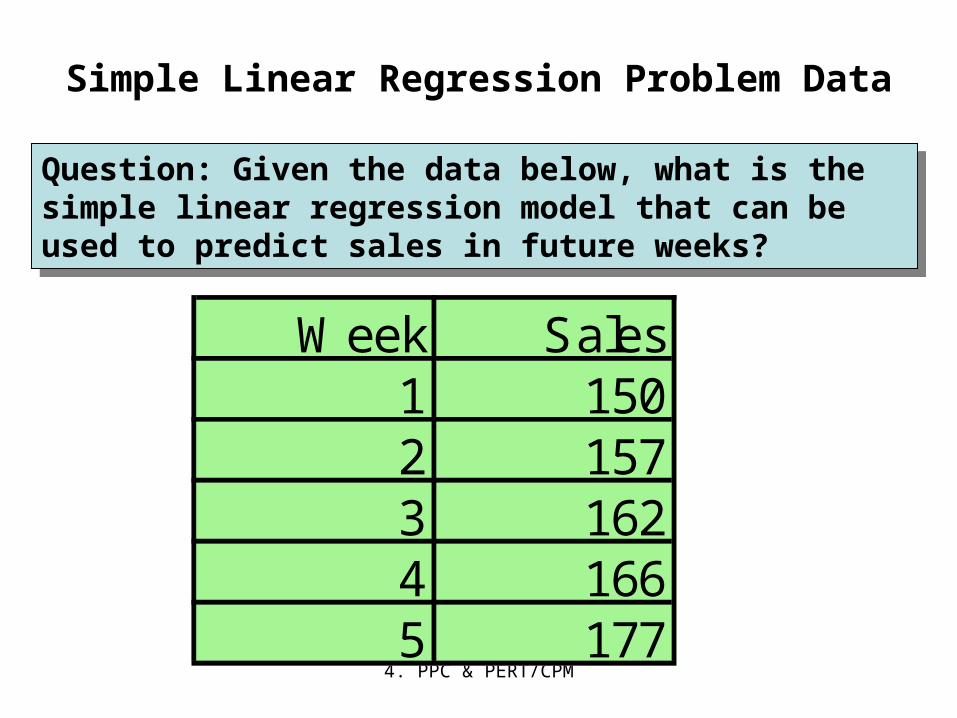
Simple Linear Regression Problem Data
Week Sales1 1502 1573 1624 1665 177
Question: Given the data below, what is the simple linear regression model that can be used to predict sales in future weeks?
Question: Given the data below, what is the simple linear regression model that can be used to predict sales in future weeks?
4. PPC & PERT/CPM
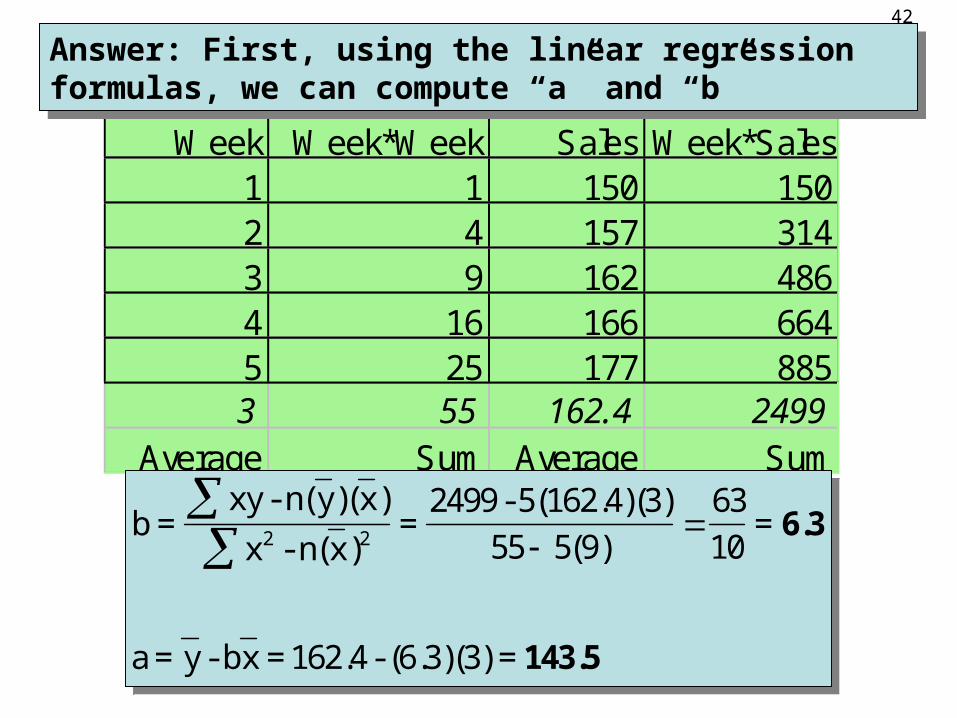
Week Week*Week Sales Week*Sales1 1 150 1502 4 157 3143 9 162 4864 16 166 6645 25 177 8853 55 162.4 2499
Average Sum Average Sum
b =xy - n(y)(x)
x - n(x=
2499 - 5(162.4)(3)=
a = y - bx = 162.4 - (6.3)(3) =
2 2
) ( )55 5 9
63
106.3
143.5
b =xy - n(y)(x)
x - n(x=
2499 - 5(162.4)(3)=
a = y - bx = 162.4 - (6.3)(3) =
2 2
) ( )55 5 9
63
106.3
143.5
Answer: First, using the linear regression formulas, we can compute “a” and “b”
Answer: First, using the linear regression formulas, we can compute “a” and “b”
42

4. PPC & PERT/CPM
Yt = 143.5 + 6.3x
180
Period
135140145150155160165170175
1 2 3 4 5
Sal
es
Sales
Forecast
The resulting regression model is:
Now if we plot the regression generated forecasts against the actual sales we obtain the following chart:
43

4. PPC & PERT/CPM
Web-Based Forecasting: CPFR
• Collaborative Planning, Forecasting, and Replenishment
(CPFR) a Web-based tool used to coordinate demand
forecasting, production and purchase planning, and inventory
replenishment between supply chain trading partners.
• Used to integrate the multi-tier or n-Tier supply chain,
including manufacturers, distributors and retailers.
• CPFR’s objective is to exchange selected internal information
to provide for a reliable, longer term future views of demand
in the supply chain.
• CPFR uses a cyclic and iterative approach to derive
consensus forecasts.
4. PPC & PERT/CPM
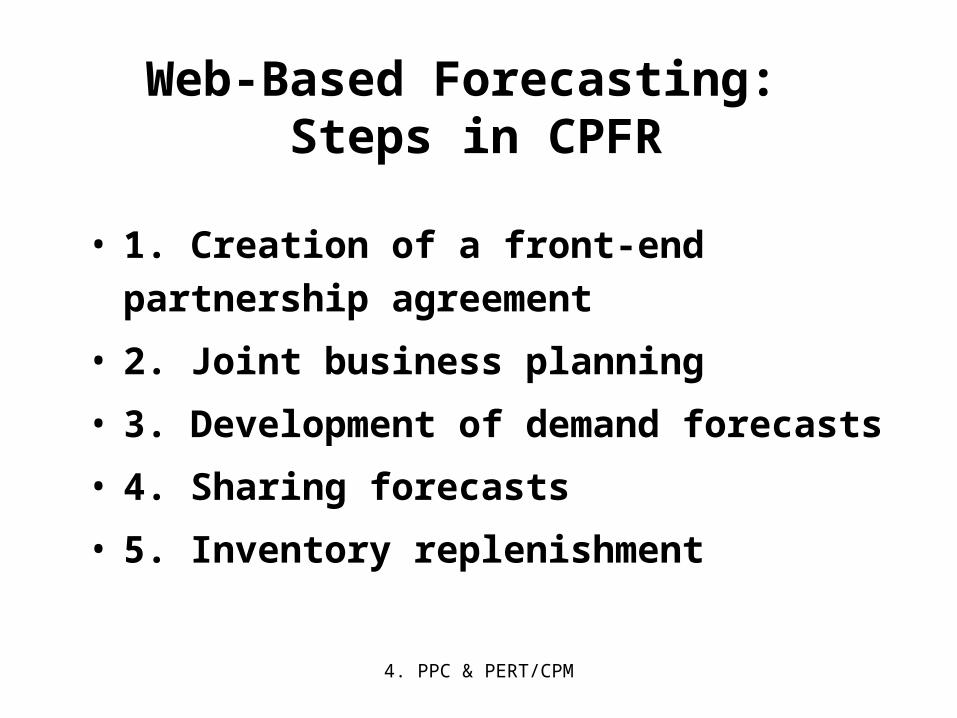
Web-Based Forecasting: Steps in CPFR
• 1. Creation of a front-end partnership
agreement
• 2. Joint business planning
• 3. Development of demand forecasts
• 4. Sharing forecasts
• 5. Inventory replenishment

4. PPC & PERT/CPM 46
Question Bowl
Which of the following is a classification of a basic
type of forecasting?
a. Transportation method
b. Simulation
c. Linear programming
d. All of the above
e. None of the above
Answer: b. Simulation (There are four types including Qualitative, Time Series Analysis, Causal Relationships, and Simulation.)

4. PPC & PERT/CPM 47
Question Bowl
Which of the following is an example of a
“Qualitative” type of forecasting technique or
model?a. Grass rootsb. Market researchc. Panel consensusd. All of the abovee. None of the above
Answer: d. All of the above (Also includes Historical Analogy and Delphi Method.)

4. PPC & PERT/CPM 48
Question Bowl
Which of the following is an example of a “Time
Series Analysis” type of forecasting technique or
model?
a. Simulation
b. Exponential smoothing
c. Panel consensus
d. All of the above
e. None of the aboveAnswer: b. Exponential smoothing (Also includes Simple Moving Average, Weighted Moving Average, Regression Analysis, Box Jenkins, Shiskin Time Series, and Trend Projections.)

4. PPC & PERT/CPM 49
Question Bowl
Which of the following is a reason why a firm
should choose a particular forecasting model?
a. Time horizon to forecast
b. Data availability
c. Accuracy required
d. Size of forecasting budget
e. All of the above
Answer: e. All of the above (Also should include “availability of qualified personnel” .)

4. PPC & PERT/CPM 50
Question Bowl
Which of the following are ways to choose
weights in a Weighted Moving Average
forecasting model?a. Costb. Experiencec. Trial and errord. Only b and c abovee. None of the above
Answer: d. Only b and c above

4. PPC & PERT/CPM 51
Question Bowl
Which of the following are reasons why the
Exponential Smoothing model has been a
well accepted forecasting methodology?a. It is accurateb. It is easy to usec. Computer storage requirements are smalld. All of the abovee. None of the above
Answer: d. All of the above
4. PPC & PERT/CPM 52
Question Bowl
The value for alpha or α must be between
which of the following when used in an
Exponential Smoothing model?
a. 1 to 10
b. 1 to 2
c. 0 to 1
d. -1 to 1
e. Any number at all
Answer: c. 0 to 1

4. PPC & PERT/CPM 53
Question Bowl
Which of the following are sources of error in
forecasts?
a. Bias
b. Random
c. Employing the wrong trend line
d. All of the above
e. None of the aboveAnswer: d. All of the above
4. PPC & PERT/CPM 54
Question Bowl
Which of the following would be the “best” MAD
values in an analysis of the accuracy of a
forecasting model?
a. 1000
b. 100
c. 10
d. 1
e. 0
Answer: e. 0
4. PPC & PERT/CPM 55
Question Bowl
If a Least Squares model is: Y=25+5x, and x is
equal to 10, what is the forecast value using
this model?
a. 100
b. 75
c. 50
d. 25
e. None of the above
Answer: b. 75 (Y=25+5(10)=75)

4. PPC & PERT/CPM 56
Question Bowl
Which of the following are examples of
seasonal variation?
a. Additive
b. Least squares
c. Standard error of the estimate
d. Decomposition
e. None of the aboveAnswer: a. Additive (The other type is of seasonal variation is Multiplicative.)

4. PPC & PERT/CPM 57
4b. Aggregate Sales and Operations Planning
4. PPC & PERT/CPM
• Sales and Operations Planning
• The Aggregate Operations Plan
• Examples: Chase and Level strategies
OBJECTIVES

4. PPC & PERT/CPM 59
Master scheduling
Material requirements planning
Order schedulingWeekly workforce andcustomer scheduling
Daily workforce and customer scheduling
Process planning
Strategic capacity planning
Sales and operations (aggregate) planning
Longrange
Intermediaterange
Shortrange
ManufacturingServices
Exhibit 14.1Exhibit 14.1
Sales plan Aggregate operations plan
Forecasting & demand management
4. PPC & PERT/CPM
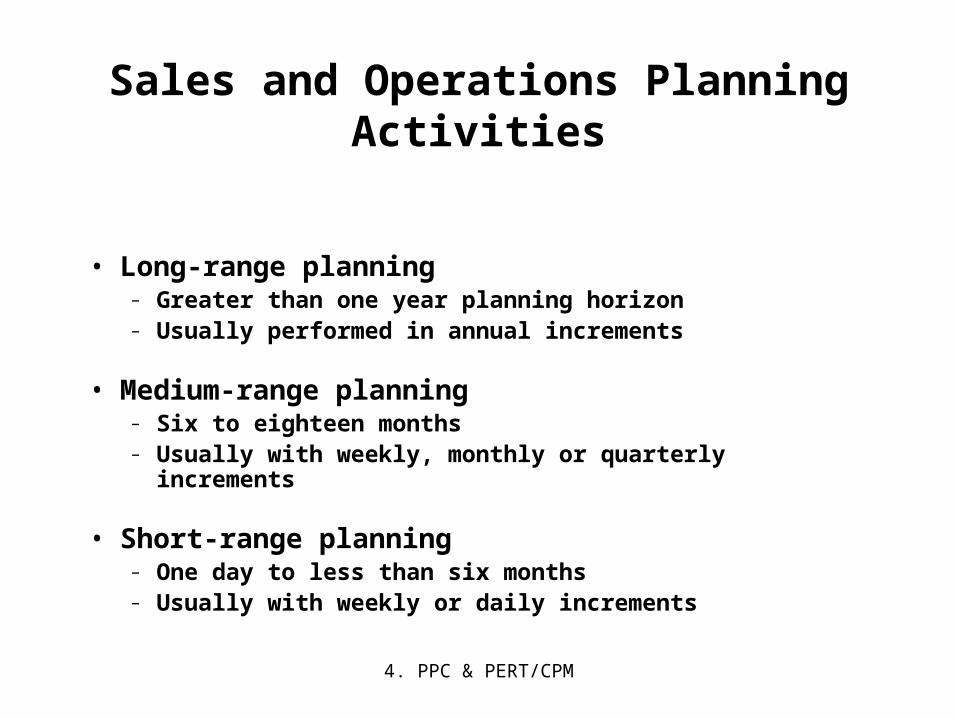
Sales and Operations Planning Activities
• Long-range planning– Greater than one year planning horizon– Usually performed in annual increments
• Medium-range planning– Six to eighteen months – Usually with weekly, monthly or quarterly increments
• Short-range planning– One day to less than six months– Usually with weekly or daily increments

4. PPC & PERT/CPM
The Aggregate Operations Plan
• Main purpose: Specify the optimal combination of
– production rate (units completed per unit of time)
– workforce level (number of workers)
– inventory on hand (inventory carried from previous period)
• Product group or broad category (Aggregation)
• This planning is done over an intermediate-range planning period of 3 to18 months

4. PPC & PERT/CPM
Balancing Aggregate Demandand Aggregate Production Capacity
0
2000
4000
6000
8000
10000
Jan Feb Mar Apr May Jun
45005500
7000
10000
8000
6000
0
2000
4000
6000
8000
10000
Jan Feb Mar Apr May Jun
4500 4000
90008000
4000
6000
Suppose the figure to the right represents forecast demand in units
Suppose the figure to the right represents forecast demand in units
Now suppose this lower figure represents the aggregate capacity of the company to meet demand
Now suppose this lower figure represents the aggregate capacity of the company to meet demand
What we want to do is balance out the production rate, workforce levels, and inventory to make these figures match up
What we want to do is balance out the production rate, workforce levels, and inventory to make these figures match up

4. PPC & PERT/CPM
Required Inputs to the Production Planning System
Planning for
production
External capacity
Competitors’behavior
Raw material availability
Market demand
Economic conditions
Currentphysical capacity
Current workforce
Inventory levels
Activities required for production
External to firm
Internal to firm

4. PPC & PERT/CPM
Key Strategies for Meeting Demand
• Chase
• Level
• Some combination of the two
4. PPC & PERT/CPM
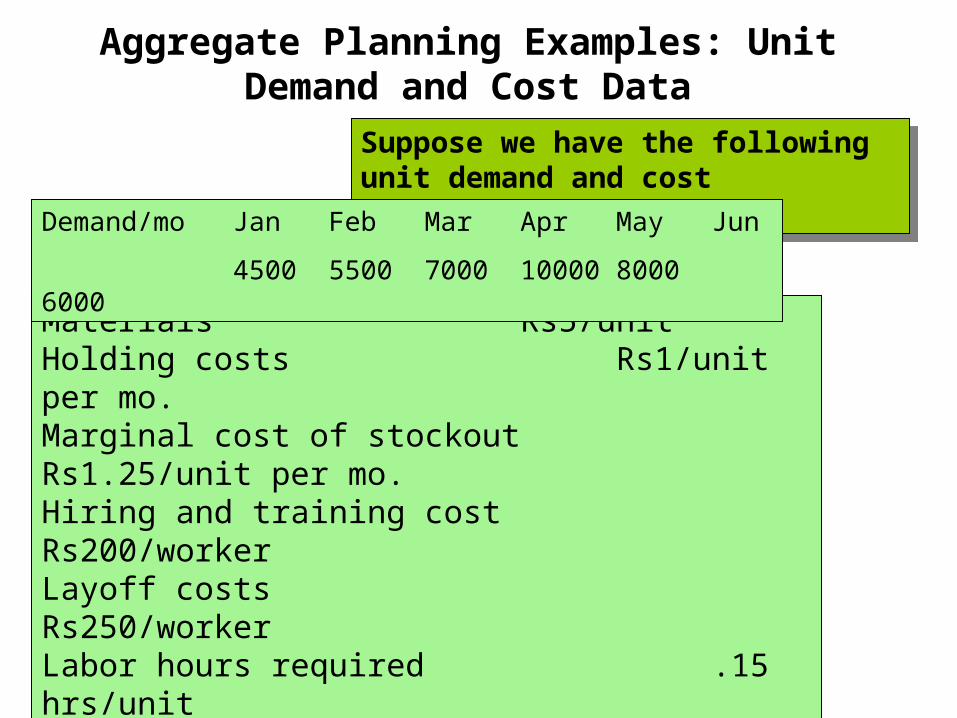
Aggregate Planning Examples: Unit Demand and Cost Data
Materials Rs5/unitHolding costs Rs1/unit per mo.Marginal cost of stockout Rs1.25/unit per mo.Hiring and training cost Rs200/workerLayoff costs Rs250/workerLabor hours required .15 hrs/unitStraight time labor cost Rs8/hourBeginning inventory 250 unitsProductive hours/worker/day 7.25Paid straight hrs/day 8
Suppose we have the following unit demand and cost information:
Suppose we have the following unit demand and cost information:
Demand/mo Jan Feb Mar Apr May Jun
4500 5500 7000 10000 8000 6000
4. PPC & PERT/CPM 66
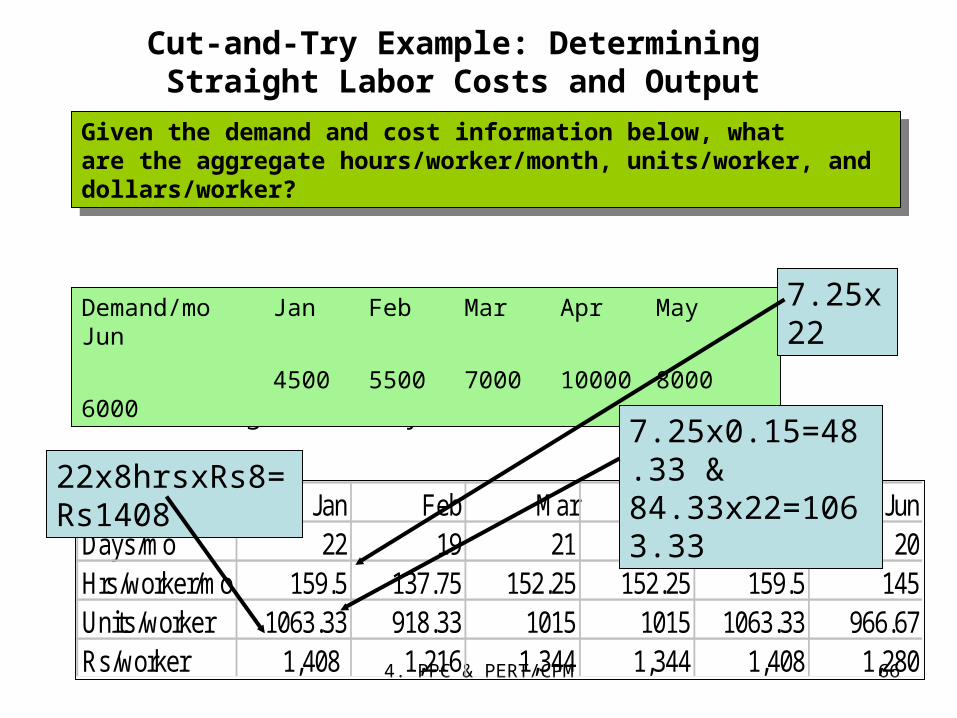
Jan Feb Mar Apr May JunDays/mo 22 19 21 21 22 20Hrs/worker/mo 159.5 137.75 152.25 152.25 159.5 145Units/worker 1063.33 918.33 1015 1015 1063.33 966.67Rs/worker 1,408 1,216 1,344 1,344 1,408 1,280
Productive hours/worker/day 7.25Paid straight hrs/day 8
Demand/mo Jan Feb Mar Apr MayJun
4500 5500 7000 10000 80006000
Given the demand and cost information below, whatare the aggregate hours/worker/month, units/worker, and dollars/worker?
Given the demand and cost information below, whatare the aggregate hours/worker/month, units/worker, and dollars/worker?
7.25x22
7.25x0.15=48.33 & 84.33x22=1063.33
22x8hrsxRs8=Rs1408
Cut-and-Try Example: Determining Straight Labor Costs and Output

4. PPC & PERT/CPM
Chase Strategy(Hiring & Firing to meet demand)
JanDays/mo 22Hrs/worker/mo 159.5Units/worker 1,063.33Rs/worker 1,408
JanDemand 4,500Beg. inv. 250Net req. 4,250Req. workers 3.997HiredFired 3Workforce 4Ending inventory 0
Lets assume our current workforce is 7 workers.
Lets assume our current workforce is 7 workers.
First, calculate net requirements for production, or 4500-250=4250 units
Then, calculate number of workers needed to produce the net requirements, or 4250/1063.33=3.997 or 4 workers
Finally, determine the number of workers to hire/fire. In this case we only need 4 workers, we have 7, so 3 can be fired.

4. PPC & PERT/CPM
Jan Feb Mar Apr May JunDays/mo 22 19 21 21 22 20Hrs/worker/mo 159.5 137.75 152.25 152.25 159.5 145Units/worker 1,063 918 1,015 1,015 1,063 967Rs/worker 1,408 1,216 1,344 1,344 1,408 1,280
Jan Feb Mar Apr May JunDemand 4,500 5,500 7,000 10,000 8,000 6,000Beg. inv. 250Net req. 4,250 5,500 7,000 10,000 8,000 6,000Req. workers 3.997 5.989 6.897 9.852 7.524 6.207Hired 2 1 3Fired 3 2 1Workforce 4 6 7 10 8 7Ending inventory 0 0 0 0 0 0
Below are the complete calculations for the remaining months in the six month planning horizon
Below are the complete calculations for the remaining months in the six month planning horizon
4. PPC & PERT/CPM
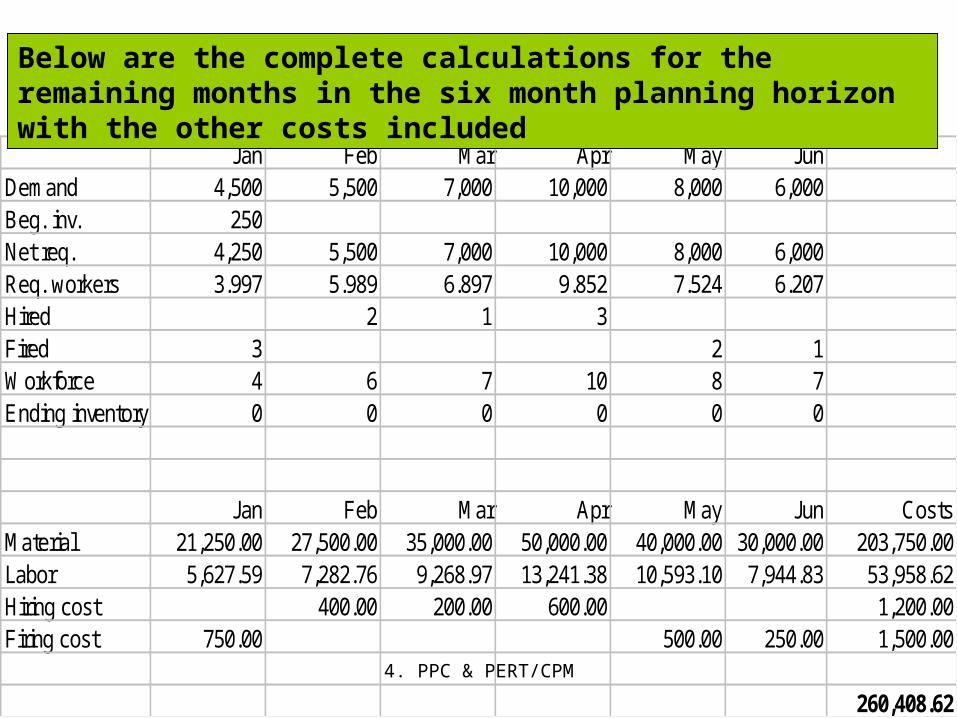
Jan Feb Mar Apr May JunDemand 4,500 5,500 7,000 10,000 8,000 6,000Beg. inv. 250Net req. 4,250 5,500 7,000 10,000 8,000 6,000Req. workers 3.997 5.989 6.897 9.852 7.524 6.207Hired 2 1 3Fired 3 2 1Workforce 4 6 7 10 8 7Ending inventory 0 0 0 0 0 0
Jan Feb Mar Apr May Jun CostsMaterial 21,250.00 27,500.00 35,000.00 50,000.00 40,000.00 30,000.00 203,750.00Labor 5,627.59 7,282.76 9,268.97 13,241.38 10,593.10 7,944.83 53,958.62Hiring cost 400.00 200.00 600.00 1,200.00Firing cost 750.00 500.00 250.00 1,500.00
260,408.62
Below are the complete calculations for the remaining months in the six month planning horizon with the other costs included

4. PPC & PERT/CPM
Level Workforce Strategy (Surplus and Shortage Allowed)
JanDemand 4,500Beg. inv. 250Net req. 4,250Workers 6Production 6,380Ending inventory 2,130Surplus 2,130Shortage
Lets take the same problem as before but this time use the Level Workforce strategy
Lets take the same problem as before but this time use the Level Workforce strategy
This time we will seek to use a workforce level of 6 workers
This time we will seek to use a workforce level of 6 workers
4. PPC & PERT/CPM
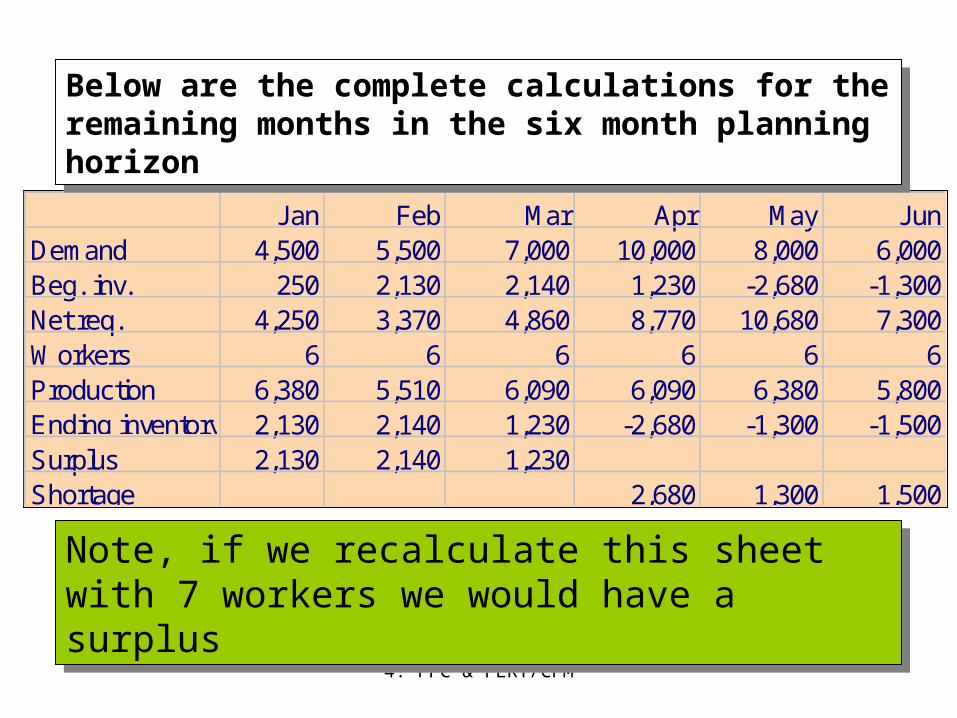
Jan Feb Mar Apr May JunDemand 4,500 5,500 7,000 10,000 8,000 6,000Beg. inv. 250 2,130 2,140 1,230 -2,680 -1,300Net req. 4,250 3,370 4,860 8,770 10,680 7,300Workers 6 6 6 6 6 6Production 6,380 5,510 6,090 6,090 6,380 5,800Ending inventory 2,130 2,140 1,230 -2,680 -1,300 -1,500Surplus 2,130 2,140 1,230Shortage 2,680 1,300 1,500
Note, if we recalculate this sheet with 7 workers we would have a surplus
Note, if we recalculate this sheet with 7 workers we would have a surplus
Below are the complete calculations for the remaining months in the six month planning horizon
Below are the complete calculations for the remaining months in the six month planning horizon

4. PPC & PERT/CPM
Jan Feb Mar Apr May Jun4,500 5,500 7,000 10,000 8,000 6,000
250 2,130 10 -910 -3,910 -1,6204,250 3,370 4,860 8,770 10,680 7,300
6 6 6 6 6 66,380 5,510 6,090 6,090 6,380 5,8002,130 2,140 1,230 -2,680 -1,300 -1,5002,130 2,140 1,230
2,680 1,300 1,500
Jan Feb Mar Apr May Jun8,448.00 7,296.00 8,064.00 8,064.00 8,448.00 7,680.00 48,000.00
31,900.00 27,550.00 30,450.00 30,450.00 31,900.00 29,000.00 181,250.002,130.00 2,140.00 1,230.00 5,500.00
3,350.00 1,625.00 1,875.00 6,850.00
241,600.00
Below are the complete calculations for the remaining months in the six month planning horizon with the other costs included
Below are the complete calculations for the remaining months in the six month planning horizon with the other costs included
Note, total costs under this strategy are less than Chase at Rs260.408.62
Note, total costs under this strategy are less than Chase at Rs260.408.62
LaborMaterialStorageStockout

4. PPC & PERT/CPM 73
Question Bowl
Sales and Operations Planning activities are usually conducted during which planning time horizon?
a. Long-range b. Intermediate-rangec. Short-ranged. Really short-rangee. None of the above
Answer: b. Intermediate-range (i.e., 6 to 18 months)

4. PPC & PERT/CPM 74
Question Bowl
Which of the following are Production Planning
Strategies can involve trade-offs among the
workforce size, work hours, inventory, and
backlogs?
a. Chase strategy
b. Stable workforce-variable work hours
c. Level strategy
d. All of the above
e. None of the above
Answer: d. All of the above

4. PPC & PERT/CPM 75
Question Bowl
Which of the following are considered “relevant
costs” in the Aggregate Production Plan?a. Costs associated with changes in the
production rateb. Inventory holding costsc. Backordering costsd. Basic production costse. All of the above
Answer: e. All of the above

4. PPC & PERT/CPM 76
Question Bowl
Which of the following Aggregate Planning
Techniques can be performed using simple
spreadsheets?a. Cut-and-tryb. Linear programmingc. Transportation methodd. All of the abovee. None of the above
Answer: a. Cut-and-try (The other two involve more complex computational effort than simple spreadsheets.)
4. PPC & PERT/CPM 77
Question Bowl
Which of the following methods can be used to
allocate the right type of capacity to the right
type of customer at the right price and in time to
maximize revenue?
a. Cut-and-try
b. Yield management
c. Transportation method
d. All of the above
e. None of the above Answer: b. Yield management
4. PPC & PERT/CPM 78
Question Bowl
From an operational perspective Yield
Management is most effective as a capacity
technique, when which of the following happens?
a. Demand can not be segmented by customer
b. Variable costs are high
c. Fixed costs are low
d. Demand is highly variable
e. All of the aboveAnswer: d. Demand is highly variable

4. PPC & PERT/CPM 79
4c. Inventory Control(A Part of Material Planning)

4. PPC & PERT/CPM
• Inventory System Defined
• Inventory Costs
• Independent vs. Dependent Demand
• Single-Period Inventory Model
• Multi-Period Inventory Models: Basic Fixed-Order
Quantity Models
• Multi-Period Inventory Models: Basic Fixed-Time
Period Model
• Miscellaneous Systems and Issues
OBJECTIVES
4. PPC & PERT/CPM
Inventory System
• Inventory is the stock of any item or resource
used in an organization and can include: raw
materials, finished products, component parts,
supplies, and work-in-process
• An inventory system is the set of policies and
controls that monitor levels of inventory and
determines what levels should be maintained,
when stock should be replenished, and how
large orders should be

4. PPC & PERT/CPM
Purposes of Inventory
1. To maintain independence of operations
2. To meet variation in product demand
3. To allow flexibility in production scheduling
4. To provide a safeguard for variation in raw
material delivery time
5. To take advantage of economic purchase-order
size

4. PPC & PERT/CPM
Inventory Costs
• Holding (or carrying) costs
– Costs for storage, handling, insurance, etc
• Setup (or production change) costs
– Costs for arranging specific equipment
setups, etc
• Ordering costs
– Costs of someone placing an order, etc
• Shortage costs
– Costs of canceling an order, etc

4. PPC & PERT/CPM
E(1)
Independent vs. Dependent Demand
Independent Demand (Demand for the final end-product or demand not related to other items)
Dependent Demand
(Derived demand items for
component parts,
subassemblies, raw materials,
etc)
Finishedproduct
Component parts
4. PPC & PERT/CPM
Inventory Systems
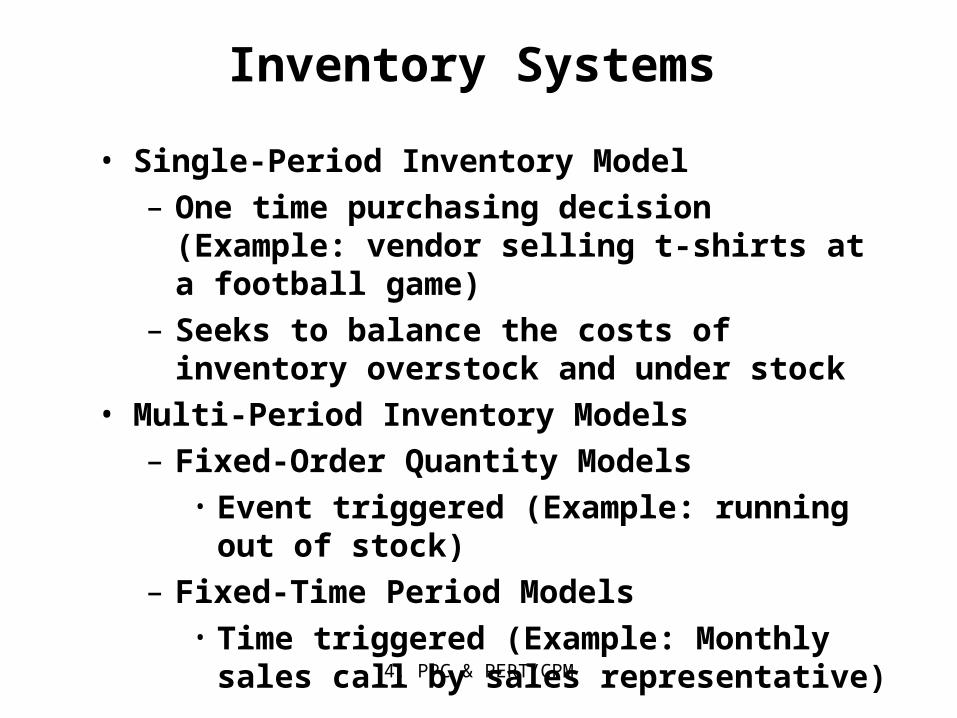
• Single-Period Inventory Model– One time purchasing decision (Example:
vendor selling t-shirts at a football game)– Seeks to balance the costs of inventory
overstock and under stock• Multi-Period Inventory Models
– Fixed-Order Quantity Models• Event triggered (Example: running out of
stock)– Fixed-Time Period Models
• Time triggered (Example: Monthly sales call by sales representative)

4. PPC & PERT/CPM
Single-Period Inventory Model
uo
u
CC
CP
uo
u
CC
CP
sold be unit will y that theProbabilit
estimatedunder demand ofunit per Cost C
estimatedover demand ofunit per Cost C
:Where
u
o
P
This model states that we should continue to increase the size of the inventory so long as the probability of selling the last unit added is equal to or greater than the ratio of: Cu/Co+Cu
This model states that we should continue to increase the size of the inventory so long as the probability of selling the last unit added is equal to or greater than the ratio of: Cu/Co+Cu

4. PPC & PERT/CPM 87
Single Period Model Example
• Our college basketball team is playing in a tournament game this weekend. Based on our past experience we sell on average 2,400 shirts with a standard deviation of 350. We make Rs100 on every shirt we sell at the game, but lose Rs50 on every shirt not sold. How many shirts should we make for the game?
Cu = Rs100 and Co = Rs50; P ≤ 100 / (100 + 50) = .667
Z.667 = .432 (use NORMSDIST(.667) or Appendix E) therefore we need 2,400 + .432(350) = 2,551 shirts

4. PPC & PERT/CPM 88
Multi-Period Models:Fixed-Order Quantity Model Model
Assumptions (Part 1)
• Demand for the product is constant and uniform throughout the period
• Lead time (time from ordering to receipt) is constant
• Price per unit of product is constant

4. PPC & PERT/CPM
Multi-Period Models:Fixed-Order Quantity Model Model Assumptions
(Part 2)
• Inventory holding cost is based on average inventory
• Ordering or setup costs are constant
• All demands for the product will be satisfied (No back orders are allowed)
4. PPC & PERT/CPM 90
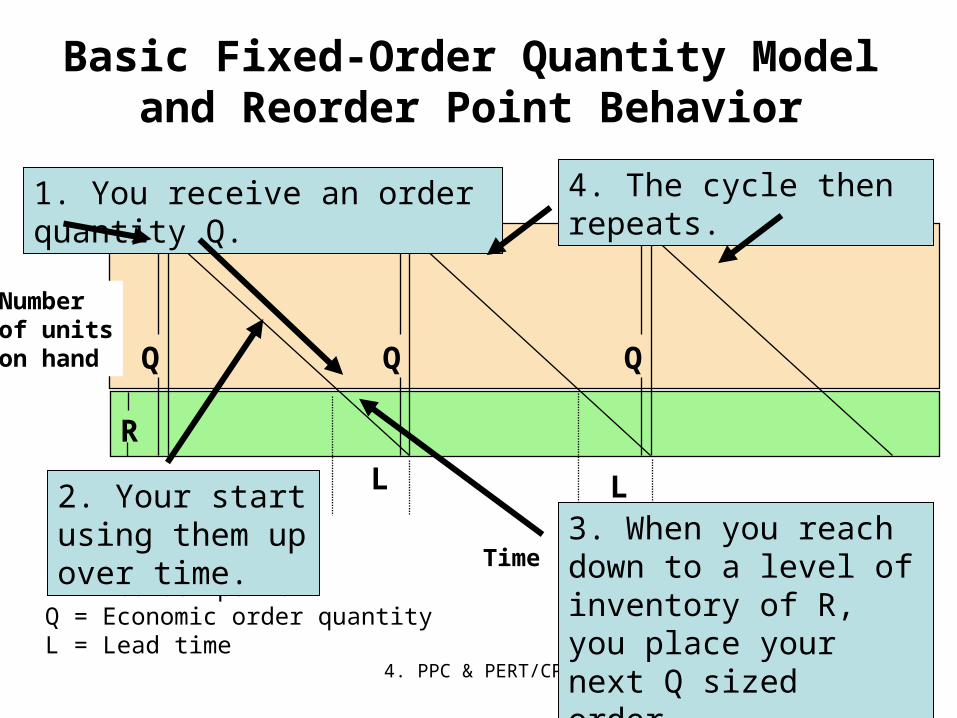
Basic Fixed-Order Quantity Model and Reorder Point Behavior
R = Reorder pointQ = Economic order quantityL = Lead time
L L
Q QQ
R
Time
Numberof unitson hand
1. You receive an order quantity Q.
2. Your start using them up over time. 3. When you reach down to
a level of inventory of R, you place your next Q sized order.
4. The cycle then repeats.

4. PPC & PERT/CPM
Cost Minimization Goal
Ordering Costs
HoldingCosts
Order Quantity (Q)
COST
Annual Cost ofItems (DC)
Total Cost
QOPT
By adding the item, holding, and ordering costs together, we determine the total cost curve, which in turn is used to find the Qopt inventory order point that minimizes total costs
By adding the item, holding, and ordering costs together, we determine the total cost curve, which in turn is used to find the Qopt inventory order point that minimizes total costs
4. PPC & PERT/CPM
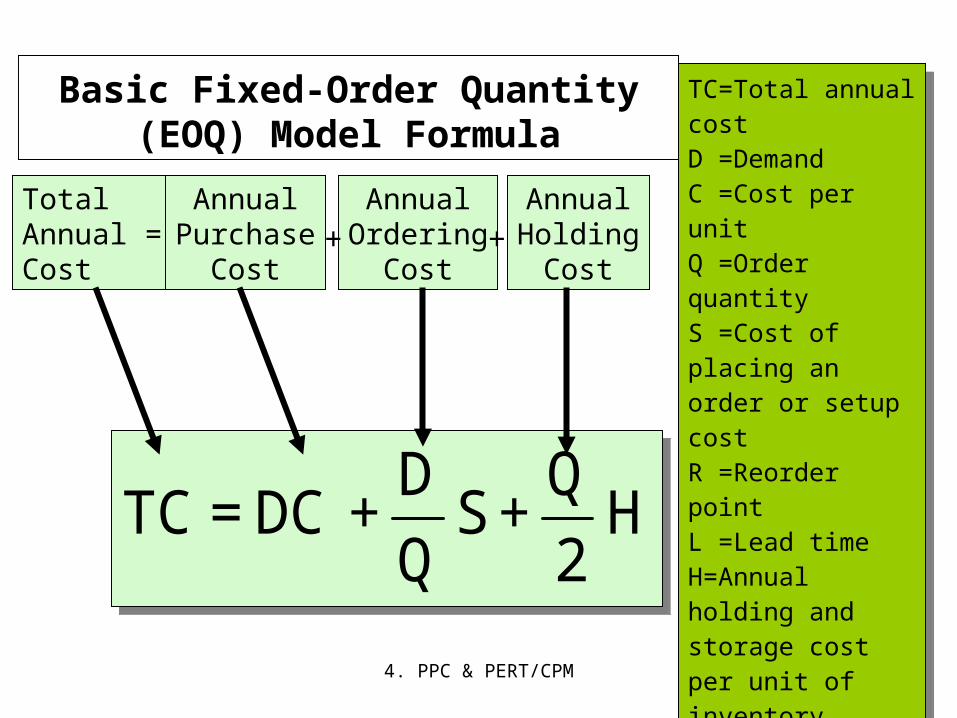
Basic Fixed-Order Quantity (EOQ) Model Formula
H 2
Q + S
Q
D + DC = TC H
2
Q + S
Q
D + DC = TC
Total Annual =Cost
AnnualPurchase
Cost
AnnualOrdering
Cost
AnnualHolding
Cost+ +
TC=Total annual costD =DemandC =Cost per unitQ =Order quantityS =Cost of placing an order or setup costR =Reorder pointL =Lead timeH=Annual holding and storage cost per unit of inventory
TC=Total annual costD =DemandC =Cost per unitQ =Order quantityS =Cost of placing an order or setup costR =Reorder pointL =Lead timeH=Annual holding and storage cost per unit of inventory

4. PPC & PERT/CPM
Deriving the EOQ
Using calculus, we take the first derivative of the total cost function with respect to Q, and set the derivative (slope) equal to zero, solving for the optimized (cost minimized) value of Qopt
Using calculus, we take the first derivative of the total cost function with respect to Q, and set the derivative (slope) equal to zero, solving for the optimized (cost minimized) value of Qopt
Q = 2DS
H =
2(Annual D em and)(Order or Setup Cost)
Annual Holding CostOPTQ =
2DS
H =
2(Annual D em and)(Order or Setup Cost)
Annual Holding CostOPT
Reorder point, R = d L_
Reorder point, R = d L_
d = average daily demand (constant)
L = Lead time (constant)
_
We also need a reorder point to tell us when to place an order
We also need a reorder point to tell us when to place an order
4. PPC & PERT/CPM
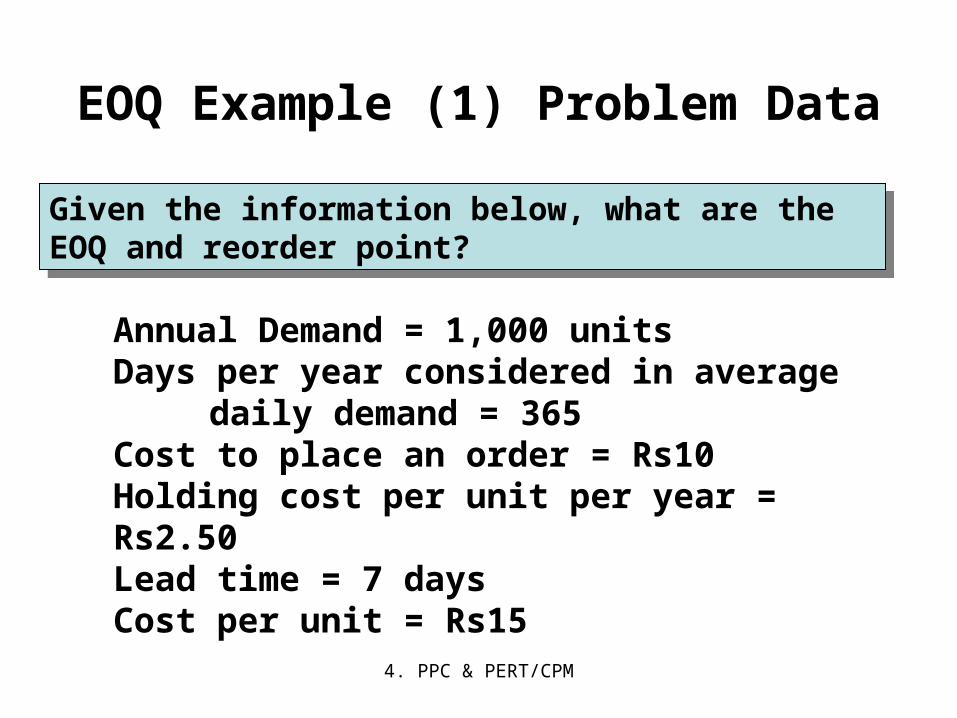
EOQ Example (1) Problem Data
Annual Demand = 1,000 unitsDays per year considered in average
daily demand = 365Cost to place an order = Rs10Holding cost per unit per year = Rs2.50Lead time = 7 daysCost per unit = Rs15
Given the information below, what are the EOQ and reorder point?
Given the information below, what are the EOQ and reorder point?

4. PPC & PERT/CPM
EOQ Example (1) Solution
Q = 2DS
H =
2(1,000 )(10)
2.50 = 89.443 units or OPT 90 unitsQ =
2DS
H =
2(1,000 )(10)
2.50 = 89.443 units or OPT 90 units
d = 1,000 units / year
365 days / year = 2.74 units / dayd =
1,000 units / year
365 days / year = 2.74 units / day
Reorder point, R = d L = 2.74units / day (7days) = 19.18 or _
20 units Reorder point, R = d L = 2.74units / day (7days) = 19.18 or _
20 units
In summary, you place an optimal order of 90 units. In the course of using the units to meet demand, when you only have 20 units left, place the next order of 90 units.
In summary, you place an optimal order of 90 units. In the course of using the units to meet demand, when you only have 20 units left, place the next order of 90 units.
4. PPC & PERT/CPM
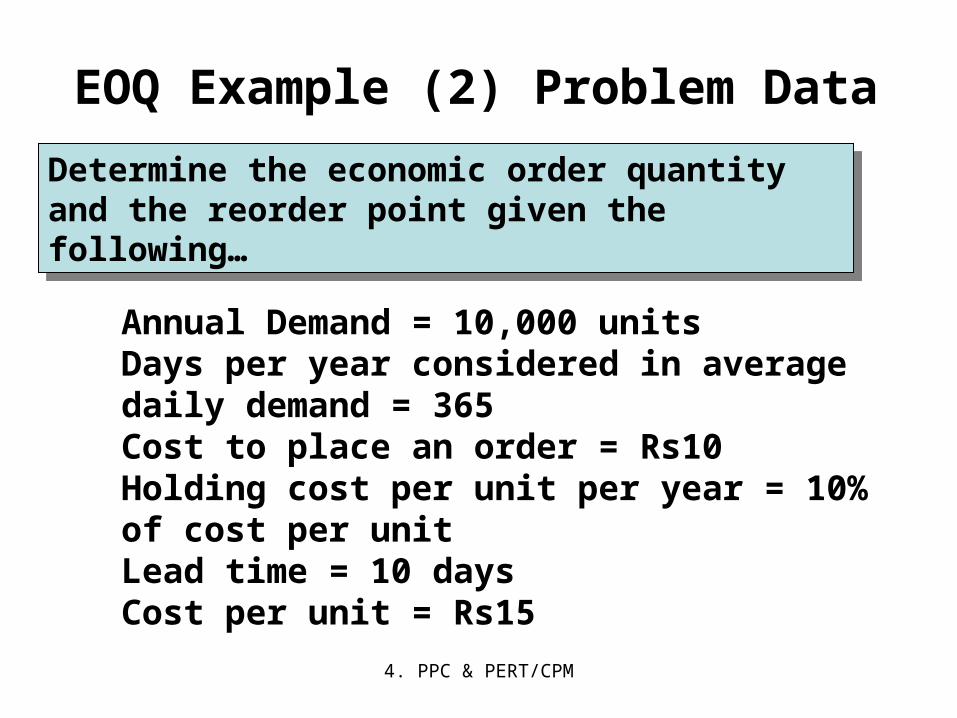
EOQ Example (2) Problem Data
Annual Demand = 10,000 unitsDays per year considered in average daily demand = 365Cost to place an order = Rs10Holding cost per unit per year = 10% of cost per unitLead time = 10 daysCost per unit = Rs15
Determine the economic order quantity and the reorder point given the following…
Determine the economic order quantity and the reorder point given the following…

4. PPC & PERT/CPM
EOQ Example (2) Solution
Q =2DS
H=
2(10,000 )(10)
1.50= 365.148 units, or OPT 366 unitsQ =
2DS
H=
2(10,000 )(10)
1.50= 365.148 units, or OPT 366 units
d =10,000 units / year
365 days / year= 27.397 units / dayd =
10,000 units / year
365 days / year= 27.397 units / day
R = d L = 27.397 units / day (10 days) = 273.97 or _
274 unitsR = d L = 27.397 units / day (10 days) = 273.97 or _
274 units
Place an order for 366 units. When in the course of using the inventory you are left with only 274 units, place the next order of 366 units.
Place an order for 366 units. When in the course of using the inventory you are left with only 274 units, place the next order of 366 units.
4. PPC & PERT/CPM
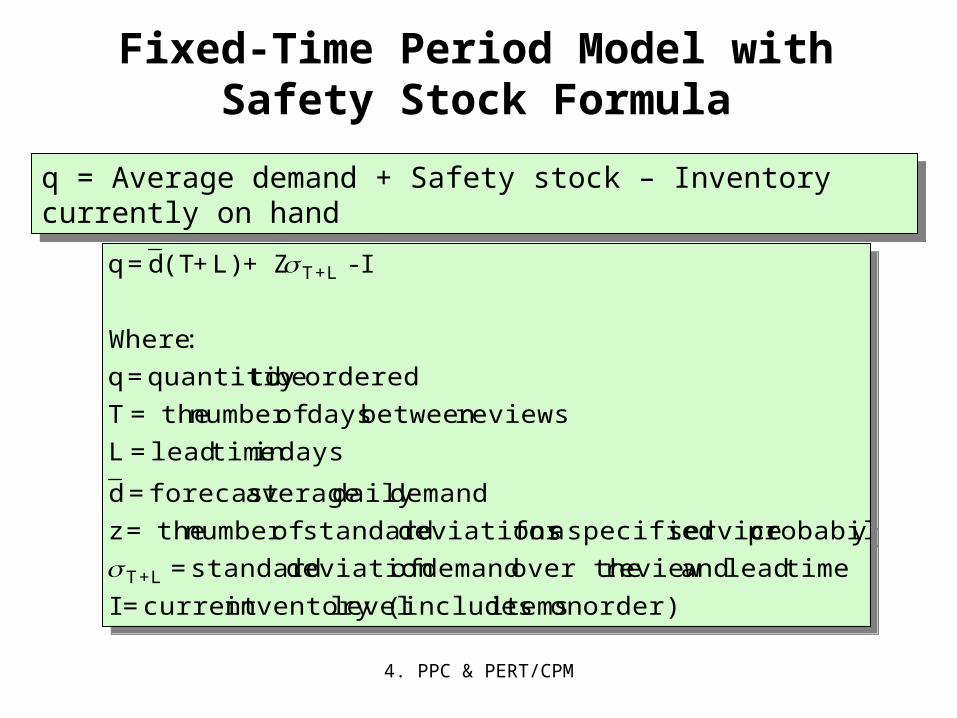
Fixed-Time Period Model with Safety Stock Formula
order)on items (includes levelinventory current = I
timelead and review over the demand ofdeviation standard =
yprobabilit service specified afor deviations standard ofnumber the= z
demanddaily averageforecast = d
daysin timelead = L
reviewsbetween days ofnumber the= T
ordered be toquantitiy = q
:Where
I - Z+ L)+(Td = q
L+T
L+T
q = Average demand + Safety stock – Inventory currently on handq = Average demand + Safety stock – Inventory currently on hand
4. PPC & PERT/CPM
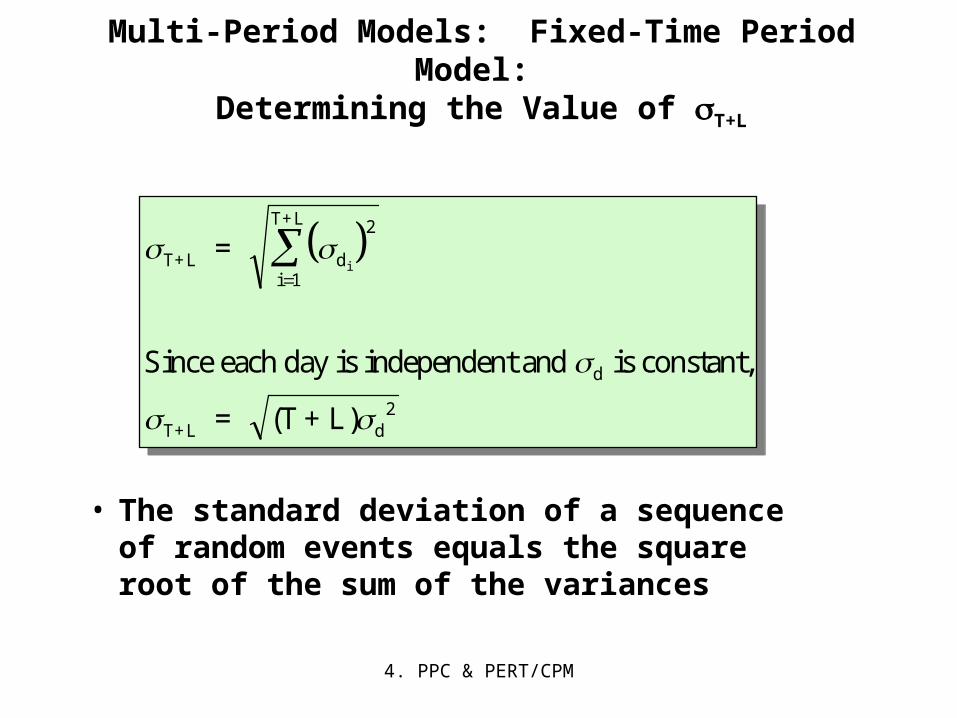
Multi-Period Models: Fixed-Time Period Model: Determining the Value of T+L
T+L di 1
T+L
d
T+L d2
=
Since each day is independent and is constant,
= (T + L)
i
2
T+L di 1
T+L
d
T+L d2
=
Since each day is independent and is constant,
= (T + L)
i
2
• The standard deviation of a sequence of random events equals the square root of the sum of the variances
4. PPC & PERT/CPM
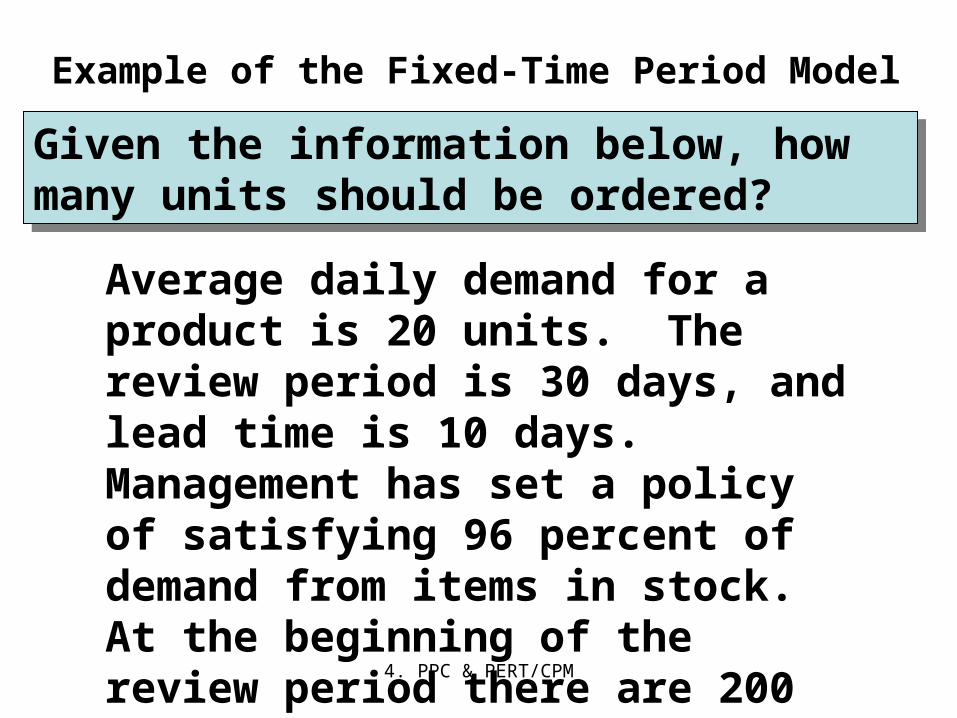
Example of the Fixed-Time Period Model
Average daily demand for a product is 20 units. The review period is 30 days, and lead time is 10 days. Management has set a policy of satisfying 96 percent of demand from items in stock. At the beginning of the review period there are 200 units in inventory. The daily demand standard deviation is 4 units.
Given the information below, how many units should be ordered?
Given the information below, how many units should be ordered?

4. PPC & PERT/CPM
Example of the Fixed-Time Period Model: Solution (Part 1)
T+ L d2 2 = (T + L) = 30 + 10 4 = 25.298 T+ L d
2 2 = (T + L) = 30 + 10 4 = 25.298
The value for “z” is found by using the Excel NORMSINV function, or as we will do here, using Appendix D. By adding 0.5 to all the values in Appendix D and finding the value in the table that comes closest to the service probability, the “z” value can be read by adding the column heading label to the row label.
So, by adding 0.5 to the value from Appendix D of 0.4599, we have a probability of 0.9599, which is given by a z = 1.75
4. PPC & PERT/CPM
Example of the Fixed-Time Period Model: Solution (Part 2)
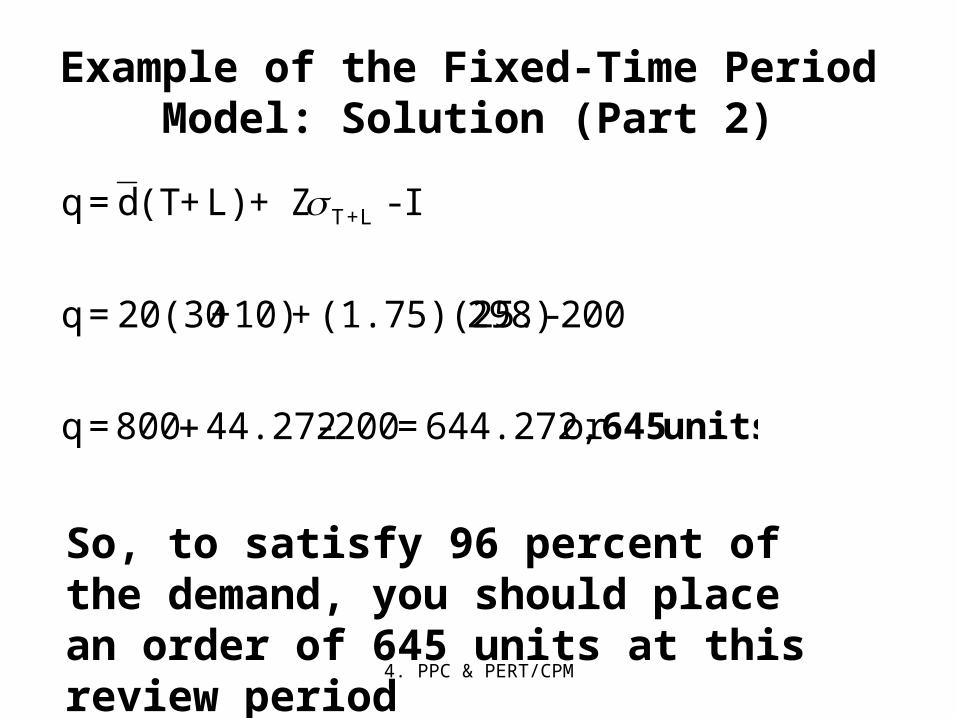
or 644.272, = 200 - 44.272 800 = q
200- 298)(1.75)(25. + 10)+20(30 = q
I - Z+ L)+(Td = q L+T
units 645
So, to satisfy 96 percent of the demand, you should place an order of 645 units at this review period
4. PPC & PERT/CPM
Price-Break Model Formula
Cost Holding Annual
Cost) Setupor der Demand)(Or 2(Annual =
iC
2DS = QOPT
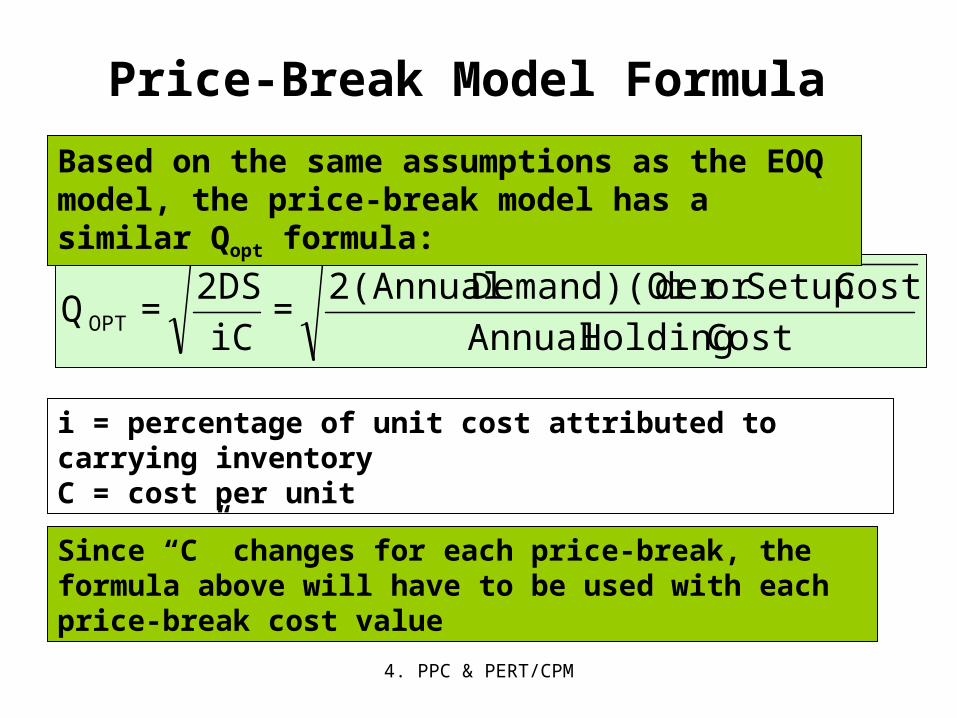
Based on the same assumptions as the EOQ model, the price-break model has a similar Qopt formula:
i = percentage of unit cost attributed to carrying inventoryC = cost per unit
Since “C” changes for each price-break, the formula above will have to be used with each price-break cost value

4. PPC & PERT/CPM
Price-Break Example Problem Data (Part 1)
A company has a chance to reduce their inventory ordering costs by placing larger quantity orders using the price-break order quantity schedule below. What should their optimal order quantity be if this company purchases this single inventory item with an e-mail ordering cost of Rs4, a carrying cost rate of 2% of the inventory cost of the item, and an annual demand of 10,000 units?
A company has a chance to reduce their inventory ordering costs by placing larger quantity orders using the price-break order quantity schedule below. What should their optimal order quantity be if this company purchases this single inventory item with an e-mail ordering cost of Rs4, a carrying cost rate of 2% of the inventory cost of the item, and an annual demand of 10,000 units?
Order Quantity(units) Price/unit(Rs)0 to 2,499 Rs1.202,500 to 3,999 1.004,000 or more .98

4. PPC & PERT/CPM
Price-Break Example Solution (Part 2)
units 1,826 = 0.02(1.20)
4)2(10,000)( =
iC
2DS = QOPT
Annual Demand (D)= 10,000 unitsCost to place an order (S)= Rs4
First, plug data into formula for each price-break value of “C”
units 2,000 = 0.02(1.00)
4)2(10,000)( =
iC
2DS = QOPT
units 2,020 = 0.02(0.98)
4)2(10,000)( =
iC
2DS = QOPT
Carrying cost % of total cost (i)= 2%Cost per unit (C) = $1.20, $1.00, $0.98
Interval from 0 to 2499, the Qopt value is feasible
Interval from 2500-3999, the Qopt value is not feasible
Interval from 4000 & more, the Qopt value is not feasible
Next, determine if the computed Qopt values are feasible or not

4. PPC & PERT/CPM
Price-Break Example Solution (Part 3)
Since the feasible solution occurred in the first price-break, it means that all the other true Qopt values occur at the beginnings of each price-break interval. Why?
Since the feasible solution occurred in the first price-break, it means that all the other true Qopt values occur at the beginnings of each price-break interval. Why?
0 1826 2500 4000 Order Quantity
Total annual costs
So the candidates for the price-breaks are 1826, 2500, and 4000 units
So the candidates for the price-breaks are 1826, 2500, and 4000 units
Because the total annual cost function is a “u” shaped function
Because the total annual cost function is a “u” shaped function

4. PPC & PERT/CPM
Price-Break Example Solution (Part 4)
iC 2
Q + S
Q
D + DC = TC iC
2
Q + S
Q
D + DC = TC
Next, we plug the true Qopt values into the total cost annual cost function to determine the total cost under each price-break
TC(0-2499)=(10000*1.20)+(10000/1826)*4+(1826/2)(0.02*1.20) = Rs12,043.82TC(2500-3999)= Rs10,041TC(4000&more)= Rs9,949.20
TC(0-2499)=(10000*1.20)+(10000/1826)*4+(1826/2)(0.02*1.20) = Rs12,043.82TC(2500-3999)= Rs10,041TC(4000&more)= Rs9,949.20
Finally, we select the least costly Qopt, which is this problem occurs in the 4000 & more interval. In summary, our optimal order quantity is 4000 units

4. PPC & PERT/CPM
Maximum Inventory Level, M
Miscellaneous Systems:Optional Replenishment System
MActual Inventory Level, I
q = M - I
I
Q = minimum acceptable order quantity
If q > Q, order q, otherwise do not order any.

4. PPC & PERT/CPM
Miscellaneous Systems:Bin Systems
Two-Bin System
Full Empty
Order One Bin ofInventory
One-Bin System
Periodic Check
Order Enough toRefill Bin

4. PPC & PERT/CPM
ABC Classification System
• Items kept in inventory are not of equal importance in terms of:
– Rupees invested
– profit potential
– sales or usage volume
– stock-out penalties
0
30
60
30
60
AB
C
% of Rs Value
% of Use
So, identify inventory items based on percentage of total dollar value, where “A” items are roughly top 15 %, “B” items as next 35 %, and the lower 65% are the “C” items
4. PPC & PERT/CPM
Inventory Accuracy and Cycle Counting
• Inventory accuracy refers to how well the inventory records agree with physical count
• Cycle Counting is a physical inventory-taking technique in which inventory is counted on a frequent basis rather than once or twice a year

4. PPC & PERT/CPM 112
Question Bowl
The average cost of inventory in the United States is which of the following?
a. 10 to 15 percent of its costb. 15 to 20 percent of its costc. 20 to 25 percent of its costd. 25 to 30 percent of its coste. 30 to 35 percent of its costAnswer: e. 30 to 35 percent of its cost
4. PPC & PERT/CPM 113
Question Bowl
Which of the following is a reason why firms
keep a supply of inventory?
a. To maintain independence of operations
b. To meet variation in product demand
c. To allow flexibility in production scheduling
d. To take advantage of economic purchase
order size
e. All of the aboveAnswer: e. All of the above (Also can include to provide a safeguard for variation in raw material delivery time.)

4. PPC & PERT/CPM 114
Question Bowl
An Inventory System should include policies
that are related to which of the following?
a. How large inventory purchase orders should be
b. Monitoring levels of inventory
c. Stating when stock should be replenished
d. All of the above
e. None of the above
Answer: d. All of the above
4. PPC & PERT/CPM 115
Question Bowl
Which of the following is an Inventory Cost item
that is related to the managerial and clerical
costs to prepare a purchase or production order?
a. Holding costs
b. Setup costs
c. Carrying costs
d. Shortage costs
e. None of the above
Answer: e. None of the above (Correct answer is Ordering Costs.)

4. PPC & PERT/CPM 116
Question Bowl
Which of the following is considered a
Independent Demand inventory item?
a. Bolts to a automobile manufacturer
b. Timber to a home builder
c. Windows to a home builder
d. Containers of milk to a grocery store
e. None of the aboveAnswer: d. Containers of milk to a grocery store

4. PPC & PERT/CPM 117
Question Bowl
If you are marketing a more expensive
independent demand inventory item, which
inventory model should you use?
a. Fixed-time period model
b. Fixed-order quantity model
c. Periodic system
d. Periodic review system
e. P-modelAnswer: b. Fixed-order quantity model
4. PPC & PERT/CPM 118
Question Bowl
If the annual demand for an inventory item is 5,000
units, the ordering costs are Rs100 per order, and
the cost of holding a unit is stock for a year is Rs10,
which of the following is approximately the Qopt?
a. 5,000 units
b. Rs5,000
c. 500 units
d. 316 units
e. None of the above
Answer: d. 316 units (Sqrt[(2x1000x100)/10=316.2277)

4. PPC & PERT/CPM 119
Question Bowl
The basic logic behind the ABC Classification
system for inventory management is which of the
following?
a. Two-bin logic
b. One-bin logic
c. Pareto principle
d. All of the above
e. None of the above
Answer: c. Pareto principle

4. PPC & PERT/CPM 120
Question Bowl
A physical inventory-taking technique in
which inventory is counted frequently
rather than once or twice a year is which of
the following?
a. Cycle counting
b. Mathematical programming
c. Pareto principle
d. ABC classification
e. Stockkeeping unit (SKU)Answer: a. Cycle counting

4. PPC & PERT/CPM 121
4d. Materials Requirements Planning ( a Part of MATERIALS PLANNING)
4. PPC & PERT/CPM
• Material Requirements Planning (MRP)
• MRP Logic and Product Structure Trees
• Time Fences
• MRP Example
• MRP II and Lot Sizing
OBJECTIVES

4. PPC & PERT/CPM
Material Requirements Planning
• Materials requirements planning (MRP) is a means for determining the number of parts, components, and materials needed to produce a product
• MRP provides time scheduling information specifying when each of the materials, parts, and components should be ordered or produced
• Dependent demand drives MRP
• MRP is a software system

4. PPC & PERT/CPM
Example of MRP Logic and Product Structure Tree
B(4)
E(1)D(2)
C(2)
F(2)D(3)
A
Product Structure Tree for Assembly A Lead TimesA 1 dayB 2 daysC 1 dayD 3 daysE 4 daysF 1 day
Total Unit DemandDay 10 50 ADay 8 20 B (Spares)Day 6 15 D (Spares)
Given the product structure tree for “A” and the lead time and demand information below, provide a materials requirements plan that defines the number of units of each component and when they will be needed
4. PPC & PERT/CPM
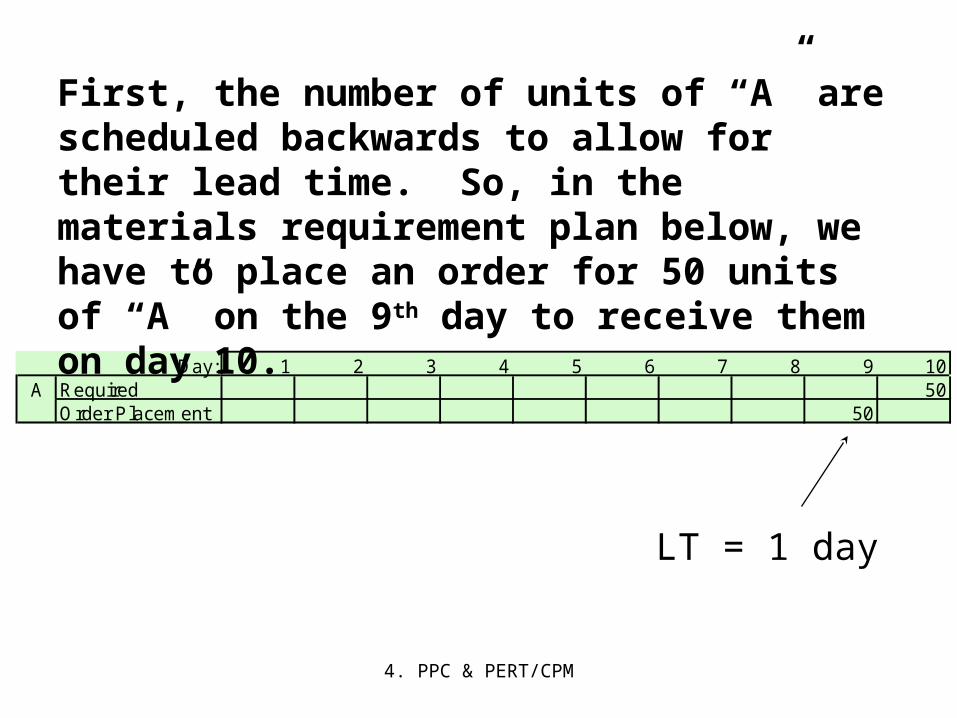
LT = 1 day
Day: 1 2 3 4 5 6 7 8 9 10A Required 50
Order Placement 50
First, the number of units of “A” are scheduled backwards to allow for their lead time. So, in the materials requirement plan below, we have to place an order for 50 units of “A” on the 9th day to receive them on day 10.
4. PPC & PERT/CPM
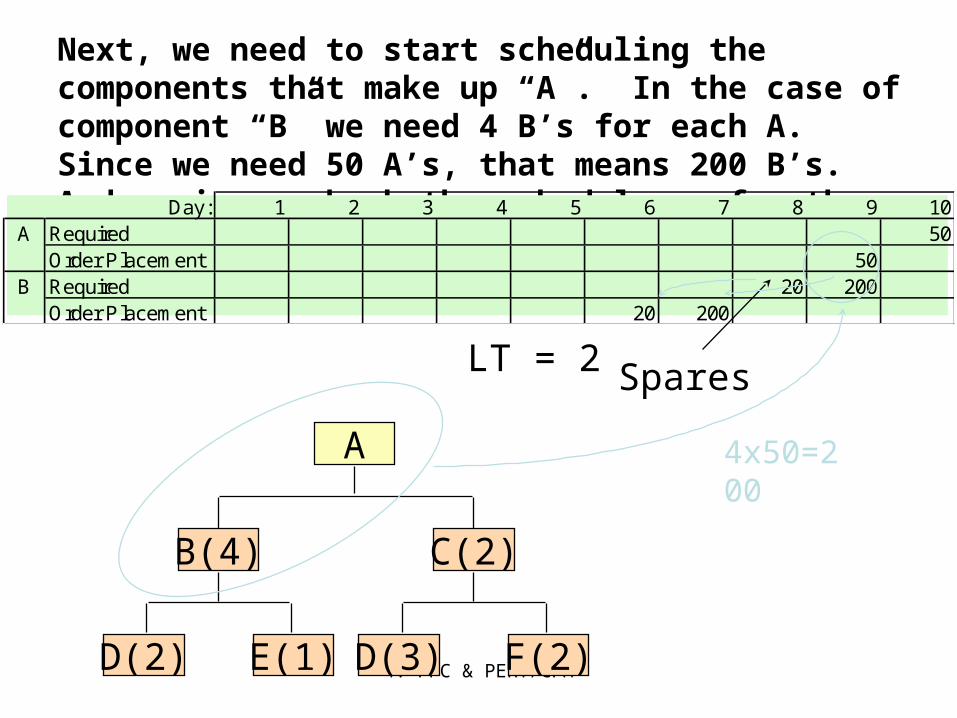
Next, we need to start scheduling the components that make up “A”. In the case of component “B” we need 4 B’s for each A. Since we need 50 A’s, that means 200 B’s. And again, we back the schedule up for the necessary 2 days of lead time.
Day: 1 2 3 4 5 6 7 8 9 10A Required 50
Order Placement 50B Required 20 200
Order Placement 20 200
B(4)
E(1)D(2)
C(2)
F(2)D(3)
A
SparesLT = 2
4x50=200

4. PPC & PERT/CPM
Day: 1 2 3 4 5 6 7 8 9 10A Required 50
LT=1 Order Placement 50B Required 20 200
LT=2 Order Placement 20 200C Required 100
LT=1 Order Placement 100D Required 55 400 300
LT=3 Order Placement 55 400 300E Required 20 200
LT=4 Order Placement 20 200F Required 200
LT=1 Order Placement 200
B(4)
E(1)D(2)
C(2)
F(2)D(3)
A
40 + 15 spares
Part D: Day 6
Finally, repeating the process for all components, we have the final materials requirements plan:
©The McGraw-Hill Companies, Inc., 2001
127
4. PPC & PERT/CPM
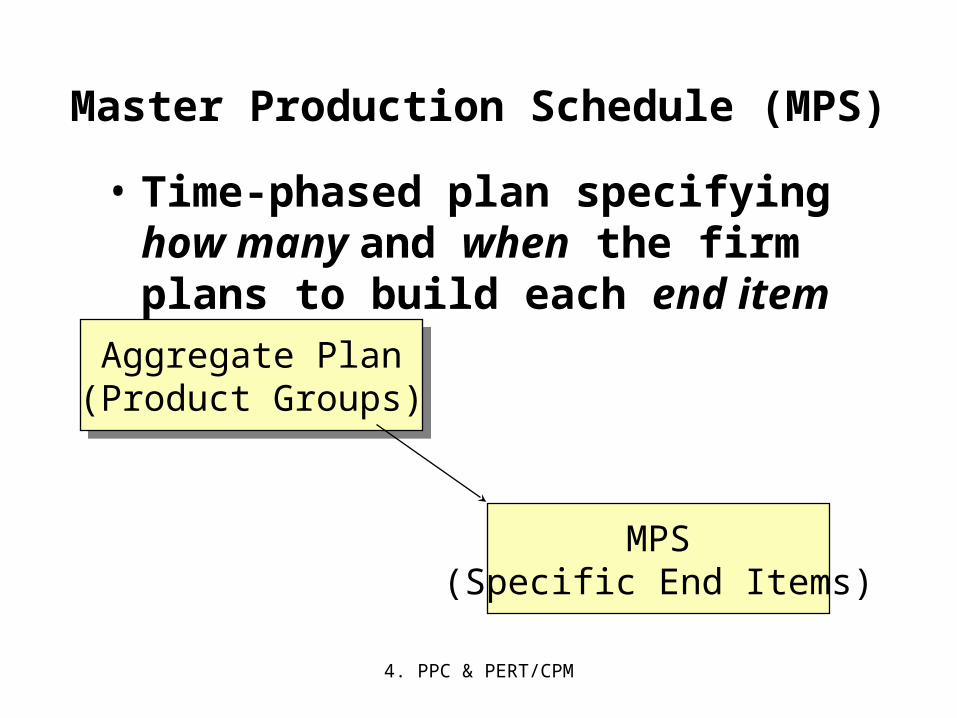
Master Production Schedule (MPS)
• Time-phased plan specifying how many and when the firm plans to build each end item
Aggregate Plan(Product Groups)
Aggregate Plan(Product Groups)
MPS(Specific End Items)

4. PPC & PERT/CPM
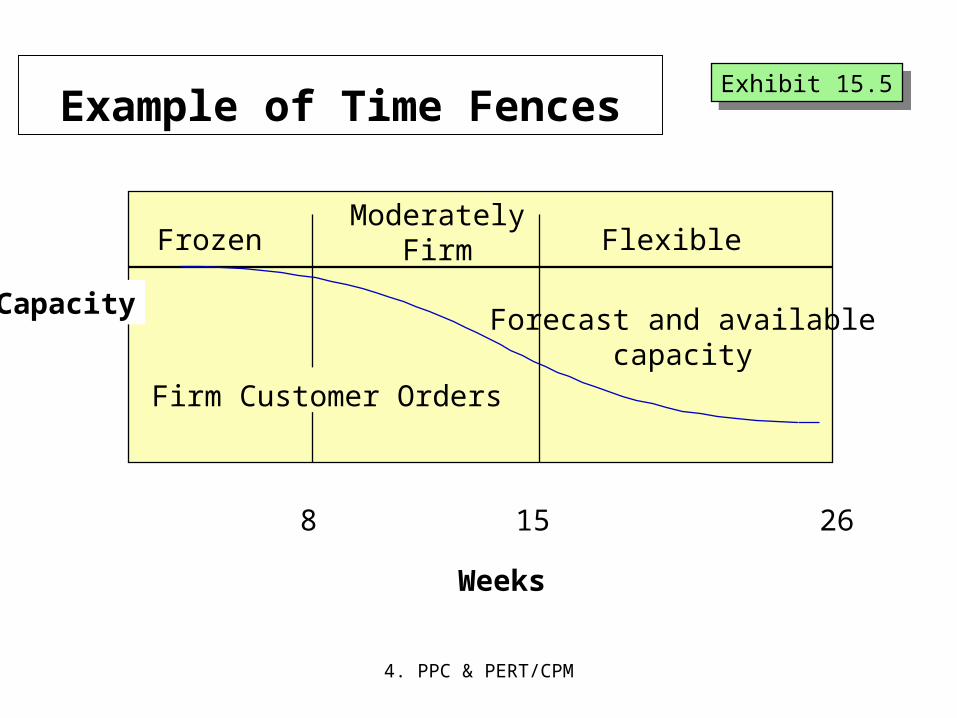
Types of Time Fences
• Frozen
– No schedule changes allowed within this
window
• Moderately Firm
– Specific changes allowed within product
groups as long as parts are available
• Flexible
– Significant variation allowed as long as overall
capacity requirements remain at the same
levels
4. PPC & PERT/CPM
Example of Time Fences
8 15 26
Weeks
FrozenModerately
Firm Flexible
Firm Customer Orders
Forecast and availablecapacity
Capacity
Exhibit 15.5Exhibit 15.5

4. PPC & PERT/CPM
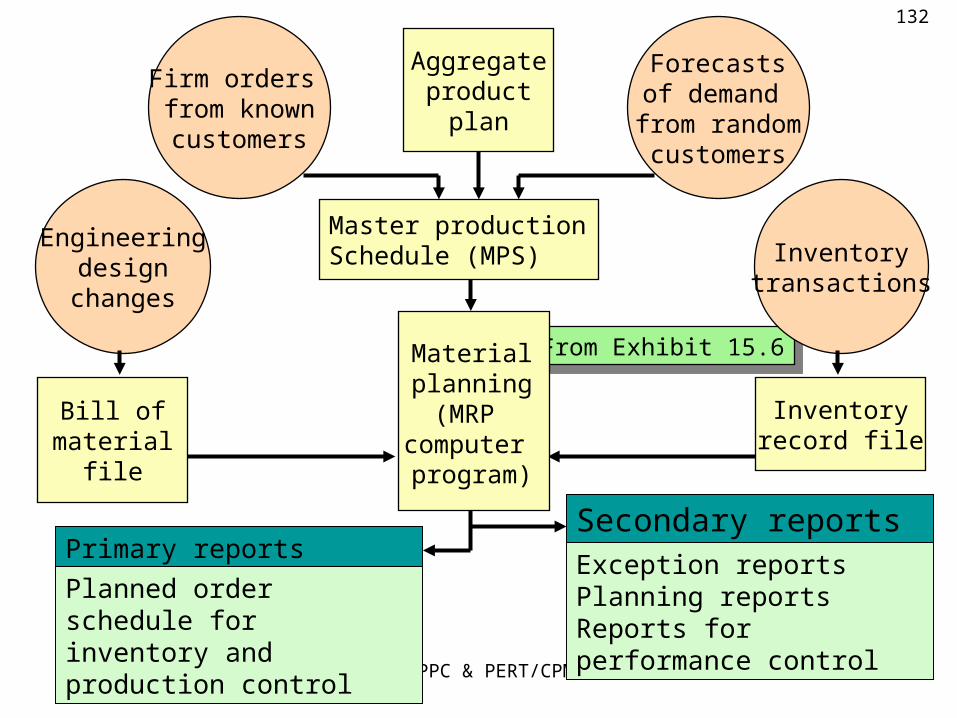
Material Requirements Planning System
• Based on a master production schedule, a material requirements planning system:
– Creates schedules identifying the specific parts and materials required to produce end items
– Determines exact unit numbers needed
– Determines the dates when orders for those materials should be released, based on lead times
4. PPC & PERT/CPM
From Exhibit 15.6From Exhibit 15.6
132
©The McGraw-Hill Companies, Inc., 2004
Firm orders from knowncustomers
Forecastsof demand
from randomcustomers
Aggregateproduct
plan
Bill ofmaterial
file
Engineeringdesign
changes
Inventoryrecord file
Inventorytransactions
Master productionSchedule (MPS)
Primary reportsSecondary reports
Planned order schedule for inventory and production control
Exception reportsPlanning reportsReports for performance control
Materialplanning(MRP
computer program)
4. PPC & PERT/CPM
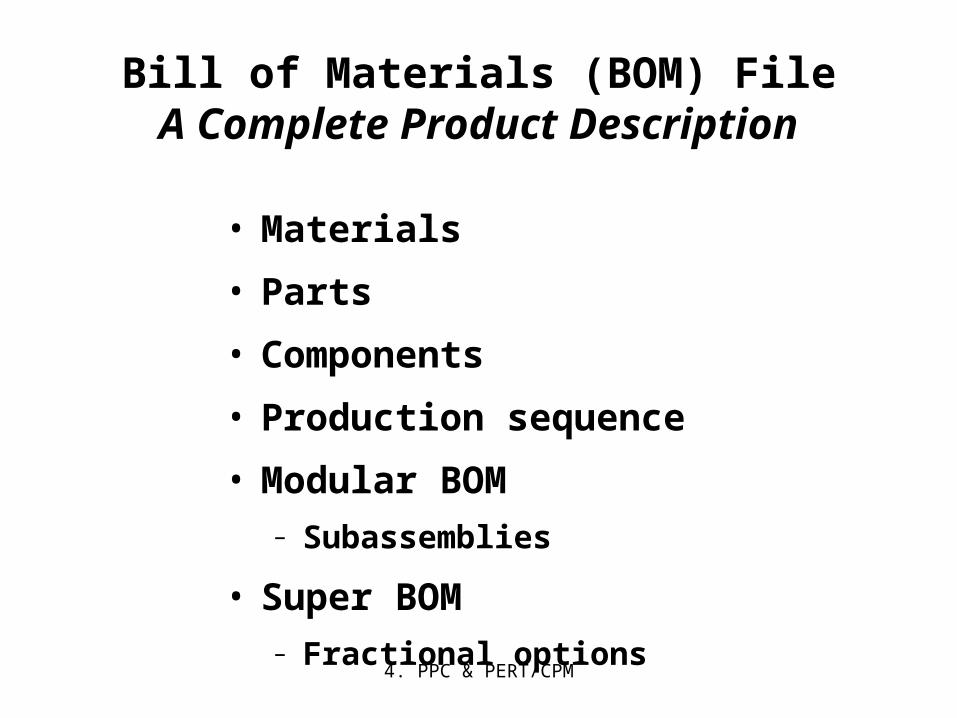
Bill of Materials (BOM) FileA Complete Product Description
• Materials
• Parts
• Components
• Production sequence
• Modular BOM – Subassemblies
• Super BOM– Fractional options
4. PPC & PERT/CPM
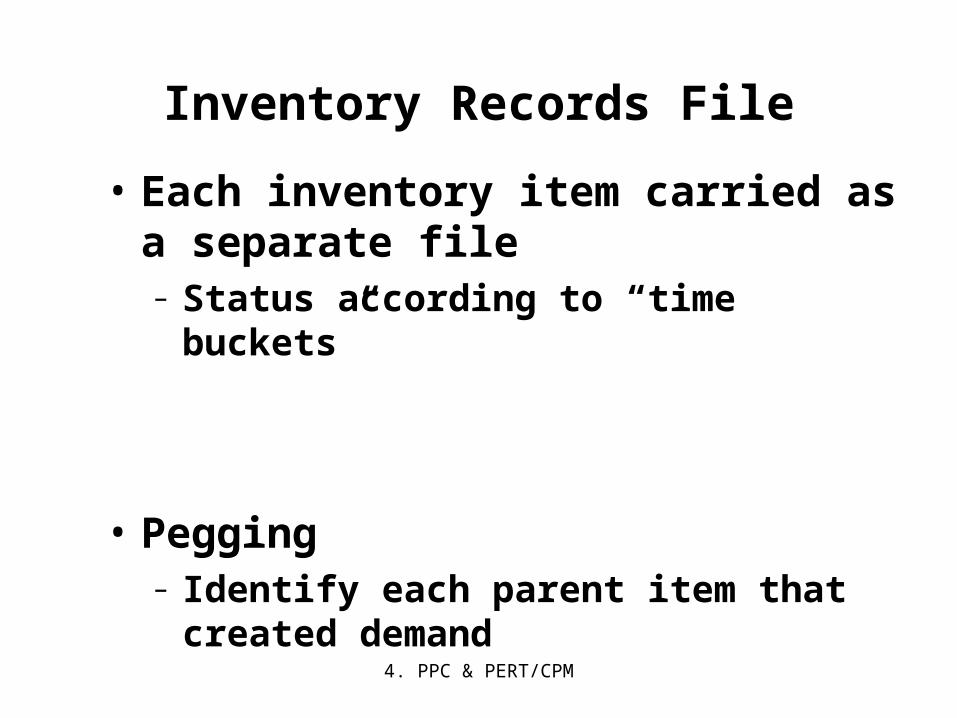
Inventory Records File
• Each inventory item carried as a separate file– Status according to “time buckets”
• Pegging– Identify each parent item that created
demand

4. PPC & PERT/CPM
Primary MRP Reports• Planned orders to be released at a future time• Order release notices to execute the planned
orders• Changes in due dates of open orders due to
rescheduling • Cancellations or suspensions of open orders
due to cancellation or suspension of orders on
the master production schedule
• Inventory status data
4. PPC & PERT/CPM
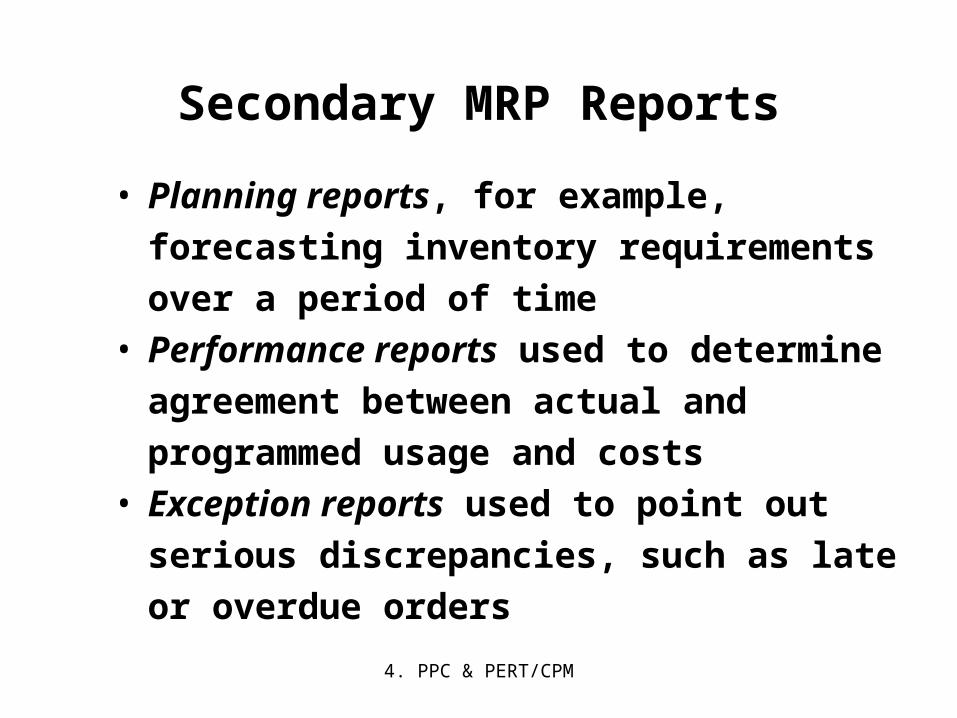
Secondary MRP Reports
• Planning reports, for example, forecasting
inventory requirements over a period of
time• Performance reports used to determine
agreement between actual and
programmed usage and costs• Exception reports used to point out
serious discrepancies, such as late or
overdue orders

4. PPC & PERT/CPM
Additional MRP Scheduling Terminology
• Gross Requirements
• Scheduled receipts
• Projected available balance
• Net requirements
• Planned order receipt
• Planned order release

4. PPC & PERT/CPM
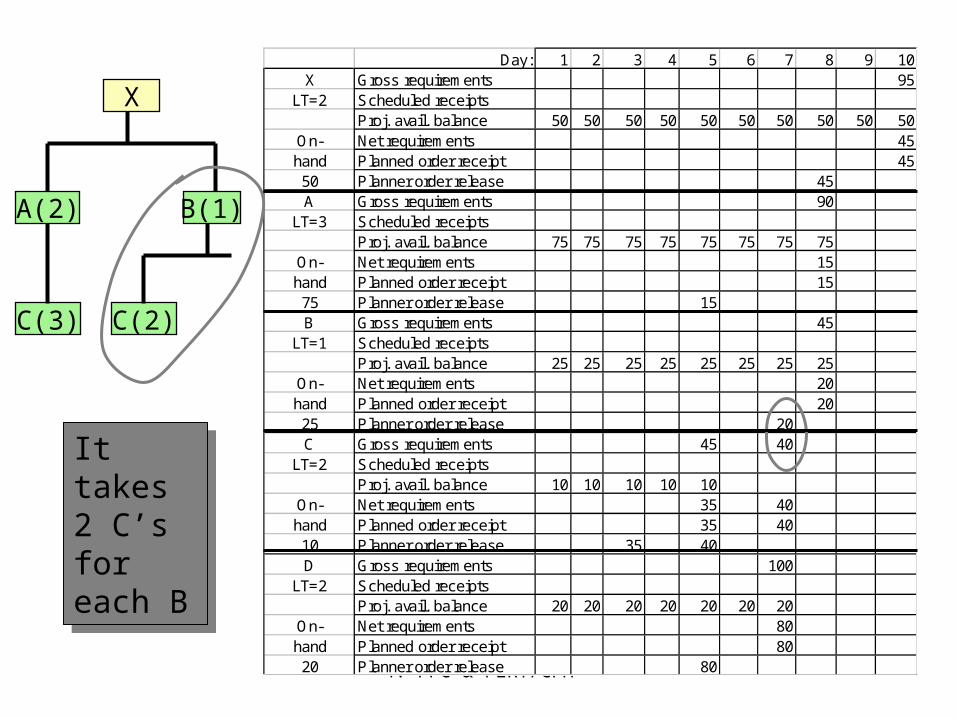
MRP Example
A(2) B(1)
D(5)C(2)
X
C(3)
Item On-Hand Lead Time (Weeks)X 50 2A 75 3B 25 1C 10 2D 20 2
Requirements include 95 units (80 firm orders and 15 forecast) of X in week 10
Requirements include 95 units (80 firm orders and 15 forecast) of X in week 10

4. PPC & PERT/CPM
A(2)
X
Day: 1 2 3 4 5 6 7 8 9 10X Gross requirements 95
LT=2 Scheduled receipts Proj. avail. balance 50 50 50 50 50 50 50 50 50 50
On- Net requirements 45hand Planned order receipt 4550 Planner order release 45A Gross requirements 90
LT=3 Scheduled receipts Proj. avail. balance 75 75 75 75 75 75 75 75
On- Net requirements 15 hand Planned order receipt 15 75 Planner order release 15 B Gross requirements 45
LT=1 Scheduled receipts Proj. avail. balance 25 25 25 25 25 25 25 25
On- Net requirements 20 hand Planned order receipt 20 25 Planner order release 20 C Gross requirements 45 40
LT=2 Scheduled receipts Proj. avail. balance 10 10 10 10 10
On- Net requirements 35 40 hand Planned order receipt 35 40 10 Planner order release 35 40 D Gross requirements 100
LT=2 Scheduled receipts Proj. avail. balance 20 20 20 20 20 20 20
On- Net requirements 80 hand Planned order receipt 80 20 Planner order release 80
It takes 2 A’s for each X
It takes 2 A’s for each X

4. PPC & PERT/CPM
Day: 1 2 3 4 5 6 7 8 9 10X Gross requirements 95
LT=2 Scheduled receipts Proj. avail. balance 50 50 50 50 50 50 50 50 50 50
On- Net requirements 45hand Planned order receipt 4550 Planner order release 45A Gross requirements 90
LT=3 Scheduled receipts Proj. avail. balance 75 75 75 75 75 75 75 75
On- Net requirements 15 hand Planned order receipt 15 75 Planner order release 15 B Gross requirements 45
LT=1 Scheduled receipts Proj. avail. balance 25 25 25 25 25 25 25 25
On- Net requirements 20 hand Planned order receipt 20 25 Planner order release 20 C Gross requirements 45 40
LT=2 Scheduled receipts Proj. avail. balance 10 10 10 10 10
On- Net requirements 35 40 hand Planned order receipt 35 40 10 Planner order release 35 40 D Gross requirements 100
LT=2 Scheduled receipts Proj. avail. balance 20 20 20 20 20 20 20
On- Net requirements 80 hand Planned order receipt 80 20 Planner order release 80
B(1)A(2)
X
It takes 1 B for each X
It takes 1 B for each X

4. PPC & PERT/CPM
A(2) B(1)
X
C(3)
Day: 1 2 3 4 5 6 7 8 9 10X Gross requirements 95
LT=2 Scheduled receipts Proj. avail. balance 50 50 50 50 50 50 50 50 50 50
On- Net requirements 45hand Planned order receipt 4550 Planner order release 45A Gross requirements 90
LT=3 Scheduled receipts Proj. avail. balance 75 75 75 75 75 75 75 75
On- Net requirements 15 hand Planned order receipt 15 75 Planner order release 15 B Gross requirements 45
LT=1 Scheduled receipts Proj. avail. balance 25 25 25 25 25 25 25 25
On- Net requirements 20 hand Planned order receipt 20 25 Planner order release 20 C Gross requirements 45 40
LT=2 Scheduled receipts Proj. avail. balance 10 10 10 10 10
On- Net requirements 35 40 hand Planned order receipt 35 40 10 Planner order release 35 40 D Gross requirements 100
LT=2 Scheduled receipts Proj. avail. balance 20 20 20 20 20 20 20
On- Net requirements 80 hand Planned order receipt 80 20 Planner order release 80
It takes 3 C’s for each A
It takes 3 C’s for each A
4. PPC & PERT/CPM
A(2) B(1)
C(2)
X
C(3)
Day: 1 2 3 4 5 6 7 8 9 10X Gross requirements 95
LT=2 Scheduled receipts Proj. avail. balance 50 50 50 50 50 50 50 50 50 50
On- Net requirements 45hand Planned order receipt 4550 Planner order release 45A Gross requirements 90
LT=3 Scheduled receipts Proj. avail. balance 75 75 75 75 75 75 75 75
On- Net requirements 15 hand Planned order receipt 15 75 Planner order release 15 B Gross requirements 45
LT=1 Scheduled receipts Proj. avail. balance 25 25 25 25 25 25 25 25
On- Net requirements 20 hand Planned order receipt 20 25 Planner order release 20 C Gross requirements 45 40
LT=2 Scheduled receipts Proj. avail. balance 10 10 10 10 10
On- Net requirements 35 40 hand Planned order receipt 35 40 10 Planner order release 35 40 D Gross requirements 100
LT=2 Scheduled receipts Proj. avail. balance 20 20 20 20 20 20 20
On- Net requirements 80 hand Planned order receipt 80 20 Planner order release 80
It takes 2 C’s for each B
It takes 2 C’s for each B

4. PPC & PERT/CPM
A(2) B(1)
D(5)C(2)
X
C(3)
Day: 1 2 3 4 5 6 7 8 9 10X Gross requirements 95
LT=2 Scheduled receipts Proj. avail. balance 50 50 50 50 50 50 50 50 50 50
On- Net requirements 45hand Planned order receipt 4550 Planner order release 45A Gross requirements 90
LT=3 Scheduled receipts Proj. avail. balance 75 75 75 75 75 75 75 75
On- Net requirements 15 hand Planned order receipt 15 75 Planner order release 15 B Gross requirements 45
LT=1 Scheduled receipts Proj. avail. balance 25 25 25 25 25 25 25 25
On- Net requirements 20 hand Planned order receipt 20 25 Planner order release 20 C Gross requirements 45 40
LT=2 Scheduled receipts Proj. avail. balance 10 10 10 10 10
On- Net requirements 35 40 hand Planned order receipt 35 40 10 Planner order release 35 40 D Gross requirements 100
LT=2 Scheduled receipts Proj. avail. balance 20 20 20 20 20 20 20
On- Net requirements 80 hand Planned order receipt 80 20 Planner order release 80
It takes 5 D’s for each B
It takes 5 D’s for each B

4. PPC & PERT/CPM
Closed Loop MRP
Production PlanningMaster Production SchedulingMaterial Requirements PlanningCapacity Requirements Planning
Realistic?No
Feedback
Execute:Capacity PlansMaterial Plans
Yes
Feedback
4. PPC & PERT/CPM
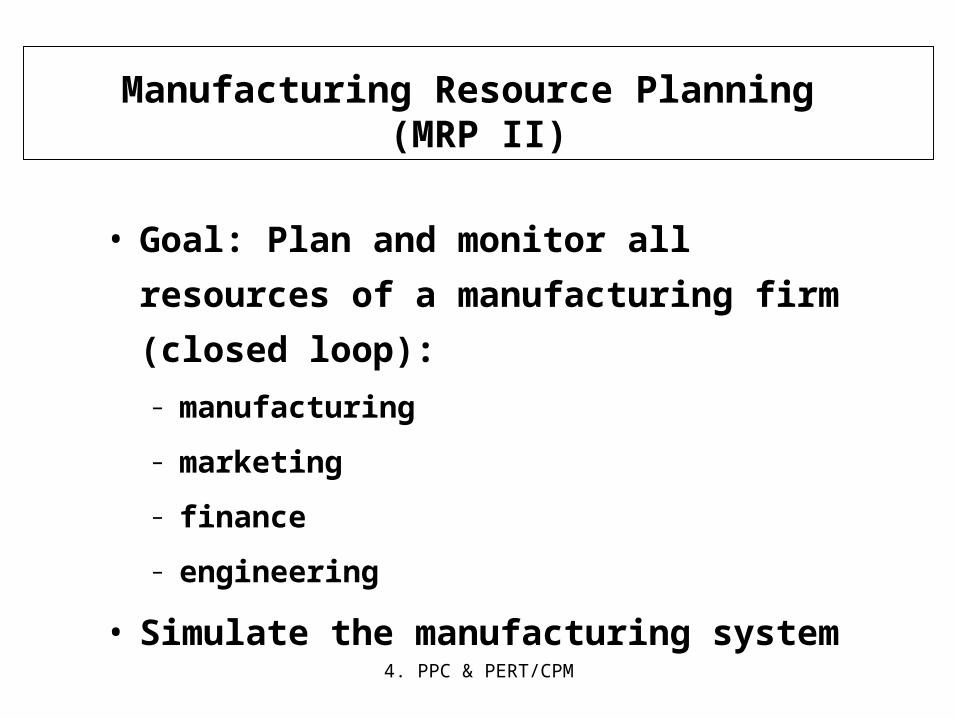
Manufacturing Resource Planning (MRP II)
• Goal: Plan and monitor all resources of
a manufacturing firm (closed loop):
– manufacturing
– marketing
– finance
– engineering
• Simulate the manufacturing system
4. PPC & PERT/CPM
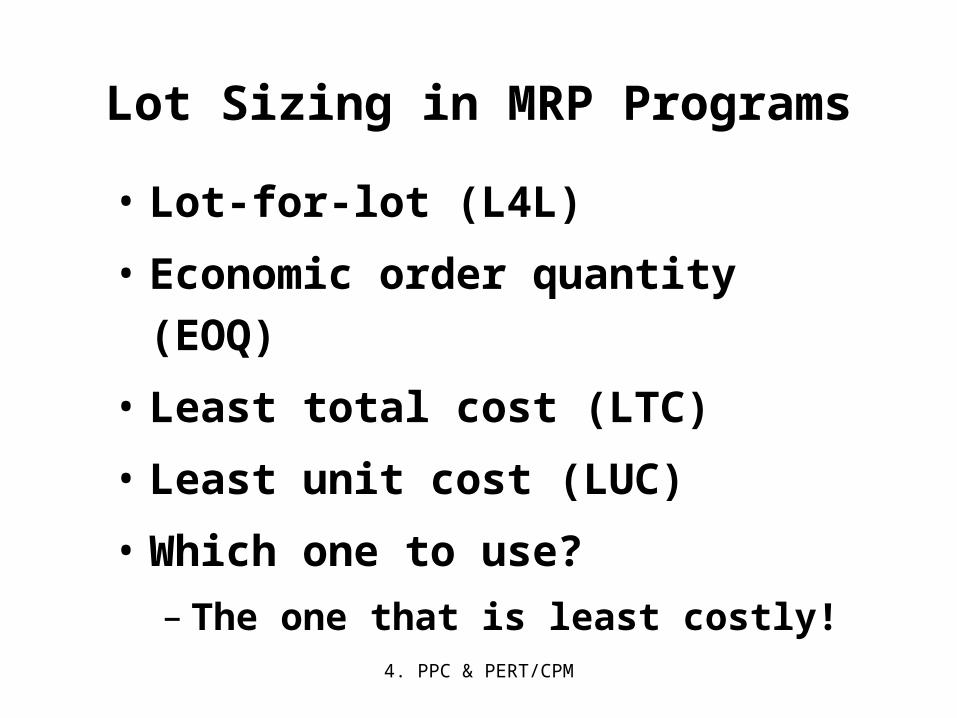
Lot Sizing in MRP Programs
• Lot-for-lot (L4L)
• Economic order quantity (EOQ)
• Least total cost (LTC)
• Least unit cost (LUC)
• Which one to use?
– The one that is least costly!
4. PPC & PERT/CPM 147
Question Bowl
Which type of industry has only “medium”
expected benefits from the use of MRP?
a. Assemble-to-stock
b. Fabricate-to-stock
c. Assemble-to-order
d. Fabricate-to-order
e. Process
Answer: e. Process
4. PPC & PERT/CPM 148
Question Bowl
To ensure good master scheduling, a master
scheduler must do which of the following?
a. Never lose sight of the aggregate plan
b. Identify and communicate all problems
c. Be involved with customer order promising
d. Be visible to all levels of management
e. All of the aboveAnswer: e. All of the above (Correct answer can also include objectively trade off manufacturing, marketing, and engineering conflicts and include all demands from product sales, warehouse replenishment, spares, and interplant requirements.)
4. PPC & PERT/CPM 149
Question Bowl
The purpose of a “time fence” is which of the
following?
a. Make sure the cows don’t get out of the barn
b. Control flow through the production system
c. Maximize sales to retailers
d. All of the above
e. None of the above
Answer: b. Control flow through the production system

4. PPC & PERT/CPM 150
Question Bowl
Which of the following is an objective under an
MRP system?
a. To improve customer service
b. Minimize inventory investment
c. Maximize production operating efficiency
d. All of the above
e. None of the aboveAnswer: d. All of the above
4. PPC & PERT/CPM 151
Question Bowl
Which of the following is one of the three
main inputs into an MRP system?
a. BOM file
b. Exception report
c. Planning report
d. All of the above
e. None of the above
Answer: a. BOM file (Correct answer can also include Master Schedule and Inventory Records File.)
4. PPC & PERT/CPM 152
Question Bowl
An MRP program accesses the status of a job
according to specific time periods called which
of the following?
a. Peg record
b. Time fence
c. Time bucket
d. Time clock
e. None of the above
Answer: c. Time bucket
4. PPC & PERT/CPM 153
Question Bowl
In MRP, workload per work center can be determined. When the work capacity is exceeded, which of the following options can be implemented to correct the imbalance of workload?
a. Work overtimeb. Renegotiate the due date and reschedulec. Subcontract to an outside shopd. All of the abovee. None of the above
Answer: d. All of the above (Correct answer can also include selecting an alternative work center and rescheduling the work at a different time.)
4. PPC & PERT/CPM 154
Question Bowl
Which of the following are reasons why a Lot-For-
Lot (L4L) method of lot sizing can be used in an
MRP application?
a. Minimizes carrying costs
b. Sets planned orders to exactly match the net
requirements
c. Produces exactly what is needed
d. Does not carry any units over into future periods
e. All of the above
Answer: e. All of the above
4. PPC & PERT/CPM 155
4e. Process Planning & Analysis

4. PPC & PERT/CPM
• Process Analysis
• Process Flowcharting
• Types of Processes
• Process Performance Metrics
OBJECTIVES
4. PPC & PERT/CPM 157
Process Planning – as defined by L C Jhamb
• Process planning is the establishment of shortest (normally time) & most economical (cost) path for a manufactured item, from the start (say a raw material) up to being a finished good. – Process planning indicates operations to be performed & their
sequence;– Specifies the machines / equipment required– The tooling required (e.g. jigs, fixtures, …) for each operation; – Provides data (e.g. speeds, feeds; – Indicates processing times (such as set-up time, operations
time;– Specifies the skill requirements for each operation
• Documents that incorporate such information are:– Process Sheets or Route Sheets– Service Blue-prints
4. PPC & PERT/CPM
Process Analysis Terms
• Process: Is any part of an organization that takes inputs and transforms them into outputs
• Cycle Time: Is the average successive time between completions of successive units
• Utilization: Is the ratio of the time that a resource is actually activated relative to the time that it is available for use
4. PPC & PERT/CPM
Process Flowcharting Defined
• Process flowcharting is the use of a diagram to present the major elements of a process
• The basic elements can include tasks or operations, flows of materials or customers, decision points, and storage areas or queues
• It is an ideal methodology by which to begin analyzing a process

4. PPC & PERT/CPM
Flowchart Symbols
Tasks or operations Examples: Giving an admission ticket to a customer, installing a engine in a car, etc.
Examples: Giving an admission ticket to a customer, installing a engine in a car, etc.
Decision Points Examples: How much change should be given to a customer, which wrench should be used, etc.
Examples: How much change should be given to a customer, which wrench should be used, etc.
Purpose and Examples

4. PPC & PERT/CPM
Examples: Sheds, lines of people waiting for a service, etc.
Examples: Sheds, lines of people waiting for a service, etc.
Examples: Customers moving to a seat, mechanic getting a tool, etc.
Examples: Customers moving to a seat, mechanic getting a tool, etc.
Storage areas or queues
Flows of materials or customers
Purpose and Examples Flowchart Symbols

4. PPC & PERT/CPM
Example: Flowchart of Student Going
to School
Yes
No
Goof off
Go to school today?
Walk to class
Drive to school
4. PPC & PERT/CPM
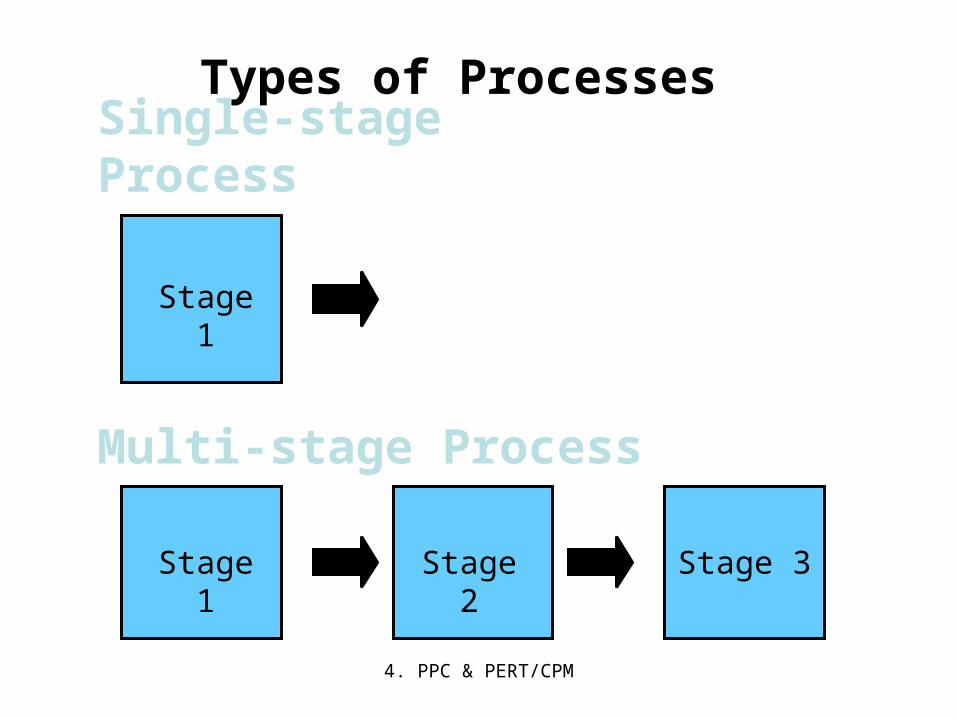
Types of Processes
Single-stage Process
Stage 1
Stage 1 Stage 2 Stage 3
Multi-stage Process

4. PPC & PERT/CPM
Types of Processes (Continued)
Stage 1 Stage 2
Buffer
Multi-stage Process with Buffer
A buffer refers to a storage area between stages where the output of a stage is placed prior to being used in a downstream stage
4. PPC & PERT/CPM
Other Process Terminology
• Blocking– Occurs when the activities in a stage must stop
because there is no place to deposit the item just completed
– If there is no room for an employee to place a unit of work down, the employee will hold on to it not able to continue working on the next unit
• Starving– Occurs when the activities in a stage must stop
because there is no work – If an employee is waiting at a work station and no
work is coming to the employee to process, the employee will remain idle until the next unit of work comes
4. PPC & PERT/CPM
Other Process Terminology (Continued)
• Bottleneck– Occurs when the limited capacity of a process
causes work to pile up or become unevenly distributed in the flow of a process
– If an employee works too slow in a multi-stage process, work will begin to pile up in front of that employee. In this is case the employee represents the limited capacity causing the bottleneck.
• Pacing– Refers to the fixed timing of the movement of
items through the process

4. PPC & PERT/CPM
Other Types of Processes
• Make-to-order
– Only activated in response to an actual order
– Both work-in-process and finished goods
inventory kept to a minimum
• Make-to-stock
– Process activated to meet expected or
forecast demand
– Customer orders are served from target
stocking level

4. PPC & PERT/CPM
Process Performance Metrics
• Operation time = Setup time + Run time
• Throughput time = Average time for a unit tomove through the
system
• Velocity = Throughput time
Value-added time

4. PPC & PERT/CPM
Process Performance Metrics (Continued)
• Cycle time = Average time betweencompletion of units
• Throughput rate = 1 . Cycle time
• Efficiency = Actual output Standard Output

4. PPC & PERT/CPM
Process Performance Metrics (Continued)
• Productivity = Output
Input
• Utilization = Time Activated
Time Available

4. PPC & PERT/CPM
Cycle Time Example
Suppose you had to produce 600 units in 80 hours to meet the demand requirements of a product. What is the cycle time to meet this demand requirement?
Suppose you had to produce 600 units in 80 hours to meet the demand requirements of a product. What is the cycle time to meet this demand requirement?
Answer: There are 4,800 minutes (60 minutes/hour x 80 hours) in 80 hours. So the average time between completions would have to be: Cycle time = 4,800/600 units = 8 minutes.
Answer: There are 4,800 minutes (60 minutes/hour x 80 hours) in 80 hours. So the average time between completions would have to be: Cycle time = 4,800/600 units = 8 minutes.

4. PPC & PERT/CPM
Process Throughput Time Reduction
• Perform activities in parallel
• Change the sequence of activities
• Reduce interruptions
4. PPC & PERT/CPM 173
Question Bowl
Which of the following are possible examples of “cycle times”?
a. Time for each television to come off an assembly line.
b. Time it takes for a stock purchasec. Time it takes for an instructor to grade
an examd. Time it takes to build an automobilee. All of the above
Answer: e. All of the above
4. PPC & PERT/CPM 174
Question Bowl
Which of the following are used as symbols in a Process Flowchart?
a. Decision pointsb. Blockingc. Starvingd. Bottlenecke. All of the above
Answer: a. Decision points (A diamond shaped symbol.)

4. PPC & PERT/CPM 175
Question BowlWhich type of process is configured as
follows?
a. Single-stage processb. Multi-stage processc. Make-to-order processd. Make-to-stock processe. All of the above
Answer: b. Multi-stage process
1 2 3

4. PPC & PERT/CPM 176
Question Bowl
When an assembly line employee is waiting
for a unit of work to come down the line so
they can stop being idle and get back to
work, it is an example of which of the
following process terms?
a. Buffering
b. Blocking
c. Starving
d. Bottleneck
e. All of the above
Answer: c. Starving

4. PPC & PERT/CPM 177
Question Bowl
When a company waits until they have an order for their product in hand before beginning any production for that order, we can characterize their operation as which of the following processes?
a. Single-stage processb. Multi-stage processc. Make-to-order processd. Make-to-stock processe. All of the above
Answer: c. Make-to-order process

4. PPC & PERT/CPM 178
Question Bowl
If the Run Time for a batch of parts is 45 minutes on a machine, and the Setup Time is 65 minutes, which of the following is the Operation Time?
a. 75 minutesb. 110 minutesc. Only 45 minutesd. 65/45 minutes or 1.44 hourse. Can not be computed on the data above
Answer: b. 110 minutes ( Operation Time is the sum of Run Time and Setup Time, or 65 + 45 = 110 minutes)

4. PPC & PERT/CPM 179
Question Bowl
If the standard expected phone calls for a
telephone marketers is 24 per hour, and one
telephone marketer did 27 per hour, which of
the following can be used to describe their
Efficiency?
a. 88.8%
b. 100%
c. 112.5%
d. Well over 150%
e. Can not computed on the information given.
Answer: c. 112.5% (Ratio of actual performance/expected performance, or (27/24) x 100 = 110 minutes)

4. PPC & PERT/CPM 180
4e contd. Service Process Selection and Design

4. PPC & PERT/CPM
• The Nature of Services
• Service Strategy: Focus & Advantage
• Service-System Design Matrix
• Service Blueprinting
• Service Fail-safing
• Characteristics of a Well-Designed Service Delivery System
OBJECTIVES

4. PPC & PERT/CPM
The Nature of Services1. Everyone is an expert on services
2. Services are idiosyncratic
3. Quality of work is not quality of service
4. Most services contain a mix of tangible and intangible attributes

4. PPC & PERT/CPM
Service Generalizations (Continued)
5. High-contact services are experienced,
whereas goods are consumed
6. Effective management of services requires an
understanding of marketing and personnel,
as well as operations
7. Services often take the form of cycles of
encounters involving face-to-face, phone,
Internet, electromechanical, and/or mail
interactions

4. PPC & PERT/CPM
Service Businesses
• Facilities-based services: Where the customer must go to the service facility
• Field-based services: Where the production and consumption of the service takes place in the customer’s environment
A service business is the management of organizations whose primary business requires interaction with the customer to produce the service

4. PPC & PERT/CPM
Internal ServicesDefined
Internal Supplier
Internal Supplier
InternalCustomer
ExternalCustomer
Internal services is the management of services required to support the activities of the larger organization. Services including data processing, accounting, etc

4. PPC & PERT/CPM
The Customer Centered ViewExhibit 7.1Exhibit 7.1
TheCustomer
The ServiceStrategy
ThePeople
TheSystems
A philosophical view that suggests the organization exists to serve the customer, and the systems and the employees exist to facilitate the process of service.
A philosophical view that suggests the organization exists to serve the customer, and the systems and the employees exist to facilitate the process of service.
4. PPC & PERT/CPM
Service Strategy: Focus and AdvantagePerformance Priorities
• Treatment of the customer
• Speed and convenience of service delivery
• Price
• Variety
• Quality of the tangible goods
• Unique skills that constitute the service offering
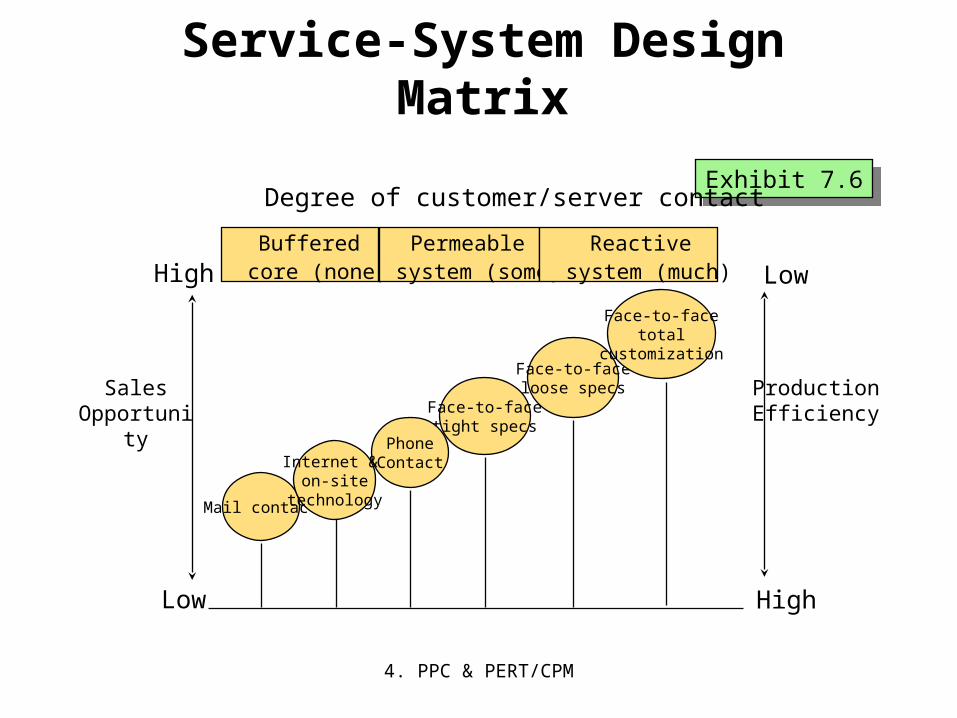
4. PPC & PERT/CPM
Service-System Design Matrix
Exhibit 7.6Exhibit 7.6
Mail contact
Face-to-faceloose specs
Face-to-facetight specs
PhoneContact
Face-to-facetotal
customization
Buffered core (none)
Permeable system (some)
Reactivesystem (much)
High
LowHigh
Low
Degree of customer/server contact
Internet & on-site
technology
SalesOpportunity
ProductionEfficiency

4. PPC & PERT/CPM
Example of Service Blueprinting
Brushshoes
Applypolish
Failpoint
BuffCollect
payment
Cleanshoes Materials
(e.g., polish, cloth)
Select andpurchasesupplies
Standardexecution time
2 minutes
Total acceptableexecution time
5 minutes
30secs
30secs
45secs
15secs
Wrongcolor wax
Seen bycustomer 45
secs
Line ofvisibility
Not seen bycustomer butnecessary toperformance

4. PPC & PERT/CPM
Service Fail-safingPoka-Yokes (A Proactive Approach)
• Keeping a mistake from becoming a service defect
• How can we fail-safe the three Ts?
Task
TangiblesTreatment

4. PPC & PERT/CPM
Have we compromised
one of the 3 Ts?
1. Task
2. Treatment
3. Tangible
1. Task
2. Treatment
3. Tangible
4. PPC & PERT/CPM
Three Contrasting Service Designs
• The production line approach (ex. McDonald’s)
• The self-service approach (ex. automatic teller machines)
• The personal attention approach (ex. Ritz-Carlton Hotel Company)
4. PPC & PERT/CPM
Characteristics of a Well-Designed Service System
1. Each element of the service system is consistent
with the operating focus of the firm
2. It is user-friendly
3. It is robust
4. It is structured so that consistent performance by
its people and systems is easily maintained

4. PPC & PERT/CPM
Characteristics of a Well-Designed Service System (Continued)
5. It provides effective links between the back office and the front office so that nothing falls between the cracks
6. It manages the evidence of service quality in such a way that customers see the value of the service provided
7. It is cost-effective

4. PPC & PERT/CPM
Applying Behavioral Science to Service Encounters
1. The front-end and back-end of the encounter are not created equal
2. Segment the pleasure, combine the pain
3. Let the customer control the process
4. Pay attention to norms and rituals
5. People are easier to blame than systems
6. Let the punishment fit the crime in service recovery

4. PPC & PERT/CPM 196
Service Guarantees as Design Drivers
• Recent research suggests:– Any guarantee is better than no guarantee– Involve the customer as well as employees
in the design– Avoid complexity or legalistic language– Do not quibble or wriggle when a customer
invokes a guarantee– Make it clear that you are happy for
customers to invoke the guarantee

4. PPC & PERT/CPM 197
Question Bowl
Which of the following are generalizations about the nature of services?
a. Services contain tangible attributesb. Services are experiencedc. Services often take the form of cycles of
encounters involving face-to-face interactions
d. All of the abovee. None of the above
Answer: d. All of the above

4. PPC & PERT/CPM 198
Question Bowl
Which of the following is an example
of a Service Business?
a. Law firm
b. Hospital
c. Bank
d. Retail store
e. All of the aboveAnswer: e. All of the above
4. PPC & PERT/CPM 199
Question Bowl
Which of the following is an example of
Internal Services?
a. Finance department
b. Marketing department
c. Operations department
d. All of the above
e. None of the aboveAnswer: d. All of the above
4. PPC & PERT/CPM 200
Question Bowl
According to the Chase and Dasu (2001) study
which of the following are behavioral concepts
that should be applied to enhance customer
perceptions of a service encounter?
a. Flow of the service experience
b. Flow of time
c. Judging encounter performance
d. All of the above
e. None of the aboveAnswer: d. All of the above
4. PPC & PERT/CPM 201
Question Bowl
Service strategy development begins by selecting
which of the following as an operating focus or
performance priority?
a. Price
b. Quality
c. Variety
d. Treatment
e. All of the above
Answer: e. All of the above
4. PPC & PERT/CPM 202
Question Bowl
Which of the following “best practices emphasized
by service executives” had the highest mean
emphasize rating?
a. Leadership
b. Accessibility
c. Quality values
d. Customer orientation
e. Listening to the customerAnswer: b. Accessibility (Had the highest mean rating at 4.02 on a 5 point scale.)
4. PPC & PERT/CPM 203
Question Bowl
Based on the Service-System Design Matrix,
which of the following has a lower level of
“production efficiency”?
a. Face-to-face loose specs
b. Phone contact
c. Internet and on-site technology
d. Face-to-face tight specs
e. Mail contactAnswer: a. Face-to-face loose specs
4. PPC & PERT/CPM 204
4f. Operations Scheduling
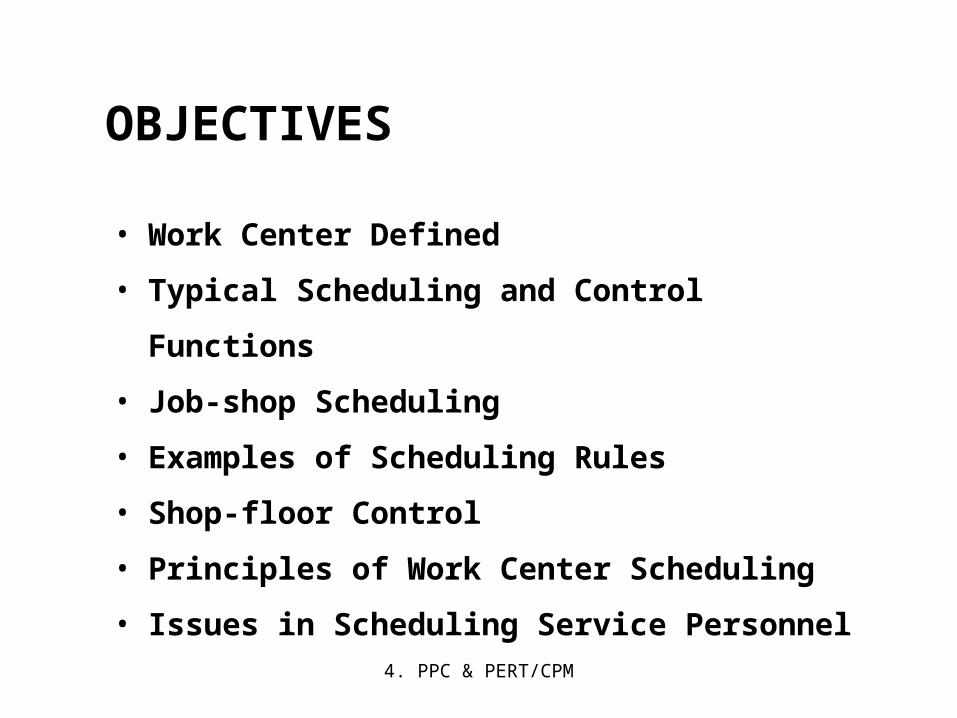
4. PPC & PERT/CPM
• Work Center Defined
• Typical Scheduling and Control Functions
• Job-shop Scheduling
• Examples of Scheduling Rules
• Shop-floor Control
• Principles of Work Center Scheduling
• Issues in Scheduling Service Personnel
OBJECTIVES

4. PPC & PERT/CPM
Work Center
• A work center is an area in a business in which productive resources are organized and work is completed
• Can be a single machine, a group of machines, or an area where a particular type of work is done
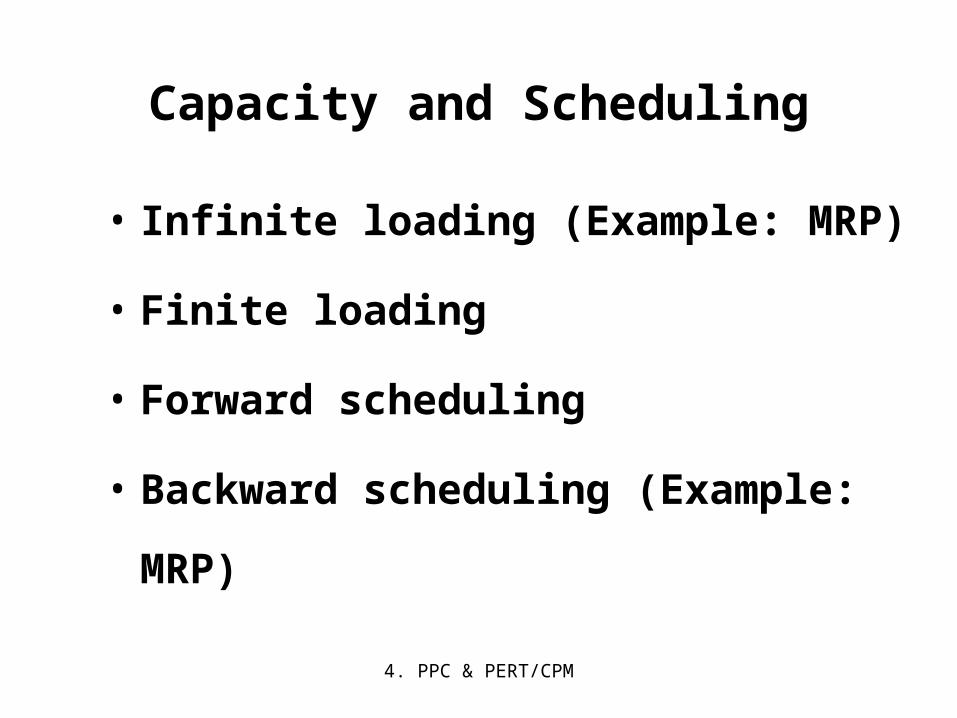
4. PPC & PERT/CPM
Capacity and Scheduling
• Infinite loading (Example: MRP)
• Finite loading
• Forward scheduling
• Backward scheduling (Example: MRP)

4. PPC & PERT/CPM
Types of Manufacturing Scheduling Processes and Scheduling Approaches
Continuous process
Type of Process Typical Scheduling Approach
High-volume manufacturing
Med-volume manufacturing
Low-volume manufacturing
Finite forward of process, machine limited
Finite forward of line, machined limited
Infinite forward of process, labor and machined limited
Infinite forward of jobs, labor and some machine limited

4. PPC & PERT/CPM
Typical Scheduling and Control Functions
• Allocating orders, equipment, and
personnel
• Determining the sequence of order
performance
• Initiating performance of the
scheduled work
• Shop-floor control

4. PPC & PERT/CPM
Work-Center Scheduling Objectives
• Meet due dates
• Minimize lead time
• Minimize setup time or cost
• Minimize work-in-process inventory
• Maximize machine utilization

4. PPC & PERT/CPM
Priority Rules for Job Sequencing
1. First-come, first-served (FCFS)
2. Shortest operating time (SOT)
3. Earliest due date first (DDate)
4. Slack time remaining (STR) first
5. Slack time remaining per operation (STR/OP)

4. PPC & PERT/CPM
Priority Rules for Job Sequencing (Continued)
6. Critical ratio (CR)
7. Last come, first served (LCFS)
8. Random order or whim
remaining days of Number
date) Current-date (DueCR
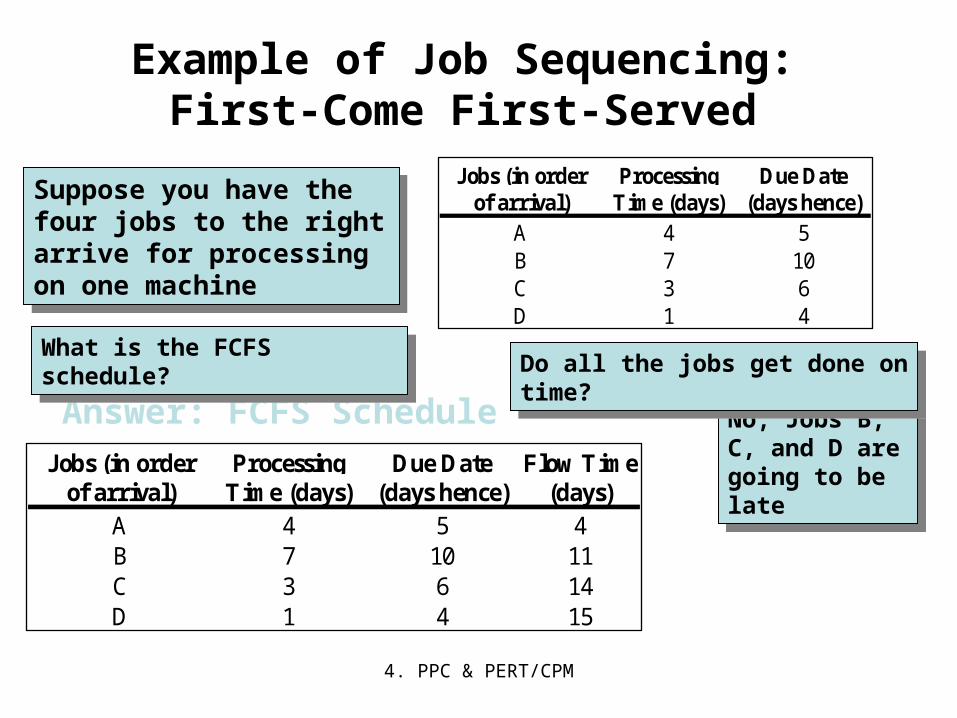
4. PPC & PERT/CPM
Example of Job Sequencing: First-Come First-Served
Jobs (in order Processing Due Date Flow Timeof arrival) Time (days) (days hence) (days)
A 4 5 4B 7 10 11C 3 6 14D 1 4 15
Answer: FCFS Schedule
Jobs (in order Processing Due Dateof arrival) Time (days) (days hence)
A 4 5B 7 10C 3 6D 1 4
Suppose you have the four jobs to the right arrive for processing on one machine
Suppose you have the four jobs to the right arrive for processing on one machine
What is the FCFS schedule?What is the FCFS schedule?
No, Jobs B, C, and D are going to be late
No, Jobs B, C, and D are going to be late
Do all the jobs get done on time?Do all the jobs get done on time?

4. PPC & PERT/CPM
Example of Job Sequencing: Shortest Operating Time
Jobs (in order Processing Due Dateof arrival) Time (days) (days hence)
A 4 5B 7 10C 3 6D 1 4
Answer: Shortest Operating Time Schedule
Jobs (in order Processing Due Date Flow Timeof arrival) Time (days) (days hence) (days)
D 1 4 1C 3 6 4A 4 5 8B 7 10 15
Suppose you have the four jobs to the right arrive for processing on one machine
Suppose you have the four jobs to the right arrive for processing on one machine
What is the SOT schedule?What is the SOT schedule?
No, Jobs A and B are going to be late
No, Jobs A and B are going to be late
Do all the jobs get done on time?Do all the jobs get done on time?

4. PPC & PERT/CPM
Example of Job Sequencing: Earliest Due Date First
Jobs (in order Processing Due Dateof arrival) Time (days) (days hence)
A 4 5B 7 10C 3 6D 1 4
Answer: Earliest Due Date First
Jobs (in order Processing Due Date Flow Timeof arrival) Time (days) (days hence) (days)
D 1 4 1A 4 5 5C 3 6 8B 7 10 15
Suppose you have the four jobs to the right arrive for processing on one machine
Suppose you have the four jobs to the right arrive for processing on one machine
What is the earliest due date first schedule?
What is the earliest due date first schedule?
No, Jobs C and B are going to be late
No, Jobs C and B are going to be late
Do all the jobs get done on time?Do all the jobs get done on time?

4. PPC & PERT/CPM
Example of Job Sequencing: Critical Ratio Method
Jobs (in order Processing Due Dateof arrival) Time (days) (days hence)
A 4 5B 7 10C 3 6D 1 4
Suppose you have the four jobs to the right arrive for processing on one machine
Suppose you have the four jobs to the right arrive for processing on one machine
What is the CR schedule?What is the CR schedule?
No, but since there is three-way tie, only the first job or two will be on time
No, but since there is three-way tie, only the first job or two will be on time
In order to do this schedule the CR’s have be calculated for each job. If we let today be Day 1 and allow a total of 15 days to do the work. The resulting CR’s and order schedule are:CR(A)=(5-4)/15=0.06 (Do this job last)CR(B)=(10-7)/15=0.20 (Do this job first, tied with C and D)CR(C)=(6-3)/15=0.20 (Do this job first, tied with B and D)CR(D)=(4-1)/15=0.20 (Do this job first, tied with B and C)
Do all the jobs get done on time?Do all the jobs get done on time?

4. PPC & PERT/CPM
Example of Job Sequencing:Last-Come First-Served
Jobs (in order Processing Due Dateof arrival) Time (days) (days hence)
A 4 5B 7 10C 3 6D 1 4
Answer: Last-Come First-Served ScheduleJobs (in order Processing Due Date Flow Time
of arrival) Time (days) (days hence) (days)D 1 4 1C 3 6 4B 7 10 11A 4 5 15
No, Jobs B and A are going to be late
No, Jobs B and A are going to be late
Suppose you have the four jobs to the right arrive for processing on one machine
Suppose you have the four jobs to the right arrive for processing on one machine
What is the LCFS schedule?What is the LCFS schedule?Do all the jobs get done on time?Do all the jobs get done on time?

4. PPC & PERT/CPM
Example of Job Sequencing: Johnson’s Rule (Part 1)
Suppose you have the following five jobs with time requirements in two stages of production. What is the job sequence using Johnson’s Rule?
Suppose you have the following five jobs with time requirements in two stages of production. What is the job sequence using Johnson’s Rule?
Time in HoursJobs Stage 1 Stage 2 A 1.50 1.25 B 2.00 3.00 C 2.50 2.00 D 1.00 2.00

4. PPC & PERT/CPM
Example of Job Sequencing: Johnson’s Rule (Part 2)
First, select the job with the smallest time in either stage.
That is Job D with the smallest time in the first stage. Place that job as early as possible in the unfilled job sequence below.
Drop D out, select the next smallest time (Job A), and place it 4th in the job sequence.
Drop A out, select the next smallest time. There is a tie in two stages for two different jobs. In this case, place the job with the smallest time in the first stage as early as possible in the unfilled job sequence.
Then place the job with the smallest time in the second stage as late as possible in the unfilled sequence.
Job Sequence 1 2 3 4
Job Assigned D A B C
Time in HoursJobs Stage 1 Stage 2 A 1.50 1.25 B 2.00 3.00 C 2.50 2.00 D 1.00 2.00

4. PPC & PERT/CPM
Shop-Floor Control:Major Functions
1. Assigning priority of each shop order
2. Maintaining work-in-process quantity information
3. Conveying shop-order status information to the office

4. PPC & PERT/CPM
Shop-Floor Control:Major Functions (Continued)
4. Providing actual output data for capacity
control purposes
5. Providing quantity by location by shop order
for WIP inventory and accounting purposes
6. Providing measurement of efficiency,
utilization, and productivity of manpower and
machines

4. PPC & PERT/CPM
Input/Output Control
Input Output
• Planned input should never exceed planned output
• Focuses attention on bottleneck work centers
WorkCenter
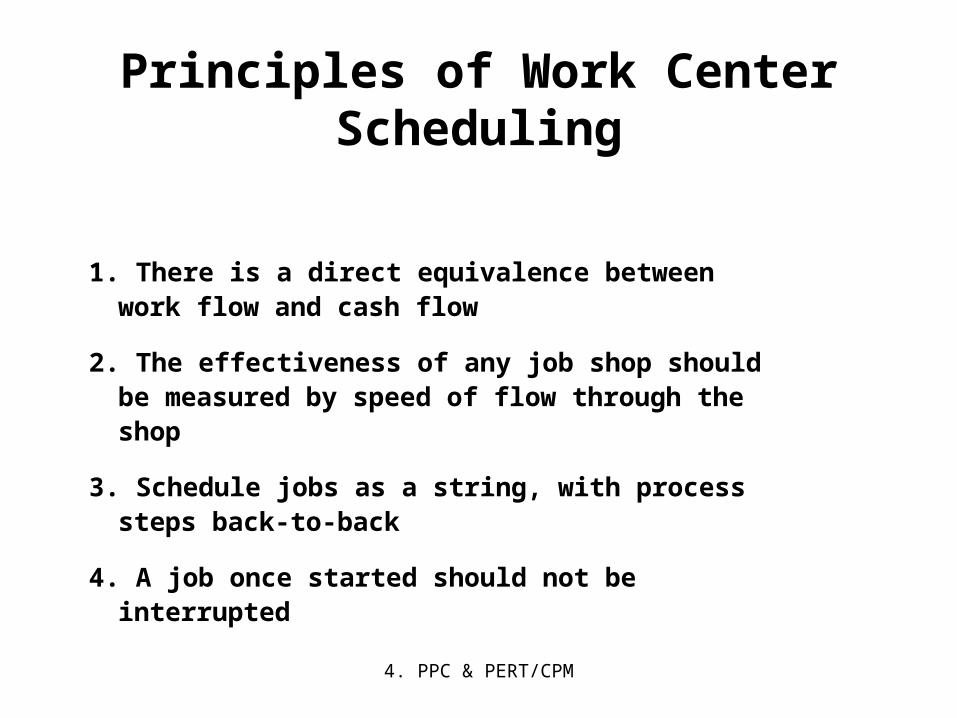
4. PPC & PERT/CPM
Principles of Work Center Scheduling
1. There is a direct equivalence between work flow and cash flow
2. The effectiveness of any job shop should be measured by speed of flow through the shop
3. Schedule jobs as a string, with process steps back-to-back
4. A job once started should not be interrupted

4. PPC & PERT/CPM
Principles of Job Shop Scheduling (Continued)
5. Speed of flow is most efficiently achieved by focusing on bottleneck work centers and jobs
6. Reschedule every day
7. Obtain feedback each day on jobs that are not completed at each work center
8. Match work center input information to what the worker can actually do

4. PPC & PERT/CPM
Principles of Job Shop Scheduling (Continued)
9. When seeking improvement in output,
look for incompatibility between
engineering design and process
execution
10. Certainty of standards, routings, and
so forth is not possible in a job shop,
but always work towards achieving it

4. PPC & PERT/CPM
Personnel Scheduling in Services
• Scheduling consecutive days off
• Scheduling daily work times
• Scheduling hourly work times
4. PPC & PERT/CPM 227
Question Bowl
A Work Center may be which of the
following?
a. A single machine
b. A group of machines
c. An area where a particular type of work
is performed
d. All of the above
e. None of the above
Answer: d. All of the above
4. PPC & PERT/CPM 228
Question Bowl
When work is assigned to a work center simply
based on what is needed over time, we would
refer to this as which of the following scheduling
systems?
a. A finite loading of work
b. An infinite loading of work
c. Forward scheduling
d. All of the above
e. None of the above
Answer: b. An infinite loading of work

4. PPC & PERT/CPM 229
Question Bowl
Typical scheduling and controlling of operations
include which of the following functions?
a. Allocating orders at work centers
b. Allocating equipment at work centers
c. Allocating personnel at work centers
d. All of the above
e. None of the aboveAnswer: d. All of the above

4. PPC & PERT/CPM 230
Question Bowl
Typical scheduling and controlling of
operations include which of the following
functions?
a. Determining the job sequences
b. Dispatching
c. Expediting late and critical orders
d. All of the above
e. None of the aboveAnswer: d. All of the above

4. PPC & PERT/CPM 231
Question Bowl
Which of the following are standard measures
of schedule performance used to evaluate
priority rules?
a. Meeting due dates
b. Maximizing job flow time
c. Maximizing work-in-process inventory
d. All of the above
e. None of the above Answer: a. Meeting due dates (Correct answer can also include minimizing WIP inventory, idle time, and job flow time.)

4. PPC & PERT/CPM 232
Question Bowl
Which priority rule uses the calculation of the
difference between the due date and the current
date divided by the number of work days
remaining?
a. STR
b. SOT
c. DDate
d. FCFS
e. None of the above
Answer: e. None of the above (Correct answer can is CR or critical ratio.)

4. PPC & PERT/CPM 233
Question Bowl
The major functions of a shop-floor control are
which of the following?
a. Conveying shop-order status
b. Measuring efficiency
c. Assigning priorities
d. Maintaining WIP quantity information
e. All of the above
Answer: e. All of the above (Correct answer can also include providing quantity by location and actual output data.)

4. PPC & PERT/CPM 234
Question Bowl
Which of the following are Tools of
Shop-Floor Control?
a. Daily dispatch lists
b. Scrap reports
c. Rework reports
d. All of the above
e. None of the above
Answer: d. All of the above (Correct answer can also include all status and exception reports and input/output control reports.)
4. PPC & PERT/CPM 235
Question Bowl
Which of the following is a Principle of Work-
Center Scheduling?
a. There is a direct equivalence between work flow
and cash flow
b. Certainty of routings are very possible in a
shop
c. Reschedule only once a week
d. All of the above
e. None of the above
Answer: a. There is a direct equivalence between work flow and cash flow (There are nine other principles.)

4. PPC & PERT/CPM 236
4g. Project Management(PERT / CPM)

4. PPC & PERT/CPM
• Definition of Project Management
• Work Breakdown Structure
• Project Control Charts
• Structuring Projects
• Critical Path Scheduling
OBJECTIVES

4. PPC & PERT/CPM
• Project is a series of related jobs usually directed toward some major output and requiring a significant period of time to perform
• Project Management are the management activities of planning, directing, and controlling resources (people, equipment, material) to meet the technical, cost, and time constraints of a project
Project Management Defined

4. PPC & PERT/CPM 239
Characteristics of projects
• Non-routine
• Have a specific objective to achieve
• Identifiable Start & Finish
• Consist of a number of inter-related activities. Each activity in turn requires time & resources for its completion.
• The resources and skills required are multi-faceted. Sometimes, they are unique to the specific project.
• Co-ordination of the efforts of multiple agencies (departments, external organizations, individuals) is required
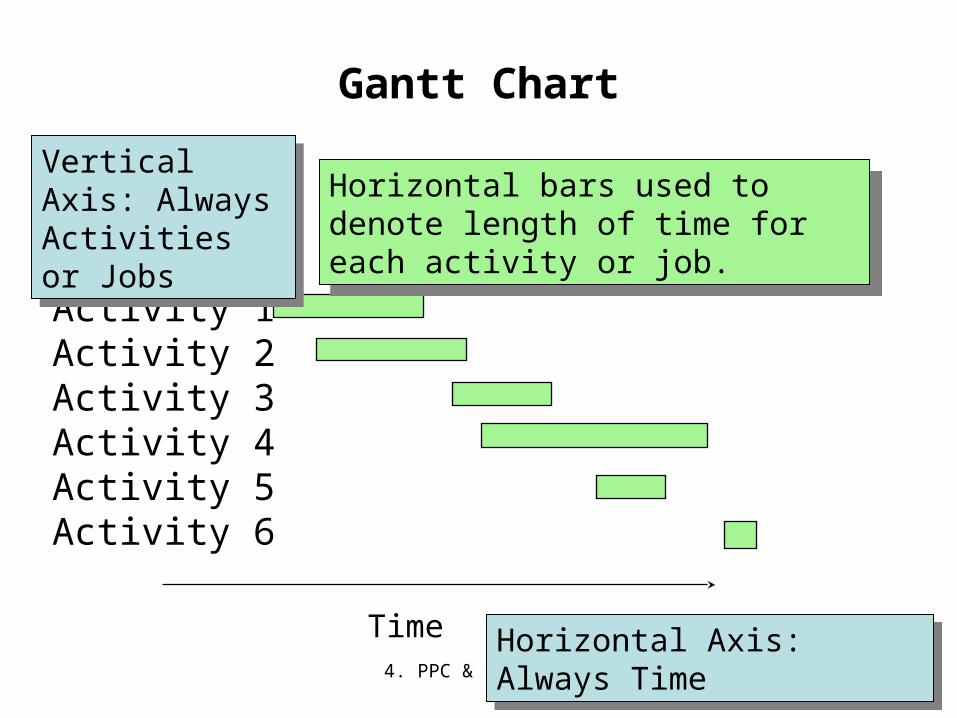
4. PPC & PERT/CPM
Gantt Chart
Activity 1Activity 2Activity 3Activity 4Activity 5Activity 6
Time
Vertical Axis: Always Activities or Jobs
Vertical Axis: Always Activities or Jobs
Horizontal Axis: Always TimeHorizontal Axis: Always Time
Horizontal bars used to denote length of time for each activity or job.
Horizontal bars used to denote length of time for each activity or job.
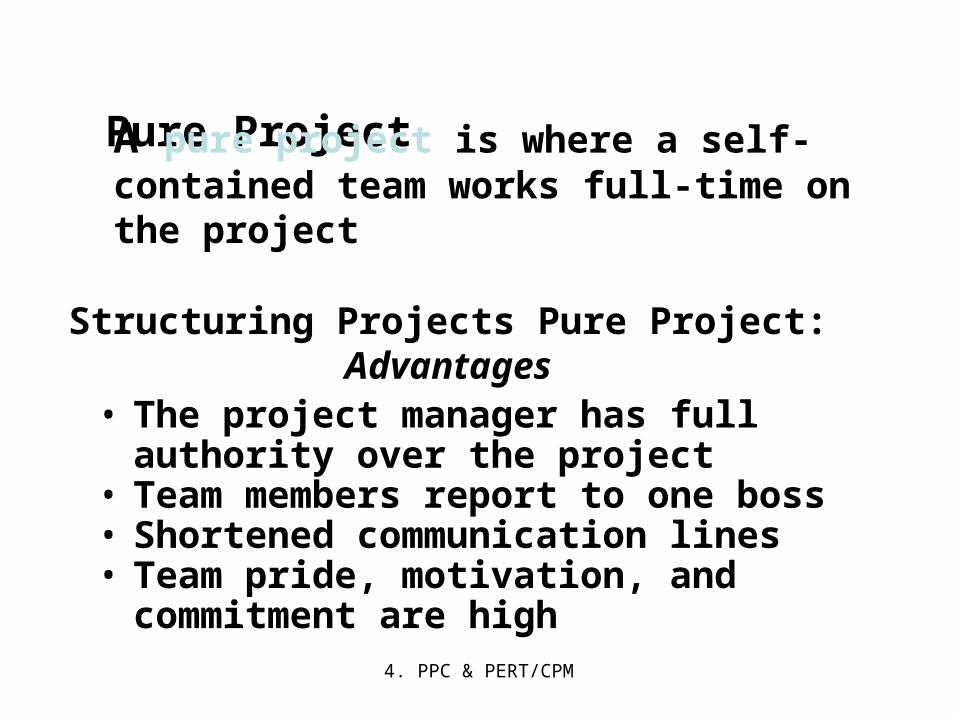
4. PPC & PERT/CPM
Structuring Projects Pure Project: Advantages
Pure ProjectA pure project is where a self-contained team works full-time on the project
• The project manager has full authority over the project
• Team members report to one boss• Shortened communication lines• Team pride, motivation, and commitment
are high
4. PPC & PERT/CPM
Structuring Projects Pure Project: Disadvantages
• Duplication of resources• Organizational goals and policies
are ignored• Lack of technology transfer• Team members have no functional
area "home"
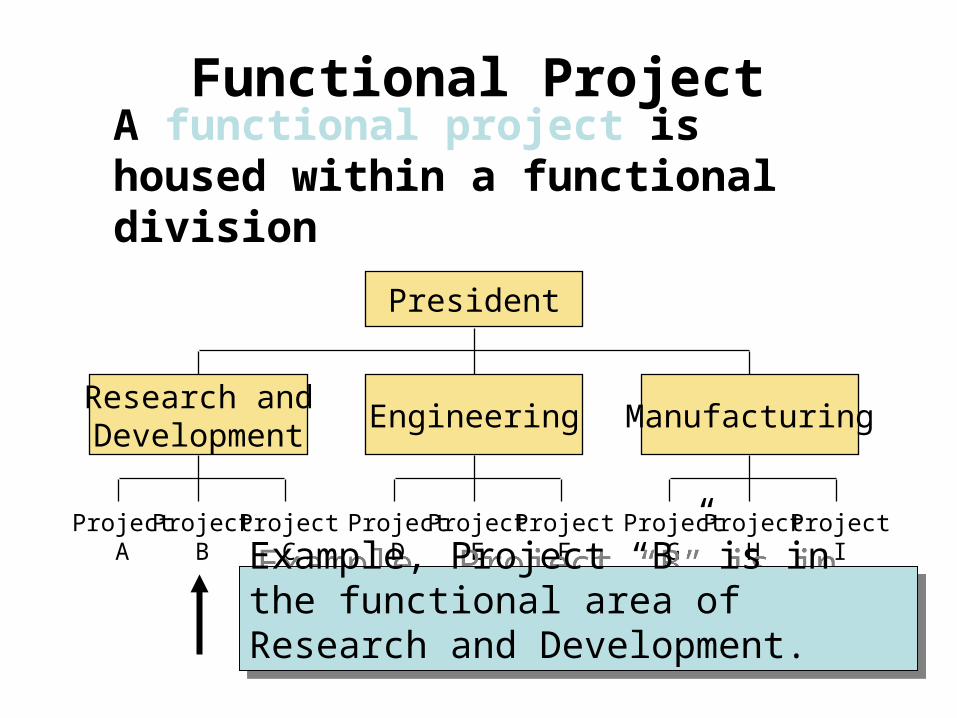
4. PPC & PERT/CPM
Functional Project
President
Research andDevelopment
Engineering Manufacturing
ProjectA
ProjectB
ProjectC
ProjectD
ProjectE
ProjectF
ProjectG
ProjectH
ProjectI
A functional project is housed within a functional division
Example, Project “B” is in the functional area of Research and Development.
Example, Project “B” is in the functional area of Research and Development.

4. PPC & PERT/CPM
Structuring Projects Functional Project: Advantages
• A team member can work on several projects
• Technical expertise is maintained within the functional area
• The functional area is a “home” after the project is completed
• Critical mass of specialized knowledge

4. PPC & PERT/CPM
Structuring Projects Functional Project: Disadvantages
• Aspects of the project that are not directly related to the functional area get short-changed
• Motivation of team members is often weak
• Needs of the client are secondary and are responded to slowly
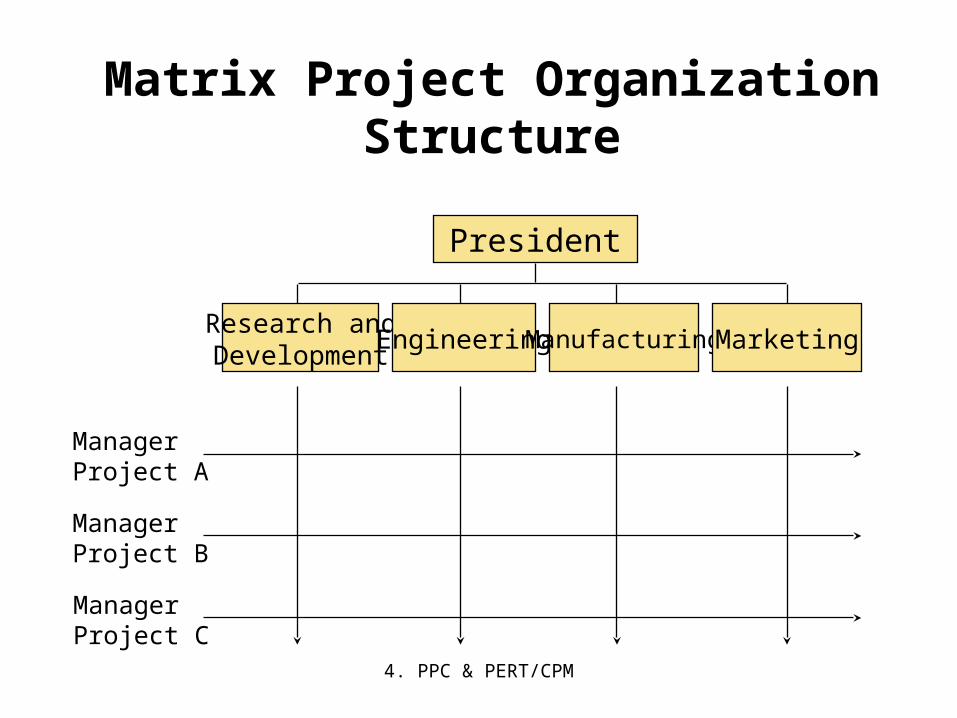
4. PPC & PERT/CPM
Matrix Project Organization Structure
President
Research andDevelopment
Engineering Manufacturing Marketing
ManagerProject A
ManagerProject B
ManagerProject C

4. PPC & PERT/CPM
Structuring Projects Matrix: Advantages
• Enhanced communications between functional areas
• Pinpointed responsibility
• Duplication of resources is minimized
• Functional “home” for team members
• Policies of the parent organization are followed

4. PPC & PERT/CPM
Structuring Projects Matrix: Disadvantages
• Too many bosses
• Depends on project manager’s negotiating skills
• Potential for sub-optimization

4. PPC & PERT/CPM
Work Breakdown Structure
Program
Project 1 Project 2
Task 1.1
Subtask 1.1.1
Work Package 1.1.1.1
Level
1
2
3
4
Task 1.2
Subtask 1.1.2
Work Package 1.1.1.2
A work breakdown structure defines the hierarchy of project tasks, subtasks, and work packages

4. PPC & PERT/CPM
Network-Planning Models
• A project is made up of a sequence of activities that
form a network representing a project
• The path taking longest time through this network of
activities is called the “critical path”
• The critical path provides a wide range of scheduling
information useful in managing a project
• Critical Path Method (CPM) helps to identify the
critical path(s) in the project networks
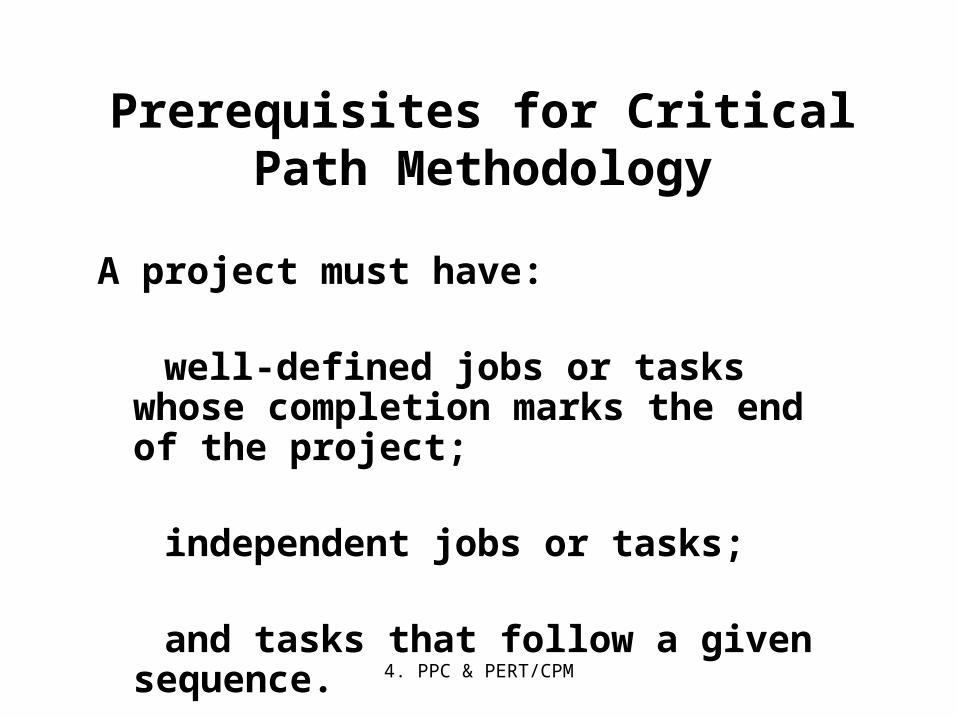
4. PPC & PERT/CPM
Prerequisites for Critical Path Methodology
A project must have:
well-defined jobs or tasks whose completion marks the end of the project;
independent jobs or tasks;
and tasks that follow a given sequence.

4. PPC & PERT/CPM
Types of Critical Path Methods
• CPM with a Single Time Estimate– Used when activity times are known with certainty– Used to determine timing estimates for the project,
each activity in the project, and slack time for activities
• PERT is CPM with Three Activity Time Estimates – Used when activity times are uncertain – Used to obtain the same information as the Single
Time Estimate model and probability information• Time-Cost Models
– Used when cost trade-off information is a major consideration in planning
– Used to determine the least cost in reducing total project time
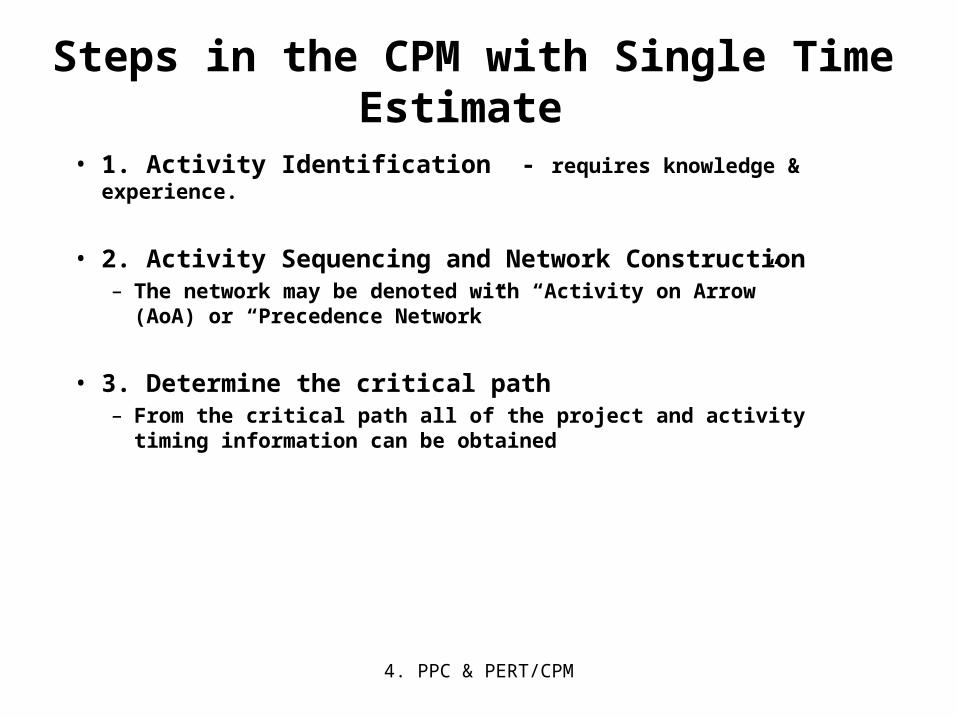
4. PPC & PERT/CPM
Steps in the CPM with Single Time Estimate
• 1. Activity Identification - requires knowledge & experience.
• 2. Activity Sequencing and Network Construction– The network may be denoted with “Activity on Arrow” (AoA)
or “Precedence Network”
• 3. Determine the critical path– From the critical path all of the project and activity timing
information can be obtained
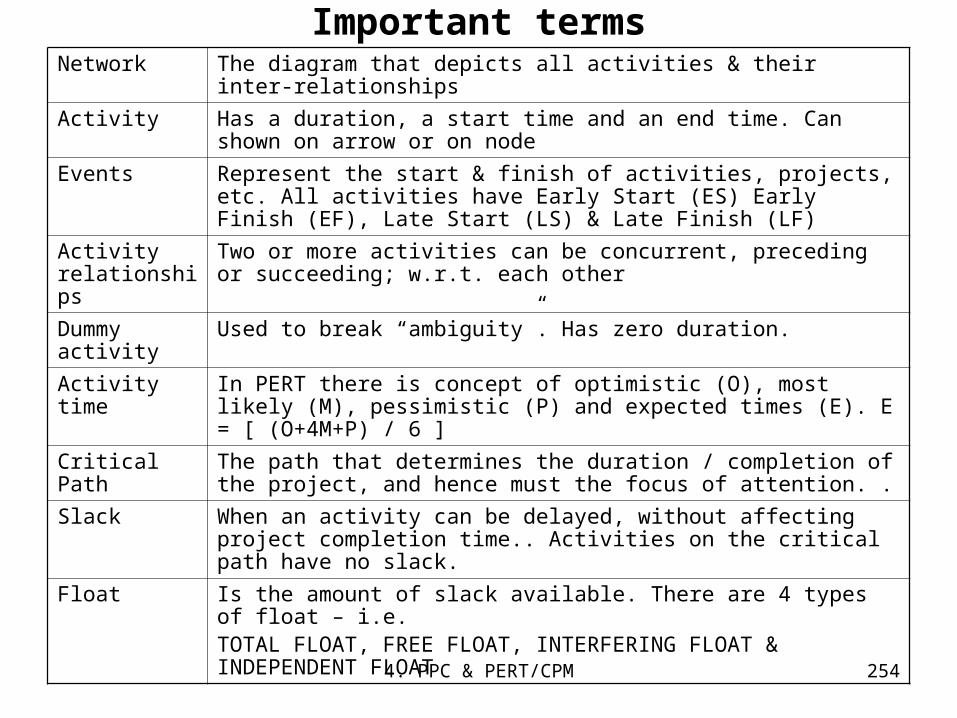
4. PPC & PERT/CPM 254
Important termsNetwork The diagram that depicts all activities & their inter-relationships
Activity Has a duration, a start time and an end time. Can shown on arrow or on node
Events Represent the start & finish of activities, projects, etc. All activities have Early Start (ES) Early Finish (EF), Late Start (LS) & Late Finish (LF)
Activity relationships
Two or more activities can be concurrent, preceding or succeeding; w.r.t. each other
Dummy activity
Used to break “ambiguity”. Has zero duration.
Activity time In PERT there is concept of optimistic (O), most likely (M), pessimistic (P) and expected times (E). E = [ (O+4M+P) / 6 ]
Critical Path The path that determines the duration / completion of the project, and hence must the focus of attention. .
Slack When an activity can be delayed, without affecting project completion time.. Activities on the critical path have no slack.
Float Is the amount of slack available. There are 4 types of float – i.e. TOTAL FLOAT, FREE FLOAT, INTERFERING FLOAT & INDEPENDENT FLOAT

4. PPC & PERT/CPM 255
Four Types of Activity Float

4. PPC & PERT/CPM 256
PERT CPM
1. It is a technique for planning scheduling & controlling of projects whose activities are subject to uncertainty in the performance time. Hence it is a probabilistic model
1. It is a technique for planning scheduling & controlling of projects whose activities not subjected to any uncertainty and the performance times are fixed. Hence it is a deterministic model
2.It is an Event oriented system
2. It is an Activity oriented system

4. PPC & PERT/CPM 257
3.Basically does not differentiate critical and non-critical activities
Differentiates clearly the critical activities from the other activities.
4. Used in projects where resources (men, materials, money) are always available when required.
4. Used in projects where overall costs is of primarily important. Therefore better utilized resources
5. Suitable for Research and Development projects where times cannot be predicted
5.Suitable for civil constructions, installation, ship building etc.

4. PPC & PERT/CPM 258
Rules for drawing the network diagrams (AoA)
In a network diagram, arrows represent the
activities and circles represent the events.
•The tail of an arrow represents the start of an
activity and the head represent the completion
of the activity.
1 2 3 4
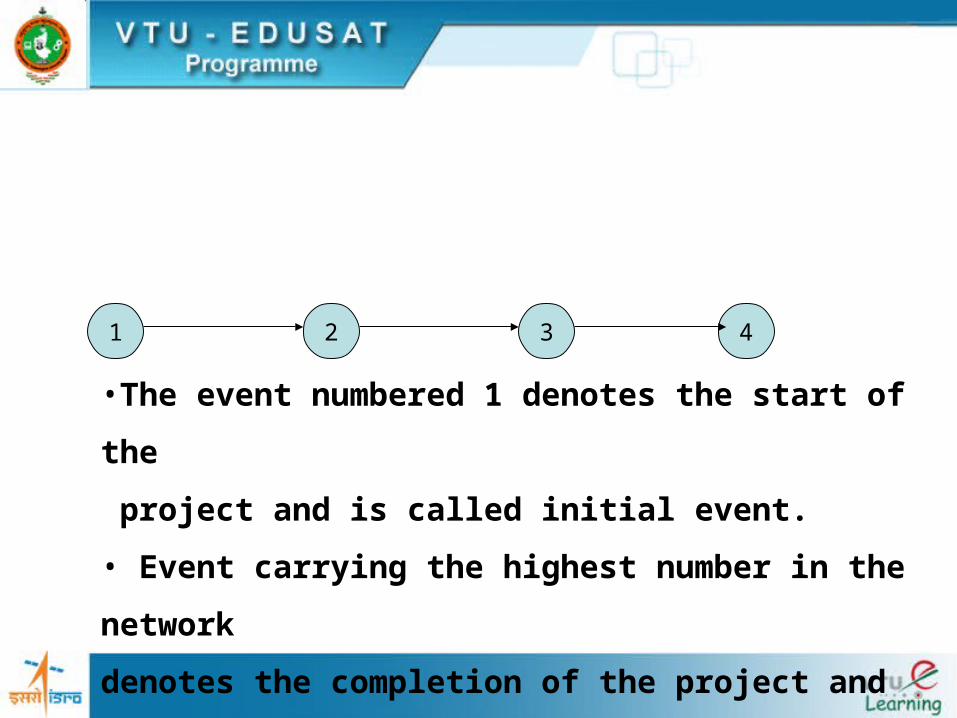
4. PPC & PERT/CPM 259
•The event numbered 1 denotes the start of the
project and is called initial event.
• Event carrying the highest number in the network
denotes the completion of the project and is called
terminal event.
1 2 3 4
4. PPC & PERT/CPM 260
•Each defined activity is represented by one and only
arrow in the network.
•Determine which operation must be completed
immediately before other can start.
•Determine which other operation must follow the
other given operation.
1 2 3 4

4. PPC & PERT/CPM 261
•The network should be developed on the basis of
logical, analytical and technical dependencies
between various activities of the project.
1 2 3 4

4. PPC & PERT/CPM 262
The basic network construction – Terminology used.
Network representation: There are two types of
systems –
AOA system (Activity on Arrow system)
AON system(Activity on Node system )
In this activities are represented by an arrows.
In this method activities are represented in the circles.

4. PPC & PERT/CPM 263
Problem 1.Construct an arrow diagram for the following project.
Activities Relationship
A Precedes B,C
B Precedes D,E
C Precedes D
D Precedes F
E Precedes G
F Precedes G

4. PPC & PERT/CPM 264
A
B
C
D
E
F
G

4. PPC & PERT/CPM 265
Problem 2.Construct an arrow diagram for the following project.
Job Immediate predecessor
Duration
A - 14 Days
B A 3 Days
C A 7 Days
D C 4 Days
E B,D 10 Days

4. PPC & PERT/CPM 266
A
B
C
D
E
14
3
7
4
10
KeyJob
Duration

4. PPC & PERT/CPM 267
Problem 3.Construct an arrow diagram for the following project.
Job Immediate predecessor
A -
B -
C A,B
D A
E D
F C,E

4. PPC & PERT/CPM 268
A
BC
D
E
F
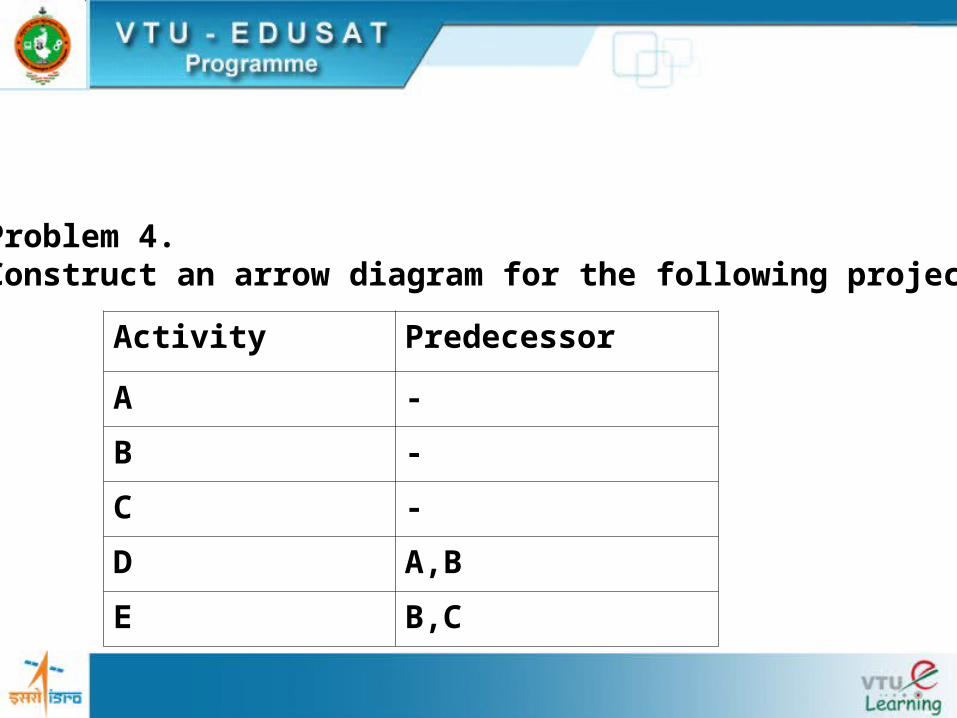
4. PPC & PERT/CPM 269
Problem 4.Construct an arrow diagram for the following project.
Activity Predecessor
A -
B -
C -
D A,B
E B,C

4. PPC & PERT/CPM 270
A
B
C
D
E
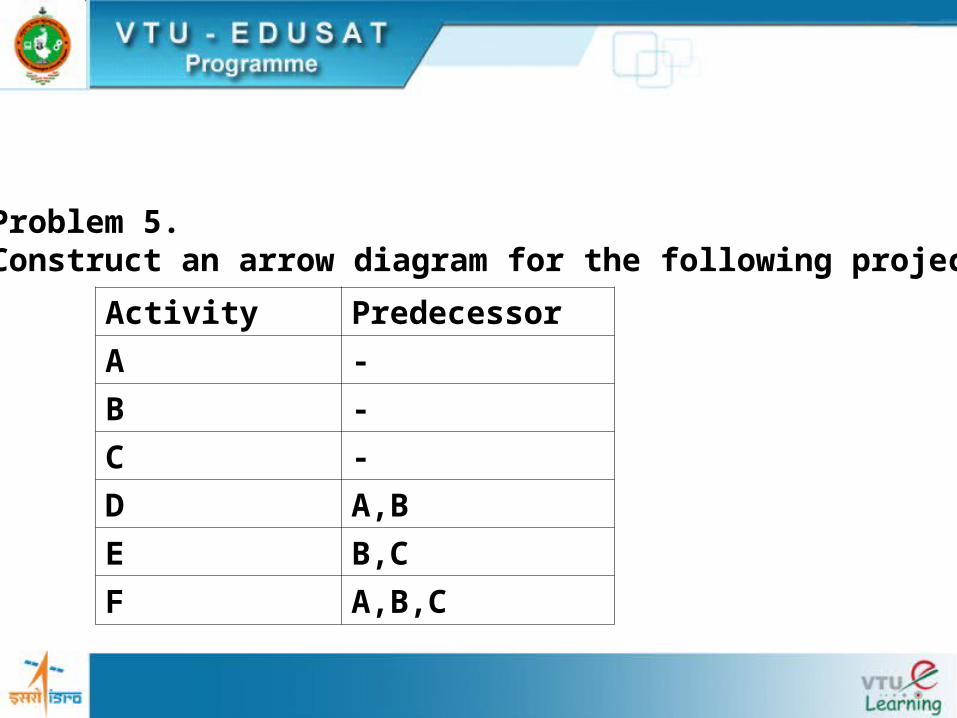
4. PPC & PERT/CPM 271
Problem 5.Construct an arrow diagram for the following project.
Activity Predecessor
A -
B -
C -
D A,B
E B,C
F A,B,C
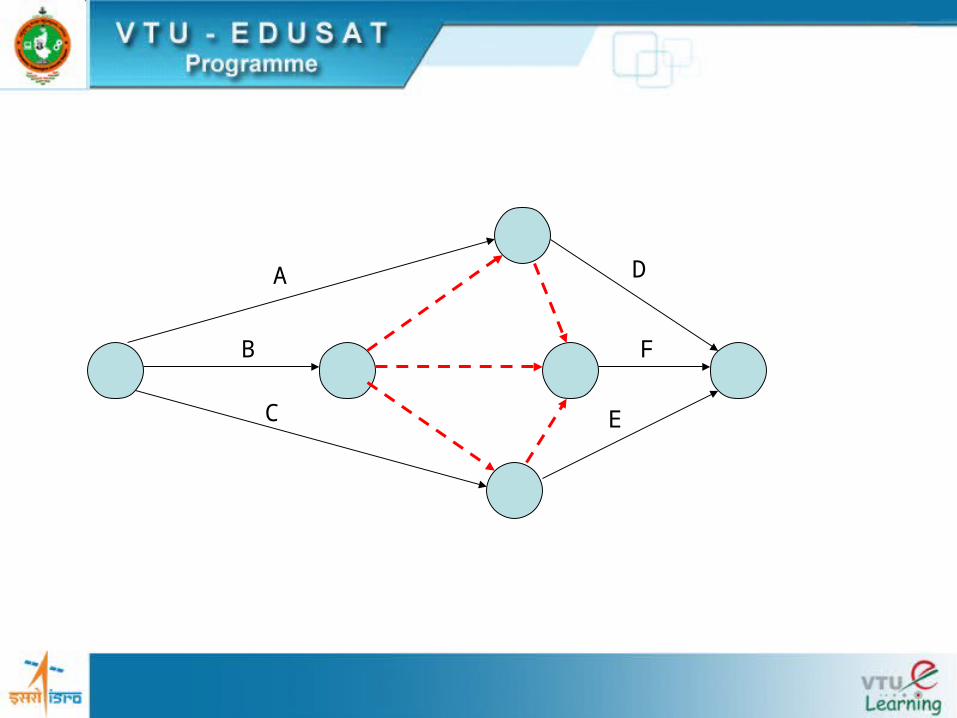
4. PPC & PERT/CPM 272
A
B
C
D
E
F
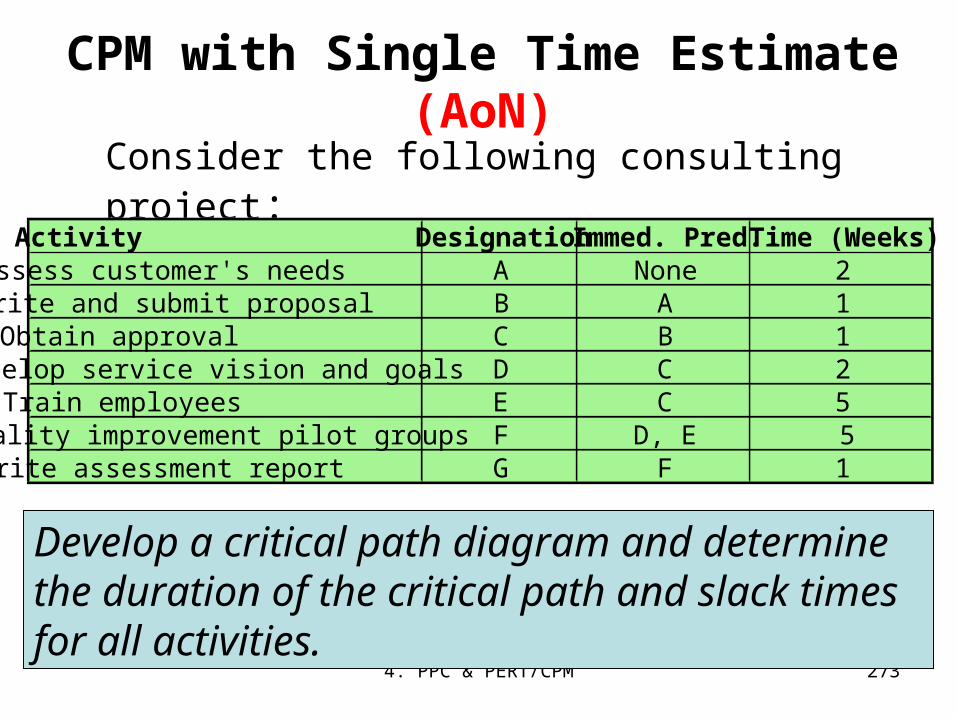
4. PPC & PERT/CPM 273
CPM with Single Time Estimate (AoN)
Consider the following consulting project:
Activity Designation Immed. Pred. Time (Weeks)Assess customer's needs A None 2Write and submit proposal B A 1Obtain approval C B 1Develop service vision and goals D C 2Train employees E C 5Quality improvement pilot groups F D, E 5Write assessment report G F 1
Develop a critical path diagram and determine the duration of the critical path and slack times for all activities.

4. PPC & PERT/CPM
First draw the network
A(2) B(1) C(1)
D(2)
E(5)
F(5) G(1)
A None 2
B A 1
C B 1
D C 2
E C 5
F D,E 5
G F 1
Act. Imed. Pred. Time

4. PPC & PERT/CPM
Determine early starts and early finish times
ES=9EF=14
ES=14EF=15
ES=0EF=2
ES=2EF=3
ES=3EF=4
ES=4EF=9
ES=4EF=6
A(2) B(1) C(1)
D(2)
E(5)
F(5) G(1)
Hint: Start with ES=0 and go forward in the network from A to G.
Hint: Start with ES=0 and go forward in the network from A to G.
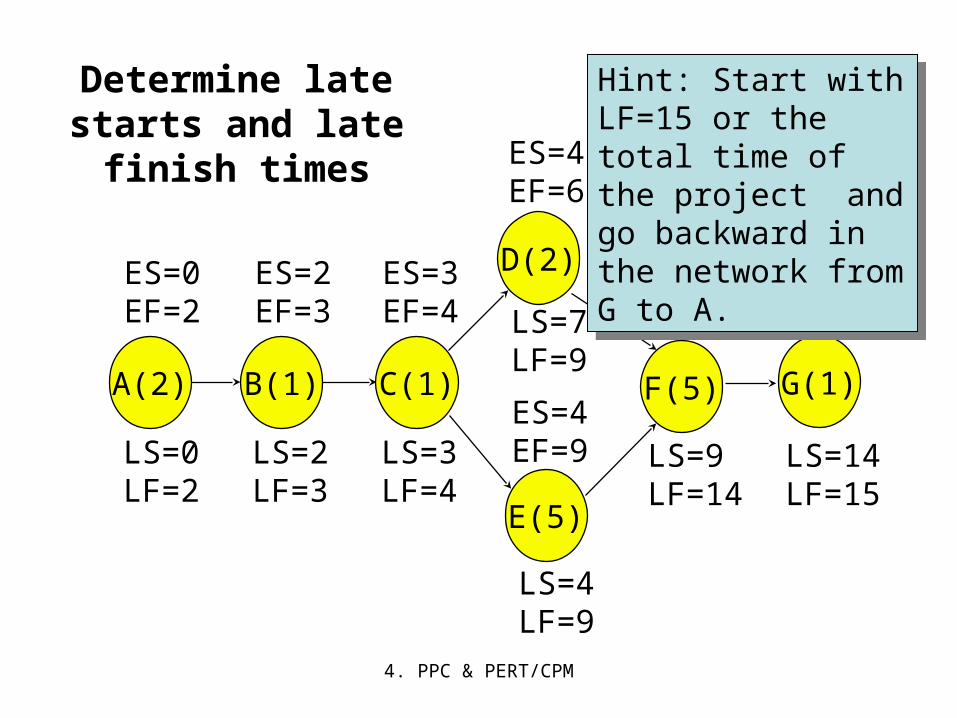
4. PPC & PERT/CPM
Determine late starts and late
finish times
ES=9EF=14
ES=14EF=15
ES=0EF=2
ES=2EF=3
ES=3EF=4
ES=4EF=9
ES=4EF=6
A(2) B(1) C(1)
D(2)
E(5)
F(5) G(1)
LS=14LF=15
LS=9LF=14
LS=4LF=9
LS=7LF=9
LS=3LF=4
LS=2LF=3
LS=0LF=2
Hint: Start with LF=15 or the total time of the project and go backward in the network from G to A.
Hint: Start with LF=15 or the total time of the project and go backward in the network from G to A.
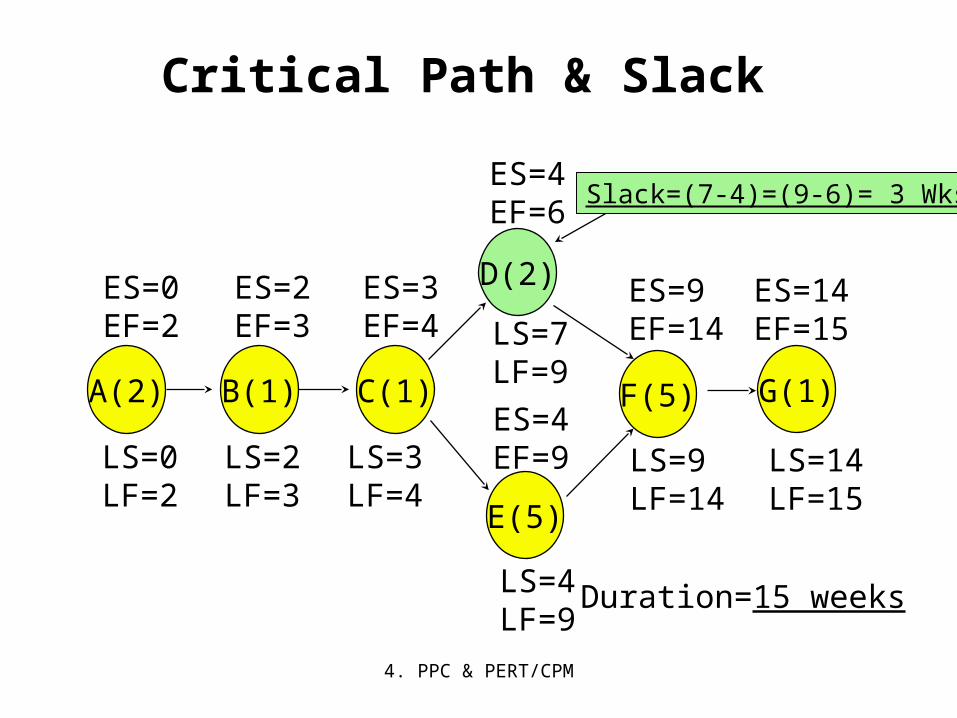
4. PPC & PERT/CPM
Critical Path & Slack
ES=9EF=14
ES=14EF=15
ES=0EF=2
ES=2EF=3
ES=3EF=4
ES=4EF=9
ES=4EF=6
A(2) B(1) C(1)
D(2)
E(5)
F(5) G(1)
LS=14LF=15
LS=9LF=14
LS=4LF=9
LS=7LF=9
LS=3LF=4
LS=2LF=3
LS=0LF=2
Duration=15 weeks
Slack=(7-4)=(9-6)= 3 Wks
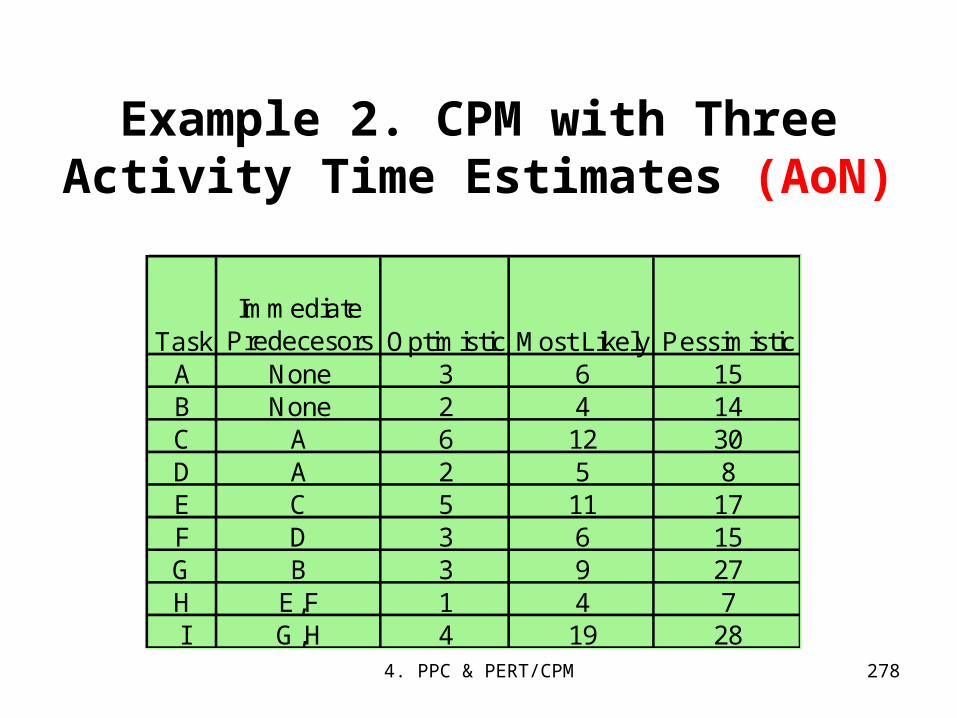
4. PPC & PERT/CPM 278
Example 2. CPM with Three Activity Time Estimates (AoN)
TaskImmediate
Predecesors Optimistic Most Likely PessimisticA None 3 6 15B None 2 4 14C A 6 12 30D A 2 5 8E C 5 11 17F D 3 6 15G B 3 9 27H E,F 1 4 7I G,H 4 19 28
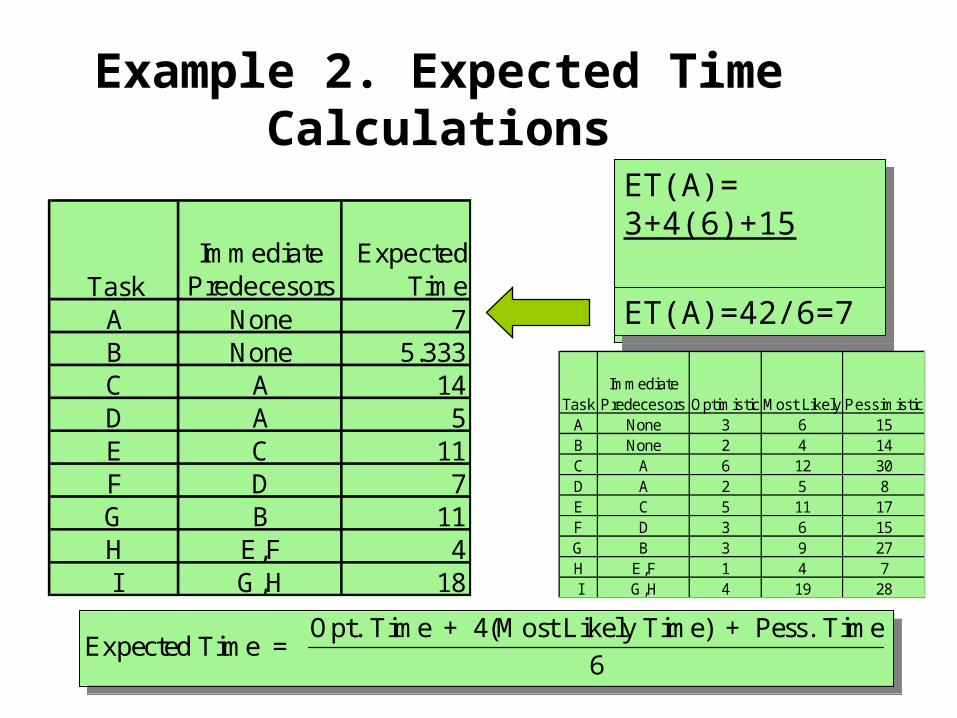
4. PPC & PERT/CPM 279
Example 2. Expected Time Calculations
ET(A)= 3+4(6)+15
6
ET(A)= 3+4(6)+15
6
ET(A)=42/6=7ET(A)=42/6=7Task
Immediate Predecesors
Expected Time
A None 7B None 5.333C A 14D A 5E C 11F D 7G B 11H E,F 4I G,H 18
TaskImmediate
Predecesors Optimistic Most Likely PessimisticA None 3 6 15B None 2 4 14C A 6 12 30D A 2 5 8E C 5 11 17F D 3 6 15G B 3 9 27H E,F 1 4 7I G,H 4 19 28
Expected Time = Opt. Time + 4(Most Likely Time) + Pess. Time
6Expected Time =
Opt. Time + 4(Most Likely Time) + Pess. Time
6
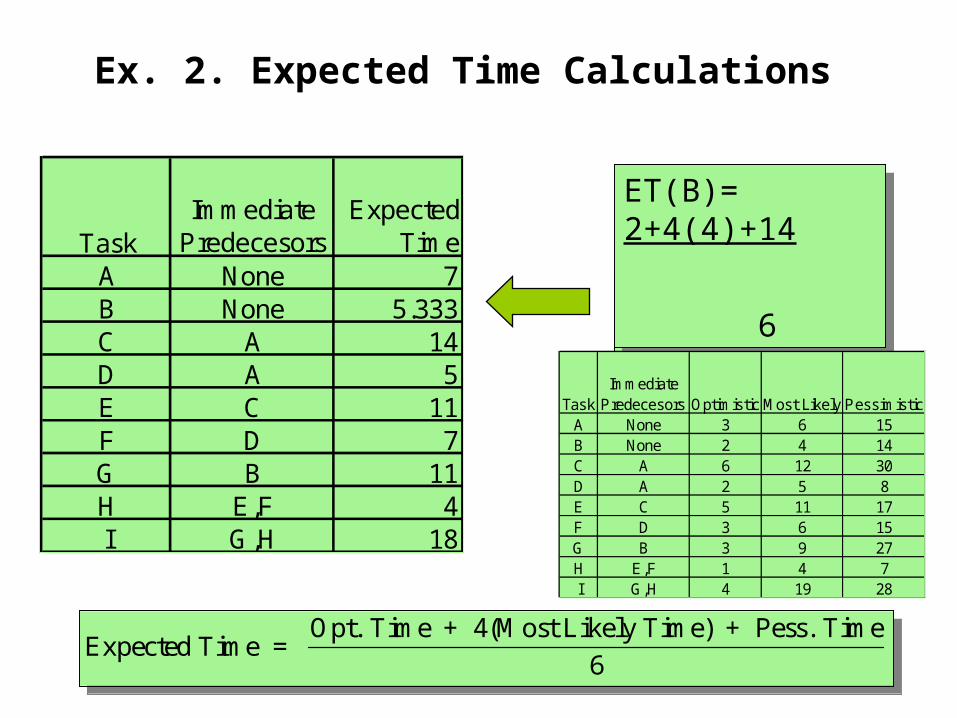
4. PPC & PERT/CPM 280
Ex. 2. Expected Time Calculations
TaskImmediate
PredecesorsExpected
TimeA None 7B None 5.333C A 14D A 5E C 11F D 7G B 11H E,F 4I G,H 18
ET(B)=32/6=5.333ET(B)=32/6=5.333
ET(B)= 2+4(4)+14
6
ET(B)= 2+4(4)+14
6
TaskImmediate
Predecesors Optimistic Most Likely PessimisticA None 3 6 15B None 2 4 14C A 6 12 30D A 2 5 8E C 5 11 17F D 3 6 15G B 3 9 27H E,F 1 4 7I G,H 4 19 28
Expected Time = Opt. Time + 4(Most Likely Time) + Pess. Time
6Expected Time =
Opt. Time + 4(Most Likely Time) + Pess. Time
6

4. PPC & PERT/CPM 281
Ex 2. Expected Time Calculations
TaskImmediate
PredecesorsExpected
TimeA None 7B None 5.333C A 14D A 5E C 11F D 7G B 11H E,F 4I G,H 18
ET(C)= 6+4(12)+30
6
ET(C)= 6+4(12)+30
6
ET(C)=84/6=14ET(C)=84/6=14
TaskImmediate
Predecesors Optimistic Most Likely PessimisticA None 3 6 15B None 2 4 14C A 6 12 30D A 2 5 8E C 5 11 17F D 3 6 15G B 3 9 27H E,F 1 4 7I G,H 4 19 28
Expected Time = Opt. Time + 4(Most Likely Time) + Pess. Time
6Expected Time =
Opt. Time + 4(Most Likely Time) + Pess. Time
6
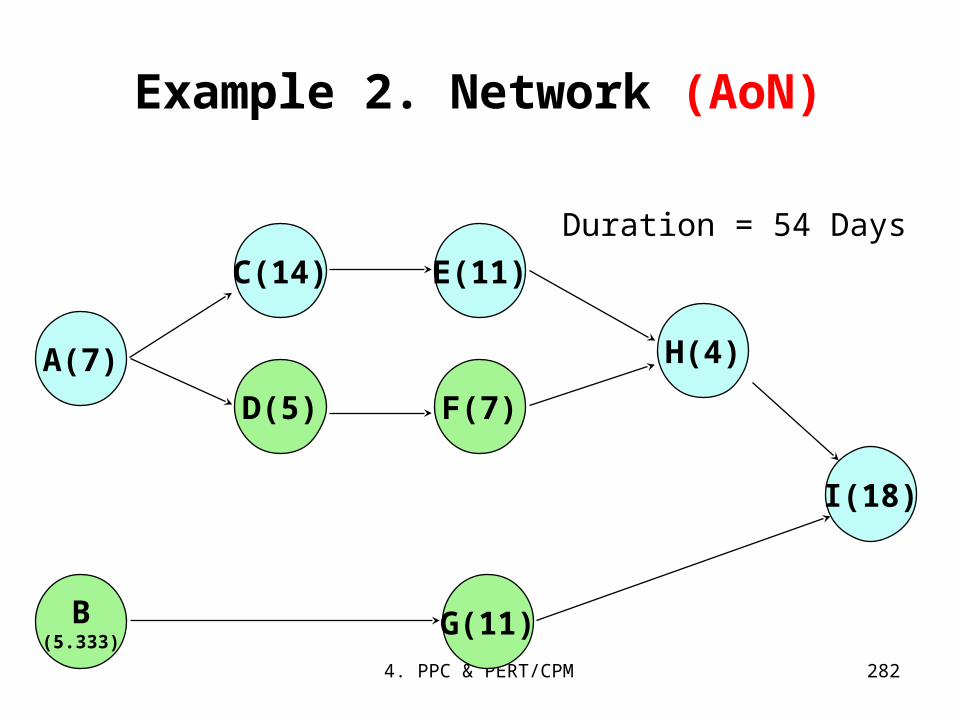
4. PPC & PERT/CPM 282
Example 2. Network (AoN)
A(7)
B(5.333)
C(14)
D(5)
E(11)
F(7)
H(4)
G(11)
I(18)
Duration = 54 Days

4. PPC & PERT/CPM 283
Example 2. Probability Exercise
What is the probability of finishing this project in less than 53 days?
What is the probability of finishing this project in less than 53 days?
p(t < D)
TE = 54
Z = D - TE
cp2
Z = D - TE
cp2
tD=53

4. PPC & PERT/CPM 284
Activity variance, = (Pessim. - Optim.
6)2 2Activity variance, = (
Pessim. - Optim.
6)2 2
Task Optimistic Most Likely Pessimistic VarianceA 3 6 15 4B 2 4 14C 6 12 30 16D 2 5 8E 5 11 17 4F 3 6 15G 3 9 27H 1 4 7 1I 4 19 28 16
(Sum the variance along the critical path.)
2 = 41 2 = 41

4. PPC & PERT/CPM 285
There is a 43.8% probability that this project will be completed in less than 53 weeks.
There is a 43.8% probability that this project will be completed in less than 53 weeks.
p(Z < -.156) = .438, or 43.8 % (NORMSDIST(-.156)p(Z < -.156) = .438, or 43.8 % (NORMSDIST(-.156)
Z = D - T
=53- 54
41= -.156E
cp2
Z = D - T
=53- 54
41= -.156E
cp2
TE = 54
p(t < D)
tD=53

4. PPC & PERT/CPM
Ex 2. Additional Probability Exercise
• What is the probability that the project duration will exceed 56 weeks?
• What is the probability that the project duration will exceed 56 weeks?

4. PPC & PERT/CPM
Example 2. Additional Exercise Solution
tTE = 54
p(t < D)
D=56
Z = D - T
=56 - 54
41= .312E
cp2
Z = D - T
=56 - 54
41= .312E
cp2
p(Z > .312) = .378, or 37.8 % (1-NORMSDIST(.312)) p(Z > .312) = .378, or 37.8 % (1-NORMSDIST(.312))

4. PPC & PERT/CPM
Time-Cost Models
• Basic Assumption: Relationship between activity completion time and project cost
• Time Cost Models: Determine the optimum point in time-cost tradeoffs– Activity direct costs– Project indirect costs– Activity completion times
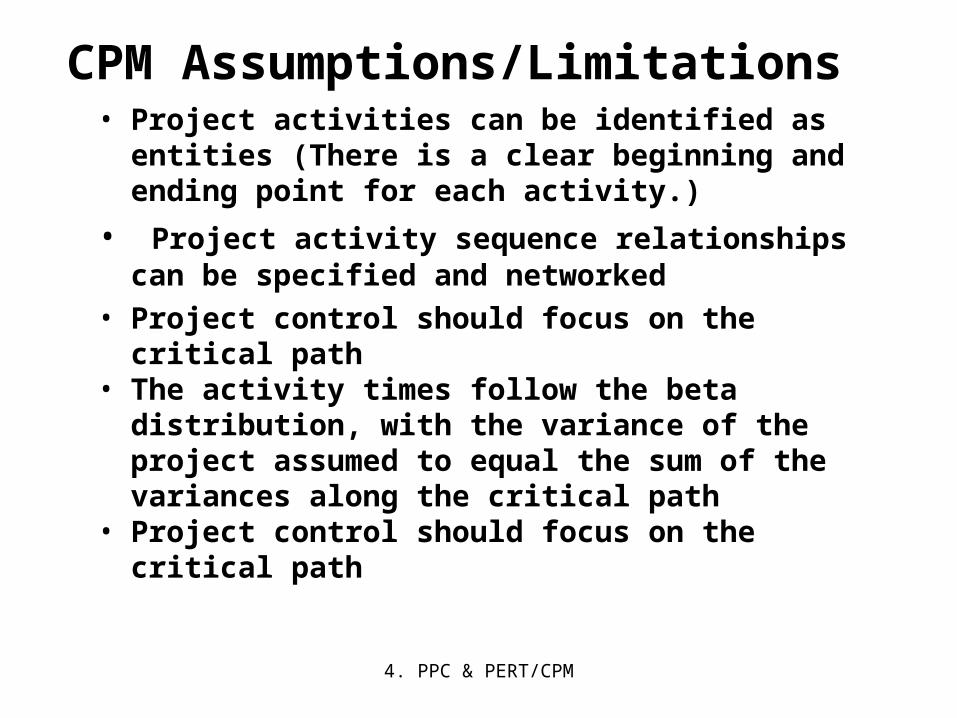
4. PPC & PERT/CPM
CPM Assumptions/Limitations • Project activities can be identified as entities
(There is a clear beginning and ending point for each activity.)
• Project activity sequence relationships can be specified and networked
• Project control should focus on the critical path
• The activity times follow the beta distribution, with the variance of the project assumed to equal the sum of the variances along the critical path
• Project control should focus on the critical path

4. PPC & PERT/CPM 290
Project CrashingThe process of accelerating a project is referred as crashing.Crashing a project relates to resource commitment; the more resources expended, the faster the project will finish.There are several reasons to crash a project:
Initial schedule was too optimistic Market needs change and the project is in demand earlier than anticipatedThe project has slipped considerably behind scheduleThere are contractual late penalties

4. PPC & PERT/CPM 291
Project CrashingPrincipal methods for crashing
Improving existing resources’ productivityChanging work methodsIncreasing the quantity of resources
Increasing the quantity of resources is the most commonly used method for project crashing. There are 2 approaches:
Working current resources for longer hours (overtime, weekend work)Adding more personnel

4. PPC & PERT/CPM 292
Project Crashing
Cost
Activity Duration
Normal
Crashed
Crashed Normal
CrashPoint
NormalPoint
Cost
Activity Duration
Normal
Crashed
Crashed Normal
CrashPoint
NormalPoint
Time-Cost Trade-Offs for Crashing Activities
Fully expedited (no expense is spared)

4. PPC & PERT/CPM 293
Project CrashingIn analyzing crash options, the goal is to find the point at which time and cost trade-offs are optimized.
Various combinations of time-cost trade-offs for crash options can be determined by using the following formula:
Slope = crash cost – normal cost normal time – crash time
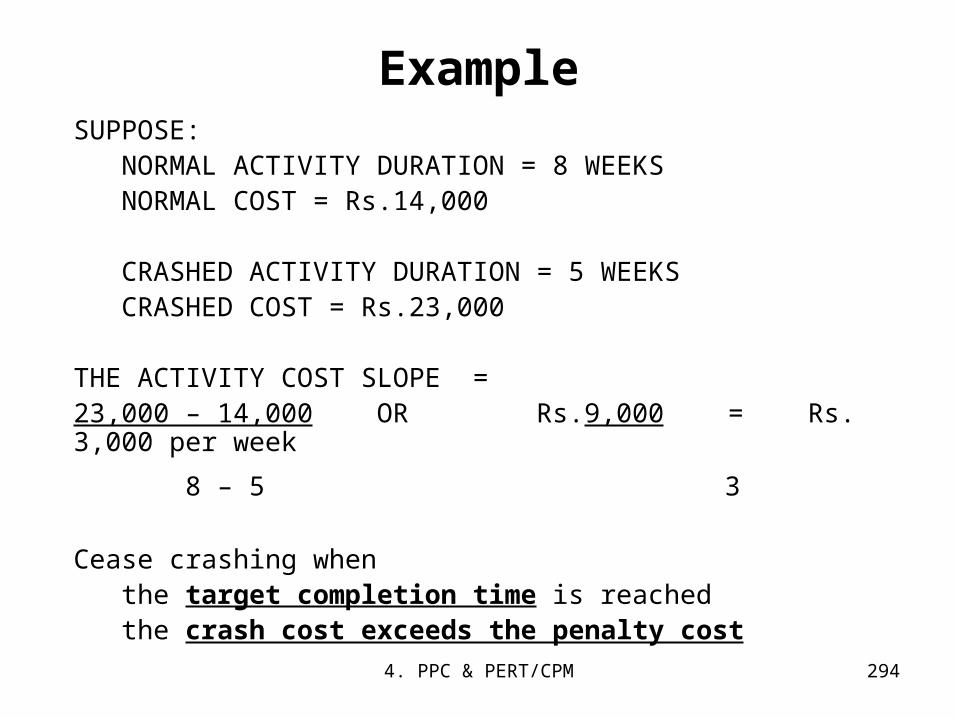
4. PPC & PERT/CPM 294
ExampleSUPPOSE:
NORMAL ACTIVITY DURATION = 8 WEEKSNORMAL COST = Rs.14,000
CRASHED ACTIVITY DURATION = 5 WEEKSCRASHED COST = Rs.23,000
THE ACTIVITY COST SLOPE = 23,000 – 14,000 OR Rs.9,000 = Rs. 3,000 per week
8 – 5 3
Cease crashing whenthe target completion time is reachedthe crash cost exceeds the penalty cost

4. PPC & PERT/CPM 295
Example Normal Crashed
Activity Duration Cost (Rs) Duration Cost (Rs)
A 4 days 1,000 3 days 2,000B 5 days 2,500 3 days 5,000C 3 days 750 2 days 1,200D 7 days 3,500 5 days 5,000E 2 days 500 1 day 2,000F 5 days 2,000 4 days 3,000G 9 days 4,500 7 days 6,300
a) Calculate the per day costs for crashing each activityb) Which are the most attractive candidates for crashing? Why?

4. PPC & PERT/CPM 296
Example
Activity Per Day Cost (Rs)
A 1,000B 1,250C 450D 750E 1,500F 1,000G 900
4. PPC & PERT/CPM 297
Resource Allocation ProblemA shortcoming of most scheduling procedures is that they do not address the issues of resource utilization and availability.
Scheduling procedures tend to focus on time rather than physical resources.

4. PPC & PERT/CPM 298
Resource Allocation ProblemSchedules should be evaluated not merely in terms of meeting project milestones, but also in terms of the timing and use of scarce resources.
A fundamental measure of the project manager’s success in project management is the skill with which the trade-offs among performance, time, and cost are managed.
“I can shorten this project by 1 day at a cost of $400. Should I do it?”
4. PPC & PERT/CPM 299
Resource Allocation ProblemThe extreme points of the relationship between time use and resource use are the following:
Time Limited: The project must be finished by a certain time, using as few resources as possible. But it is time, not resource usage, that is criticalResource Limited: The project must be finished as soon as possible, but without exceeding some specific level of resource usage or some general resource constraint
4. PPC & PERT/CPM 300
Resource LoadingResource loading describes the amounts of individual resources an existing schedule requires during specific time periods
The loads (requirements) of each resource type are listed as a function of time period
Resource loading gives a general understanding of the demands a project or set of projects will make on a firm’s resources

4. PPC & PERT/CPM 301
Resource LoadingThe project manager must be aware of the ebbs and flows of usage for each input resource throughout the life of the project.
It is the project manager’s responsibility to ensure that the required resources, in the required amounts, are available when and where they are needed.

4. PPC & PERT/CPM 302
Resource Leveling (Smooting)Resource leveling aims to minimize the period-by-period variations in resource loading by shifting tasks within their slack allowances.The purpose is to create a smoother distribution of resource usage.Resource leveling, referred to as resource smoothing, has two objectives:
To determine the resource requirements so that they will be available at the right time,To allow each activity to be scheduled with the smoothest possible transition across usage levels
4. PPC & PERT/CPM 303
Resource Leveling (Smooting)Resource management is a multivariate, combinatorial problem, i.e. multiple solutions with many variables, the mathematically optimal solution may be difficult or infeasible.
More common approach to analyzing resource leveling problems is to apply some resource leveling heuristics.

4. PPC & PERT/CPM 304
Resource Leveling HeuristicsPrioritizing resource allocation include applying resources to activities:
with the smallest amount of slackwith the smallest durationthat start earliestwith the most successor tasksrequiring the most resources
4. PPC & PERT/CPM 305
Resource Leveling StepsCreate a project activity network diagramCreate a table showing the resources required for each activity, durations, and the total float availableDevelop a time-phased resource loading tableIdentify any resource conflicts and begin to smooth the loading table using one or more heuristics

4. PPC & PERT/CPM 306
Resource Loading Chart
Display the amount of resources required as a function of time.
0 A 4 Res = 6
4 B 5 Res = 2
5 D 9 Res = 7
9 E 11 Res = 3
4 C 7 Res = 2
11 F 12 Res = 6
1. Start with a network diagram

4. PPC & PERT/CPM 307
Resource Loading ChartsActivity Resource Duration ES Slack LF
A 6 4 0 0 4
B 2 1 4 0 5
C 2 3 4 4 11
D 7 4 5 0 9
E 3 2 9 0 11
F 6 1 11 0 12
2. Produce a table that shows the duration, early start, late finish, slack, and resource(s) required for each activity.
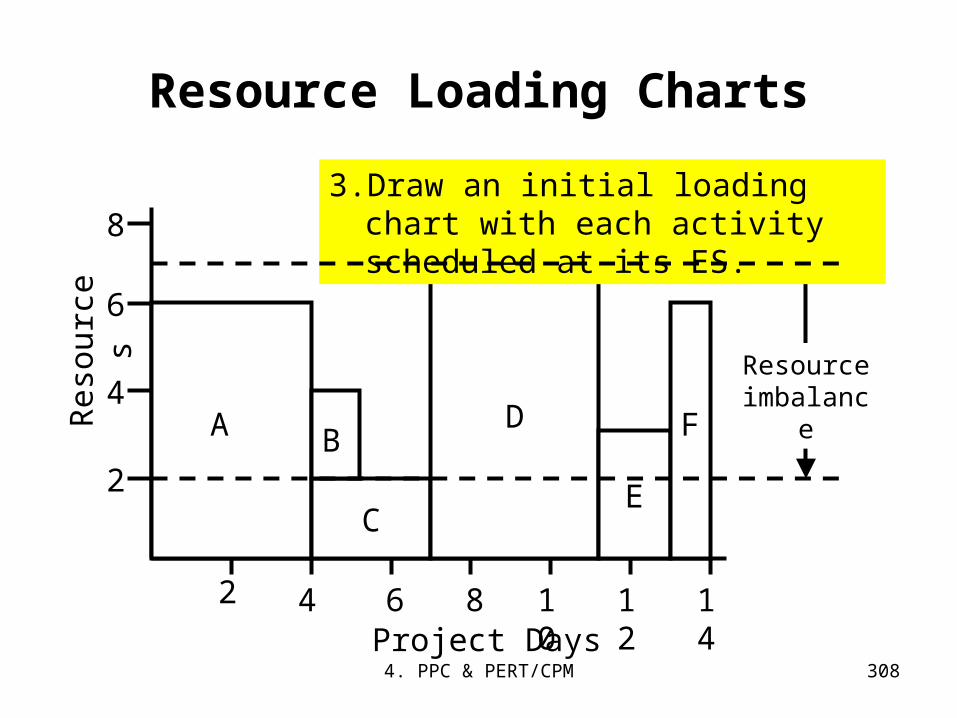
4. PPC & PERT/CPM 308
Resource Loading Charts
A
2
4
6
8
2 1210864 14
C
BD
E
F
Project Days
Res
ourc
es
3. Draw an initial loading chart with each activity scheduled at its ES.
Resource imbalance

4. PPC & PERT/CPM 309
Resource Loading Charts4. Rearrange activities within their slack
to create a more level profile. Splitting C creates a more level project.
A
2
4
6
8
2 1210864 14
C
BD
E
F
Project Days
Res
ourc
es
C
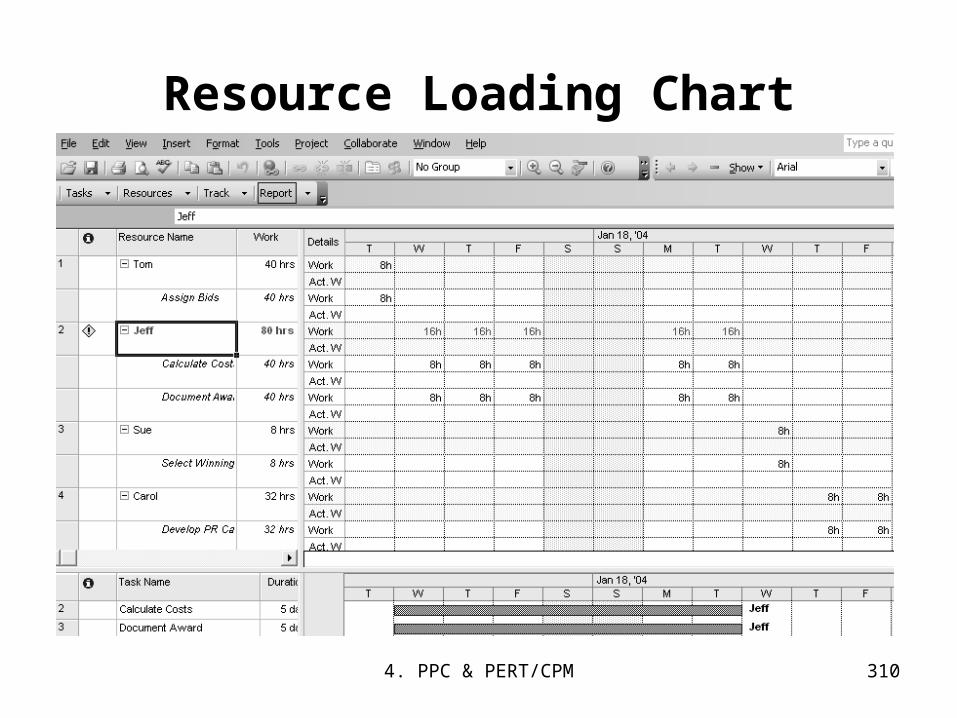
4. PPC & PERT/CPM 310
Resource Loading Chart

4. PPC & PERT/CPM 311
Question Bowl
Which of the following are examples of Graphic Project Charts?
a. Gantt b. Barc. Milestoned. All of the abovee. None of the above
Answer: d. All of the above

4. PPC & PERT/CPM 312
Question Bowl
Which of the following are one of the three organizational structures of projects?
a. Pure b. Functionalc. Matrixd. All of the abovee. None of the aboveAnswer: d. All of the above

4. PPC & PERT/CPM 313
Question Bowl
Answer: a. SOW (or Statement of Work)
A project starts with a written description of the objectives to be achieved, with a brief statement of the work to be done and a proposed schedule all contained in which of the following?
a. SOW
b. WBS
c. Early Start Schedule
d. Late Start Schedule
e. None of the above

4. PPC & PERT/CPM 314
Question Bowl
For some activities in a project there may be some leeway from when an activity can start and when it must finish. What is this period of time called when using the Critical Path Method?
a. Early start time
b. Late start time
c. Slack time
d. All of the above
e. None of the aboveAnswer: c. Slack time

4. PPC & PERT/CPM 315
Question Bowl
How much “slack time” is permitted in the “critical path” activity times?
a. Only one unit of time per activity b. No slack time is permittedc. As much as the maximum activity time in the
networkd. As much as is necessary to add up to the total
time of the projecte. None of the above
Answer: b. No slack time is permitted (All critical path activities must have zero slack time, otherwise they would not be critical to the project completion time.)

4. PPC & PERT/CPM 316
Question Bowl
When looking at the Time-Cost Trade Offs in the Minimum-Cost Scheduling time-cost model, we seek to reduce the total time of a project by doing what to the least-cost activity choices?
a. Crashing them b. Adding slack timec. Subtracting slack timed. Adding project time e. None of the above
Answer: a. Crashing them (We “crash” the least-cost activity times to seek a reduced total time for the entire project and we do it step-wise as inexpensively as possible.)

4. PPC & PERT/CPM 317
UNIVERSITY QUESTIONS• Given data for a project
– Draw the network diagram and identify critical path. – Calculate project duration and total float for each activity. – Calculate standard deviation for critical path.
• 'Production Planning and Control is the key to the success of a business organisation'. Discuss the statement listing the various functions carried out under production planning & control and their purpose in brief.
• Given data for a project – Draw Network Diagram – Calculate project duration & determine critical path – Determine slack for each activity.
• Explain how production control functions are carried out in Mass Production (Give examples).• Given data for a project
– a) Draw the Network Diagram for the Project.– b) Determine the critical path and its duration.– c) Compute slack, earliest start time & earliest finish time.
• Narrate the functions of production Planning and control. Explain their objective clearly .
4. PPC & PERT/CPM 318
UNIVERSITY QUESTIONS …cont
• Given data for a project– Draw a network diagram.– Compute project completion time.– Identify critical path.
• 'Production, planning and control function involves balancing between Priority' (Demand) and capacity (Resources)'. Discuss the statement.
• Compare CPM and PERT method for project management. What do you understand by 'Network crashing'?
• Explain those functions of Production Planning & Control which enable a company to control cost of Production & Capacity utilization.
• Write short notes on any three: a) Aggregate Planning b) Line Balancing c) Scheduling d) Critical Path Method.

4. PPC & PERT/CPM 319
UNIVERSITY QUESTIONS…contd
• Following are the activities of a project: Activity Immediate Activity time in weeks Predecessor Most Most Most Activity Optimistic Likely Pessimistic A None 4 7 13 B A 6 9 11 C A 5 7 09 D B 3 5 07 E C 7 8 10 F D 2 3 05 G E 6 7 08 H F&G 2 3 04 a) Calculate the expected time of each activity [3] b) Draw the network and indicate the expected time on each activity. [7] c) Compute the earliest completion time of the project. [2] d) Identify the critical path in the diagram. [2]

4. PPC & PERT/CPM 320
UNIVERSITY QUESTIONS…contd
• a) Explain the term scheduling in Production Planning. [4]• b) What are the different types of scheduling? [4]• c) What considerations will you apply in "Scheduling" the jobs in Job-Production.
[6]
• Write short notes (Any three) : [14] a) Process.:-flow-chart. b) Control charts in Q.C.b) Control charts in Q.C. c) Spare- parts for maintenancec) Spare- parts for maintenance. d) Despatching in Production Control. • Distinguish between the following (any three) : a) Product and Services b) Routing and Scheduling. c) Statistical Quality Control and Statistical Process Control. c) Statistical Quality Control and Statistical Process Control. d) Inspection and Quality Control.d) Inspection and Quality Control. e) Method study and work measurement.e) Method study and work measurement.

4. PPC & PERT/CPM 321
UNIVERSITY QUESTIONS… contd
• What are the objectives of Production Planning and control. Enlist functions of Production Planning and Control.
• "Project control should always focus on critical path" comment.
Q4) The following information has been gathered for a project: Activity Activity Duration in Days Immediate Predecessor/s
A 12 -- B . 9 -- C 10 A D 10 B E 24 B F 10 A G 35 C H 40 D I 4 E, G, H J 7 F, I a) Draw the Network Diagram for the project b) Determine critical path for the project and compute project duration. c) Compute slack, EST (Earliest Start Time), EFT (Earliest Finish Time)

4. PPC & PERT/CPM 322
University Questions …contd
• The activities of a project and estimated time in days for each activity are given below:
Activity Optimistic Most Likely Pessimistic Time Time Time 1-2 2 5 8 1-4 4 19 28 1-5 5 11 17 2-3 3 9 27 2-6 3 9 15 3-6 2 5 14 4-6 3 6 15 5-7 1 4 7 5-8 2 5 14 6-8 6 12 30 7-8 2 5 8 a) Determine expected time for each activity. b) Draw Network Diagram and determine critical path. c) Calculate project duration and slack for each activity.

4. PPC & PERT/CPM 323
University Questions …contd
• Distinguish between following (ant three): (a) Job production and batch production.Job production and batch production. (b) Process Layout and Product Layout.(b) Process Layout and Product Layout. (c) Product and service.(c) Product and service. (d) (d) Production planning and Production control. (e) Statistical Quality Control and statistical process control.(e) Statistical Quality Control and statistical process control.


