Dynamic Geotechnical Laboratory Testing of Coal Combustion Products Kevin M. Foster 1 , Adrian Rodriguez-Marek 1 , Russell A. Green 1 , and Roberto L. Sanchez 2 1 Charles E. Via, Jr. Department of Civil and Environmental Engineering, Virginia Tech, Blacksburg, Virginia, USA 24061; 2 Coal Combustion Products – Projects & Engineering, Tennessee Valley Authority, Chattanooga, Tennessee, USA 37402 KEYWORDS: fly ash, cyclic triaxial testing, liquefaction, dynamic, seismic analysis, laboratory testing INTRODUCTION This paper discusses some of the work completed to date on a comprehensive geotechnical laboratory testing program Virginia Tech (VT) is performing as part of a research & development activity for the Tennessee Valley Authority (TVA). The purpose of the program is to investigate dynamic properties of coal combustion products (CCP), with a primary focus on coal fly ash and commingled ash waste containing a predominance of fly ash. The testing program will assist TVA in improving the state of practice in the geotechnical design and analysis of CCP disposal facilities. This includes assessing risks currently posed by CCP facilities in TVA's inventory. The program will improve understanding of geotechnical aspects of CCP, which until relatively recently have been studied infrequently and hence, are poorly understood. We identify both static liquefaction and seismically induced failures as the key areas of focus in this study, because of both the frequency of static failures of sluiced ash impoundments (e.g. the 2008 Kingston failure 1 ) and the historically under-appreciated risk from earthquakes in the central and Eastern United States (CEUS), where TVA operates many CCP disposal facilities. Advanced study of the dynamic aspects of CCP is important because many parts of the central & Eastern United States are characterized by moderate seismic hazard. This fact has been largely overlooked because of the CEUS' relatively low seismicity in recent decades, as compared with more seismically active regions (e.g. California). Despite the fact that earthquakes are not an everyday occurrence in the CEUS, the region has experienced several major earthquakes in recent history such as the New Madrid earthquake sequence of 1811-1812 10 and the Great Charleston Earthquake of 1886 7,19 . The former comprised earthquakes of magnitudes estimated between 7 and 8; the latter had an estimated magnitude of 7.3 and caused substantial damage and loss of life in Charleston, South Carolina. CCP from Appalachian coal power plants, sluiced ash ponds, and dry stacks were collected. Standard geotechnical characterization tests, scanning electron microscopy
Transcript
Dynamic Geotechnical Laboratory Testing of Coal Combustion Products
Kevin M. Foster1, Adrian Rodriguez-Marek1, Russell A. Green1, and Roberto L. Sanchez2 1Charles E. Via, Jr. Department of Civil and Environmental Engineering, Virginia Tech, Blacksburg, Virginia, USA 24061; 2Coal Combustion Products – Projects & Engineering, Tennessee Valley Authority, Chattanooga, Tennessee, USA 37402 KEYWORDS: fly ash, cyclic triaxial testing, liquefaction, dynamic, seismic analysis, laboratory testing INTRODUCTION This paper discusses some of the work completed to date on a comprehensive geotechnical laboratory testing program Virginia Tech (VT) is performing as part of a research & development activity for the Tennessee Valley Authority (TVA). The purpose of the program is to investigate dynamic properties of coal combustion products (CCP), with a primary focus on coal fly ash and commingled ash waste containing a predominance of fly ash. The testing program will assist TVA in improving the state of practice in the geotechnical design and analysis of CCP disposal facilities. This includes assessing risks currently posed by CCP facilities in TVA's inventory. The program will improve understanding of geotechnical aspects of CCP, which until relatively recently have been studied infrequently and hence, are poorly understood. We identify both static liquefaction and seismically induced failures as the key areas of focus in this study, because of both the frequency of static failures of sluiced ash impoundments (e.g. the 2008 Kingston failure1) and the historically under-appreciated risk from earthquakes in the central and Eastern United States (CEUS), where TVA operates many CCP disposal facilities. Advanced study of the dynamic aspects of CCP is important because many parts of the central & Eastern United States are characterized by moderate seismic hazard. This fact has been largely overlooked because of the CEUS' relatively low seismicity in recent decades, as compared with more seismically active regions (e.g. California). Despite the fact that earthquakes are not an everyday occurrence in the CEUS, the region has experienced several major earthquakes in recent history such as the New Madrid earthquake sequence of 1811-181210 and the Great Charleston Earthquake of 18867,19. The former comprised earthquakes of magnitudes estimated between 7 and 8; the latter had an estimated magnitude of 7.3 and caused substantial damage and loss of life in Charleston, South Carolina. CCP from Appalachian coal power plants, sluiced ash ponds, and dry stacks were collected. Standard geotechnical characterization tests, scanning electron microscopy
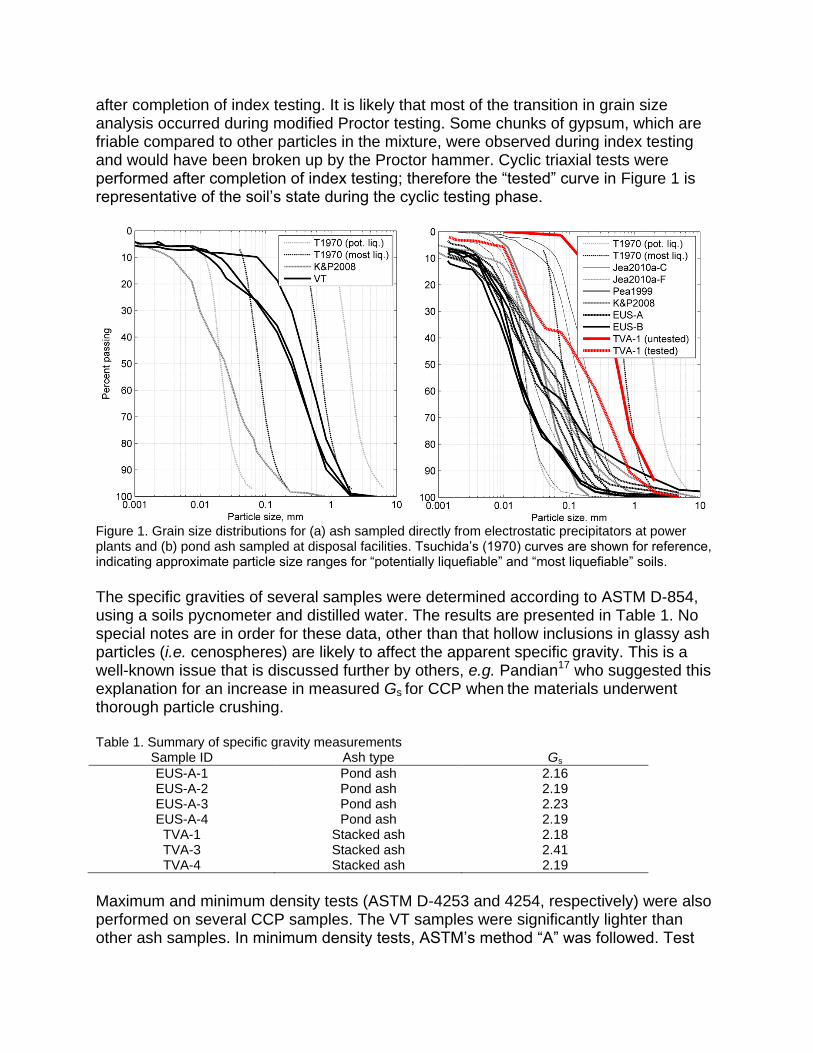
and energy dispersive X-ray spectroscopy were performed. Sample preparation techniques were investigated. Dynamic testing is underway, and is comprised of both cyclic triaxial testing for liquefaction resistance and fixed-free resonant column tests for shear modulus reduction and damping functions. The cyclic triaxial testing program is discussed in detail herein. Special attention is given in this study to the effects of soil fabric, which is known to be an important factor affecting liquefaction susceptibility3,16. Given the unconventional nature of CCP (as compared to natural soils) an understanding of fabric is especially important, as certain assumptions of conventional geotechnical analysis do not necessarily apply to CCP. Accordingly, we devoted substantial effort to evaluating sample preparation technique and checking for uniform specimens. In the dynamic testing program, 10 cyclic triaxial tests have been performed to date on an ash samples procured from a CEUS CCP disposal facility. Some technical problems with the automated test apparatus are discussed. We emphasize that the results presented in this progress paper are preliminary and should not be used for engineering design, research or meta-analysis. SAMPLING CCP samples were collected from ash disposal sites operated by TVA and others. We made site visits to three facilities operated by the TVA and collected disturbed CCP samples at each site by shoveling. These samples included bottom ash, commingled ash from dry stacks, and material from the banks of ash ponds. These samples are identified with the prefix “TVA”. We collected fly ash obtained directly from the electrostatic precipitators at a small coal burning power plant located on VT campus; these samples are identified with the prefix “VT”. Finally, we obtained bulk CCP samples in the form of drill cuttings, obtained from two non-TVA CCP disposal sites located in the eastern United States, where geotechnical subsurface investigations were being performed on abandoned ash ponds. These are identified with the prefix “EUS.” MATERIAL PROPERTIES Standard geotechnical characterization tasks were performed on some of the bulk CCP samples. This included grain size distribution by sieve and hydrometer testing, specific gravity, minimum and maximum density, modified Proctor compaction tests, imaging by scanning electron microscopy (SEM), and elemental characterization by energy-dispersive X-ray spectroscopy (EDS). Grain size distributions (ASTM D-422) are summarized in Figure 1, where particle sizes of our samples are plotted along with some curves reported by others. Samples collected from electrostatic precipitators and ash ponds are shown in plots (a) and (b), respectively. EUS pond samples are drill cuttings obtained from an abandoned pond, while TVA-1 was obtained by shoveling near an active pond. The “untested” curve for TVA-1 represents material as collected, while the “tested” curve represents material
after completion of index testing. It is likely that most of the transition in grain size analysis occurred during modified Proctor testing. Some chunks of gypsum, which are friable compared to other particles in the mixture, were observed during index testing and would have been broken up by the Proctor hammer. Cyclic triaxial tests were performed after completion of index testing; therefore the “tested” curve in Figure 1 is representative of the soil’s state during the cyclic testing phase.
Figure 1. Grain size distributions for (a) ash sampled directly from electrostatic precipitators at power plants and (b) pond ash sampled at disposal facilities. Tsuchida’s (1970) curves are shown for reference, indicating approximate particle size ranges for “potentially liquefiable” and “most liquefiable” soils.
The specific gravities of several samples were determined according to ASTM D-854, using a soils pycnometer and distilled water. The results are presented in Table 1. No special notes are in order for these data, other than that hollow inclusions in glassy ash particles (i.e. cenospheres) are likely to affect the apparent specific gravity. This is a well-known issue that is discussed further by others, e.g. Pandian17 who suggested this explanation for an increase in measured Gs for CCP when the materials underwent thorough particle crushing. Table 1. Summary of specific gravity measurements
Maximum and minimum density tests (ASTM D-4253 and 4254, respectively) were also performed on several CCP samples. The VT samples were significantly lighter than other ash samples. In minimum density tests, ASTM’s method “A” was followed. Test
results indicated a minimum density of about 33 pcf (0.54 Mg/m3) for the VT samples and 57 to 64 pcf (0.91 to 1.0 Mg/m3) for the other samples. For maximum density determinations, both “wet” and “dry” methods (ASTM section 11.1 and 11.2 respectively) were performed on several samples. For the tests performed, maximum density was about 46 pounds per cubic foot (pcf) (0.737 Mg/m3) for the VT samples. It varied from 70 to 85 pcf for the remaining samples tested. The migration of some finer particles above the surcharge plate occurred in both the “wet” and “dry” methods for maximum density may have influenced the measured densities to some degree. When maximum density was measured for the same soil using different methods (wet versus dry), the discrepancy was on the order of 1 to 3 pcf. Loss of airborne fines was a concern in tests performed using dry soil. In light of these observations, we proceeded by following Polito18 and using the optimum dry density from a modified Proctor test as an index of maximum density. This eliminated concerns of particle migration and may be more suitable for most of the ash tested in light of its relatively high fines content. Minimum density was measured by allowing a soil slurry to settle in a graduated cylinder.3 Maximum density values obtained from Proctor tests were typically about 4 pcf (0.06 Mg/m3) higher than those obtained by the ASTM methods. Minimum density values obtained from slurry settlement were in good agreement with those obtained by ASTM methods. As discussed above, we used the optimum dry density from the modified Proctor test (ASTM D-1557) to determine the maximum density of the CCP. The values of optimum moisture and dry density for the tests performed are presented in Table 2. Table 2. Optimum moisture contents and dry densities from ASTM D-1557.
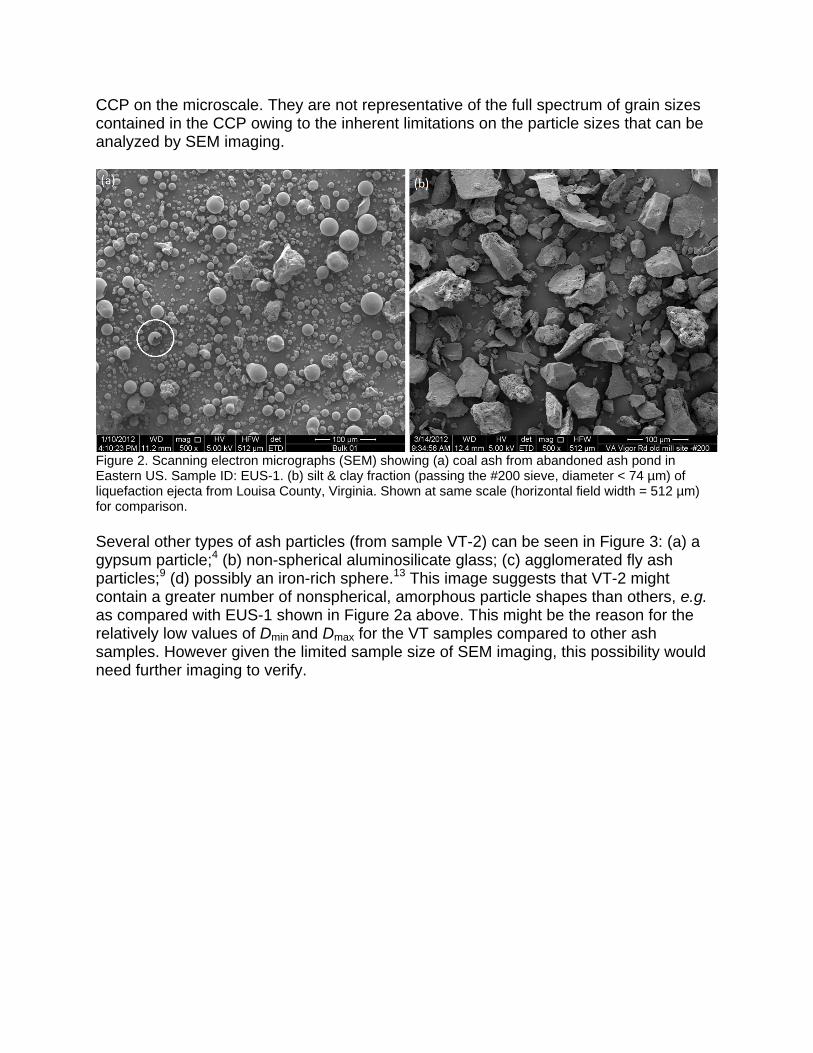
Scanning electron microscopy (SEM) and energy-dispersive X-ray spectroscopy (EDS) were used for additional qualitative characterization of some CCP samples. Figure 2 shows a same-scale comparison of (a) sample EUS-1 and (b) the fines fraction of a natural soil obtained from liquefaction ejecta following the 2011 Louisa County, Virginia earthquake. This image contains a visibly broken cenosphere (circled) and illustrates the predominantly spherical particle shape typical of fly ash. SEM images shown herein were acquired using the FEI Quanta 600 FEG environmental SEM system. The images show shape and size characteristics of the
CCP on the microscale. They are not representative of the full spectrum of grain sizes contained in the CCP owing to the inherent limitations on the particle sizes that can be analyzed by SEM imaging.
Figure 2. Scanning electron micrographs (SEM) showing (a) coal ash from abandoned ash pond in Eastern US. Sample ID: EUS-1. (b) silt & clay fraction (passing the #200 sieve, diameter < 74 µm) of liquefaction ejecta from Louisa County, Virginia. Shown at same scale (horizontal field width = 512 µm) for comparison.
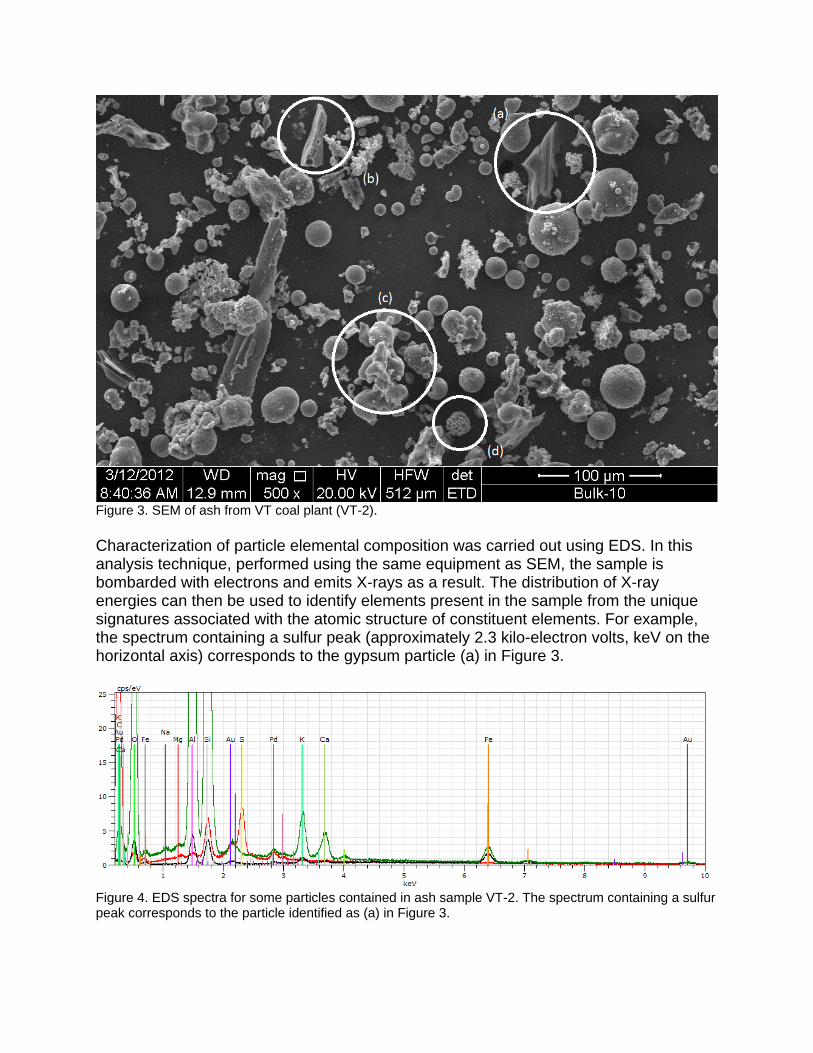
Several other types of ash particles (from sample VT-2) can be seen in Figure 3: (a) a gypsum particle;4 (b) non-spherical aluminosilicate glass; (c) agglomerated fly ash particles;9 (d) possibly an iron-rich sphere.13 This image suggests that VT-2 might contain a greater number of nonspherical, amorphous particle shapes than others, e.g. as compared with EUS-1 shown in Figure 2a above. This might be the reason for the relatively low values of Dmin and Dmax for the VT samples compared to other ash samples. However given the limited sample size of SEM imaging, this possibility would need further imaging to verify.
Figure 3. SEM of ash from VT coal plant (VT-2).
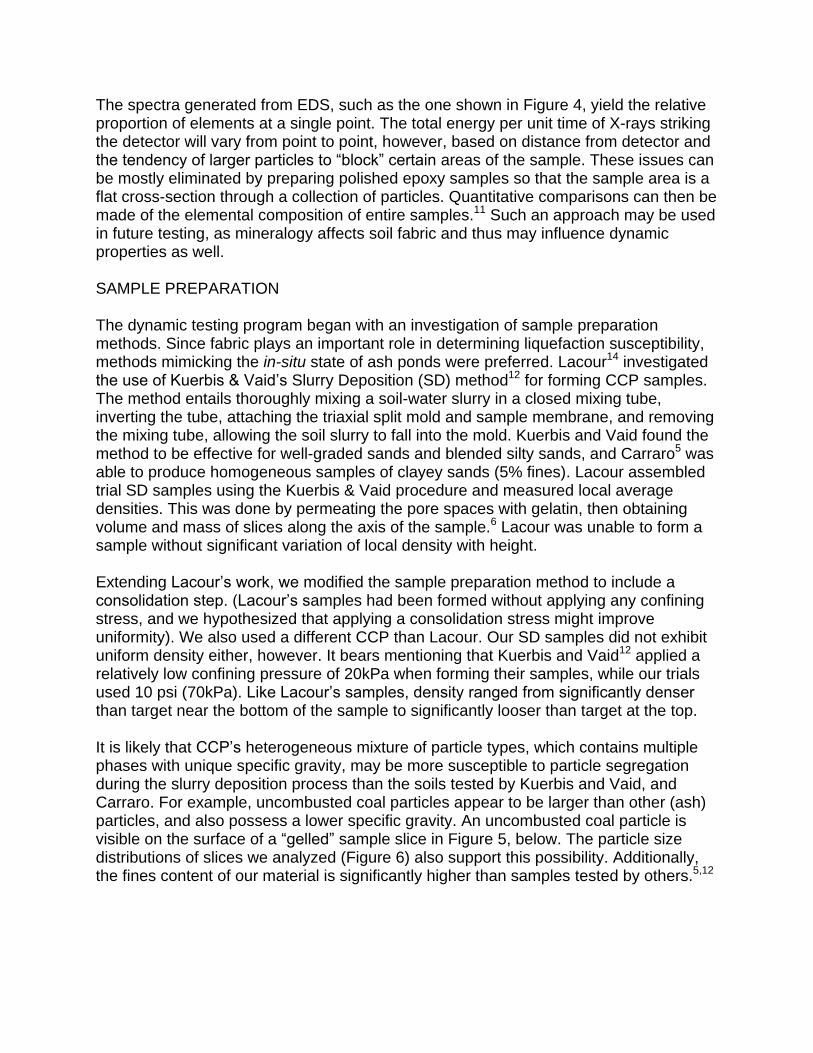
Characterization of particle elemental composition was carried out using EDS. In this analysis technique, performed using the same equipment as SEM, the sample is bombarded with electrons and emits X-rays as a result. The distribution of X-ray energies can then be used to identify elements present in the sample from the unique signatures associated with the atomic structure of constituent elements. For example, the spectrum containing a sulfur peak (approximately 2.3 kilo-electron volts, keV on the horizontal axis) corresponds to the gypsum particle (a) in Figure 3.
Figure 4. EDS spectra for some particles contained in ash sample VT-2. The spectrum containing a sulfur peak corresponds to the particle identified as (a) in Figure 3.
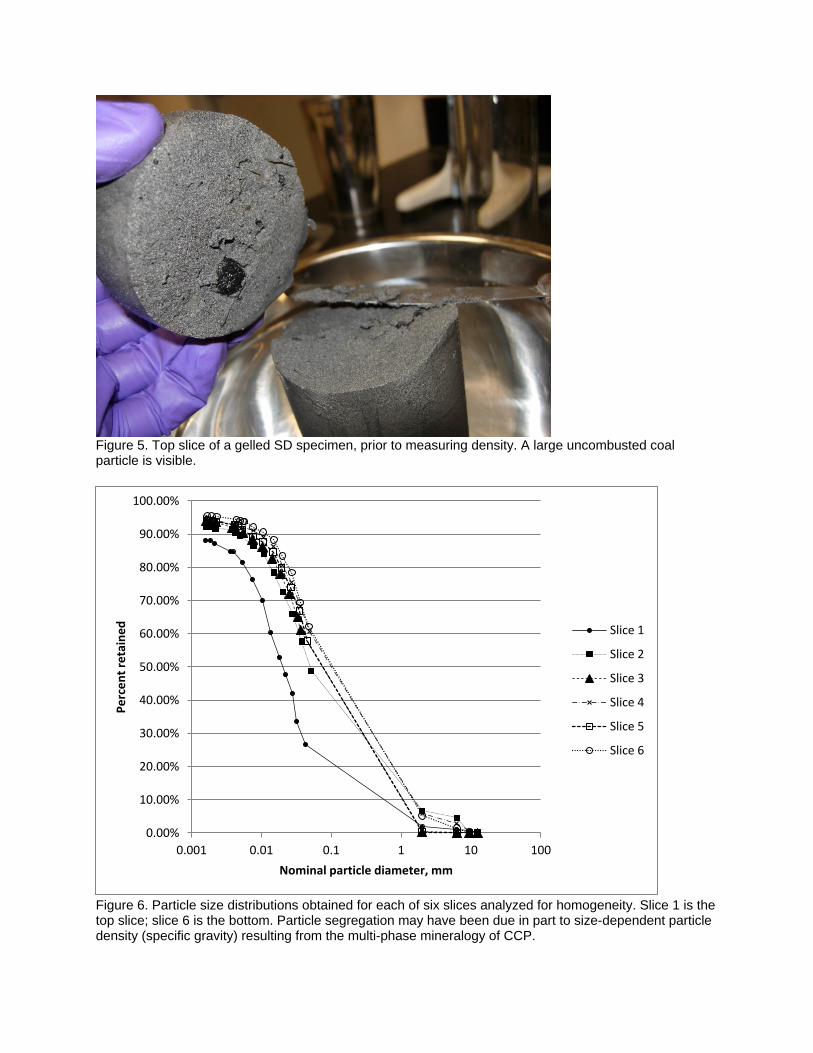
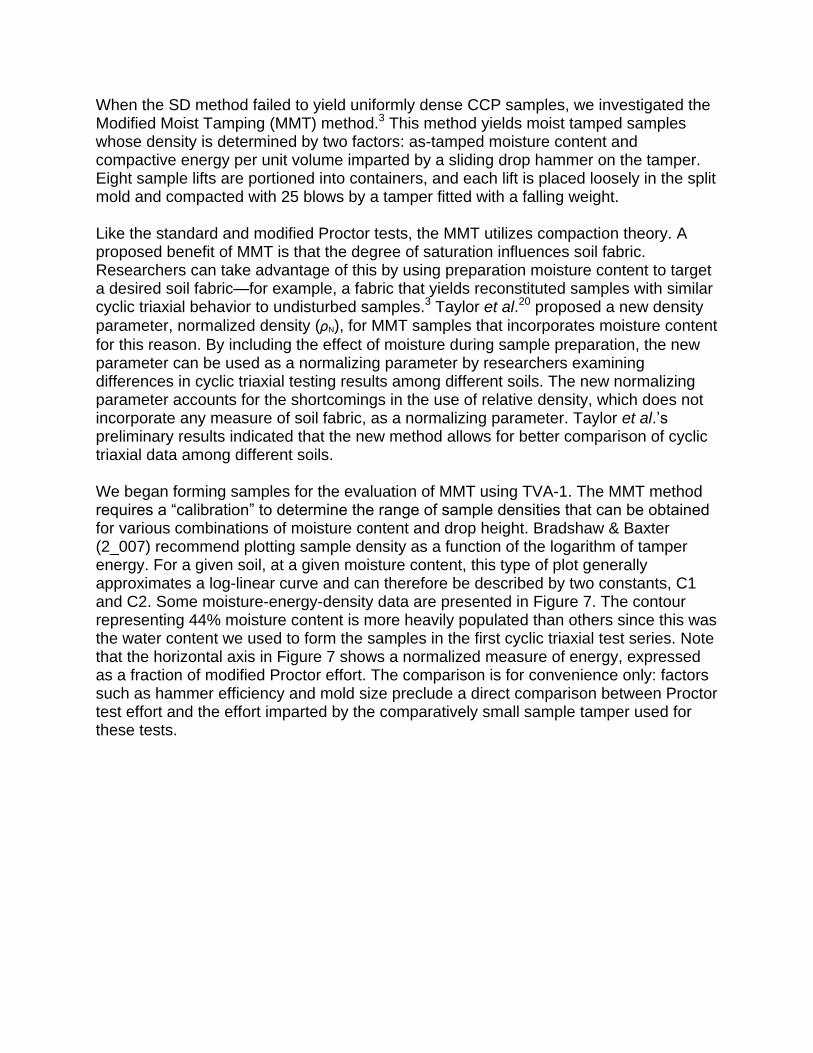
The spectra generated from EDS, such as the one shown in Figure 4, yield the relative proportion of elements at a single point. The total energy per unit time of X-rays striking the detector will vary from point to point, however, based on distance from detector and the tendency of larger particles to “block” certain areas of the sample. These issues can be mostly eliminated by preparing polished epoxy samples so that the sample area is a flat cross-section through a collection of particles. Quantitative comparisons can then be made of the elemental composition of entire samples.11 Such an approach may be used in future testing, as mineralogy affects soil fabric and thus may influence dynamic properties as well. SAMPLE PREPARATION The dynamic testing program began with an investigation of sample preparation methods. Since fabric plays an important role in determining liquefaction susceptibility, methods mimicking the in-situ state of ash ponds were preferred. Lacour14 investigated the use of Kuerbis & Vaid’s Slurry Deposition (SD) method12 for forming CCP samples. The method entails thoroughly mixing a soil-water slurry in a closed mixing tube, inverting the tube, attaching the triaxial split mold and sample membrane, and removing the mixing tube, allowing the soil slurry to fall into the mold. Kuerbis and Vaid found the method to be effective for well-graded sands and blended silty sands, and Carraro5 was able to produce homogeneous samples of clayey sands (5% fines). Lacour assembled trial SD samples using the Kuerbis & Vaid procedure and measured local average densities. This was done by permeating the pore spaces with gelatin, then obtaining volume and mass of slices along the axis of the sample.6 Lacour was unable to form a sample without significant variation of local density with height. Extending Lacour’s work, we modified the sample preparation method to include a consolidation step. (Lacour’s samples had been formed without applying any confining stress, and we hypothesized that applying a consolidation stress might improve uniformity). We also used a different CCP than Lacour. Our SD samples did not exhibit uniform density either, however. It bears mentioning that Kuerbis and Vaid12 applied a relatively low confining pressure of 20kPa when forming their samples, while our trials used 10 psi (70kPa). Like Lacour’s samples, density ranged from significantly denser than target near the bottom of the sample to significantly looser than target at the top. It is likely that CCP’s heterogeneous mixture of particle types, which contains multiple phases with unique specific gravity, may be more susceptible to particle segregation during the slurry deposition process than the soils tested by Kuerbis and Vaid, and Carraro. For example, uncombusted coal particles appear to be larger than other (ash) particles, and also possess a lower specific gravity. An uncombusted coal particle is visible on the surface of a “gelled” sample slice in Figure 5, below. The particle size distributions of slices we analyzed (Figure 6) also support this possibility. Additionally, the fines content of our material is significantly higher than samples tested by others.5,12
Figure 5. Top slice of a gelled SD specimen, prior to measuring density. A large uncombusted coal particle is visible.
Figure 6. Particle size distributions obtained for each of six slices analyzed for homogeneity. Slice 1 is the top slice; slice 6 is the bottom. Particle segregation may have been due in part to size-dependent particle density (specific gravity) resulting from the multi-phase mineralogy of CCP.
0.00%
10.00%
20.00%
30.00%
40.00%
50.00%
60.00%
70.00%
80.00%
90.00%
100.00%
0.001 0.01 0.1 1 10 100
Pe
rce
nt
reta
ine
d
Nominal particle diameter, mm
Slice 1
Slice 2
Slice 3
Slice 4
Slice 5
Slice 6
When the SD method failed to yield uniformly dense CCP samples, we investigated the Modified Moist Tamping (MMT) method.3 This method yields moist tamped samples whose density is determined by two factors: as-tamped moisture content and compactive energy per unit volume imparted by a sliding drop hammer on the tamper. Eight sample lifts are portioned into containers, and each lift is placed loosely in the split mold and compacted with 25 blows by a tamper fitted with a falling weight. Like the standard and modified Proctor tests, the MMT utilizes compaction theory. A proposed benefit of MMT is that the degree of saturation influences soil fabric. Researchers can take advantage of this by using preparation moisture content to target a desired soil fabric—for example, a fabric that yields reconstituted samples with similar cyclic triaxial behavior to undisturbed samples.3 Taylor et al.20 proposed a new density
parameter, normalized density (ρN), for MMT samples that incorporates moisture content
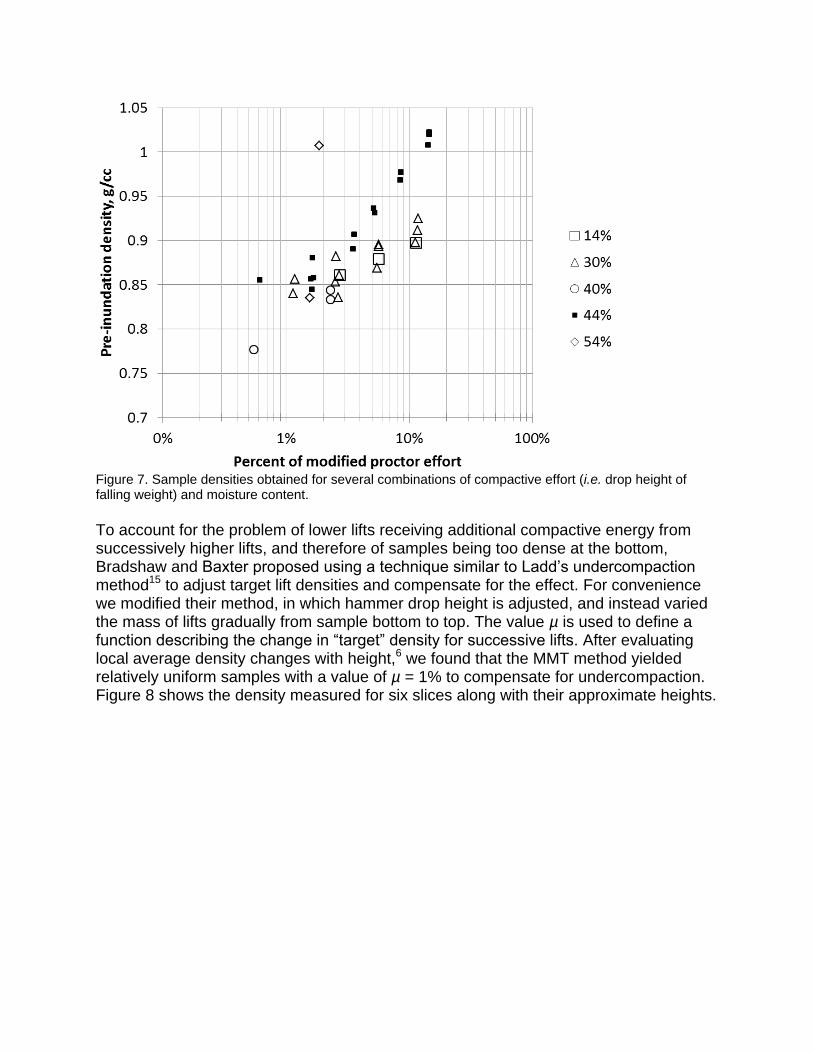
for this reason. By including the effect of moisture during sample preparation, the new parameter can be used as a normalizing parameter by researchers examining differences in cyclic triaxial testing results among different soils. The new normalizing parameter accounts for the shortcomings in the use of relative density, which does not incorporate any measure of soil fabric, as a normalizing parameter. Taylor et al.’s preliminary results indicated that the new method allows for better comparison of cyclic triaxial data among different soils. We began forming samples for the evaluation of MMT using TVA-1. The MMT method requires a “calibration” to determine the range of sample densities that can be obtained for various combinations of moisture content and drop height. Bradshaw & Baxter (2_007) recommend plotting sample density as a function of the logarithm of tamper energy. For a given soil, at a given moisture content, this type of plot generally approximates a log-linear curve and can therefore be described by two constants, C1 and C2. Some moisture-energy-density data are presented in Figure 7. The contour representing 44% moisture content is more heavily populated than others since this was the water content we used to form the samples in the first cyclic triaxial test series. Note that the horizontal axis in Figure 7 shows a normalized measure of energy, expressed as a fraction of modified Proctor effort. The comparison is for convenience only: factors such as hammer efficiency and mold size preclude a direct comparison between Proctor test effort and the effort imparted by the comparatively small sample tamper used for these tests.
Figure 7. Sample densities obtained for several combinations of compactive effort (i.e. drop height of falling weight) and moisture content.
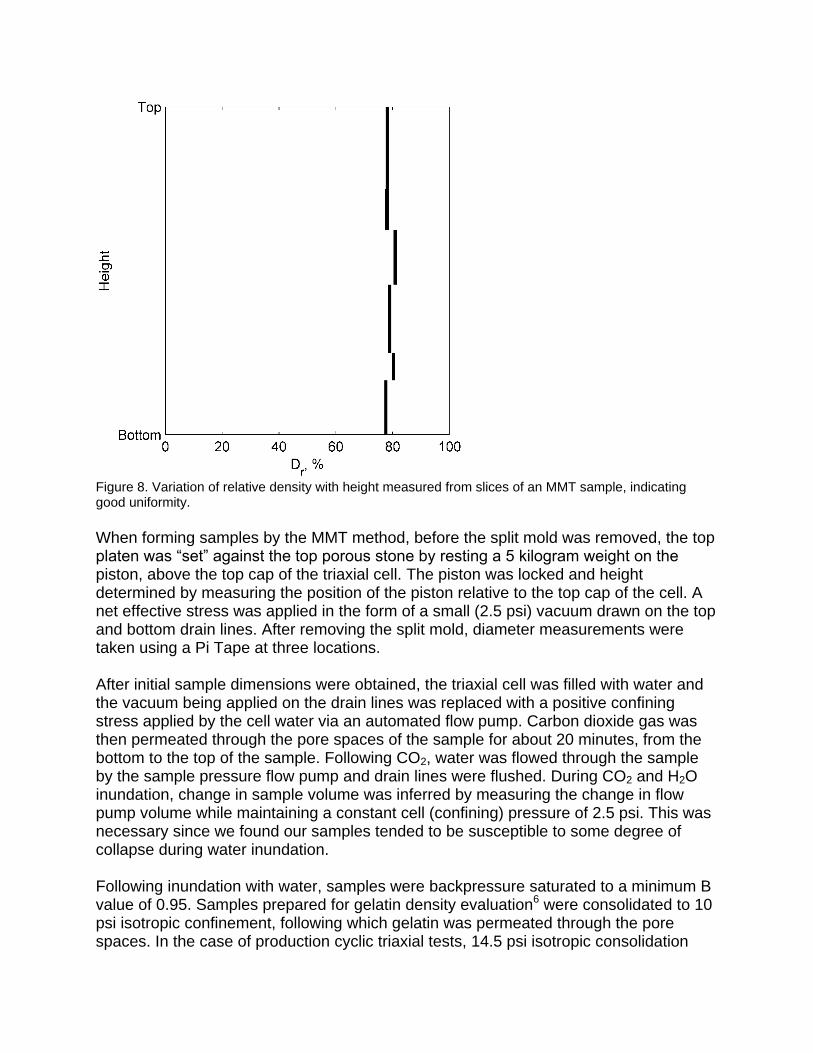
To account for the problem of lower lifts receiving additional compactive energy from successively higher lifts, and therefore of samples being too dense at the bottom, Bradshaw and Baxter proposed using a technique similar to Ladd’s undercompaction method15 to adjust target lift densities and compensate for the effect. For convenience we modified their method, in which hammer drop height is adjusted, and instead varied the mass of lifts gradually from sample bottom to top. The value µ is used to define a function describing the change in “target” density for successive lifts. After evaluating local average density changes with height,6 we found that the MMT method yielded relatively uniform samples with a value of µ = 1% to compensate for undercompaction. Figure 8 shows the density measured for six slices along with their approximate heights.
Figure 8. Variation of relative density with height measured from slices of an MMT sample, indicating good uniformity.
When forming samples by the MMT method, before the split mold was removed, the top platen was “set” against the top porous stone by resting a 5 kilogram weight on the piston, above the top cap of the triaxial cell. The piston was locked and height determined by measuring the position of the piston relative to the top cap of the cell. A net effective stress was applied in the form of a small (2.5 psi) vacuum drawn on the top and bottom drain lines. After removing the split mold, diameter measurements were taken using a Pi Tape at three locations. After initial sample dimensions were obtained, the triaxial cell was filled with water and the vacuum being applied on the drain lines was replaced with a positive confining stress applied by the cell water via an automated flow pump. Carbon dioxide gas was then permeated through the pore spaces of the sample for about 20 minutes, from the bottom to the top of the sample. Following CO2, water was flowed through the sample by the sample pressure flow pump and drain lines were flushed. During CO2 and H2O inundation, change in sample volume was inferred by measuring the change in flow pump volume while maintaining a constant cell (confining) pressure of 2.5 psi. This was necessary since we found our samples tended to be susceptible to some degree of collapse during water inundation. Following inundation with water, samples were backpressure saturated to a minimum B value of 0.95. Samples prepared for gelatin density evaluation6 were consolidated to 10 psi isotropic confinement, following which gelatin was permeated through the pore spaces. In the case of production cyclic triaxial tests, 14.5 psi isotropic consolidation
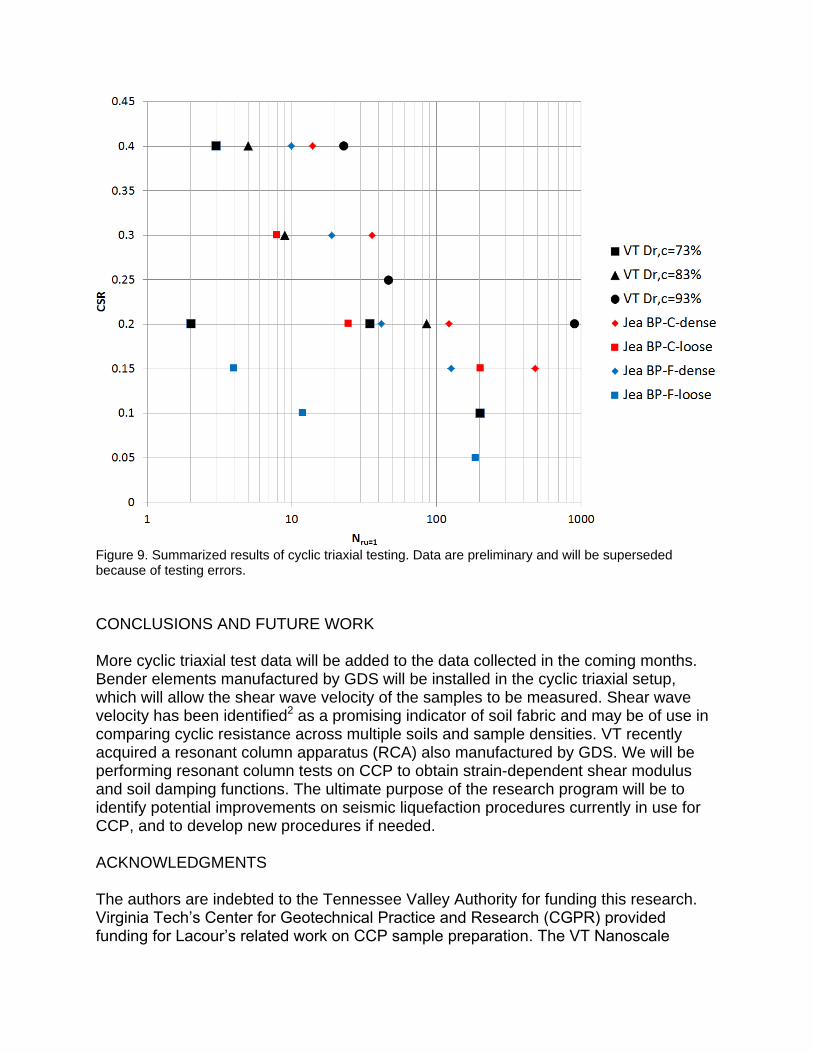
(100 kPa) was applied. The consolidation stress was held for at least 30 minutes, long enough for primary consolidation to be completed. CYCLIC TRIAXIAL TESTS A series of cyclic triaxial tests were conducted using the MMT sample preparation technique, as described in the previous section. The tests were performed using a consolidation stress of 100 kPa (~= 1 atm). Summary test data are provided in Table 3 and Figure 9. The plot in Figure 9 also contains cyclic triaxial data obtained by other researchers. Due to equipment-related problems, the data presented in Table 3 and Figure 9 are preliminary only. Problematic datapoints will be superseded in future testing. At present the expected trend of increasing liquefaction resistance with density can be observed. Cyclic strength of this material appears generally higher than other CCP. The points identified as “Jea” represent Jakka et al.’s cyclic testing program on Indian pond ash.8 Our cyclic resistance curves fall in roughly the same zone as theirs with the exception of series BP-F-loose, which are markedly lower. In Jakka et al.’s data series, “C” and “F” indicate coarse and fine ash mixes, obtained from pond inflow and outflow areas respectively. Table 3. Summary data from cyclic triaxial testing.
Figure 9. Summarized results of cyclic triaxial testing. Data are preliminary and will be superseded because of testing errors.
CONCLUSIONS AND FUTURE WORK More cyclic triaxial test data will be added to the data collected in the coming months. Bender elements manufactured by GDS will be installed in the cyclic triaxial setup, which will allow the shear wave velocity of the samples to be measured. Shear wave velocity has been identified2 as a promising indicator of soil fabric and may be of use in comparing cyclic resistance across multiple soils and sample densities. VT recently acquired a resonant column apparatus (RCA) also manufactured by GDS. We will be performing resonant column tests on CCP to obtain strain-dependent shear modulus and soil damping functions. The ultimate purpose of the research program will be to identify potential improvements on seismic liquefaction procedures currently in use for CCP, and to develop new procedures if needed. ACKNOWLEDGMENTS The authors are indebted to the Tennessee Valley Authority for funding this research. Virginia Tech’s Center for Geotechnical Practice and Research (CGPR) provided funding for Lacour’s related work on CCP sample preparation. The VT Nanoscale
Characterization and Fabrication Laboratory (NCFL)’s Steve McCartney provided training and guidance in SEM and EDS analyses. Aaron Bradshaw of University of Rhode Island provided much appreciated guidance on sample preparation issues. Rachid Hankour of Geocomp has offered troubleshooting advice with the automated testing equipment and is working closely with VT on identifying solutions to issues encountered in testing. Janna Bonfiglio assisted with characterization testing. REFERENCES
[1] AECOM, 2009. Root Cause Analysis of TVA Kingston Dredge Pond Failure on December 22, 2008. Volume I - Summary Report.
[2] Baxter CDP, Bradshaw AS, Green RA, Wang J., 2008. Correlation between Cyclic Resistance and Shear-Wave Velocity for Providence Silts. Journal of Geotechnical and Geoenvironmental Engineering. 134(1):37–46.
[3] Bradshaw A, Baxter C., 2008. Sample Preparation of Silts for Liquefaction Testing. Geotechnical Testing Journal. 30(4):1–9.
[4] CAER (University of Kentucky Center for Applied Energy Research), 2010. What are coal combustion by-products (CCBs): Synthetic gypsum. Kentucky Ash Education Site. Available at: http://www.caer.uky.edu/kyasheducation/gypsum.shtml .
[5] Carraro JAH, 2004. Mechanical behavior of silty and clayey sands.
[6] Emery J, Finn W, Lee K., 1973. Uniformity of saturated sand specimens. In: Evaluation of Relative Density and Its Role in Geotechnical Projects Involving Cohesionless Soils, ASTM STP 523. American Society for Testing and Materials; 182–194.
[7] Von Hake CA, 1976. South Carolina earthquake history. Earthquake Information Bulletin 8(6). Reston, Virginia: USGS. Available at: http://earthquake.usgs.gov/earthquakes/states/south_carolina/history.php.
[8] Jakka RS, Datta M, Ramana GV, 2010. Liquefaction behaviour of loose and compacted pond ash. Soil Dynamics and Earthquake Engineering. 30(7):580–590.
[9] Jakka RS, Ramana G V., Datta M., 2010. Shear Behaviour of Loose and Compacted Pond Ash. Geotechnical and Geological Engineering. 28(6):763–778.
[10] Johnston AC, Schweig ES, 1996. The enigma of the New Madrid Earthquakes of 1811-1812. Annual Review of Earth and Planetary Sciences. 24:339–84.
[11] Knight, R. Klassen, P. Hunt R., 2002. Mineralogy of fine-grained sediment by energy-dispersive spectrometry (EDS) image analysis – a methodology. Environmental Geology. 42:32–40.
[12] Kuerbis R, Vaid YP, 1988. Sand sample preparation - the slurry deposition method. Soils and Foundations. 28(4):107–118.
[13] Kutchko B, Kim A., 2006. Fly ash characterization by SEM–EDS. Fuel. 85:2537–2544.
[14] Lacour NA, 2012. Engineering Characteristics of Coal Combustion Residuals and a Reconstitution Technique for Triaxial Samples.
[15] Ladd R., 1978. Preparing test specimens using undercompaction. ASTM geotechnical testing journal. 1(1):16–23.
[16] Mulilis JP, Arulanandan K, Mitchell JK, Chan CK, Seed HB, 1977. Effects of sample preparation on sand liquefaction. Journal of the Geotechnical Engineering Division of ASCE. 103(2):91–108.
[17] Pandian NS, Rajasekhar C, Sridharan A, 1998. Studies of the specific gravity of some Indian coal ashes. Journal of testing and evaluation. 26(3):177–186.
[18] Polito CP, 1999. The Effects Of Non-Plastic and Plastic Fines On The Liquefaction Of Sandy Soils.
[19] Taber S., 1914. Seismic activity in the Atlantic Coastal Plain near Charleston, South Carolina. Bulletin of the Seismological Society of America. 4(3):108–160.
[20] Taylor O, Baxter C., 2012. New Density Normalization Approach for Evaluation of the Cyclic Resistance of Silts. In: GeoCongress 2012. ASCE. 809–818.