338 IEEE JOURNAL OF OCEANIC ENGINEERING, VOL. 37, NO. 3, JULY 2012
Using an Autonomous Underwater Vehicle to Track aCoastal Upwelling Front
Yanwu Zhang, Senior Member, IEEE, Michael A. Godin, James G. Bellingham, Member, IEEE, and John P. Ryan
Abstract—Coastal upwelling is a wind-driven ocean process.It brings cooler, saltier, and usually nutrient-rich deep waterupward to replace surface water displaced offshore due to Ekmantransport. The nutrients carried up by upwelling are importantfor primary production and fisheries. Ocean life can aggregate atthe boundary between stratified water and upwelling water—theupwelling front. In an upwelling water column, temperature,salinity, and other water properties are much more homogeneousover depth than in stratified water. Drawing on this difference, weset up a key measure for differentiating upwelling and stratifiedwater columns—the vertical temperature difference betweenshallow and deep depths. The vertical temperature difference islarge in stratified water but small in upwelling water. Based on thisclassifier, we developed a method for an autonomous underwatervehicle (AUV) to autonomously detect and track an upwellingfront. During the Controlled, Agile, and Novel Observing Network(CANON) Experiment in April 2011, the Tethys long-range AUVran the algorithm to autonomously track an upwelling front in adynamic coastal upwelling region in Monterey Bay, CA. The AUVtransected the upwelling front 14 times over two days, providinga very high-resolution depiction of the front.
Index Terms—Autonomous underwater vehicle (AUV), up-welling front, tracking.
I. INTRODUCTION
A N ocean front delineates the boundary between watermasses distinguished by different physical, chemical,
and/or biological characteristics. Ocean ecosystems are greatlyinfluenced by the structure and dynamics of fronts [1]. Oceanfronts also play an important role in air–sea exchange [2],[3]. Detection and tracking of ocean fronts are important forinvestigating the formation, evolution, and interaction of oceanwater masses. Knowing the boundary between these watermasses enables targeted sampling of the respective waters.As surface water is warmed by sunlight, temperature at
surface is higher than at depth, so density increases withdepth, forming a stratified water column that is gravitationallystable [4]. Coastal upwelling [5], as illustrated in Fig. 1, isa wind-driven ocean process that breaks stratification thusmaking water more homogeneous over depth. Suppose anortherly (i.e., from the north) wind blows along a north–southcoastline in the northern hemisphere. The wind stress plus theeffect of Earth’s rotation will lead to a net transport of surface
Manuscript received September 14, 2011; revised March 02, 2012; acceptedApril 21, 2012. Date of publication June 06, 2012; date of current version July10, 2012. This work was supported by the David and Lucile Packard Founda-tion.Associate Editor: W. M. Carey.The authors are with the Monterey Bay Aquarium Research Institute, Moss
Landing, CA 95039 USA (e-mail: [email protected]).Digital Object Identifier 10.1109/JOE.2012.2197272
Fig. 1. Illustration of a northerly wind driving upwelling along a north–southcoastline in the northern hemisphere.
water offshore, called Ekman transport [6]. To conserve mass,deep water wells up to replace the displaced surface water.Upwelling brings cooler, saltier, and usually nutrient-rich deepwater upward, replacing warmer, fresher, and nutrient-depletedsurface water. The nutrients carried up by upwelling havesignificant impact on primary production and fisheries.When a northwesterly wind persists in spring and summer
along the California coastline, intense upwelling takes placeat Point Año Nuevo (to the northwest of Monterey Bay, CA;see Fig. 2) [7]. For instance, during the April 2011 Controlled,Agile, and Novel Observing Network (CANON) Experiment,upwelling of cold deep water to the surface was manifested bylow sea surface temperature (SST) at Point Año Nuevo andin the upwelling filaments spreading southward from PointAño Nuevo, as displayed in Fig. 2. Due to the presence of amountain range along the northern coast, the northern MontereyBay is less exposed to the strong northwesterly wind forcingthat drives upwelling along the coast. The northern bay is alsosheltered from the prevailing southward flow of upwellingfilaments (from Point Año Nuevo) by its coastal recess. Suchatmospheric and oceanic sheltering, as well as bay circulationpatterns, causes enhanced residence time and local heatingin the northern bay, a region described as the Monterey Bay“upwelling shadow” [1], [8], [9], manifested by relatively highSST in the northern bay, as displayed in Fig. 2. The boundarybetween the stratified water in the upwelling shadow and theunstratified water transported southward from the Point AñoNuevo upwelling center is called the “upwelling front.” Up-welling fronts support enriched phytoplankton and zooplanktonpopulations [1], [10], thus having great influences on oceanecosystems. The SST images in Fig. 2 also demonstrate thedynamic evolution of the upwelling front over a two-day periodin April 2011. Note that satellite SST only provides the surfaceexpression of upwelling processes. Also, the large data interval(on the order of a day) renders satellite SST data insufficientfor providing high-resolution tracking of frontal dynamics.
ZHANG et al.: USING AN AUTONOMOUS UNDERWATER VEHICLE TO TRACK A COASTAL UPWELLING FRONT 339
Fig. 2. Sea surface temperature (SST) in Monterey Bay, CA from April 27 to 29 during the April 2011 CANON Experiment. Point Año Nuevo (to the northwestof Monterey Bay) is marked by the black arrow in the left panel. The Tethys AUV’s horizontal trajectory in tracking the upwelling front [from April 27 12:12:00to April 29 15:22:00 (PDT)] is shown by the black lines (see Section III). Advanced Very High Resolution Radiometer (AVHRR) SST data courtesy of KudelaLab. (University of California at Santa Cruz) and the National Oceanographic and Atmospheric Administration (NOAA) CoastWatch. Longitude: West. Latitude:North.
Autonomous underwater vehicles (AUVs) can be effectivelyused for studying ocean fronts. In the 1996 Haro Strait FrontalDynamics Experiment [11], [12], twoMassachusetts Institute ofTechnology (MIT, Cambridge) Odyssey-class AUVs were de-ployed along with surface ships and drifters in a coordinatedeffort to map the tidal fronts. The AUVs conducted high-reso-lution surveys of temperature, salinity, and current velocity inthe frontal regions [13], [14]. For frontal mapping by acoustictomography [11], an acoustic source was also installed on onevehicle. During the experiment, the Harvard Ocean PredictionSystem (HOPS) ocean model [15] was run to predict the front’slocation, which guided the AUVs’ deployment. However, theAUVs did not possess the ability to autonomously detect thefront.In [16]–[22], AUVs were used to detect and track the thermo-
cline based on the temperature gradient in the vertical dimen-sion. In [23], an autonomous surface craft was used to estimatethe direction of the horizontal thermal gradient based on tem-perature measurements. In [24], an adaptive control capabilitywas demonstrated for enabling three gliders to move in a trian-gular formation toward a low-temperature region in MontereyBay.A prior effort aimed at detection and tracking of fronts in
Monterey Bay involved an approach called “mixed initiative”[25]. This approach begins with an AUV conducting a recon-naissance survey and sending a compressed data set back to ascientist onshore via satellite. The scientist examines the data forthe presence of a front and derives parameters that will permitthe AUV to locate the center of the front: 1) the depth at whichto transit during the search; and 2) the water temperature atthe center of the front at the search depth. This data-informed
human initiative is relayed back to the AUV and thereafter in-tegrated with machine initiative for the AUV to track the frontusing a repeated sequence of localization and mapping. Thesecapabilities successfully demonstrated adaptive control of anAUV using onboard planning and execution. However, the re-quirement for a human in the loop imposes limitations.We have developed two different methods for an AUV to au-
tonomously detect and track an upwelling front. One method isfor an AUV to detect and accurately locate an upwelling frontbased on the horizontal gradient of the vertical temperature dif-ference between shallow and deep depths [26]. The algorithmwas successfully run on the Dorado AUV for triggering watersamplings within a narrow upwelling front in Monterey Bay,during the June 2011 CANON Experiment. Another method,initially reported in [27] and fully presented in this paper, isfor an AUV to recognize that it has departed from a strati-fied water column and entered an upwelling water column (orconversely), and accordingly track the front between the twodistinct water columns. The AUV distinguishes between thetwo types of water columns based on their distinction in ver-tical homogeneity of temperature. The algorithm is presented inSection II. In the April 2011 CANON Experiment, the TethysAUV [28] ran our algorithm to track an upwelling front in Mon-terey Bay, as described in Section III. We propose future workin Section IV.
II. AN AUV ALGORITHM FOR TRACKINGAN UPWELLING FRONT
The different vertical temperature structures in stratified andupwelling water columns, and in the narrow front between them,are illustrated in Fig. 3. The key to classification is finding the
340 IEEE JOURNAL OF OCEANIC ENGINEERING, VOL. 37, NO. 3, JULY 2012
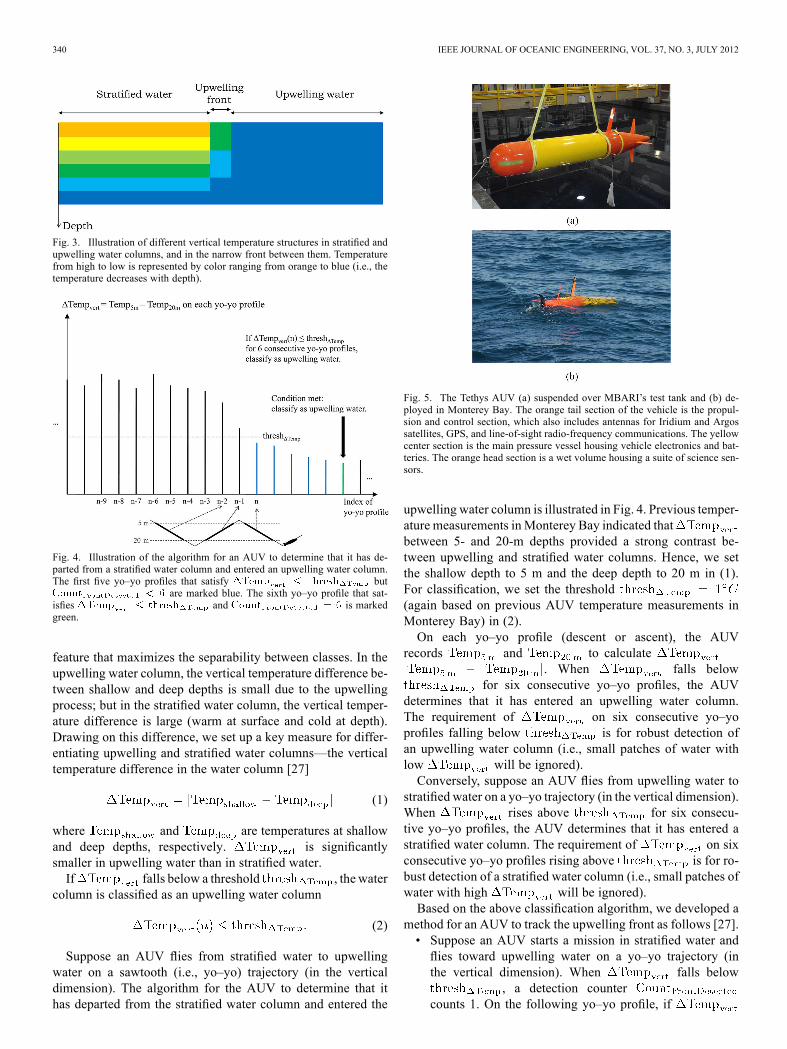
Fig. 3. Illustration of different vertical temperature structures in stratified andupwelling water columns, and in the narrow front between them. Temperaturefrom high to low is represented by color ranging from orange to blue (i.e., thetemperature decreases with depth).
Fig. 4. Illustration of the algorithm for an AUV to determine that it has de-parted from a stratified water column and entered an upwelling water column.The first five yo–yo profiles that satisfy but
are marked blue. The sixth yo–yo profile that sat-isfies and is markedgreen.
feature that maximizes the separability between classes. In theupwelling water column, the vertical temperature difference be-tween shallow and deep depths is small due to the upwellingprocess; but in the stratified water column, the vertical temper-ature difference is large (warm at surface and cold at depth).Drawing on this difference, we set up a key measure for differ-entiating upwelling and stratified water columns—the verticaltemperature difference in the water column [27]
(1)
where and are temperatures at shallowand deep depths, respectively. is significantlysmaller in upwelling water than in stratified water.If falls below a threshold , the water
column is classified as an upwelling water column
(2)
Suppose an AUV flies from stratified water to upwellingwater on a sawtooth (i.e., yo–yo) trajectory (in the verticaldimension). The algorithm for the AUV to determine that ithas departed from the stratified water column and entered the
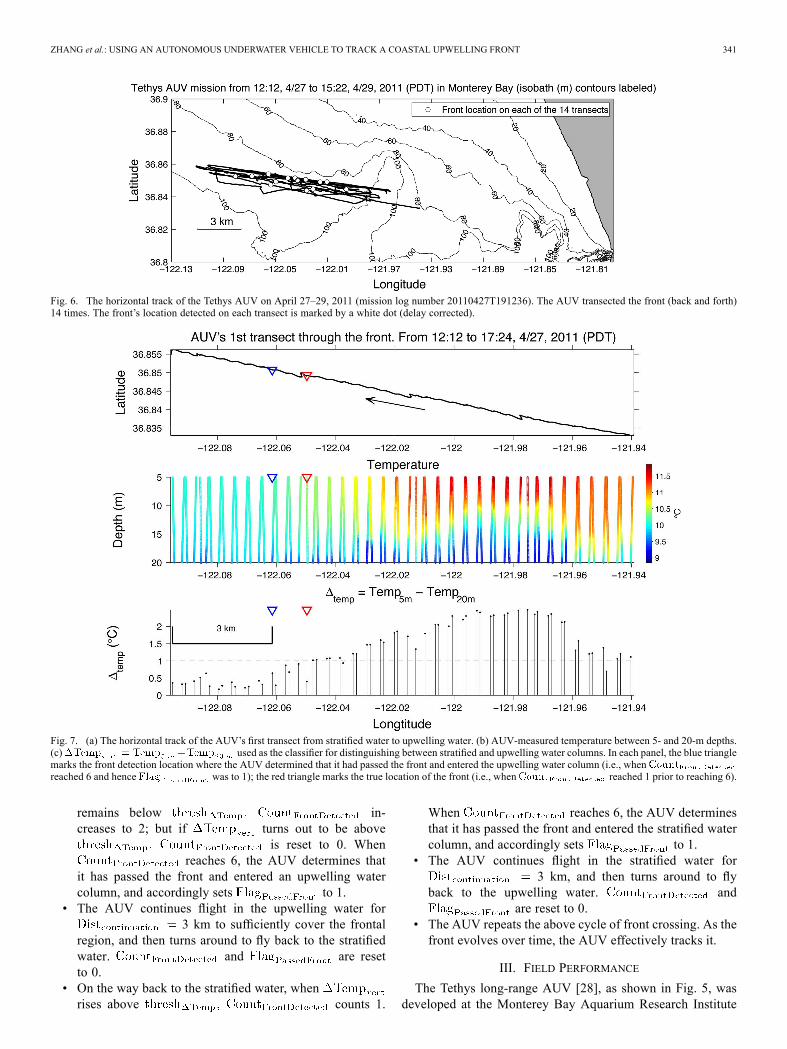
Fig. 5. The Tethys AUV (a) suspended over MBARI’s test tank and (b) de-ployed in Monterey Bay. The orange tail section of the vehicle is the propul-sion and control section, which also includes antennas for Iridium and Argossatellites, GPS, and line-of-sight radio-frequency communications. The yellowcenter section is the main pressure vessel housing vehicle electronics and bat-teries. The orange head section is a wet volume housing a suite of science sen-sors.
upwelling water column is illustrated in Fig. 4. Previous temper-ature measurements in Monterey Bay indicated thatbetween 5- and 20-m depths provided a strong contrast be-tween upwelling and stratified water columns. Hence, we setthe shallow depth to 5 m and the deep depth to 20 m in (1).For classification, we set the threshold(again based on previous AUV temperature measurements inMonterey Bay) in (2).On each yo–yo profile (descent or ascent), the AUV
records and to calculate. When falls below
for six consecutive yo–yo profiles, the AUVdetermines that it has entered an upwelling water column.The requirement of on six consecutive yo–yoprofiles falling below is for robust detection ofan upwelling water column (i.e., small patches of water withlow will be ignored).Conversely, suppose an AUV flies from upwelling water to
stratified water on a yo–yo trajectory (in the vertical dimension).When rises above for six consecu-tive yo–yo profiles, the AUV determines that it has entered astratified water column. The requirement of on sixconsecutive yo–yo profiles rising above is for ro-bust detection of a stratified water column (i.e., small patches ofwater with high will be ignored).Based on the above classification algorithm, we developed a
method for an AUV to track the upwelling front as follows [27].• Suppose an AUV starts a mission in stratified water andflies toward upwelling water on a yo–yo trajectory (inthe vertical dimension). When falls below
, a detection countercounts 1. On the following yo–yo profile, if
ZHANG et al.: USING AN AUTONOMOUS UNDERWATER VEHICLE TO TRACK A COASTAL UPWELLING FRONT 341
Fig. 6. The horizontal track of the Tethys AUV on April 27–29, 2011 (mission log number 20110427T191236). The AUV transected the front (back and forth)14 times. The front’s location detected on each transect is marked by a white dot (delay corrected).
Fig. 7. (a) The horizontal track of the AUV’s first transect from stratified water to upwelling water. (b) AUV-measured temperature between 5- and 20-m depths.(c) used as the classifier for distinguishing between stratified and upwelling water columns. In each panel, the blue trianglemarks the front detection location where the AUV determined that it had passed the front and entered the upwelling water column (i.e., whenreached 6 and hence was to 1); the red triangle marks the true location of the front (i.e., when reached 1 prior to reaching 6).
remains below in-creases to 2; but if turns out to be above
is reset to 0. Whenreaches 6, the AUV determines that
it has passed the front and entered an upwelling watercolumn, and accordingly sets to 1.
• The AUV continues flight in the upwelling water for3 km to sufficiently cover the frontal
region, and then turns around to fly back to the stratifiedwater. and are resetto 0.
• On the way back to the stratified water, whenrises above counts 1.
When reaches 6, the AUV determinesthat it has passed the front and entered the stratified watercolumn, and accordingly sets to 1.
• The AUV continues flight in the stratified water for3 km, and then turns around to fly
back to the upwelling water. andare reset to 0.
• The AUV repeats the above cycle of front crossing. As thefront evolves over time, the AUV effectively tracks it.
III. FIELD PERFORMANCE
The Tethys long-range AUV [28], as shown in Fig. 5, wasdeveloped at the Monterey Bay Aquarium Research Institute
342 IEEE JOURNAL OF OCEANIC ENGINEERING, VOL. 37, NO. 3, JULY 2012
Fig. 8. on all the 14 transects. The AUV’s flight direction on each transect is shown by the arrow. The blue vertical barmarks the front detection location (i.e., when reached 6 and hence was set to 1); the red vertical bar marks the true locationof the front (i.e., when reached 1 before reaching 6). The duration of each transect is also noted.
(MBARI). It has a length of 2.3 m and a diameter of 0.3 m(i.e., 12 in) at the midsection. The propeller-driven vehicle canrun effectively from 0.5 to 1 m/s. Propulsion power consump-tion is minimized through a careful design of a low-drag bodyand a high-efficiency propulsion system. In addition, by using
a buoyancy engine, the vehicle is capable of trimming to neu-tral buoyancy and drifting in a lower power mode. The TethysAUV thus combines the merits of propeller-driven and buoy-ancy-driven vehicles. The vehicle’s sensor suite includes NeilBrown temperature and conductivity sensors, a Keller depth
ZHANG et al.: USING AN AUTONOMOUS UNDERWATER VEHICLE TO TRACK A COASTAL UPWELLING FRONT 343
Fig. 9. AUV-measured temperature from surface to the full AUV depth of 50 m. On each transect, the red vertical bar marks the true (i.e., delay-corrected) locationof the front.
sensor, aWET Labs ECO-Triplet Puck fluorescence/backscattersensor, an Aanderaa dissolved oxygen sensor, an In Situ Ultravi-olet Spectrophotometer (ISUS) nitrate sensor, and a LinkQuestDoppler velocity log (DVL) of Model NavQuest 600 Micro.
The AUV’s underwater navigation is by DVL-aided deadreckoning. The DVL provides the Earth-referenced velocity ofthe AUV when the ocean bottom is within range (110 m). Thevehicle’s estimated speed is combined with measured heading
344 IEEE JOURNAL OF OCEANIC ENGINEERING, VOL. 37, NO. 3, JULY 2012
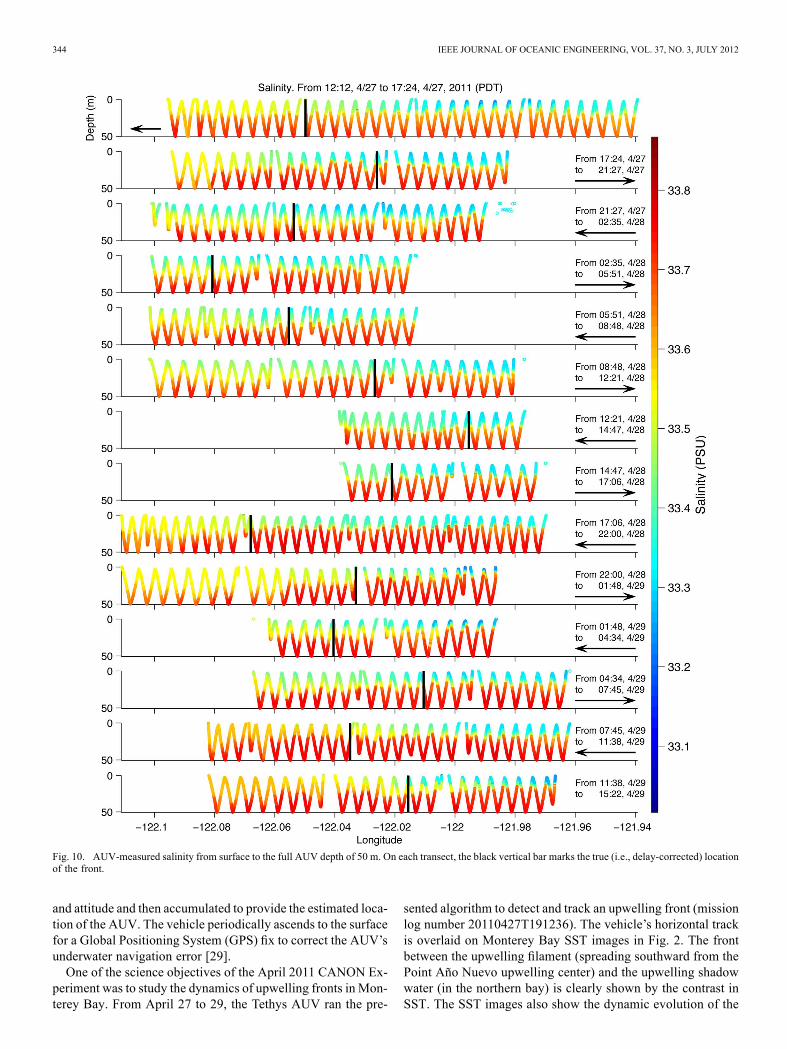
Fig. 10. AUV-measured salinity from surface to the full AUV depth of 50 m. On each transect, the black vertical bar marks the true (i.e., delay-corrected) locationof the front.
and attitude and then accumulated to provide the estimated loca-tion of the AUV. The vehicle periodically ascends to the surfacefor a Global Positioning System (GPS) fix to correct the AUV’sunderwater navigation error [29].One of the science objectives of the April 2011 CANON Ex-
periment was to study the dynamics of upwelling fronts in Mon-terey Bay. From April 27 to 29, the Tethys AUV ran the pre-
sented algorithm to detect and track an upwelling front (missionlog number 20110427T191236). The vehicle’s horizontal trackis overlaid on Monterey Bay SST images in Fig. 2. The frontbetween the upwelling filament (spreading southward from thePoint Año Nuevo upwelling center) and the upwelling shadowwater (in the northern bay) is clearly shown by the contrast inSST. The SST images also show the dynamic evolution of the
ZHANG et al.: USING AN AUTONOMOUS UNDERWATER VEHICLE TO TRACK A COASTAL UPWELLING FRONT 345
front over the two-day duration of the AUV mission. However,satellite SST only provided the surface expression of the up-welling process. Also, the large data interval (on the order of aday) rendered the satellite SST data insufficient for providinghigh-resolution tracking of frontal dynamics.We deployed the Tethys AUV to fulfill the task of high-reso-
lution front tracking. The AUV flew on a yo–yo trajectory be-tween surface and 50-m depth. A closeup view of the vehicle’shorizontal track is displayed in Fig. 6. The AUV’s vertical tra-jectories are shown in Fig. 9. The AUV’s average horizontalspeed was about 0.87 m/s. Its average vertical speed was 0.23m/s on ascent or descent legs. Thus, the flight-path angle of theyo–yo trajectory (the angle between the trajectory and the hori-zontal) was (0.23/0.87) 15 . The vehicletransected the front (back and forth) 14 times over two days, pro-viding a very high-resolution depiction of the frontal dynamics.As presented in Section II, the AUV used
as the classifier for distinguishingbetween stratified and upwelling water columns. A de-tailed view of the first transect through the front is shownin Fig. 7. The AUV started from stratified water, where
was large. As the vehicle flew toward the up-welling water, decreased. When fellbelow 1 C, began tocount. When reached 6, the AUV deter-mined that it had passed the front and entered the upwellingwater, and accordingly set to 1 (i.e., the frontwas detected), as marked by the blue triangle. Thus, the AUV’sdetection of the front came with a delay due to the requirement
. The true location of the front waswhen reached 1 prior to reaching 6, asmarked by the red triangle. The AUV continued flight into theupwelling water for 3 km to sufficientlycover the frontal region.
on all the 14 transects is shown in Fig. 8. Foreach transect, the AUV’s flight direction is shown by thearrow, and the duration is also noted. On each transect, theblue vertical bar marks the front detection location (i.e., when
reached 6); the red vertical bar marks thetrue location of the front (i.e., when reached1 prior to reaching 6). After detection of the front, the AUVcontinued flight for 3 km to sufficiently cover the frontal region.Additional explanations of the fourth and eleventh transects areas follows. On the fourth transect, near longitude 122.07 W,the AUV detected the front (i.e., whenreached 6 and hence was set to 1), as markedby the blue solid vertical bar (the true location of the frontis marked by the red solid vertical bar). Just after that, theexperimental code run on the AUV caused a timing error in thecommunication between the main computer and the propeller’smotor controller, which resulted in an early termination of themission. Then, the shore operator restarted the AUV mission( and were reset to 0),maintaining the flight direction into the stratified water. When
reached 6 again, was set to1 again, which is marked by the blue dashed vertical bar. Thissecond detection actually occurred inside the stratified waterand should be ignored. On the eleventh transect, the aforemen-
Fig. 11. Temporal variation of the front’s location (marked by the small squareswhich correspond to the red vertical bars in Fig. 9) on the 14 transects over twodays.
tioned experimental code caused another communication errorwhich resulted in an early termination of the mission. Then,the shore operator restarted the AUV mission on the reversedirection (i.e., the ensuing twelfth transect). The code causingthe communication errors was corrected after the experiment.The AUV-measured temperature and salinity from surface to
the full AUV depth of 50 m on all the 14 transects are shown inFigs. 9 and 10, respectively. In the upwelling water (to the westof the front), temperature and salinity were both much more ho-mogeneous over depth than in the stratified water (to the east ofthe front). Also, in the upwelling water, temperature was lowerand salinity was higher than in the stratified water, consistentwith the expected properties of upwelling water.The front’s locations detected on the 14 transects are plotted
as a function of time in Fig. 11. On average, the AUV crossedthe front every 3.5 h, thus closely tracking the front for twodays. The front’s location changed from one transect to the next.This variation is due to changes in the direction and intensity ofwind (the driving force of upwelling) as well as motions of andinteractions between stratified and upwelling water masses.
IV. CONCLUSION AND DISCUSSION
We have developed a method for an AUV to autonomouslydetect and track an upwelling front. In a two-day mission inApril 2011, the Tethys AUV ran the algorithm to closely trackan upwelling front in Monterey Bay. The 14 transects across thefront provided high-resolution pictures of temperature, salinity,and other water properties (not shown due to space limitation).In the current algorithm, after the AUV has passed the front
(i.e., is set to 1), the vehicle continues to flyfor a preset distance before turning around. Thepurpose of the continued flight is for sufficient coverage of thefrontal region. Instead of presetting , we can letthe AUV adjust this parameter based on real-time calculation ofthe horizontal variability of . When the horizontalvariability of remains high, it signifies that the ve-hicle is still flying in the transitional region (i.e., the frontal re-
346 IEEE JOURNAL OF OCEANIC ENGINEERING, VOL. 37, NO. 3, JULY 2012
gion), so the AUV should continue flight maintaining the direc-tion.When the horizontal variability of drops belowsome level, it signifies that the vehicle has exited the frontal re-gion and entered the upwelling or stratified water column, so theAUV should turn around. This way, the AUV can adaptivelystrike a good balance between frontal coverage and temporalresolution of front tracking.
ACKNOWLEDGMENT
The authors would like to thank T. Hoover, B. Kieft, B.Hobson, R. McEwen, and D. Klimov for helping with theplanning and operation of the Tethys AUV missions. Theywould also like to thank Dr. F. Chavez and Dr. C. Scholin fortheir support during the CANON experiments, and R. Kudelaand C. Ruhsam (University of California at Santa Cruz) forprocessing and providing the satellite AVHRR SST data. Theauthors would also like to thank the anonymous reviewers fortheir comments and suggestions for improving the paper.
REFERENCES[1] J. P. Ryan, A. M. Fischer, R. M. Kudela, M. A. McManus, J. S. Myers,
J. D. Paduan, C.M. Ruhsam, C. B.Woodson, and Y. Zhang, “Recurrentfrontal slicks of a coastal ocean upwelling shadow,” J. Geophys. Res.,vol. 115, 2010, C12070.
[2] E. D’Asaro, C. Lee, L. Rainville, R. Harcourt, and L. Thomas, “En-hanced turbulence and energy dissipation at ocean fronts,” Science, vol.332, no. 6027, pp. 318–322, 2011.
[3] R. Ferrari, “A frontal challenge for climate models,” Science, vol. 332,no. 6027, pp. 316–317, 2011.
[4] J. Wright, Seawater: Its Composition, Properties and Behavior, 2nded. Oxford, U.K.: Butterworth-Heinemann, 1995, ch. 2, pp. 14–28.
[5] A. Colling, Ocean Circulation, 2nd ed. Oxford, U.K.: Butterworth-Heinemann, 2001, ch. 4, pp. 133–137.
[6] P. K. Kundu, Fluid Mechanics. London, U.K.: Academic, 1990, ch.13, pp. 489–496.
[7] S. R. Ramp, J. D. Paduan, I. Shulman, J. Kindle, F. L. Bahr, andF. Chavez, “Observations of upwelling and relaxation events in thenorthern Monterey Bay during August 2000,” J. Geophys. Res., vol.110, 2005, C07013.
[8] W. M. Graham and J. L. Largier, “Upwelling shadows as nearshoreretention sites: The example of northern Monterey Bay,” ContinentalShelf Res., vol. 17, pp. 509–532, 1997.
[9] J. P. Ryan, D. Greenfield, R.M. III, C. Preston, B. Roman, S. Jensen, D.Pargett, J. Birch, C. Mikulski, G. Doucette, and C. Scholin, “Harmfulphytoplankton ecology studies using an autonomous molecular analyt-ical and ocean observing network,” Limnol. Oceanogr., vol. 56, no. 4,pp. 1255–1272, 2011.
[10] J. B. J. Harvey, J. P. Ryan, R. M. III, C. M. Preston, N. Alvarado, C. A.Scholin, and R. C. Vrijenhoek, “Robotic sampling, in situ monitoringand molecular detection of marine zooplankton,” J. Exp. Mar. Biol.Ecol., vol. 413, pp. 60–70, Feb. 2012.
[11] H. Schmidt, J. G. Bellingham, M. Johnson, D. Herold, D. M. Farmer,and R. Pawlowicz, “Real-time frontal mapping with AUVs in a coastalenvironment,” in Proc. MTS/IEEE OCEANS Conf., Sep. 1996, pp.1094–1098.
[12] J. G. Bellingham, “New oceanographic uses of autonomous underwatervehicles,” Mar. Technol. Soc. J., vol. 31, no. 3, pp. 34–47, 1997, Fall.
[13] J. G. Bellingham, B. A. Moran, Y. Zhang, J. S. Willcox, N. Cruz, R.Grieve, J. J. Leonard, and J. W. Bales, “Haro Strait Experiment 1996MIT Sea Grant Component,” MIT Sea Grant AUV Lab, Cambridge,MA, Tech. Rep., 1997.
[14] Y. Zhang and J. S. Willcox, “Current velocity mapping using an AUV-borne acoustic doppler current profiler,” in Proc. 10th Int. Symp. Un-manned Untethered Submersible Technol., Durham, NH, Sep. 1997,pp. 31–40.
[15] A. R. Robinson, H. G. Arango, A. Warn-Varnas, W. G. Leslie, A. J.Miller, P. J. Haley, and C. J. Lozano, “Real-time regional forecasting,”in Modern Approaches to Data Assimilation in Ocean Modeling, ser.Oceanography, P. Mallanotte-Rizzoli, Ed. Amsterdam, The Nether-lands: Elsevier Science, 1996, pp. 377–412.
[16] H. C. Woithe and U. Kremer, “A programming architecture for smartautonomous underwater vehicles,” in Proc. IEEE Int. Conf. Intell.Robots Syst., St. Louis, MO, Oct. 2009, pp. 4433–4438.
[17] D. Wang, P. F. J. Lermusiaux, P. J. Haley, D. Eickstedt, W. G.Leslie, and H. Schmidt, “Acoustically focused adaptive sampling andon-board routing for marine rapid environmental assessment,” J. Mar.Syst., vol. 78, pp. S393–S407, 2009.
[18] F. Cazenave, Y. Zhang, E. McPhee-Shaw, J. G. Bellingham, and T.Stanton, “High-resolution surveys of internal tidal waves in MontereyBay, California, using an autonomous underwater vehicle,” Limnol.Oceanogr., Methods, vol. 9, pp. 571–581, 2011.
[19] N. Cruz and A. C. Matos, “Reactive AUV motion for thermoclinetracking,” inProc. IEEEOCEANSConf., Sydney, Australia,May 2010,DOI: 10.1109/OCEANSSYD.2010.5603883.
[20] N. Cruz and A. C. Matos, “Adaptive sampling of thermoclines with au-tonomous underwater vehicles,” in Proc. MTS/IEEE OCEANS Conf.,Seattle, WA, Sep. 2010, DOI: 10.1109/OCEANS.2010.5663903.
[21] S. Petillo, A. Balasuriya, and H. Schmidt, “Autonomous adaptive envi-ronmental assessment and feature tracking via autonomous underwatervehicles,” inProc. IEEEOCEANSConf., Sydney, Australia,May 2010,DOI: 10.1109/OCEANSSYD.2010.5603513.
[22] Y. Zhang, J. G. Bellingham, M. Godin, J. P. Ryan, R. S. McEwen,B. Kieft, B. Hobson, and T. Hoover, “Thermocline tracking basedon peak-gradient detection by an autonomous underwater vehicle,”in Proc. MTS/IEEE OCEANS Conf., Seattle, WA, Sep. 2010, DOI:10.1109/OCEANS.2010.5664545.
[23] D. P. Eickstedt, M. R. Benjamin, D. Wang, and H. Schmidt, “Behaviorbased adaptive control for autonomous oceanographic sampling,” inProc. Int. Conf. Robot. Autom., Rome, Italy, Apr. 2007, pp. 4245–4250.
[24] E. Fiorelli, N. E. Leonard, P. Bhatta, D. A. Paley, R. Bachmayer, and D.M. Fratantoni, “Multi-AUV control and adaptive sampling inMontereyBay,” IEEE J. Ocean. Eng., vol. 31, no. 4, pp. 935–948, Oct. 2006.
[25] K. Rajan, F. Py, C. McGann, J. Ryan, T. O’Reilly, T. Maughan, andB. Roman, “Onboard adaptive control of AUVs using automated plan-ning and execution,” in Proc. 16th Int. Symp. Unmanned UntetheredSubmersible Technol., Durham, NH, Aug. 2009, pp. 1–13.
[26] Y. Zhang, J. P. Ryan, J. G. Bellingham, J. Harvey, R. S. McEwen, F.Chavez, and C. Scholin, “Classification of water masses and targetedsampling of ocean plankton populations by an autonomous underwatervehicle,” presented at the AGU Fall Meeting, San Francisco, CA, Dec.2011, Abstract OS21A-1609.
[27] Y. Zhang, M. Godin, J. G. Bellingham, and J. P. Ryan, “Ocean frontdetection and tracking by an autonomous underwater vehicle,” in Proc.MTS/IEEE OCEANS Conf., Kona, HI, Sep. 2011.
[28] J. G. Bellingham, Y. Zhang, J. E. Kerwin, J. Erikson, B. Hobson,B. Kieft, M. Godin, R. McEwen, T. Hoover, J. Paul, A. Hamilton,J. Franklin, and A. Banka, “Efficient propulsion for the Tethyslong-range autonomous underwater vehicle,” in Proc. IEEE Au-tonomous Underwater Veh., Monterey, CA, Sept. 2010, DOI:10.1109/AUV.2010.5779645.
[29] J. G. Bellingham, B. Hobson, M. A. Godin, B. Kieft, J. Erikson, R.McEwen, C. Kecy, Y. Zhang, T. Hoover, and E. Mellinger, “A small,long-range AUV with flexible speed and payload,” presented at theOcean Sci. Meeting, Portland, OR, Feb. 2010, Abstract MT15A- 14.
Yanwu Zhang (S’95–M’00–SM’05) was born in1969 in Shaanxi Province, China. He received theB.S. degree in electrical engineering and the M.S.degree in underwater acoustics engineering fromNorthwestern Polytechnic University, Xi’an, China,in 1989 and 1991, respectively, the M.S. degree inelectrical engineering and computer science fromthe Massachusetts Institute of Technology (MIT),Cambridge, in 1998, and the Ph.D. degree in oceano-graphic engineering from the MIT/Woods HoleOceanographic Institution (WHOI) Joint Program,
Cambridge/Woods Hole, MA, in June 2000.From 2000 to 2004, he was a Systems Engineer working on medical image
processing at the General Electric Company (GE) Research and DevelopmentCenter, Niskayuna, NY, and then a Senior Digital Signal Processing (DSP) Engi-neer at Aware Inc., Bedford,MA,working on digital communications. SinceDe-cember 2004, he has been with the Monterey Bay Aquarium Research Institute,Moss Landing, CA, as a Senior Research Specialist. He works on developingand field-testing adaptive sampling algorithms for autonomous underwater ve-hicles (AUVs) and applying them in ocean experiments, designing samplingstrategy for ocean observatories comprising AUVs and moorings, and devel-oping the long-range AUV Tethys. His current research interests are mainly in
ZHANG et al.: USING AN AUTONOMOUS UNDERWATER VEHICLE TO TRACK A COASTAL UPWELLING FRONT 347
spatio–temporal real-time signal processing and its applications to AUV’s sam-pling of oceanographic processes.Dr. Zhang was a finalist for the MIT Technology Review Magazine’s 100
young innovators (TR100) in 1999. He has participated in 12 field experimentsrunning the Odyssey IIB, Dorado, and Tethys AUVs. He has served as a re-viewer for the IEEE JOURNAL OF OCEANIC ENGINEERING and eight other aca-demic journals, as well as for the National Science Foundation (NSF) and Na-tional Oceanic and Atmospheric Administration (NOAA) proposals. He wasan invited session chair at the American Geophysical Union (AGU) 2007 FallMeeting and the 2010 MTS/IEEE Oceans Conference. He is a member of theAmerican Geophysical Union (AGU) and Sigma Xi.
Michael A. Godin was born in Westfield, MA, in1968. He received the B.S. degree in mechanical en-gineering from the Worcester Polytechnic Institute(WPI), Worcester, MA, in 1991 and the M.S. degreein nuclear engineering from the Massachusetts Insti-tute of Technology (MIT), Cambridge, in 1994.He worked at the U.S. Department of Energy head-
quarters, Washington DC, from 1991 to 1998, firston robotic handing of spent nuclear fuel, and later onprogram management of nuclear waste cleanup re-search. From 1998 to 2003, he worked at Hydro-Op-
tics, Biology, and Instrumentation Labs (HOBI Labs), Watsonville, CA, on thehardware design, software design, and manufacturing of underwater optical sen-sors and submersible data loggers. Since 2004, he has worked at the MontereyBay Aquarium Research Institute (MBARI), Moss Landing, CA, where he hasdeveloped collaboration systems for geographically distributed groups of re-searchers, tools for spatio–temporal data exploration, and on a new softwarearchitecture for implementing state configured layered control on the TethysAUV.Mr. Godin chaired sessions at the 2007 and 2010 MTS/IEEE OCEANS Con-
ferences, and serves on the SciDB Science Advisory Board.
James G. Bellingham (M’10) received theB.S./M.S. degrees in physics and the Ph.D. degreein physics from the Massachusetts Institute ofTechnology (MIT), Cambridge, in 1984 and 1988,respectively.He is the Chief Technologist at the Monterey
Bay Aquarium Research Institute (MBARI), MossLanding, CA. His personal research activity revolvesaround the development and use of autonomousunderwater vehicles (AUVs). He leads the Au-tonomous Ocean Sampling Network (AOSN)
program at MBARI, which uses fleets of autonomous vehicles to adaptivelyobserve dynamic oceanographic processes. He has spent considerable time atsea, leading over 20 AUV expeditions in environments ranging from the watersoff Antarctica to the central Arctic. Before joining MBARI, he was at MIT,where he founded the Autonomous Underwater Vehicle Laboratory and ranit from 1988 to 2000. In 1997, he cofounded Bluefin Robotics Corporation, aleading manufacturer of AUVs.Dr. Bellingham received the Lockheed Martin Award for Ocean Science and
Engineering from theMarine Technology Society. He serves on a number of ad-visory boards and councils, including the Naval Research Advisory Committeeand the Strategic Advisory Group for Battelle’s National Security Division.
John P. Ryan was born in Lafayette, IN, in 1965. Hereceived the B.S. degree in biology from the Univer-sity of Massachusetts, Boston, in 1988 and the M.S.and Ph.D. degrees in biological oceanography fromthe University of Rhode Island, Narragensett, in 1993and 1998, respectively.He began a postdoctoral research position at
the Monterey Bay Aquarium Research Institute(MBARI), Moss Landing, CA, in fall 1998, tran-sitioned to MBARI Scientist in 2001, and is nowSenior Research Specialist. His research integrates
multidisciplinary observations from satellites, aircraft, ships, moorings, au-tonomous underwater vehicles (AUVs), and towed undulating vehicles tostudy ocean processes. In this research, he works extensively with engineers toadvance AUV capabilities for marine science.Dr. Ryan was awarded a fellowship by the Office of Naval Research in sup-
port of his M.S., and a NASA New Investigator Research grant in support of hispostdoctoral research.