HPLC/LC High Resolution Separation of a Tryptic Digest of Human Serum Albumin by Fused- Core HPLC 3 Improving HILIC Mode Chromatography by Choice of Injection & Wash Solvent 6 Ion Pairing for Analysis of Phosphonate Compounds 8 Sample Handling Comparison of SupelMIP ™ SPE – Beta-Agonists and Mixed-Mode SPE for Urine Samples 10 SPME for Bioanalysis 13 GC Analyses of Free Fatty Acids 15 Analyses of FAMEs by Boiling Point Elution 17 Standards and Reagents Quality Reference Standards for Monitoring Nitrosamine Contaminants 21 AOCS Reference Mixes 22 Threaded TFE Funnels Ease Vial Filling 23 High Resolution Separation of Human Serum Albumin Tryptic Digest using Fused-Core ™ HPLC Columns Reporter Volume 34, January 2009, International Ascentis ® Express Fused-Core Particle and Results of Gradient Elution of Human Serum Albumin Tryptic Digest on Ascentis Express C18 Columns
Transcript
HPLC/LCHigh Resolution Separation of a Tryptic Digest of Human Serum Albumin by Fused-Core HPLC 3
Improving HILIC Mode Chromatography by Choice of Injection & Wash Solvent 6
Ion Pairing for Analysis of Phosphonate Compounds 8
Sample HandlingComparison of SupelMIP™ SPE – Beta-Agonists and Mixed-Mode SPE for Urine Samples 10
SPME for Bioanalysis 13
GCAnalyses of Free Fatty Acids 15
Analyses of FAMEs by Boiling Point Elution 17
Standards and ReagentsQuality Reference Standards for Monitoring Nitrosamine Contaminants 21
AOCS Reference Mixes 22
Threaded TFE Funnels Ease Vial Filling 23
High Resolution Separation of Human Serum Albumin Tryptic Digest using Fused-Core™ HPLC Columns
ReporterVolume 34, January 2009, International
Ascentis® Express Fused-Core Particle and Results of Gradient Elution of Human Serum Albumin Tryptic Digest on Ascentis Express C18 Columns
2
Shyam VermaMarket Segment Manager
Dear Colleague,
Today’s analytical chemist needs not only sophisticated instruments or separation devices but also high-quality reagents and chemicals to achieve the desired results with minimal instrument downtime due to impurities.
Fluka/Sigma-Aldrich offers a wide variety of superior quality, high-purity solvents, reagents and chemicals that are used in sophisticated analysis as well as for general analytical purposes. Every year, many innovative reagents are included in our offering to fulfi l the requirements of new analytical tech-niques and standard methods for a variety of applications.
Before highlighting a few specifi c high-quality offerings in the reagents and chemicals, I want to mention about the change in labelling of some of our products. The Riedel-de Haën® logo is now re-placed by the Fluka logo. This is only a brand name change, as manufacturing, packaging, performance and quality of the impacted laboratory reagents and chemicals will remain the same. This change is made with a goal of providing a logical structure to our Analytical product offering.
The Fluka (formerly Riedel-de Haën) superior-quality LC-MS solvents, additives and blends for your HPLC undergo distinct tests to ensure quality for sensitive and specifi c LC-MS analysis. These reagents are designed to optimise LC-MS performance with lower impurities and better baselines.
Our portfolio also contains over 400 derivatisation reagents, providing the broadest range to assist in a faster and accurate chromatography analysis. In March 2008 a a new guide for derivatisation was produced that included a comprehensive list of our products and potential applications by industry. This guide can be ordered from the web: sigma-aldrich.com/derivatization. You will fi nd it very helpful in your day-to-day laboratory work.
Ion-pairing reagents are a widely used product group in reversed-phase HPLC, requiring high-purity products. Fluka’s quality is unmatched in ion-pairing reagents. This focus on high quality leads to im-proved accuracy, reproducibility and reliability in the separation of complex mixtures of polar and ionic molecules.
There are numerous types of buffers, indicators, and other reagents and chemicals that are used in chromatography analysis and separation techniques that Fluka/Sigma-Aldrich is proud to offer through our catalogues and on the web. In addition to these products, Sigma-Aldrich offers other innovative solutions to chromatographic analysis such as Solid Phase Microextraction, and a comprehensive selection of high-quality standards.
Fluka/Sigma-Aldrich works hard to assist you in today’s analytical needs and tomorrow’s new ven-tures with our high-quality, tested products, and related literature. We thank you for your confi dence in Sigma-Aldrich.
Reporter is published fi ve times a year by Sigma-AldrichMarCom Europe, Industriestrasse 25, CH-9471 Buchs SG, SwitzerlandPublisher: Sigma-Aldrich Marketing Communications EuropePublication Director: Ingo Haag, PhDEditor: Daniel Vogler
Visit us on the web at sigma-aldrich.com/thereporter
Reporter
Rep
ort
er
3
HPL
C/L
C
sigma-aldrich.com/express
High Resolution Separation of Human Serum Albumin Tryptic Digest Using Fused-Core HPLC Columns
Introduction The last decades have witnessed the use of different analytical techniques to tackle such complex tasks as the analysis of biochem-ical systems like peptides and proteins. Liquid chromatography plays a central role in present-day proteome research because of its versatility as well as advances in LC column selectivity and resolu-tion. Human Serum Albumin (HSA) is a single-chain unglycosylated protein of 585 amino acids that acts as a depot and transport site for fatty acids, drugs, bilirubin, heme and hormones. It can undergo various modifi cations that signifi cantly affect protein folding, stabil-ity, conformation and function; characterisation of the types and locations of such modifi cations is therefore of utmost importance in understanding HSA’s role in human pathologies. A typical proce-dure involves the preparation of a tryptic digest from the protein, then generation of reliable LC data as a preliminary separation step prior to subsequent characterisation using complementary tech-niques such as MS or MS-MS and a database search.
In the case of highly complex samples with closely eluting com-ponents, the slow mass transfer of solute molecules inside the sta-tionary phase particles can severely limit resolving power. The new Ascentis Express® columns, based on Fused-Core™ particle technol-ogy, ameliorate this limitation by providing a small (0.5 μm) path for diffusion of solutes into and out of the particles, thereby reducing the time that solute molecules spend inside the particles. As a re-sult, these columns deliver more than twice the separating power of columns packed with 5 μm totally porous particles, which have been the workhorse of most HPLC laboratories for many years, and over 50 % more separating power (theoretical plates) than columns of the same length packed with 3.5 μm particles, which often re-quire higher pump pressures due to lower bed permeability. On the other hand, in cases when resolution is critical, smaller particle col-umns are not suitable for separating closely eluting peak pairs, as the use of a longer column to enhance separation is hampered by excessive back pressure above allowable limits. Thus, to fully exploit the higher effi ciencies offered by the sub-2 μm particles, instru-mentation beyond conventional HPLC is often required. The perfor-mance advantages that Ascentis Express columns packed with Fused-Core particles offer include effi ciencies equal to sub-2 μm columns at half the back pressure due to their narrow particle size distribution, and a rugged design capable of high-pressure opera-tion and longer column lifetime in routine use.
Results and Discussion Initially, a conventional 5 μm C18 column was compared to the 2.7 μm Ascentis Express for the separation of a human serum albumin tryptic digest (0.01 M in ammonium formate buffer), under gradi-ent conditions, at a temperature of 35 °C. The higher effi ciency of the 2.7 μm column versus the 5 μm column is clear in the chromato-grams in Figure 1; almost twice the plates/column were obtained with the Fused-Core stationary phase (i.e. 34,000 theoretical plates at 1.0 mL/min). The higher resolution and sensitivity of the Ascentis Express column allows for method optimisation in the form of shorter run time without sacrifi cing resolution, or by adding more column length at higher temperatures to obtain higher resolution and/or higher speed, with no need to change the system confi gu-ration.
(continued on page 4)
The following was generated by an outside source using Sigma-Aldrich products. Technical content provided by:Prof. Luigi Mondello, University of Messina, Italy
Contributed Article>
Figure 1 Analysis of Human Serum Albumin Tryptic Digest on Ascentis Express (top) compared to totally porous 5 μm column (bottom)
column: Ascentis Express C18, 15 cm x 4.6 mm I.D., 2.7 μm particles and conventional C18, 15 cm x 4.6 mm I.D., 5 μm particles
mobile phase A: 100 % water with 0.1 % TFA mobile phase B: 50:50, acetonitrile:water, with 0.1 % TFA flow rate: 1.0 mL/min temp: 35 °C det: UV at 215 nm injection: 20 μL gradient: 0 to 100 %B in 80 min (linear), hold for 5 min
Min0 10 20 30 40 50 60
Min0 10 20 30 40 50 60
G004283
G004282
Ascentis ExpressΔP: 265 bar
Conventional 5 μmΔP: 91 bar
4H
PLC
/LC
sigma-aldrich.com/express
… these columns deliver more than twice the separating power of columns packed with 5 μm totally porous particles, which have been the workhorse of most HPLC laboratories for many years
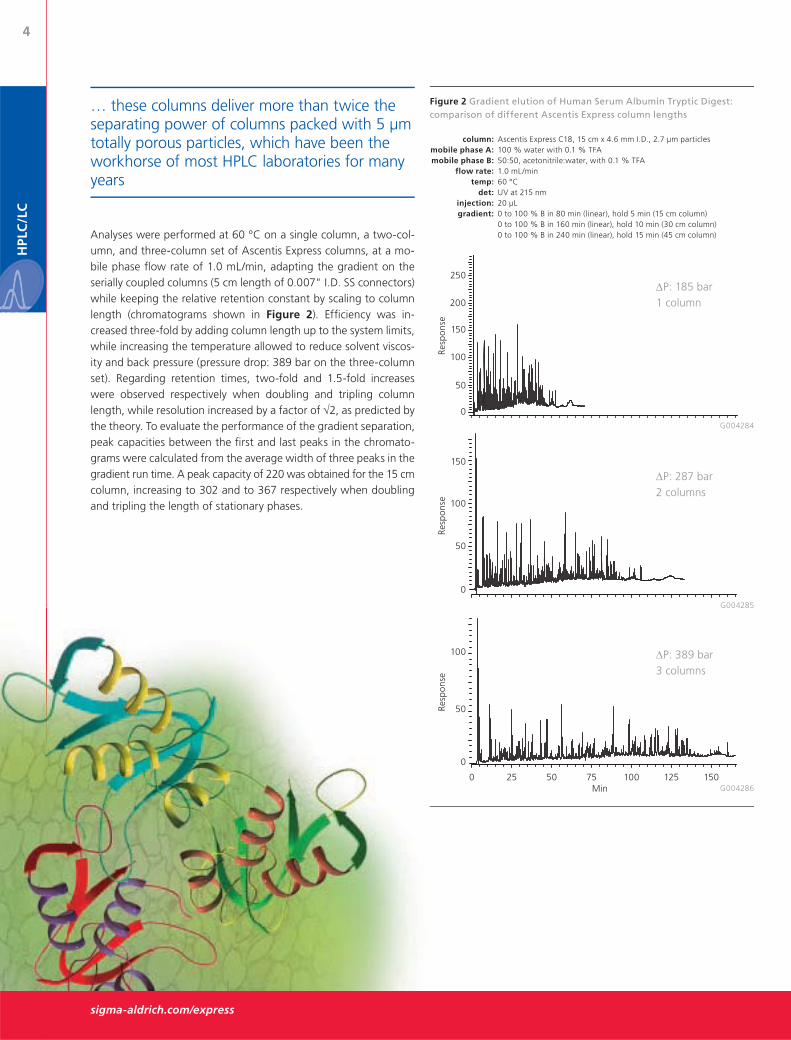
Analyses were performed at 60 °C on a single column, a two-col-umn, and three-column set of Ascentis Express columns, at a mo-bile phase fl ow rate of 1.0 mL/min, adapting the gradient on the serially coupled columns (5 cm length of 0.007" I.D. SS connectors) while keeping the relative retention constant by scaling to column length (chromatograms shown in Figure 2). Effi ciency was in-creased three-fold by adding column length up to the system limits, while increasing the temperature allowed to reduce solvent viscos-ity and back pressure (pressure drop: 389 bar on the three-column set). Regarding retention times, two-fold and 1.5-fold increases were observed respectively when doubling and tripling column length, while resolution increased by a factor of √2, as predicted by the theory. To evaluate the performance of the gradient separation, peak capacities between the fi rst and last peaks in the chromato-grams were calculated from the average width of three peaks in the gradient run time. A peak capacity of 220 was obtained for the 15 cm column, increasing to 302 and to 367 respectively when doubling and tripling the length of stationary phases.
Figure 2 Gradient elution of Human Serum Albumin Tryptic Digest: comparison of different Ascentis Express column lengths
column: Ascentis Express C18, 15 cm x 4.6 mm I.D., 2.7 μm particles mobile phase A: 100 % water with 0.1 % TFA mobile phase B: 50:50, acetonitrile:water, with 0.1 % TFA flow rate: 1.0 mL/min temp: 60 °C det: UV at 215 nm injection: 20 μL gradient: 0 to 100 % B in 80 min (linear), hold 5 min (15 cm column) 0 to 100 % B in 160 min (linear), hold 10 min (30 cm column) 0 to 100 % B in 240 min (linear), hold 15 min (45 cm column)
Min0 25 50 75 100 125 150
250
Resp
onse
G004286
G004285
G004284
200
150
100
50
0
150
100
50
0
Resp
onse
100
50
0
Resp
onse
ΔP: 185 bar1 column
ΔP: 287 bar2 columns
ΔP: 389 bar3 columns
5
HPL
C/L
C
sigma-aldrich.com/express
+
Featured ProductsID
(mm)
Length
(cm)
Ascentis Express C18 Ascentis Express C8
Ascentis Express Columns
2.1 3 53802-U 53839-U
2.1 5 53822-U 53831-U
2.1 7.5 53804-U 53843-U
2.1 10 53823-U 53832-U
2.1 15 53825-U 53834-U
3.0 3 53805-U 53844-U
3.0 5 53811-U 53848-U
3.0 7.5 53812-U 53849-U
3.0 10 53814-U 53852-U
3.0 15 53816-U 53853-U
4.6 3 53818-U 53857-U
4.6 5 53826-U 53836-U
4.6 7.5 53819-U 53858-U
4.6 10 53827-U 53837-U
4.6 15 53829-U 53838-U
For more information on Ascentis Express columns, request T407044 (JHD) or visit sigma-aldrich.com/express
! Related Information
ConclusionClearly, proper column choice and appropriate operating conditions eliminate the frustration and unnecessary time loss in method de-velopment and optimisation of HPLC separations. The implementa-tion of the LC analyses involves making good choices in stationary phase, resolution and peak capacity improvements, column selec-tivity, and particle size distribution, as well as full and proper control of critical system parameters such as mobile phase temperature and operating pressure. The unique performance of the Ascentis Ex-press columns enabled faster method development for the separa-tion of highly complex mixtures with closely eluting components, with a straightforward and predictable positive impact on through-put using standard HPLC or UHPLC equipment.
The new partner in the Ascentis Express rangeuses the proven, innovative Fused-Core technology:
High efficiency and speed without high back pressure RP Amide chemistry provides different and complementary selectivity to C18 For those separations that are difficult or marginal on C18Ideal for polar molecules on HPLC or UHPLC
For further information, please contact [email protected] visit us on the web: sigma-aldrich.com/express
DiscussionFigure 1 shows a typical QA chromatogram that would be ob-tained with an Ascentis Express HILIC HPLC column. Figure 2 is a chromatogram obtained from a new, unused Ascentis Express HILIC column on a Waters® Acquity® UPLC system. Note the differ-ence from the results obtained in Figure 1. Several attempts were made to troubleshoot the problem, such as washing with strong solvent (water), examining the end frit, running on another system, reversing fl ow direction, altering sample injection solvents and run-ning a larger diameter column (4.6 mm I.D.). None of these changes solved the problem.
In troubleshooting the poor chromatography, a review of the manufacturer’s literature showed the instrument had several in-jection modes. The partial loop mode was used to generate the chromatogram in Figure 2, as this was the default method set in the instrument. In this partial loop mode, it was reported in the manufacturer’s literature that this is the only mode that injects sample and weak wash solvent onto the column [1]. Normally, this would be an acceptable mode to inject samples if the mode was reversed-phase LC. In HILIC mode, however, solvent and sample polarities are opposite versus reversed-phase mode.
This Acquity UPLC instrument has two wash solvents, strong and weak. When the instrument was initially installed, the strong wash solvent was 10:90 water:acetonitrile and the weak wash sol-vent was 90:10 water:acetonitrile. The instrument was injecting a small volume of the weak wash solvent (90:10 water:aceto nitrile) along with the sample. This weak wash solvent is actually a strong wash solvent in HILIC mode.
To determine if this wash solvent was causing the poor chroma-tography, the needle wash solvent bottles were reversed. Upon changing solvent strengths in the needle wash and making another injection, the chromatogram in Figure 3 was obtained, indicating the needle wash solvent polarity was the cause of the poor chroma-tography.
To determine if this solved the poor chromatography problem, the needle wash solvent bottles were switched back to their initial confi guration. The resulting chromatogram was similar to that shown in Figure 2, indicating the poor chromatography could be reproduced. In addition to the strong and weak wash solvent po-larities, other injection modes in the UPLC were investigated. Results from changing injection modes showed chromatography similar to that seen in Figure 3, even using the original wash solvent system.
Solvent needle wash polarity has been shown to play a vital role in HILIC chromatography. In addition, injection mode also played a role in obtaining good chromatography. In the work presented here,
Improving HILIC Mode Chromatography by Choosing the Proper Injection and Wash Solvent
Introduction to HILICHILIC chromatography, also known as Aqueous Normal Phase (ANP), uses a polar stationary phase such as bare silica, cyano, amino, phenyl, pentafl uorophenyl (PFPP) or diol and a relatively non-polar mobile phase. The mobile phase usually consists of a high percentage of organic with water and buffer as the modifi er. Typical analytes run in this mode are basic amines (polar and non-polar), polar acids and polar neutrals. HILIC is a form of partitioning, the water in the mobile phase is preferentially adsorbed to the polar stationary phase resulting in a layer of solvent enriched in water near the surface and a layer of solvent enriched in organic in the bulk mobile phase. The analyte is distributed between these two layers. A more polar solute will partition into the water layer and thus be retained longer than a less polar solute. HILIC also can include hydrogen bonding and ion-exchange directly with the surface.
… there are a number of operational details that the analyst must be aware of
HILIC has been gaining popularity in recent years due to the increased retention of polar compounds and the alternative selec-tivity HILIC chromatography offers to reversed-phase. In addition, the HILIC mode is highly compatible with mass spectrometric (MS) and evaporative light scattering (ELSD) detection due to the volatil-ity of the mobile phase. Further, HILIC is advantageous to use in preparative chromatography due to the relative ease of compound recovery from a volatile mobile phase. Higher fl ow rates are also possible due to the lower viscosity of the mobile phase. In terms of sample prep, high organic solid phase extraction (SPE) eluents can be directly injected into the HPLC without further evaporation and re-constitution. Finally, HILIC is useful in metabolite separations. As compounds are metabolised, they become more polar and retention by reversed-phase is diffi cult. HILIC will retain these polar com-pounds longer, allowing for easier separation and identifi cation of these metabolites.
As HILIC chromatography may be thought of as reversed reversed-phase, there are a number of operational details that the analyst must be aware of when proceeding with this form of chromatogra-phy. This work describes how the autosampler needle wash solvent can adversely affect the chromatography.
7
HPL
C/L
C
sigma-aldrich.com/express
the column was initially suspected to be the problem. Further in-vestigation showed the needle wash solvents to be critical in the HILIC mode as well as the sample injection mode in obtaining good chromatography in this alternative chromatographic mode.
When using HILIC chromatography, especially after running an LC in reversed-phase mode, it is important to remember to check the LC to be certain needle wash solvents, sample injection type and sample solvents are compatible with HILIC mode so that errors in column viability are not made.
ReferenceWaters On-Line Help: Selecting an Acquity Injection Technique.1]
Min2 4
1
2
3
G004252
Figure 2 Chromatogram from first injection on a new column (wrong technique)
Figure 3 Chromatogram after switching wash solvent bottles between weak and strong solvents
Figure 1 Typical QA chromatogram for Ascentis Express HILIC Column
Conditions for Figures 1-3
column: Ascentis Express HILIC (silica), 10 cm x 2.1 mm I.D., 2.7 μm particles (53930-U) mobile phase: 10:90, (A) 100 mM ammonium formate, pH 3.0 with concentrated formic acid (B) acetonitrile temperature: 35 °C flow rate: 0.4 mL/min. detection: UV at 254 nm injection volume: 1 μL 1. Acenaphthene, 80 mg/mL in mobile phase 2. Adenosine, 35 mg/mL in mobile phase 3. Cytosine, 75 mg/mL in mobile phase
Min2 4
1
G004254
G004253
Min2 4
1
2
3
+Featured ProductsDescription Cat. No.
Ascentis Express HILIC HPLC Columns
5 cm x 2.1 mm I.D. 53934-U
10 cm x 2.1 mm I.D. 53939-U
15 cm x 2.1 mm I.D. 53946-U
5 cm x 4.6 mm I.D. 53975-U
10 cm x 4.6 mm I.D. 53979-U
15 cm x 4.6 mm I.D. 53981-U
Ascentis Express HILIC columns are based on fused-core particle technology, providing the same effi ciency as sub-2 μm particles but at less back pressure, and enabling even greater performance of UHPLC systems.
Did you know?>
HPLC Seminars on the web – 24/7
HPLC theory & column fundamentalsReversed-phase HPLC & alternate selectivitySmall molecule separations using Ascentis columns
go to sigma-aldrich.com/videos
8H
PLC
/LC
sigma-aldrich.com/ipc
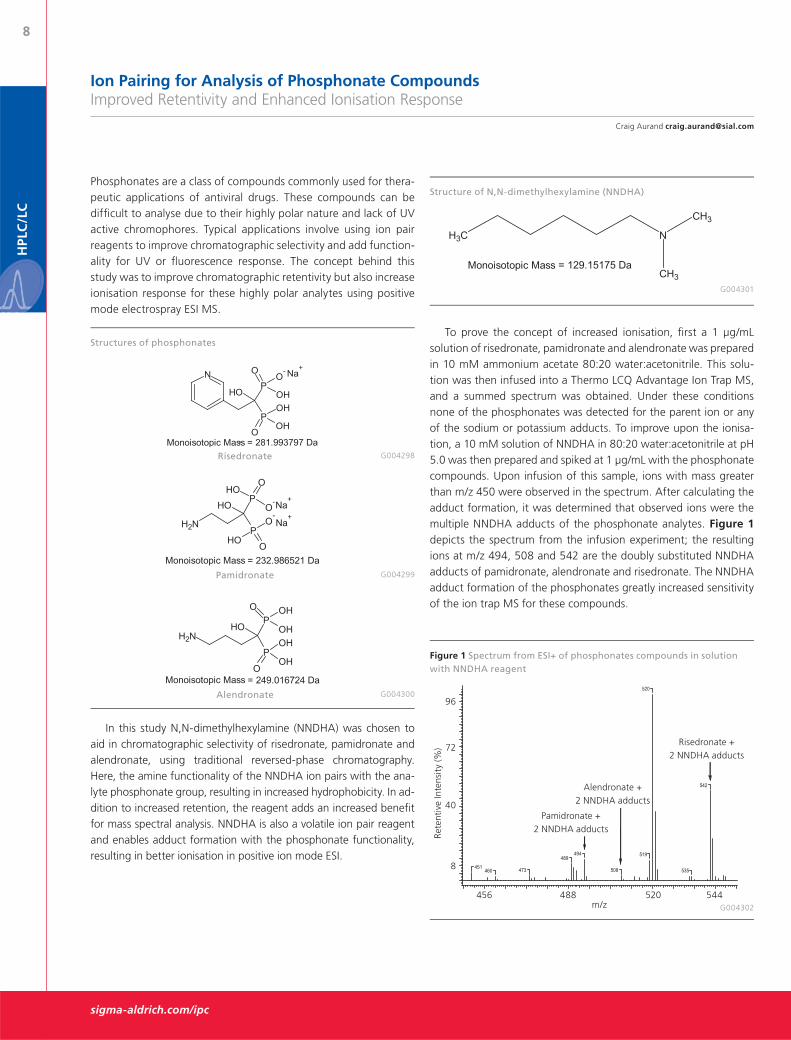
To prove the concept of increased ionisation, fi rst a 1 μg/mL solution of risedronate, pamidronate and alendronate was prepared in 10 mM ammonium acetate 80:20 water:acetonitrile. This solu-tion was then infused into a Thermo LCQ Advantage Ion Trap MS, and a summed spectrum was obtained. Under these conditions none of the phosphonates was detected for the parent ion or any of the sodium or potassium adducts. To improve upon the ionisa-tion, a 10 mM solution of NNDHA in 80:20 water:acetonitrile at pH 5.0 was then prepared and spiked at 1 μg/mL with the phosphonate compounds. Upon infusion of this sample, ions with mass greater than m/z 450 were observed in the spectrum. After calculating the adduct formation, it was determined that observed ions were the multiple NNDHA adducts of the phosphonate analytes. Figure 1 depicts the spectrum from the infusion experiment; the resulting ions at m/z 494, 508 and 542 are the doubly substituted NNDHA adducts of pamidronate, alendronate and risedronate. The NNDHA adduct formation of the phosphonates greatly increased sensitivity of the ion trap MS for these compounds.
Ion Pairing for Analysis of Phosphonate CompoundsImproved Retentivity and Enhanced Ionisation Response
Phosphonates are a class of compounds commonly used for thera-peutic applications of antiviral drugs. These compounds can be diffi cult to analyse due to their highly polar nature and lack of UV active chromophores. Typical applications involve using ion pair reagents to improve chromatographic selectivity and add function-ality for UV or fl uorescence response. The concept behind this study was to improve chromatographic retentivity but also increase ionisation response for these highly polar analytes using positive mode electrospray ESI MS.
Structures of phosphonates
Risedronate
Pamidronate
Alendronate G004300
G004299
G004298
Figure 1 Spectrum from ESI+ of phosphonates compounds in solution with NNDHA reagent
Structure of N,N-dimethylhexylamine (NNDHA)
G004301
Rete
ntiv
e In
tens
ity
(%)
96
8
G004302
40
72
m/z 456 488 520 544
Pamidronate + 2 NNDHA adducts
Alendronate + 2 NNDHA adducts
Risedronate + 2 NNDHA adducts
In this study N,N-dimethylhexylamine (NNDHA) was chosen to aid in chromatographic selectivity of risedronate, pamidronate and alendronate, using traditional reversed-phase chromatography. Here, the amine functionality of the NNDHA ion pairs with the ana-lyte phosphonate group, resulting in increased hydrophobicity. In ad-dition to increased retention, the reagent adds an increased benefi t for mass spectral analysis. NNDHA is also a volatile ion pair reagent and enables adduct formation with the phosphonate functionality, resulting in better ionisation in positive ion mode ESI.
9
HPL
C/L
C
sigma-aldrich.com/ipc
The next step was development of HPLC conditions for the chro-matographic separation of these analytes. A 10 mM solution of NNDHA was used to ion pair with the phosphonate compound for increased chromatographic retention. This enabled isocratic separa-tion of risedronate, pamidronate and alendronate in less than 6 minutes using a standard column confi guration. In this case, the 1 mL/min column eluent going to the mass spectrometer source was split to 100 μL/min while maintaining good sensitivity of the analytes. The phosphonate standard did not contain the NNDHA; instead the ion pairs were generated in the mobile phase prior to reaching the column inlet.
The use of the NNDHA enabled unique utility within the analysis of these phosphonate compounds. Not only was chromatographic retention improved but the added benefi t of adduct formation greatly increased detection in the MS instrument. This approach is very similar to traditional derivatisation techniques, but is more amenable to modern LC-MS applications. This approach can also be applied to other applications involving diffi cult acidic com-pounds with limited retention or limited detection in positive mode electrospray.
Figure 2 Chromatographic separation of phosphonate compounds on Ascentis C18
column: Ascentis C18, 15 cm x 4.6 mm I.D., 5 μm particles (581324-U) mobile phase: 95:4, 10 mM N,N-dimethylhexylamine:acetonitrile pH 5.0 formic acid flow rate: 1.0 mL/min. oven temp.: 35 °C det.: full scan MS ESI+ injection: 5 μL sample: 100 μg/mL in mobile phase split flow rate: 100 μL/min
Analyte Retention Time Alendronate 3.64 min Pamidronate 4.12 min Risedronate 4.77 min
G004305Min0 2 4 6 8
G004303
2.00E+06
Min0 2 4 6 8
1.00E+06
0.00E+00
Alendronate
G004304Min0 2 4 6 8
Pamidronate2.00E+06
1.00E+06
0.00E+00
1.00E+06
5.00E+05
0.00E+00
Risedronate
Fluka’s IPC reagents are carefully analysed and tested for functional performance, and absence of insoluble matter and non-absorbing impurities. These reagents offer:
highest purity exhibiting minimal extinction in the low UV excellent transparency down to 200 nm
Analytical Reagents and Standards Catalogue2009/2010 New!
Fluka Analytical Reagents & Standard catalogue available. A comprehensive listing of all Sigma-Aldrich analytical chemicals including the Ion Pair Reagents. Request your copy now!
sigma-aldrich.com/fluka_cat
10St
and
ard
st
Sam
ple
Han
dlin
g
sigma-aldrich.com/supelmip
Comparison of SupelMIP™ SPE – Beta-Agonists and Mixed-Mode SPE for the Extraction of Beta-Agonists from Urine Samples
IntroductionBeta-2-adrenergic receptor agonists (Beta-agonists) have been clini-cally used in the treatment of cardiovascular and breathing disorders in veterinary and human medicine. However, beta-agonists are also used as illegal muscle growth promoters due to their anabolic effects both in humans and in animals. Although the US Food and Drug Administration, US Department of Agricultural and European Union have banned the use of beta-agonists for humans and livestock, illegal use of this class of drugs still frequently occurs. For example, the beta-agonist clenbuterol is widely used among body builders and athletes due to its anabolic effects. In addition, beta-agonists are readily used by farmers to give animals a competitive advantage. Due to the potential health risks and competitive advantage associ-ated with beta-agonists used in livestock and human performance enhancement, residue screening programmes are conducted world-wide to monitor the drug. It is therefore critical to develop a highly selective and sensitive analytical assay to monitor beta-agonist residues in diffi cult biological matrices such as urine, retina, tissues, etc. Table 1 offers an overview of the minimum required perfor-mance levels (MRPLs) required of an assay across common sample matrices.
In this article, a summary of the work performed at the Veterinary Institute in Oldenburg, Germany is presented. In order to enhance the methods for analysing beta-agonists, the use of a molecularly imprinted polymer SPE phase (developed specifi cally for beta-agonist
The following was generated by an outside source using Sigma-Aldrich products. Technical content provided by:Olaf Heemken1 and Anna-Karin Whilborg2
1 LAVES, Veterinary Institute, Oldenburg, Germany2 MIP Technologies AB, Lund, Sweden
Table 1 MRPLs of beta-agonist assays in different matrices
Sample Pre-Treatment:Hydrolyse 5-10 mL calf urine with Glucuronidase/Sulphatase with an activity of 85.000 units/mL (2 h at 37 °C, pH, 5 Sigma-Aldrich Prod. No.G0876). Adjust pH to 6-7 followed by centrifugation.
SPE: SupelMIP SPE – Beta-agonists, 25 mg/10 mL, (Cat. No. 53210-U). Note that a flow rate ~0.5 mL/min was employed for conditioning, sample load and wash. A flow rate of ~0.2 mL/min was used during elution.1. Column conditioning:
The columns were equilibrated with 1 mL methanol followed by 1 mL DI water and 1 mL 25 mM ammonium or sodium acetate, pH 6.7.
2. Sample load:10 mL urine was loaded on the column.
3. Washing:1 mL DI water followed by full vacuum through cartridge for 2 min1 mL 1 % acetic acid in acetonitrile1 mL 50 mM ammonium acetate, pH 6.71 mL 60 % acetonitrile/40 % DI water, followed by full vacuum through cartridge for 2 min. to dry the columns
4. Elution:2 x 1 mL MeOH /10 % acetic acidEluate was evaporated and reconstituted in mobile phase prior to analysis
Analytical Method: Column: Polar Reversed-Phase, Phenyl Phase, 4 μm, 150 x 2 mm
System:HPLC Agilent 1100 Series
Mobile Phase:(A) 5 mM ammonium acetate; (B) methanol
extraction) was explored. More specifi cally, SupelMIP – Beta-agonist SPE was evaluated for urine samples and compared against a conven-tional mixed-mode SPE procedure.
MethodologyIn this work, beta-agonist-spiked calf urine samples were extracted and compared using both SupelMIP SPE – Beta-agonist, 25 mg/10 mL LRC and Clean Screen® DAU SPE, 500 mg/6 mL (United Chemical Technologies, PA, USA). The SupelMIP extraction and analysis method is detailed in Table 2.
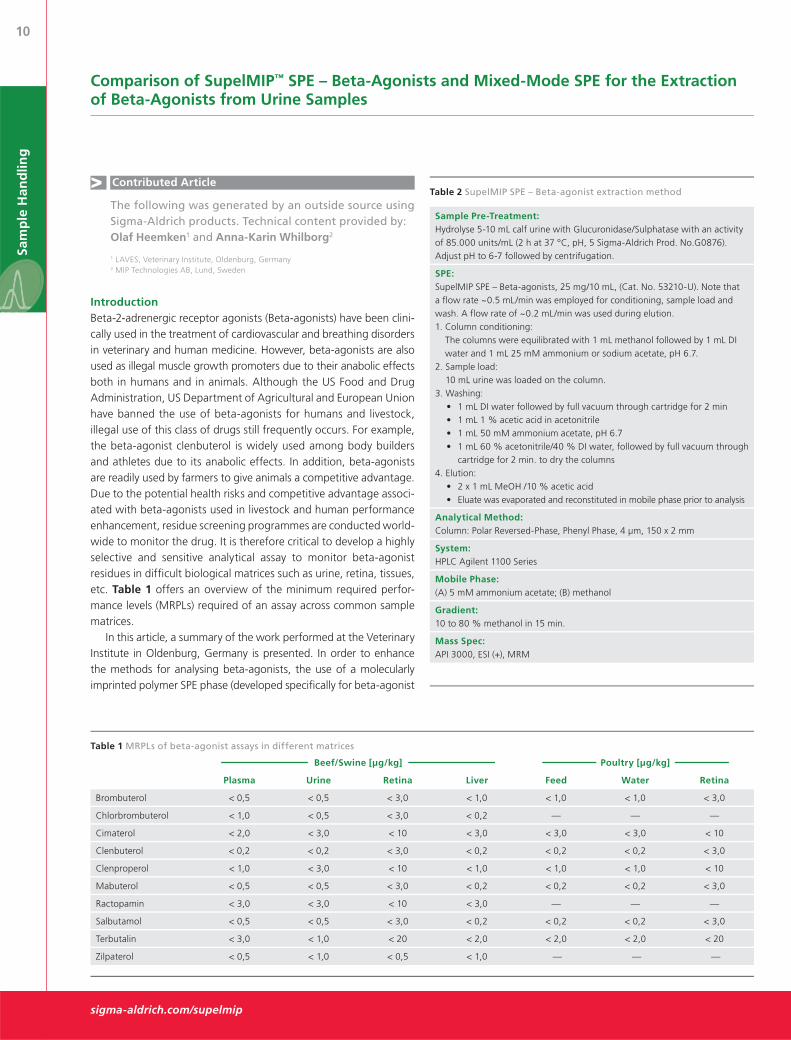
ResultsIn order to evaluate the performance of the SupelMIP SPE, beta-ago-nist-spiked urine was extracted and compared against Clean Screen DAU SPE (mixed-mode). Figure 1 depicts extracted ion-chromato-grams of salmeterol extracted with both SupelMIP SPE and Clean Screen DAU. From this fi gure, background for salmeterol using SupelMIP is signifi cantly lower than the mixed-mode approach. In addition, response height was greater using the SupelMIP method.
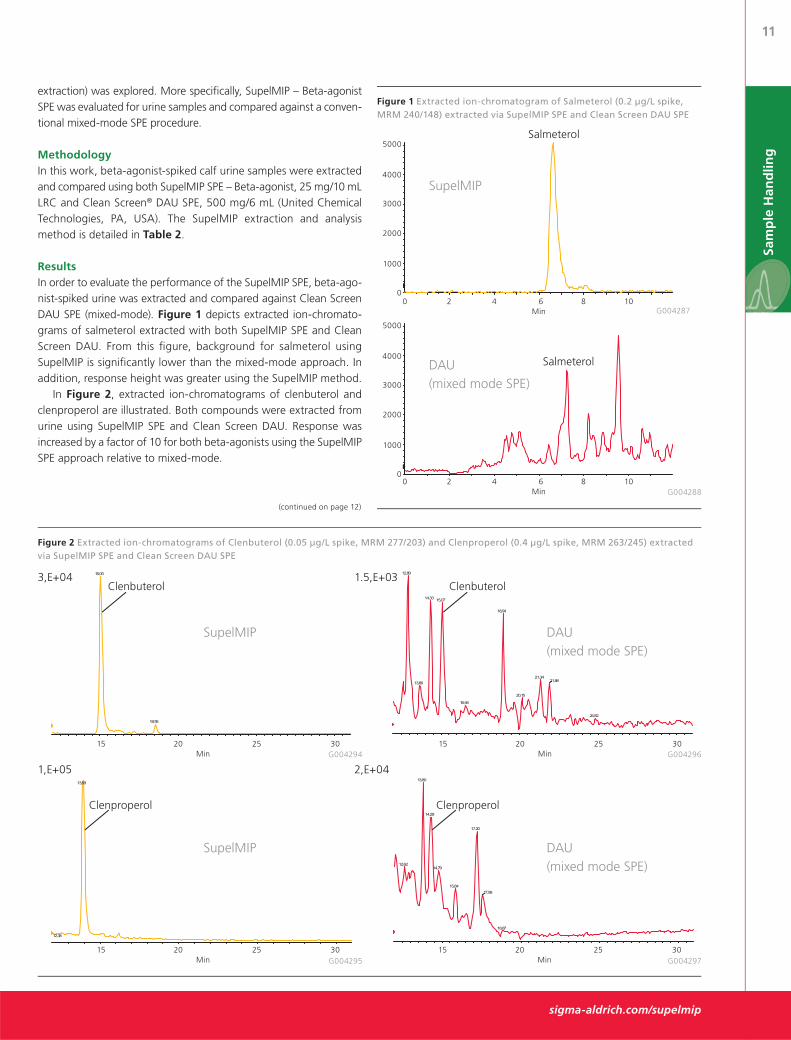
In Figure 2, extracted ion-chromatograms of clenbuterol and clenproperol are illustrated. Both compounds were extracted from urine using SupelMIP SPE and Clean Screen DAU. Response was increased by a factor of 10 for both beta-agonists using the SupelMIP SPE approach relative to mixed-mode.
(continued on page 12)
Figure 1 Extracted ion-chromatogram of Salmeterol (0.2 μg/L spike, MRM 240/148) extracted via SupelMIP SPE and Clean Screen DAU SPE
Figure 2 Extracted ion-chromatograms of Clenbuterol (0.05 μg/L spike, MRM 277/203) and Clenproperol (0.4 μg/L spike, MRM 263/245) extracted via SupelMIP SPE and Clean Screen DAU SPE
G004288Min0 2 4 6 8 10
5000
3000
4000
2000
0
1000
SalmeterolDAU (mixed mode SPE)
1.5,E+033,E+04
2,E+041,E+05
Min Min
Min Min
15 20 25 30 15 20 25 30
15 20 25 30 15 20 25 30
G004294 G004296
G004295 G004297
SupelMIP DAU (mixed mode SPE)
Clenproperol
ClenbuterolClenbuterol
Clenproperol
DAU (mixed mode SPE)
SupelMIP
12St
and
ard
st
Sam
ple
Han
dlin
g
sigma-aldrich.com/supelmip
In Table 3, the signal-to-noise (S/N) ratio for a broad range of beta-agonists (target ion and qualifi er) are presented. For each of the beta-agonists, the SupelMIP approach provided a cleaner and more selective extraction. As a result S/N was signifi cantly higher (often by orders of magnitude).
ConclusionIn this work it was concluded that the SupelMIP SPE – Beta-agonists is a highly selective phase for beta-agonists. This high selectivity for
β-Glucuronidase from Helix pomatia, Type H-2, aqueous solution, ≥ 85,000 units/mL
G0876
NEW! SupelMIP for Fluoroquinolones from e.g. kidney, honey and milk …
For more information on SupelMIP SPE and the new application on Chloramphenicol from Shrimp, please visit our website: sigma-aldrich.com/supelmip
! Related Information
the class of compounds allows for very clean extracts with low levels of interfering contaminants. Comparing the performance with gen-eral mixed-mode phases, a clear enhancement in the signal-to-noise ratio is obtained using the SupelMIP phase, allowing for increased analytical sensitivity and lower detection levels.
The method as described fulfi ls all criteria of the EU Commission Decision 2002/657/EC for confi rmatory analysis of substances listed in group A of Annex I of Council Directive 96/23/EC and has been adopted for routine analysis by the Veterinary Institute Oldenburg.
Table 3 Signal-to-noise ratio of beta-agonists
SupelMIP Clean Screen DAU
Target Qualifier Target Qualifier
Brombuterol 5200 1900 90 30
Chlorbrombuterol 2500 370 120 40
Cimaterol 560 710 100 380
Clenbuterol 1300 140 120 50
Clenproperol 430 1100 100 30
Mabuterol 3000 1100 260 60
Ractopamin 3100 720 100 70
Salbutamol 330 40 40 40
Terbutalin 1300 230 20 70
Zilpaterol 140 220 60 40
NEW! HybridSPE™ – Precipitation Technology
Features & Benefits: Merges both Protein Precipitation (PPT) & Solid Phase Extraction (SPE)
– Offers simplicity & generic nature of protein precipitation Selectivity approaches SPE via the targeted –removal of phospholipid
2-3 step generic procedure Reduce ion-suppression 100 % removal of phospholipids & precipitated proteins Minimal to no method development Available in 96-well and 1 mL cartridge dimensions Patent pending technology
To learn more, visit our website: sigma-aldrich.com/hybridspe-ppt or contact Supelco Technical Service at [email protected]
Combines the simplicity of protein precipitation and the selectivity of SPE for the targeted removal of phospholipids and proteins
SPME for analysis of non-volatile analytes in biological fl uids has been greatly restricted due to limitations of the GC type fi bre coatings. These coatings tend to swell when desorbed in organic solvents and eventually strip from the fi bre when retracted into the needle. New fi bres being investigated contain a solvent-stable binder. In addi-tion, this binder is biocompatible such that proteins and other large molecules do not stick to the coating. This enables small molecules to interact with the phase coating on the silica particle and produce a very clean sample. The SPME fi bres used in the analysis discussed here were experimental fi bres, functionalised with a polar-embed-ded liquid chromatography stationary phase enabling the extraction of polar analytes from a high aqueous environment.
ExperimentalThe utility of biocompatible SPME fi bres is demonstrated for the extraction of the beta-blocking agent propranolol and 4-hydroxy-propranolol (4-HP) metabolite from a rat plasma matrix. Extraction effi ciency calibration curves for the SPME fi bres were generated from buffer solutions and rat plasma across a range from 5 to 100 ng/mL. Typical dosage levels of propranolol have been found to be in the range of 10 –100 ng/mL, with toxicity occurring at levels >2000 ng/mL. Samples were spiked with propranolol and the 4-HP metabolite and extracted under static conditions. Prior to extraction, fi bres were conditioned in methanol followed by equilibration in water. Phosphate buffer contained 0.8 % sodium chloride to mimic con-centrations consistent with blood plasma. Desorption was carried out by placing the SPME fi bre into 100 μL of desorption solvent for 1 hour prior to LC-MS-MS analysis.
Reducing Sample UsageBecause SPME is concentration dependent, reduction in sample volume should not affect analyte extraction effi ciency. Therefore, reducing the sample size from 500 μL to 100 μL was not expected to result in a 5x reduction in analyte response.
To confi rm this, a reproducibility experiment was conducted from rat plasma, using both 100 μL and 500 μL sample sizes. The spiking level of the analytes was 50 ng/mL.
Table 1 shows little statistical difference in the amount of ex-tracted propranolol or the 4-HP metabolite between the 500 μL and 100 μL sample volume, confi rming that a smaller sample volume will not proportionately reduce response.
Linearity Using 100 μL Sample Size To evaluate the effect of reduced sample volume across a range of sample concentrations, a linearity experiment was conducted for both buffer solution and rat plasma using a 100 μL sample volume and a 100 μL desorption volume. The spiked concentrations ranged from 5 ng/mL to 100 ng/mL for both propranolol and 4-HP metabolite.
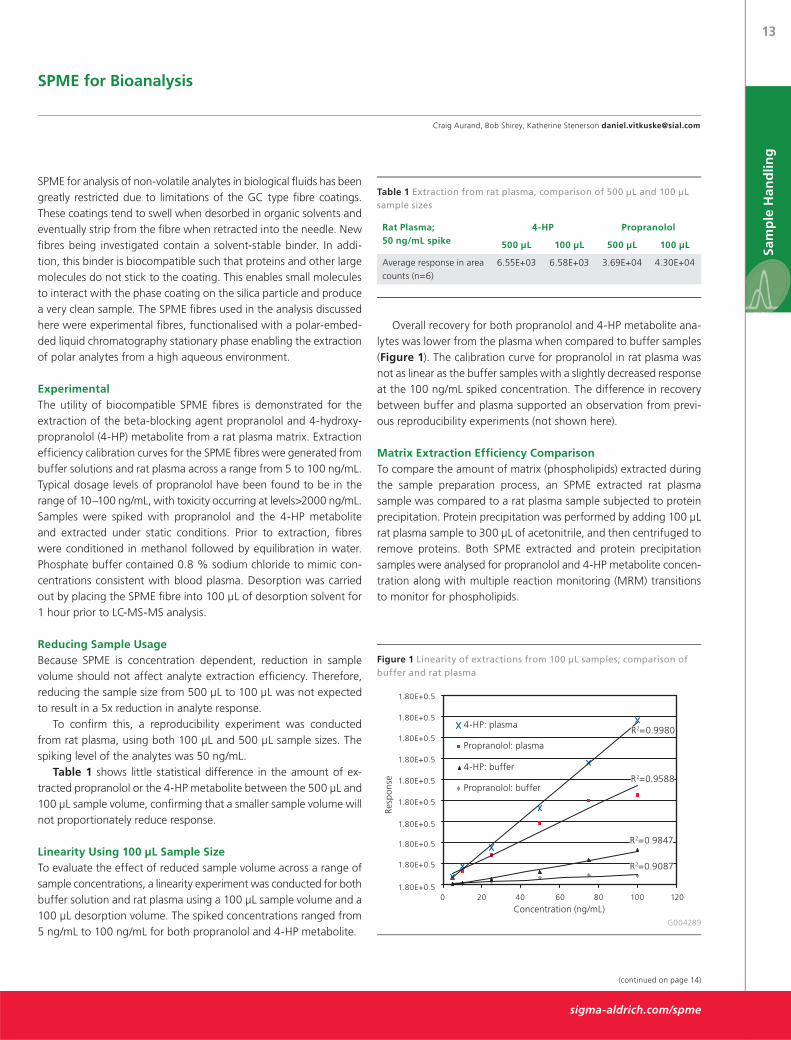
Overall recovery for both propranolol and 4-HP metabolite ana-lytes was lower from the plasma when compared to buffer samples (Figure 1). The calibration curve for propranolol in rat plasma was not as linear as the buffer samples with a slightly decreased response at the 100 ng/mL spiked concentration. The difference in recovery between buffer and plasma supported an observation from previ-ous reproducibility experiments (not shown here).
Matrix Extraction Efficiency Comparison To compare the amount of matrix (phospholipids) extracted during the sample preparation process, an SPME extracted rat plasma sample was compared to a rat plasma sample subjected to protein precipitation. Protein precipitation was performed by adding 100 μL rat plasma sample to 300 μL of acetonitrile, and then centrifuged to remove proteins. Both SPME extracted and protein precipitation samples were analysed for propranolol and 4-HP metabolite concen-tration along with multiple reaction monitoring (MRM) transitions to monitor for phospholipids.
Figure 1 Linearity of extractions from 100 μL samples; comparison of buffer and rat plasma
Table 1 Extraction from rat plasma, comparison of 500 μL and 100 μL sample sizes
1.80E+0.5
Resp
onse
1.80E+0.5
1.80E+0.5
1.80E+0.5
1.80E+0.5
1.80E+0.5
1.80E+0.5
1.80E+0.5
1.80E+0.5
1.80E+0.5
Concentration (ng/mL)0 20 40 60 80 100 120
4-HP: plasma
Propranolol: plasma
4-HP: buffer
Propranolol: bufferR2=0.9588
R2=0.9980
R2=0.9847
R2=0.9087
G004289
Rat Plasma; 50 ng/mL spike
4-HP Propranolol
500 μL 100 μL 500 μL 100 μL
Average response in area counts (n=6)
6.55E+03 6.58E+03 3.69E+04 4.30E+04
14St
and
ard
st
Sam
ple
Han
dlin
g
sigma-aldrich.com/spme
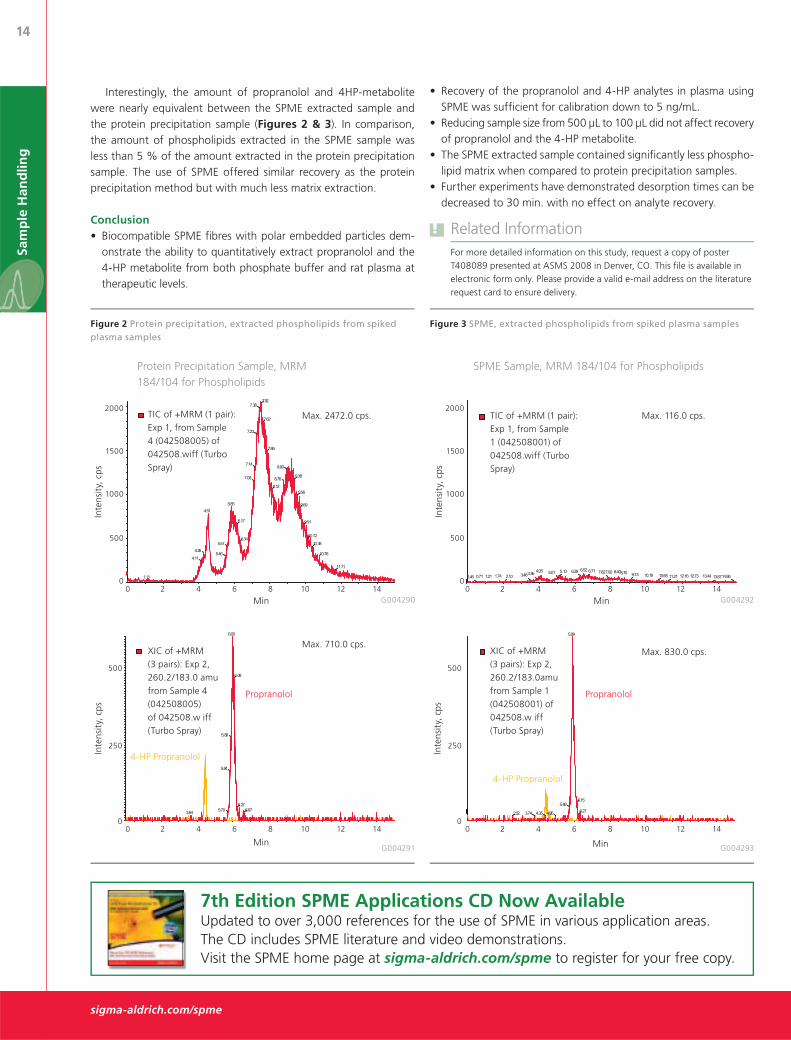
Interestingly, the amount of propranolol and 4HP-metabolite were nearly equivalent between the SPME extracted sample and the protein precipitation sample (Figures 2 & 3). In comparison, the amount of phospholipids extracted in the SPME sample was less than 5 % of the amount extracted in the protein precipitation sample. The use of SPME offered similar recovery as the protein precipitation method but with much less matrix extraction.
ConclusionBiocompatible SPME fibres with polar embedded particles dem-onstrate the ability to quantitatively extract propranolol and the 4-HP metabolite from both phosphate buffer and rat plasma at therapeutic levels.
Figure 2 Protein precipitation, extracted phospholipids from spiked plasma samples
Protein Precipitation Sample, MRM 184/104 for Phospholipids
TIC of +MRM (1 pair): Exp 1, from Sample 4 (042508005) of 042508.wiff (Turbo Spray)
Min0 2 4 6 8 10 12 14
0
Inte
nsit
y, c
ps
500
1000
1500
2000
G004290
Max. 2472.0 cps.
Figure 3 SPME, extracted phospholipids from spiked plasma samples
SPME Sample, MRM 184/104 for Phospholipids
For more detailed information on this study, request a copy of poster T408089 presented at ASMS 2008 in Denver, CO. This file is available in electronic form only. Please provide a valid e-mail address on the literature request card to ensure delivery.
! Related Information
Recovery of the propranolol and 4-HP analytes in plasma using SPME was sufficient for calibration down to 5 ng/mL.Reducing sample size from 500 μL to 100 μL did not affect recovery of propranolol and the 4-HP metabolite.The SPME extracted sample contained significantly less phospho-lipid matrix when compared to protein precipitation samples.Further experiments have demonstrated desorption times can be decreased to 30 min. with no effect on analyte recovery.
Min
Inte
nsit
y, c
ps
0
500
250
XIC of +MRM (3 pairs): Exp 2, 260.2/183.0 amu from Sample 4 (042508005) of 042508.w iff (Turbo Spray)
Max. 710.0 cps.
Propranolol
4-HP Propranolol
G004291
0 2 4 6 8 10 12 14
0
Inte
nsit
y, c
ps
500
1000
1500
2000
Min G004292
TIC of +MRM (1 pair): Exp 1, from Sample 1 (042508001) of 042508.wiff (Turbo Spray)
Max. 116.0 cps.
0 2 4 6 8 10 12 14
G004293Min
Inte
nsit
y, c
ps
0
500
250
XIC of +MRM (3 pairs): Exp 2, 260.2/183.0amu from Sample 1 (042508001) of 042508.w iff (Turbo Spray)
Max. 830.0 cps.
Propranolol
4-HP Propranolol
0 2 4 6 8 10 12 14
7th Edition SPME Applications CD Now AvailableUpdated to over 3,000 references for the use of SPME in various application areas. The CD includes SPME literature and video demonstrations.Visit the SPME home page at sigma-aldrich.com/spme to register for your free copy.
IntroductionOne area of current public interest is nutrition, specifi cally, the fat content of food. Obesity, diabetes and cardiovascular disease, along with their related complications, are increasing in America, Europe, and in other parts of the world. However, it is not only total fat, but also the type of fat that must be considered. Some “good fats” are required for biochemical processes or necessary for dissolving fat-soluble vitamins. Other “bad fats” accumulate in the cardiovascular system, potentially leading to health problems.
Each type of fat has unique physical (such as boiling point) and chemical (such as degree, location and confi guration of unsaturation) properties. Because of this, different analytical methods are required to properly obtain all desired information to be of use in determining the nutritional and health value of a food.
The following article in this Reporter covers the analysis of FAMEs by boiling point elution [1]. Previous Reporter articles have detailed the GC analysis of omega 3 and omega 6 fatty acids as FAMEs and cis/trans fatty acid isomers as FAMEs [2 – 3]. This article will discuss the analysis of free fatty acid.
Free Fatty AcidsShort chain, volatile fatty acids are typically analysed in the free form using specialised columns. This group of compounds may be referred to as free fatty acids (FFAs), volatile fatty acids (VFA), or carboxylic acids. The analysis of fatty acids in the free form instead of as fatty acid methyl esters results in easier and quicker sample preparation. Additionally, artefact formation that may result from a derivatisation procedure is eliminated.
GC Column ChoicesFor the GC analysis of free fatty acids, a specialised column that will not allow the adsorption of active carboxyl groups is required. The Nukol™, with its acidic character, is well suited for this application, allowing chromatography with excellent peak shapes. Table 1 dis-plays the column specifi cations for the Nukol.
Figures 1 – 3 show chromatograms of various free fatty acid mixes on several dimensions of the Nukol, using both isothermal and oven temperature programmed run conditions. Fatty acid chain lengths in these three analyses range from C2 – C20. As shown, excellent peak shapes are observed for all analytes.
Chemical StandardsStandards for the determination of free fatty acids should be pur-chased from a chemical manufacturer with knowledge in the preparation, handling, storage and shipment of volatile analytes. Supelco, with over 40 years in chemical standard manufacturing, offers several suitable standards. Selected standards can be found in the product listing at the end of this article.
ConclusionMeasuring and reporting of the fatty acid content of food is an important step that allows consumers the chance to establish a healthy dietary strategy. Nukol capillary GC columns and specially formulated chemical standards are quite suitable for the application shown in this article, GC analyses of free fatty acids.
This article, those in previous Reporters, and the sigma-aldrich.com/fame web page illustrate the breadth of special-ised GC columns and the vast array of specially formulated chemical standards that are available for fatty acid and FAME analyses. Sigma-Aldrich/Supelco, with unsurpassed knowledge and product offer-ings, is truly the total solution for obtaining superior products for the GC analyses of fatty acids from foods for nutritional needs.
ReferencesM.D. Buchanan, Supelco Reporter, Jan 2009; Vol. 34: 17–19.1] L.M. Sidisky, K.K. Stenerson, G.A. Baney, M.D. Buchanan, Supelco 2] Reporter, March 2008; Vol. 30: 16–18.M.D. Buchanan, Supelco Reporter, Jan 2008; Vol. 29: 16–17.3]
Application: The incorporation of acid functional groups into the phase lends an acidic character to this column, useful for analyses of volatile acidic compounds. Difficult-to-analyse carboxylic acids (free fatty acids) can be analysed with excellent peak shape and minimal adsorption.
USP Code: This column meets USP G25 and G35 requirements.
Each analyte at 10 mM in deionised water, 100 mLAcetic acid Isobutyric acidButyric acid Isovaleric acidFormic acid 4-Methylvaleric acidHeptanoic acid Propionic acidHexanoic acid Valeric acid
+Related ProductsDescription Cat. No.
Nukol Capillary GC Columns
15 m x 0.25 mm I.D., 0.25 μm 24106-U
60 m x 0.25 mm I.D., 0.25 μm 24108
30 m x 0.32 mm I.D., 0.25 μm 24131
60 m x 0.32 mm I.D., 0.25 μm 24132
15 m x 0.32 mm I.D., 1.00 μm 24206-U
30 m x 0.32 mm I.D., 1.00 μm 24207
60 m x 0.32 mm I.D., 1.00 μm 24208
30 m x 0.53 mm I.D., 0.50 μm 25327
60 m x 0.53 mm I.D., 0.50 μm 25386
30 m x 0.53 mm I.D., 1.00 μm 25357
Chemical Standards
Water Soluble Fatty Acid Mix 2 (WSFA-2)Each analyte at 0.1 wt. % in deionised water, 5 mLAcetic acid Isovaleric acidButyric acid Propionic acidIsobutyric acid Valeric acid
47056
Water Soluble Fatty Acid Mix 4 (WSFA-4)Each analyte at 0.1 wt. % in deionised water, 5 mLAcetic acid 2-Methylbutyric acidButyric acid Propionic acidIsobutyric acid Valeric acidIsovaleric acid
47058
Non-Volatile Acid Standard MixEach analyte at 0.01 meg/mL in deionised water, 100 mLFumaric acid Oxalacetic acidLactic acid Oxalic acidMalonic acid Pyruvic acidMethylmalonic acid Succinic acid
46985-U
A great resource for the food chemist is the Sigma-Aldrich/Supelco FAME website: sigma-aldrich.com/fame.Product listings, technical literature detailing how to use these products, chromatograms with peak IDs and condi-tions listed, and peer-reviewed literature references can be easily found.
Did you know?>
Figure 3 Organic acids on the Nukol
column: Nukol, 15 m x 0.32 mm I.D., 0.25 μm (24130) oven: 80 °C (1 min.), 15 °C/min. to 200 °C (3 min.) inj.: 250 °C det.: FID, 250 °C carrier gas: helium, 2 mL/min. constant injection: 1 μL, 100:1 split liner: 4 mm I.D., split, cup design sample: 5 analytes, at concentrations indicated in 1 M H3PO4
794-0479
Figure 1 Short chain free fatty acids on the Nukol
column: Nukol, 30 m x 0.25 mm I.D., 0.25 μm (24107) oven: 185 °C det.: FID carrier gas: helium, 20 cm/sec injection: 1 μL, 100:1 split sample: Volatile Free Acid Mix (46975-U), each analyte at 10 mM in deionised water
Figure 2 Short and long chain free fatty acids on the Nukol
column: Nukol, 15 m x 0.53 mm I.D., 0.50 μm (25326) oven: 100 °C, 10 °C/min. to 220 °C det.: FID carrier gas: helium, 30 mL/min. injection: 0.5 μL, direct injection sample: 16 analytes, at various concentrations from 50 to 800 μg/mL
For more information on the analysis of fatty acids and fatty acid methyl esters, request Bulletin 855, Analyzing Fatty Acids by Capillary Gas Chromatography, T110855 (AYC).
IntroductionFor the food chemist, determining the fatty acid composition of a product may be diffi cult because foods can contain a complex mix-ture of saturated, monounsaturated, and polyunsaturated fatty acids, each with a variety of carbon chain lengths. Many specialised prod-ucts, such as GC columns and chemical standards, exist specifi cally for use in the quantitative identifi cation of fatty acids. Each of these products is manufactured with the chromatographer in mind, to help them ensure accurate and reproducible analyses.
FAMEs by Boiling Point ElutionGC can be used to analyse fatty acids either as free fatty acids or as fatty acid methyl esters. There are distinct reasons for either choice. Short chain, more volatile fatty acids are typically analysed in the free form using specialised columns. The main benefi ts are the ease/speed of sample preparation and the lack of artefacts in the analysis resulting from a derivatisation procedure. Fatty acids can also be analysed as fatty acid methyl esters. The main reasons include:
In their free, underivatised form, fatty acids may be difficult to analyse because these highly polar compounds tend to form hydrogen bonds, leading to adsorption issues. Reducing their polarity may make them more amenable for analysis.To distinguish between the very slight differences exhibited by unsaturated fatty acids, the polar carboxyl functional groups must first be neutralised. This then allows column chemistry to perform separations by boiling point elution, and also degree, position, and even the cis vs. trans configuration of unsaturation.
The previous article in this Reporter covers the analysis of free fatty acids [1]. Previous Reporter articles have detailed the GC analysis of omega 3 and omega 6 fatty acids as FAMEs and cis/trans fatty acid isomers as FAMEs [2-3]. This article will focus on the analysis of FAMEs by boiling point elution, used for pattern recognition. This technique is useful for:
Determining the source of fatty acids when compared to patterns/profiles from known references, each with a unique fatty acid distribution. Qualitative and quantitative analysis is fundamental to food manufacturers for quality control, purity determination, and for the detection of adulterants.Observing subtle differences from sample to sample, allowing the effects on fatty acid metabolism, caused by either external or internal influences, to be detected. This growing area of research is commonly referred to as metabolomics, and extends to com-pound classes beyond fatty acids.
GC Column ChoicesThe separation of analytes in a boiling point elution requires the use of a non-polar GC column. The Equity-1, a rugged non-polar column, can be used for this application with great success. Column specifi -cations for the Equity-1 are shown in Table 1.
(continued on page 18)
Application: This column is designed for applications where a non-polar column is required. Analytes will be separated primarily according to boiling point.
USP Code: This column meets USP G1, G2 and G9 requirements.
Polymer: Bonded; poly(dimethylsiloxane)
Temp. Limits:-60 °C to 325/350 °C for 0.10 – 0.32 mm I.D.-60 °C to 300/320 °C for 0.53 mm I.D. (<1.5 μm)-60 °C to 260/280 °C for 0.53 mm I.D. (>1.5 μm)
Table 1 Equity-1 Capillary GC Columns
A chromatogram of the Supelco 37-Component FAME Mix on the Equity-1 is presented in Figure 1. As shown, this column pos-sesses the necessary column chemistry for the analysis of saturated, unsaturated and polyunsaturated FAMEs, ranging in chain length from C4 to C24, with excellent peak shapes. Figure 2 shows the analysis of bacterial acid methyl esters (BAMEs) on the Equity-1. This C10-C20 mix contains hydroxyl-FAMEs and branched FAMEs in addition to saturated, unsaturated and polyunsaturated FAMEs. Again, excellent peak shape is observed for all analytes.
Note that both of the depicted chromatograms use Fast GC con-ditions: short column with narrow I.D., high carrier gas linear velocity, and rapid oven temperature programming. Columns with traditional dimensions (such as 30 m x 0.25 mm I.D., 0.25 μm) can also be used for these applications with equal success.
Chemical StandardsTo assign identifi cation when performing the boiling point elution of fatty acid methyl esters for pattern recognition, standards of known reference must be used. To assist in confi rming identifi cation, Supelco offers several suitable standards. Selected standards can be found in the product listing at the end of this article. One standard is the Supelco 37-Component FAME Mix (47885-U). This standard con-tains methyl esters of fatty acids ranging from C4 to C24, including key monounsaturated and polyunsaturated fatty acids, making this standard very useful to food analysts since it can be used to identify fatty acids in many different types of foods.
GC
18
sigma-aldrich.com/fame
Figure 1 37-Component FAME Mix on the Equity-1
column: Equity-1, 15 m x 0.10 mm I.D., 0.10 μm (28039-U) oven: 100 °C, 50 °C/min. to 300 °C (1 min.) inj.: 250 °C det.: FID, 300 °C carrier gas: hydrogen, 50 cm/sec constant injection: 0.2 μL, 200:1 split liner: 4 mm I.D., split, cup design sample: Supelco 37-Component FAME Mix (47885-U), analytes at concentrations indicated in methylene chloride
1. Butyric Acid Methyl Ester (C4:0) at 4 wt % 2. Caproic Acid Methyl Ester (C6:0) at 4 wt % 3. Caprylic Acid Methyl Ester (C8:0) at 4 wt % 4. Capric Acid Methyl Ester (C10:0) at 4 wt % 5. Undecanoic Acid Methyl Ester (C11:0) at 2 wt % 6. Lauric Acid Methyl Ester (C12:0) at 4 wt % 7. Tridecanoic Acid Methyl Ester (C13:0) at 2 wt % 8. Myristic Acid Methyl Ester (C14:0) at 4 wt % 9. Myristoleic Acid Methyl Ester (C14:1) at 2 wt % 10. Pentadecanoic Acid Methyl Ester (C15:0) at 2 wt % 11. cis-10-Pentadecenoic Acid Methyl Ester (C15:1) at 2 wt % 12. Palmitic Acid Methyl Ester (C16:0) at 6 wt % 13. Palmitoleic Acid Methyl Ester (C16:1) at 2 wt % 14. Heptadecanoic Acid Methyl Ester (C17:0) at 2 wt % 15. cis-10-Heptadecenoic Acid Methyl Ester (C17:1) at 2 wt % 16. Stearic Acid Methyl Ester (C18:0) at 4 wt % 17. Oleic Acid Methyl Ester (C18:1n9c) at 4 wt % 18. Elaidic Acid Methyl Ester (C18:1n9t) at 2 wt % 19. Linoleic Acid Methyl Ester (C18:2n6c) at 2 wt % 20. Linolelaidic Acid Methyl Ester (C18:2n6t) at 2 wt % 21. g-Linolenic Acid Methyl Ester (C18:3n6) at 2 wt % 22. a-Linolenic Acid Methyl Ester (C18:3n3) at 2 wt % 23. Arachidic Acid Methyl Ester (C20:0) at 4 wt % 24. cis-11-Eicosenoic Acid Methyl Ester (C20:1n9) at 2 wt % 25. cis-11,14-Eicosadienoic Acid Methyl Ester (C20:2) at 2 wt % 26. cis-8,11,14-Eicosatrienoic Acid Methyl Ester (C20:3n6) at 2 wt % 27. cis-11,14,17-Eicosatrienoic Acid Methyl Ester (C20:3n3) at 2 wt % 28. Arachidonic Acid Methyl Ester (C20:4n6) at 2 wt % 29. cis-5,8,11,14,17-Eicosapentaenoic Acid Methyl Ester (C20:5n3) at 2 wt % 30. Heneicosanoic Acid Methyl Ester (C21:0) at 2 wt % 31. Behenic Acid Methyl Ester (C22:0) at 4 wt % 32. Erucic Acid Methyl Ester (C22:1n9) at 2 wt % 33. cis-13,16-Docosadienoic Acid Methyl Ester (C22:2) at 2 wt % 34. cis-4,7,10,13,16,19-Docosahexaenoic Acid Methyl Ester (C22:6n3) at 2 wt % 35. Tricosanoic Acid Methyl Ester (C23:0) at 2 wt % 36. Lignoceric Acid Methyl Ester (C24:0) at 4 wt % 37. Nervonic Acid Methyl Ester (C24:1n9) at 2 wt %
G003971
G003911
Figure 2 Bacterial Acid Methyl Esters (BAMEs) on the Equity-1
column: Equity-1, 15 m x 0.10 mm I.D., 0.10 μm (28039-U) oven: 175 °C, 30 °C/min. to 275 °C (1 min.) inj.: 280 °C det.: FID, 280 °C carrier gas: hydrogen, 45 cm/sec constant injection: 0.5 μL, 200:1 split liner: 4 mm I.D., split, cup design sample: Bacterial Acid Methyl Ester (BAME) Mix (47080-U), methyl ester derivatives of a naturally occurring mix of bacterial fatty acids, total concentration of 10 mg/mL in methyl caproate
Highly Characterised Reference Oils are offered that can be used as controls or check samples, providing an excellent means of standardising applications and comparing results to others. AOCS Animal and Vegetable Reference Mixes are also available. Each quantitative mix is similar to the fatty acid distribution of certain oils, as specifi ed in the AOCS reference mixes article on page 22, and conforms to the requirements of AOCS Method Ce 1-62.
ConclusionMeasuring and reporting of the fatty acid content of food is an important step that allows consumers the chance to establish a healthy dietary strategy. Equity-1 capillary GC columns and specially formulated chemical standards are quite suitable for the application shown in this article, GC analyses of FAMEs by boiling point elution.
GC
19
sigma-aldrich.com/fame
This article, those in previous Reporter issues, and the sigma-aldrich.com/fame web page illustrate the breadth of special-ised GC columns and the vast array of specially formulated chemical standards that are available for fatty acid and FAME analyses. Sigma-Aldrich/Supelco, with unsurpassed knowledge and product offerings, is truly the total solution for obtaining superior products for the GC analyses of fatty acids from foods for nutritional needs.
The Supelco 37-Component FAME Mix is very useful to food analysts since it can be used to identify fatty acids in many different types of foods
ReferencesM.D. Buchanan, Supelco Reporter, Jan 2009; 34: 15–16.1] L.M. Sidisky, K.K. Stenerson, G.A. Baney, M.D. Buchanan, Supelco 2] Reporter, March 2008; Vol. 30: 16–18.M.D. Buchanan, Reporter, Jan 2008; Vol. 29: 16–17.3]
… that with Discovery Ag-Ion SPE tubes you can fraction-ate cis & trans FAMEs prior to GC analysis for more reliable and robust quantifi cation of trans and cis isomers. Read more in our technical report T406062 (IRV) available under sigma-aldrich.com/fame
Did you know?>
For more information on the analysis of fatty acids and fatty acid methyl esters, request Bulletin 855, Analyzing Fatty Acids by Capillary Gas Chromatography T110855 (AYC). For valuable information concerning the technique of Fast GC, including both practical considerations and theoretical discussions, request the Fast GC Brochure, T407096 (JTW).
! Related Information
+Featured ProductsDescription Cat. No.
Equity-1 Capillary GC Columns
15 m x 0.10 mm I.D., 0.10 μm 28039-U
Chemical Standards
Supelco 37-Component FAME Mix10 mg/mL (total wt.) in methylene chloride, 1 mLSee Figure 1 for list of analytes and concentrations
47885-U
Bacterial Acid Methyl Ester (BAME) Mix10 mg/mL (total wt.) in methyl caproate, 1 mLqualitative standard (individual wt. % not available)See Figure 2 for a representative distribution
47080-U
+Related ProductsDescription Cat. No.
Equity-1 Capillary GC Columns
12 m x 0.20 mm I.D., 0.33 μm 28041-U
25 m x 0.20 mm I.D., 0.33 μm 28042-U
10 m x 0.20 mm I.D., 1.20 μm 28043-U
30 m x 0.25 mm I.D., 0.10 μm 28044-U
15 m x 0.25 mm I.D., 0.25 μm 28045-U
30 m x 0.25 mm I.D., 0.25 μm 28046-U
60 m x 0.25 mm I.D., 0.25 μm 28047-U
15 m x 0.25 mm I.D., 1.00 μm 28048-U
30 m x 0.25 mm I.D., 1.00 μm 28049-U
60 m x 0.25 mm I.D., 1.00 μm 28050-U
100 m x 0.25 mm I.D., 1.00 μm 28052-U
30 m x 0.32 mm I.D., 0.10 μm 28053-U
15 m x 0.32 mm I.D., 0.25 μm 28054-U
30 m x 0.32 mm I.D., 0.25 μm 28055-U
60 m x 0.32 mm I.D., 0.25 μm 28056-U
30 m x 0.32 mm I.D., 1.00 μm 28057-U
60 m x 0.32 mm I.D., 1.00 μm 28058-U
100 m x 0.32 mm I.D., 1.00 μm 28060-U
30 m x 0.32 mm I.D., 2.00 μm 28061-U
30 m x 0.32 mm I.D., 5.00 μm 28062-U
60 m x 0.32 mm I.D., 5.00 μm 28063-U
15 m x 0.53 mm I.D., 0.10 μm 28064-U
30 m x 0.53 mm I.D., 0.10 μm 28065-U
15 m x 0.53 mm I.D., 0.50 μm 28067-U
30 m x 0.53 mm I.D., 0.50 μm 28068-U
15 m x 0.53 mm I.D., 1.00 μm 28069-U
30 m x 0.53 mm I.D., 1.00 μm 28071-U
15 m x 0.53 mm I.D., 1.50 μm 28072-U
30 m x 0.53 mm I.D., 1.50 μm 28073-U
60 m x 0.53 mm I.D., 1.50 μm 28074-U
15 m x 0.53 mm I.D., 3.00 μm 28075-U
30 m x 0.53 mm I.D., 3.00 μm 28076-U
60 m x 0.53 mm I.D., 3.00 μm 28077-U
15 m x 0.53 mm I.D., 5.00 μm 28079-U
30 m x 0.53 mm I.D., 5.00 μm 28081-U
60 m x 0.53 mm I.D., 5.00 μm 28082-U
Highly Characterised Reference Oils
Canola Oil, 1 g 46961
Coconut Oil, 1 g 46949
Corn Oil, 1 g 47112-U
Cottonseed Oil, 1 g 47113
Lard Oil, 1 g 47115-U
Linseed (Flaxseed) Oil, 1 g 47559-U
Menhaden Fish Oil, 1 g 47116
Menhaden Fish Oil, Partially Hydrogenated, 1 g 47117
Olive Oil, 1 g 47118
Palm Oil, 1 g 46962
Peanut Oil, 1 g 47119
Safflower Oil, 1 g 47120-U
Soybean Oil, 1 g 47122
Sunflower Seed Oil, 1 g 47123
AOCS Animal and Vegetable Reference Mixes
See page 22 for mix compositions and catalogue numbers
TRADEMARKS: Acquity, Waters – Waters; Ascentis, Equity, Fluka, HybridSPE, HYDRANAL, Nukol, Sigma-Aldrich, Supelco, SupelMIP – Sigma-Aldrich Biotechnology LP; Fused-Core – Advanced Materials Technology; Hamilton – Hamilton Co.; Riedel-de Haën – Honeywell International, Inc.; Clean Screen® – United Chemical Technologies, Inc.
SPME (Solid Phase Microextraction) – Technology licensed exclusively to Supelco. US patent #5,691,206. European patent #523,092
GC
20
sigma-aldrich.com/chiral
Chiral HPLC and GC Fast and efficient method development screening Optimisation projects Prep method development, optimisation and loading studies Small-scale HPLC purification – mg to 10 g
Purification by SMB From small to medium scale through to FDA approved production scale SMB and within the SAFC facilities around Europe
Just connect the VersaFlash stand to your existing fl ash infrastructure and use it as the cartridge holder.
The stand will allow you to use cartridges from 23 mm ID x 53 mm L (11 g silica, 15 g C18) up to 110 mm ID x 300 mm (1.3 kg silica, 1.9 kg C18) without the need for additional equipmentuse our highly efficient VersaPak cartridges packed with spherical silica for superior resolution and capacitystack cartridges to extend the separation pathway or to use different selectivities inline (e.g. silica and C18)connect an inline solid sample cartridge
To learn more about this versatile addition to your fl ash system and the benefi ts of spherical silica cartridges, visit us on the web at sigma-aldrich.com/versafl ash and request our multimedia CD with video demonstrations (literature code IZI). For further details, contact your local Sigma-Aldrich offi ce.
Expand the capabilities of your flash systemWould you like to add more Versatility and Efficiency to your current flash chromatography system?
Set-up example
Spherical silica increasesresolution and capacity
Spherical C18 Silicia
Irregular C18 Silicia
For further information, please contact [email protected] visit us on the web: sigma-aldrich.com/chiral
Stan
dar
ds
21
sigma-aldrich.com/standards
Capillary GC-MS is the preferred analytical technique and requires the use of quality reference standards.
To meet the needs of analysts, Sigma-Aldrich offers nitrosamine reference standards in the form of neat, single- and multi-compo-nent solutions for the monitoring of drinking water, foodstuffs and other matrices. All raw materials used in the production of these products have been screened for identity and purity. The single- and multi-component mixtures are gravimetrically prepared and quanti-tatively analysed by GC-MS. A certifi cate of analysis accompanies each standard.
Nitrosamine standards may also be prepared in specifi cally tailored combinations of concentration, components and solvents utilising our custom chemical standards programme. Testing options include quantitative analysis or your own supplied procedure. Please contact our Technical Service department at [email protected] to learn more about this service.
ReferencesEaton, Andrew Phd. From NDMA to Nitrosamines and Beyond? 1] Emerging Contaminants Seminar. Water Quality Technology Conference and Exposition 2004. World Health Organization. N-Nitrosodimethylamine in Drinking-2] Water. Background document for development of WHO Guidelines for Drinking-water Quality (2006).URL: www.epa.gov/safewater/ucmr/ucmr2/basicinformation.html3] URL: www.cosmeticsinfo.org/HBI/174] URL: www.lpi.oregonstate.edu/f~w00/nitrosamine.html5]
Quality Reference Standards for Monitoring Nitrosamine Contaminants
Nitrosamines are commonly occurring organic chemicals that pose a serious health threat to humans. They are easily formed by the reaction of an amine and a nitrosating agent such as nitrites, nitrogen oxides or nitrous acids. Laboratory studies have demonstrated that many of the nitrosamine compounds are carcinogenic in animals when ingested.
Nitrosamines can be found in many different settings and situa-tions, including air, water and soil. They are also found in cured meats, beer, tobacco smoke, dried nonfat milk, cosmetics, personal care products and the gastrointestinal tract of humans and animals [4,5].
Recently, more attention has been given to the presence of nitro-samines in drinking water. The US Environmental Protection Agency (EPA) currently requires public water systems serving more than 100,000 people to monitor drinking water for N-nitrosodimethylam-ine (NDMA) and fi ve other nitrosamines during the 2008 – 2010 pe-riod [3]. These chemicals form as a by-product of the chloramination of water to remove trihalomethane compounds. Although no target level has yet been set for drinking water, NDMA is believed to pose a cancer risk when present at a level between 0.7 ng/L – 2 ng/L [1].
The occurrence of NDMA and other nitrosamines has also been documented in recycled water effl uent, industrial wastewater dis-charges and sewage sludge [2]. All are sources of groundwater contamination, and provide the opportunity for nitrosamines, if present, to work their way into drinking water sources.
Because nitrosamines are present in many matrices at part-per-billion and part-per trillion levels, a high degree of sensitivity and proper sample extraction is required to monitor for their presence.
Description Concentration Pkg Cat. No.
Single-component solutions and neats
N-Nitrosodi-n-butylamine 2000 μg/mL in methylene chloride 1 mL 48320-U
N-Nitrosodi-n-butylamine 100 mg 442685
N-Nitrosodiethylamine 5000 μg/mL in methanol 1 mL 40334
N-Nitrosodiethylamine 1000 mg 442687
N-Nitrosodimethylamine 200 μg/mL in methanol 1 mL 48670
N-Nitrosodimethylamine 100 mg 48552
N-Nitrosodimethylamine 5000 μg/mL in methanol 1 mL 40059
N-Nitrosodiphenylamine 5000 μg/mL in methanol 1 mL 40060
N-Nitrosodiphenylamine 1000 mg 48553
N-Nitrosodi-n-propylamine 5000 μg/mL in methanol 1 mL 40061
N-Nitrosodi-n-propylamine 100 mg 48554
N-Nitrosomorpholine 5000 μg/mL in methanol 1 mL 40485
N-Nitrosopiperdine 5000 μg/mL in methanol 1 mL 40458
Multi-component solutions
EPA 521 Nitrosamines Mix 2000 μg/mL each component in methanol 1 mL 40035-U
The American Oil Chemists’ Society (AOCS) found certain Fatty Acid Methyl Ester (FAME) mixes to be useful as reference standards when performing quantitative analyses of animal and vegetable oils. The compositions of these reference mixes are cited in AOCS Method Ce 1-62.
Through its Supelco brand, Sigma-Aldrich is able to offer quan-titative mixes conforming to the AOCS method requirements. The composition of each mix is similar to the fatty acid distribution of certain oils (see Table 1) and is carefully prepared by weight percent. The composition is then verifi ed by gas chromatography using an independently prepared reference standard. A certifi cate of analysis is provided with each mix.
As your source for analytical products, we also offer a full line of speciality GC capillary columns, esterifi cation reagents and sample preparation products used to analyse the oils as FAMEs. To learn more about these products, please visit sigma-aldrich.com/fame
Sigma-Aldrich’s new threaded TFE funnels eliminate the mess that results from poor fi lling technique. The funnels are threaded on the inside of the base to allow them to screw onto the thread of the vial. The funnel then guides the syringe into the centre of the vial where the sample is safely deposited, reducing the possibility of the sample running down the outside of the vial wall. The TFE funnel’s inert composition ensures that no sample contamination will occur.
TFE funnels are available to fi t most standard vial sizes ranging from 2 mL (8-425 thread) to the 40 mL (24-400 thread) vial. They may be ordered individually or as part of a variety kit. For assistance with product selection, e-mail Sigma-Aldrich Technical Service at [email protected]
Description G.P.I.* Thread Size Vial OD x Length (mm) Funnel OD (in) Pk Size Cat. No.
Vial Funnel Kit for 2-40 mL Vials
Includes 1 ea of the 8 funnels listed below. Packaged in a polypropylene case 1 kit 29189-U
Individual Funnel Sizes with G.P.I. Thread Finish
TFE Funnel for 2 mL standard opening vial 8-425 12 x 32 1.0 1 ea 29191-U
TFE Funnel for 2 mL wide opening vial 9-425, 10-425 12 x 32 1.0 1 ea 29192-U
TFE Funnel for 4 mL vial 13-425 15 x 45 1.0 1 ea 29193-U
TFE Funnel for 7 mL vial 15-425 17 x 60 1.4 1 ea 29194-U
TFE Funnel for 15 mL vial 18-400 21 x 70 1.4 1 ea 29196-U
TFE Funnel for 22 mL vial 20-400 23 x 85 1.9 1 ea 29197-U
TFE Funnel for 10 mL SPME vial 22-400 24.5 x 52 1.9 1 ea 29198-U
TFE Funnel for 40 mL vial 24-400 28 x 98 1.9 1 ea 29199-U
* Glass Packaging Institute
E000972
90 % of Rheodyne vales and spares permanently available from stockFast and efficient services so you get the best from HPLC