45
3.5 Modular Programming Introduction to Programming in Java: An Interdisciplinary Approach · Robert Sedgewick and Kevin Wayne · Copyright © 2008 · 3/14/22 3/14/22
| Date post: | 15-Dec-2015 |
| Category: |
Documents |
| Upload: | miguel-helton |
| View: | 236 times |
| Download: | 4 times |

3.5 Modular Programming
Introduction to Programming in Java: An Interdisciplinary Approach · Robert Sedgewick and Kevin Wayne · Copyright © 2008 · 4/18/23 4/18/23

Bush
Kerry
2004 Presidential election
Case Study: Red States, Blue States

3
A Foundation for Programming
objects
functions and modules
graphics, sound, and image I/O
arrays
conditionals and loops
Math text I/O
assignment statementsprimitive data types
any program you might want to write

4
Data Visualization
Challenge. Visualize election results.
Basic approach. Gather data from web sources, save in local file. Build modular program that reads files, draws maps.
“ If I can't picture it, I can't understand it. ” — Albert Einstein
ElectionMap
Region
Polygon
VoteTally
dependency graph
5
Modular Programming
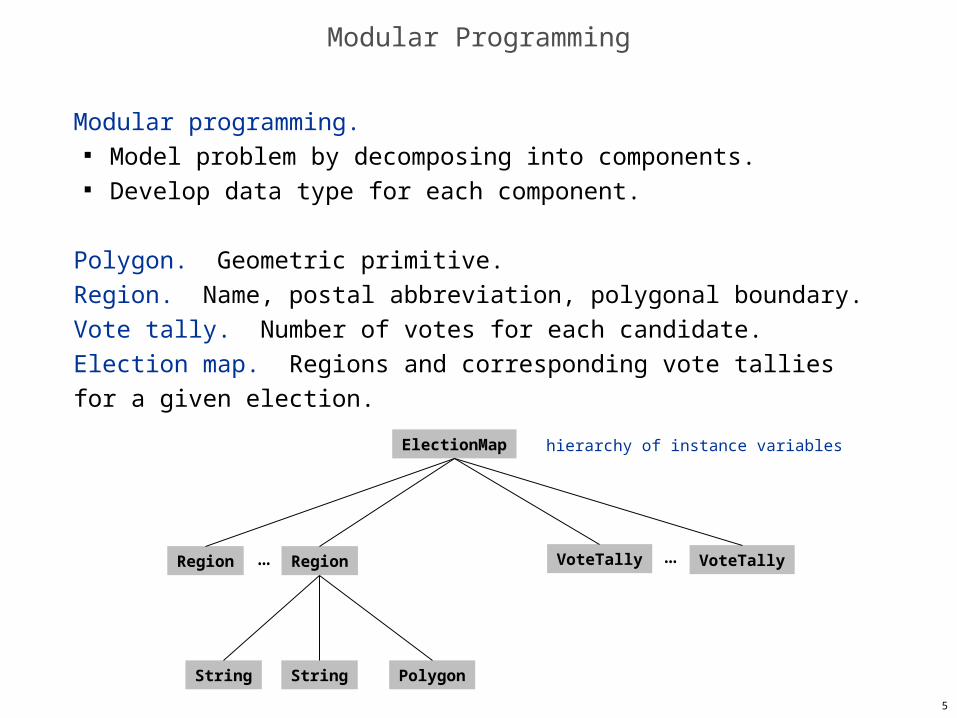
Modular programming. Model problem by decomposing into components. Develop data type for each component.
Polygon. Geometric primitive.Region. Name, postal abbreviation, polygonal boundary.Vote tally. Number of votes for each candidate.Election map. Regions and corresponding vote tallies for a given election.
ElectionMap
Region Region
PolygonStringString
VoteTally… VoteTally …
hierarchy of instance variables

Data Sources

7
Boundary Data: States within the Continental US
Geometric data. [US census bureau] www.census.gov/tiger/boundary NJ.txt has boundaries of every county in New Jersey. USA.txt that has boundary of every state.
Election results. [David Leip] http://uselectionatlas.org/RESULTS Interactive and graphical. Need to screen-scrape to get data.
Emerging standard. Publish data in text form on the web (like geometric data). Write programs to produce visuals (like we’re doing!) Mashups.
format useful for programmers
format useful for browsers and end-users(need to parse to extract raw data)

8
Boundary Data: States within the Continental US
USA data file. State names and boundary points.
% more USA.txt
-124.731216 24.544102 -66.980385 49.384365
104
AlabamaUSA498 -88.200027 34.995548 -88.202919 35.007942…New JerseyUSA368 -74.695305 41.357330 -74.461754 41.250000 -74.366302 41.202801… -74.721313 41.347294…
number of regions
bounding box
368 points(latitude, longitude) (-124.73, 24.54)
(-66.98, 49.38)

9
Boundary Data: Counties within a State
State data files. County names and boundary points.
% more NJ.txt
-75.560143 38.928589 -73.894402 41.35733
21
AtlanticNJ127 -74.877563 39.608414 -74.736694 39.729721…MercerNJ88 -74.748825 40.424248 -74.722702 40.375301 -74.674507 40.384399… -74.808403 40.415401…
88 points(latitude, longitude)
(-75.56, 38.92)
(-73.89, 41.35)
number of regions
bounding box

10
Pitfalls: Pieces and Holes
Pieces. A state can be comprised of several disjoint polygons.
Holes. A county can be entirely inside another county.
Northampton
Charlottesville

11
Screen Scraping the Election Returns
Screen scrape. Download html from web and parse.
…
http://uselectionatlas.org/RESULTS/datagraph.php?year=2004&fips=34
county name is text between <b> and </b> tagsthat occurs after width:100px

12
Election Scraper (sketch)
int year = 2004; // election yearString usps = "NJ"; // United States postal code for New Jerseyint fips = 34; // FIPS code for New Jersey
String url = "http://uselectionatlas.org/RESULTS/datagraph.php";In in = new In(url + "?year=" + year + "&fips=" fips); Out file = new Out(usps + year + ".txt"); String input = in.readAll();
while (true) {
// screen scrape county name int p = input.indexOf("width:100px", p); if (p == -1) break; int from = input.indexOf("<b>", p); int to = input.indexOf("</b>", from); String county = input.substring(from + 3, to);
// screen scrape vote totals for each candidate
// save results to file file.println(county + "," + bush + "," + kerry + "," + nader + ",");}
extract text between <b>and </b> tags, that occursafter width:100px

13
More Pitfalls
Data sources have different conventions. FIPS codes: NJ vs. 34. County names: LaSalle vs. La Salle, Kings County vs. Brooklyn.
Plenty of other minor annoyances. Unreported results. Third-party candidates. Changes in county boundaries.
Bottom line. Need to clean up data (but write a program to do it!)

Polygons and Regions

15
Polygon Data Type
Polygon. Closed, planar path with straight line segments.Simple polygon. No crossing lines.
polygon(8 points)
simple polygon(368 points)
simple polygon(10 points)

16
Polygon Data Type: Java Implementation
public class Polygon { private final int N; // number of boundary points private final double[] x, y; // the points (x[i], y[i])
// read from input stream public Polygon(In in) { N = in.readInt(); x = new double[N]; y = new double[N]; for (int i = 0; i < N; i++) { x[i] = in.readDouble(); y[i] = in.readDouble(); } } public void fill() { StdDraw.filledPolygon(x, y); }
public boolean contains(double x0, double y0) { … } public String toString() { … }
}
see COS 226
easy

17
Region Data Type
Region. Represents a state or county.
New Jersey, USA368 point polygon
Mercer, NJ88 point polygon

18
Region Data Type: Java Implementation
public class Region { private final String name; // name of region private final String usps; // postal abbreviation private final Polygon poly; // polygonal boundary
public Region(String name, String usps, Polygon poly) { this.name = name; this.usps = usps; this.poly = poly; }
public void draw() { poly.fill(); }
public boolean contains(double x0, double y0) { return poly.contains(x0, y0); }
public String toString() { … }
}

Election Returns

20
Election Returns: By State
Screen-scraping results. Number of votes for Bush, Kerry, Nader by region.
% more USA2004.txtAlabama,1176394,693933,13122,Alaska,190889,111025,10684,Arizona,1104294,893524,14767,Arkansas,572898,469953,12094,California,5509826,6745485,164546,Colorado,1101255,1001732,27343,Connecticut,693826,857488,27455,Delaware,171660,200152,3378,District of Columbia,21256,202970,3360,Florida,3964522,3583544,61744,Georgia,1914254,1366149,21472,Hawaii,194191,231708,3114,Idaho,409235,181098,8114,Kansas,736456,434993,16307,Kentucky,1069439,712733,13688,…Virginia,1716959,1454742,26666,Washington,1304894,1510201,43989,West Virginia,423778,326541,5568,Wisconsin,1478120,1489504,29383,Wyoming,167629,70776,5023,
1,914,254 Bush1,366,149 Kerry 21,472 Nader

21
Election Returns: By County
Screen-scraping results. Number of votes for Bush, Kerry, Nader by region.
% more NJ2004.txtAtlantic,49487,55746,864,Bergen,189833,207666,2745,Burlington,95936,110411,1609,Camden,81427,137765,1741,Cape May,28832,21475,455,Cumberland,24362,27875,948,Essex,83374,203681,2293,Gloucester,60033,66835,1096,Hudson,60646,127447,1353,Hunterdon,39888,26050,742,Mercer,56604,91580,1326,Middlesex,126492,166628,2685,Monmouth,163650,133773,2516,Morris,135241,98066,1847,Ocean,154204,99839,2263,Passaic,75200,94962,1149,Salem,15721,13749,311,Somerset,72508,66476,1295,Sussex,44506,23990,900,Union,82517,119372,1498,Warren,29542,18044,622,
56,604 Bush91,580 Kerry 1,326 Nader

22
Vote Tally Data Type
VoteTally. Represents the election returns for one region.
New Jersey, USAMercer, NJ
1,670,003 Bush 1,911,430 Kerry 30,258 Nader
56,604 Bush91,580 Kerry 1,326 Nader
election returns

23
Vote Tally Data Type: Java Implementation
public class VoteTally { private final int rep, dem, ind;
public VoteTally(String name, String usps, int year) { In in = new In(usps + year + ".txt"); String input = in.readAll(); int i0 = input.indexOf(name); int i1 = input.indexOf(",", i0+1); int i2 = input.indexOf(",", i1+1); int i3 = input.indexOf(",", i2+1); int i4 = input.indexOf(",", i3+1); rep = Integer.parseInt(input.substring(i1+1, i2)); dem = Integer.parseInt(input.substring(i2+1, i3)); ind = Integer.parseInt(input.substring(i3+1, i4)); }
public Color getColor() { if (rep > dem) return StdDraw.RED; if (dem > rep) return StdDraw.BLUE; return StdDraw.BLACK; }}
% more NJ2004.txt … Mercer,56604,91580,1326, …
i1 i2 i3 i4i0

Election Map

25
Election Map Data Type
ElectionMap. Represents the election map for a given election.
public static void main(String[] args) { String name = args[0]; int year = Integer.parseInt(args[1]); ElectionMap election = new ElectionMap(name, year); election.show();}
% java ElectionMap USA 1968% java ElectionMap NJ 2004
client

26
Election Map Data Type: Java Implementation
public class ElectionMap { private final int N; private final Region[] regions; private final VoteTally[] votes;
public ElectionMap(String name, int year) { In in = new In(name + ".txt");
// read in bounding box and rescale coordinates
N = in.readInt(); regions = new Region[N]; votes = new VoteTally[N]; for (int i = 0; i < N; i++) { String name = in.readLine(); String usps = in.readLine(); Polygon poly = new Polygon(in); regions[i] = new Region(name, usps, poly); votes[i] = new VoteTally(name, usps, year); } }
public void show() { for (int i = 0; i < N; i++) { StdDraw.setPenColor(votes[i].getColor()); regions[i].draw(); } }}
draw map
use Polygon, REgion, and VoteTally tobuild map

27
Modular Programming
Modular program. Collection of data types.
ElectionMap
Region intRegion
PolygonStringString
VoteTally
int intint
… VoteTally …
intdoubledouble …
hierarchy of instance variables

Data Visualization

29
Visual Display of Quantitative Information
Red states, blue states. Creates a misleading and polarizing picture.
Edward Tufte. Create charts with high data density that tell the truth.

30
Purple America
Idea. [Robert J. Vanderbei] Assign color based on number of votes.
a1 = Bush votes. a2 = Nader votes. a3 = Kerry votes.
Implementation. Change one method!
100% Kerry
100% Bush
100% Nader
€
(R, G, B) = a1
a1 + a2 + a3
, a2
a1 + a2 + a3
, a3
a1 + a2 + a3
⎛
⎝ ⎜
⎞
⎠ ⎟
55% Kerry, 45% Bush
public Color getColor() { int tot = dem + rep + ind; return new Color((float) rep/tot, (float) ind/tot, (float) dem/tot);}
VoteTally.java
http://www.princeton.edu/~rvdb/JAVA/election2004

31
Purple New Jersey
% java ElectionMap NJ 2004

32
Purple America
% java ElectionMap USA 2004

33
Purple America
% java ElectionMap USA-county 2004

34
Data Visualization: Design Issues
Remark. Humans perceive red more strongly than blue.
Remark. Amount of color should be proportional to number of votes,not geographic boundary.
Remark. Project latitude + longitude coordinates to 2d plane.
Mercator projection Albers projection

35
3D Visualization
3D visualization. Volume proportional to votes; azimuthal projection.
Robert J. Vanderbeiwww.princeton.edu/~rvdb/JAVA/election2004

36
Cartograms
Cartogram. Area of state proportional to number of electoral votes.
Michael Gastner, Cosma Shalizi, and Mark Newmanwww-personal.umich.edu/~mejn/election
37
Cartograms
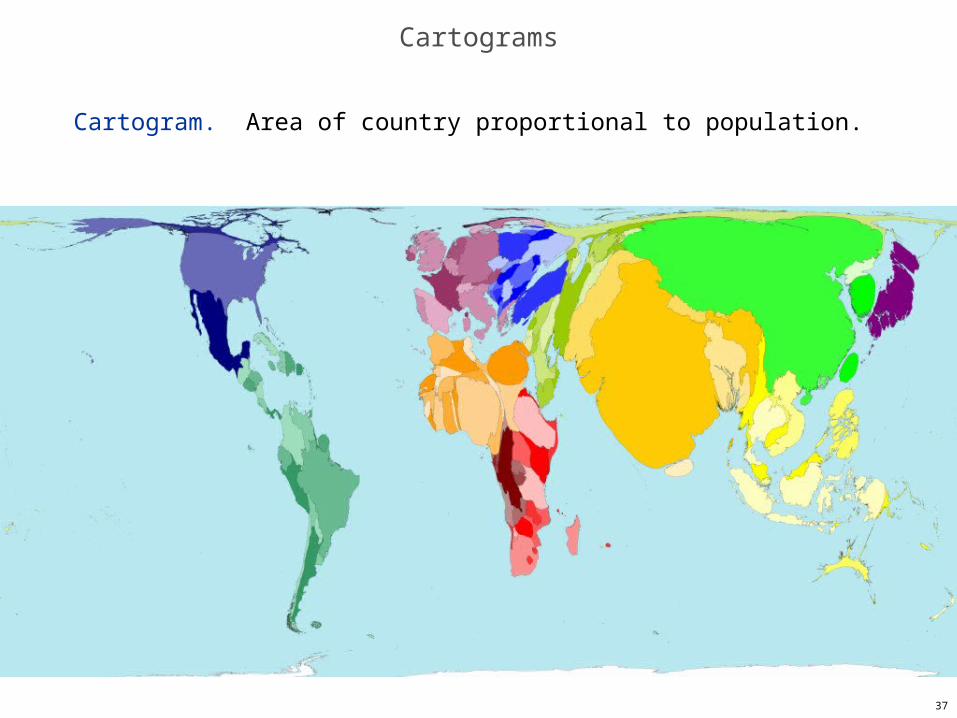
Cartogram. Area of country proportional to population.

38
Eugene Pyatigorsky (based on New York Times visualization)www.ocf.berkeley.edu/~gene/media/docs/Election.pdf

39
Summary
Modular programming. Break a large program into smaller independent components. Develop a data type for each component. Ex: Polygon, Region, VoteTally, ElectionMap, In, Out.
Ex 1. Build large software project. Software architect specifies API. Each programmer implements one module. Debug and test each piece independently. [unit testing]
Ex 2. Build reusable libraries. Language designer extends language with new data types. Programmers share extensive libraries. Ex: In, Out, Draw, Polygon, …
Data visualization. You can do it! (worthwhile to learn from Tufte)

Extra Slides

Interactive Maps

42
Interactive Map
Goal. Click a county to retrieve its information.
public void showRegion(double x, double y) { for (int i = 0; i < numberOfRegions; i++) if (regions[i].contains(x, y)) StdOut.println(regions[i] + "\n" + votes[i] + "\n");}
while (true) { double x = StdDraw.mouseX(); double y = StdDraw.mouseY(); if (StdDraw.mousePressed()) election.showRegion(x, y); StdDraw.show(100);}

43
Polygon Diversion
Q. How to determine whether a point is inside a simple polygon?
no two segments cross

44
Polygon Diversion
Q. How to determine whether a point is inside a simple polygon?
A. Go in straight line. Count number of times you jump over fence.
no two segments cross

45
OOP Advantages
OOP enables: Data abstraction: manage complexity of large programs. Modular programming: divide large program into smaller
independent pieces.Encapsulation: hide information to make programs robust.
Inheritance: reuse code.
Religious wars ongoing.


