28
BCG Matrix Riyas K. Basheer
| Date post: | 03-Apr-2018 |
| Category: |
Documents |
| Upload: | younjin-choi |
| View: | 213 times |
| Download: | 0 times |

7/28/2019 35344125-BCG-Matrix
http://slidepdf.com/reader/full/35344125-bcg-matrix 1/28
BCG Matrix
Riyas K. Basheer

7/28/2019 35344125-BCG-Matrix
http://slidepdf.com/reader/full/35344125-bcg-matrix 2/28
Introduction
• most well-known portfolio managementtool
• based on product life cycle theory
• developed in the early 1970s by BruceHenderson at the Boston ConsultingGroup
• can be used to determine what prioritiesshould be given in the product portfolio of a business unit

7/28/2019 35344125-BCG-Matrix
http://slidepdf.com/reader/full/35344125-bcg-matrix 3/28
Introduction
• a company should have a portfolio of
products that contains
– high-growth products in need of cash inputs and
– low-growth products that generate a lot of cash
• The Boston Consulting Group Matrix has two
dimensions
– market share and – market growth
7/28/2019 35344125-BCG-Matrix
http://slidepdf.com/reader/full/35344125-bcg-matrix 4/28
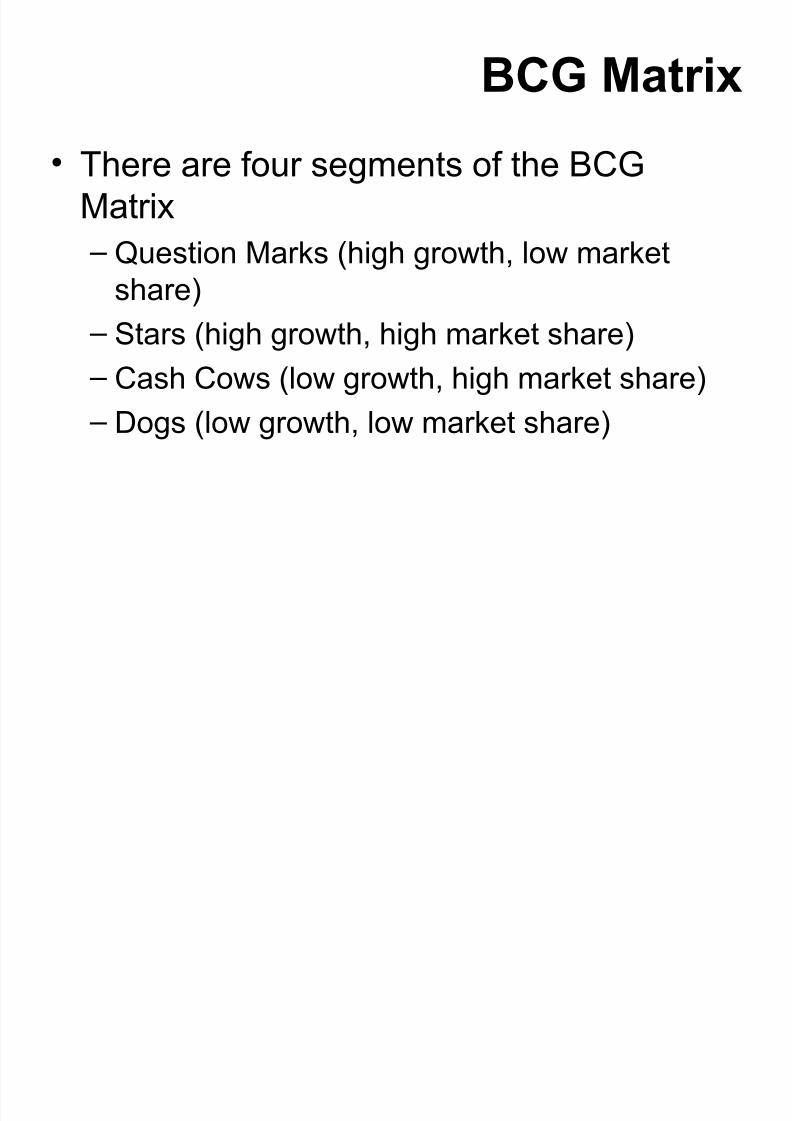
BCG Matrix
• There are four segments of the BCG
Matrix
– Question Marks (high growth, low market
share)
– Stars (high growth, high market share)
– Cash Cows (low growth, high market share)
– Dogs (low growth, low market share)

7/28/2019 35344125-BCG-Matrix
http://slidepdf.com/reader/full/35344125-bcg-matrix 5/28
BCG Matrix

7/28/2019 35344125-BCG-Matrix
http://slidepdf.com/reader/full/35344125-bcg-matrix 6/28
Question Marks
• Question Marks have the worst cashcharacteristics of all the four, because theyhave high cash demands and generate lowreturns, because of their low market share.
• If the market share remains unchanged,Question Marks will simply absorb greatamounts of cash.
• These products are in growing markets buthave low market share.
• Question marks are essentially new productswhere buyers have yet to discover them.

7/28/2019 35344125-BCG-Matrix
http://slidepdf.com/reader/full/35344125-bcg-matrix 7/28
Question Marks
• The marketing strategy is to get markets toadopt these products so as to convert themto Stars for the company.
• Question Marks have high demands and lowreturns due to low market share.
• These products need to increase their marketshare quickly or they become dogs.
• The best way to handle Question Marks is toeither invest heavily in them to gain marketshare or to sell them.

7/28/2019 35344125-BCG-Matrix
http://slidepdf.com/reader/full/35344125-bcg-matrix 8/28
Question Marks

7/28/2019 35344125-BCG-Matrix
http://slidepdf.com/reader/full/35344125-bcg-matrix 9/28
Stars
• Stars are defined by having high market share in agrowing market.
• Stars are using large amounts of cash. Stars areleaders in the business. Therefore they shouldalso generate large amounts of cash.
• Stars are frequently roughly in balance on netcash flow.
• Stars are the leaders in the business but still needa lot of support for promotion and placement.
• If market share is kept, Stars are likely to grow intocash cows.

7/28/2019 35344125-BCG-Matrix
http://slidepdf.com/reader/full/35344125-bcg-matrix 10/28
Stars

7/28/2019 35344125-BCG-Matrix
http://slidepdf.com/reader/full/35344125-bcg-matrix 11/28
Cash Cows
• Cash cows are in a position of high market share in amature market.
• If competitive advantage has been achieved, cashcows have high profit margins and generate a lot of
cash flow.• Because of the low growth, promotion and placementinvestments are low.
• Investments into supporting infrastructure can improveefficiency and increase cash flow more.
• Cash cows are the products that businesses strive for.• Cash Cows are often the stars of yesterday and they
are the foundation of a company.

7/28/2019 35344125-BCG-Matrix
http://slidepdf.com/reader/full/35344125-bcg-matrix 12/28
Dogs
• Dogs are in low growth markets and have
low market share.
• Dogs should be avoided and minimized.
• Expensive turn-around plans usually do
not help.
• Dogs must deliver cash, otherwise theymust be liquidated.

7/28/2019 35344125-BCG-Matrix
http://slidepdf.com/reader/full/35344125-bcg-matrix 13/28
Dogs

7/28/2019 35344125-BCG-Matrix
http://slidepdf.com/reader/full/35344125-bcg-matrix 14/28
BCG Matrix
• The BCG Matrix method can help to
understand a frequently made strategy
mistake
• having a one size that fits all strategy
approach, such as a generic growth target
(‘x’ percent per year) or a generic return
on capital of ‘y’ percent for an entirecorporation

7/28/2019 35344125-BCG-Matrix
http://slidepdf.com/reader/full/35344125-bcg-matrix 15/28
BCG Matrix
• In such a scenario:
– Cash Cows Business Units will reach their
profit target easily.
• Their management has an easy job
• The executives are often praised anyhow
• Even worse, they are often allowed to reinvest
substantial cash amounts in their mature
businesses.

7/28/2019 35344125-BCG-Matrix
http://slidepdf.com/reader/full/35344125-bcg-matrix 16/28
BCG Matrix
• Dogs Business Units are fighting an impossible battleand, even worse, now and then investments are made – These are hopeless attempts to "turn the business
around".
• As a result all Question Marks and Stars receive onlymediocre investment funds – In this way they can never become Cash Cows – These inadequate invested sums of money are a waste of
money. – Either these SBUs (Small Business Units) should receive
enough investment funds to enable them to achieve a realmarket dominance and become Cash Cows (or Stars)
– Otherwise companies are advised to disinvest.

7/28/2019 35344125-BCG-Matrix
http://slidepdf.com/reader/full/35344125-bcg-matrix 17/28
BCG Matrix and PLC

7/28/2019 35344125-BCG-Matrix
http://slidepdf.com/reader/full/35344125-bcg-matrix 18/28
Other uses - BCG Matrix
• BCG matrix helps a company to use the
experience curve to its advantage
• BCG matrix enables the company to
manufacture and sell new products at a
price that is low enough to get early
market share leadership
• Once it becomes a star, it is destined to be
profitable.
7/28/2019 35344125-BCG-Matrix
http://slidepdf.com/reader/full/35344125-bcg-matrix 19/28
Other uses - BCG Matrix
• BCG model is helpful for managers toevaluate balance in the firm’s current portfolioof Stars, Cash Cows, Question Marks and
Dogs.• BCG method is applicable to largecompanies that seek volume and experienceeffects.
• The model is simple and easy to understand.• It provides a base for management to decide
and prepare for future actions.
7/28/2019 35344125-BCG-Matrix
http://slidepdf.com/reader/full/35344125-bcg-matrix 20/28
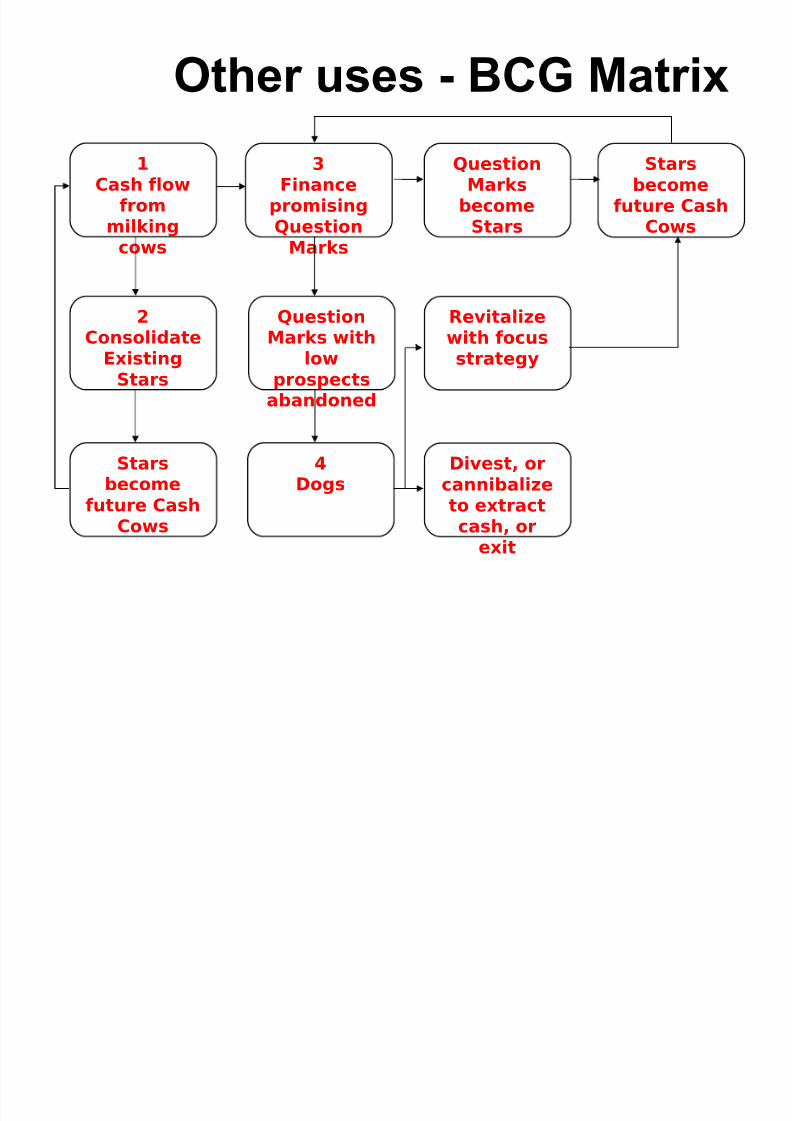
Other uses - BCG Matrix
1Cash flow
frommilkingcows
2Consolidate
ExistingStars
Starsbecome
future CashCows
3Finance
promisingQuestion
Marks
QuestionMarks with
lowprospects
abandoned
4Dogs
QuestionMarks
becomeStars
Revitalizewith focusstrategy
Divest, orcannibalizeto extractcash, or
exit
Starsbecome
future CashCows

7/28/2019 35344125-BCG-Matrix
http://slidepdf.com/reader/full/35344125-bcg-matrix 21/28
BCG Analysis
• BCG Analysis is a technique used in brandmarketing, product management, and strategicmanagement to help a company decide whatproducts to add to its product portfolio.
• It involves rating products according to their relative market share and market growth rate.• The products are then plotted on a two
dimensional map.•
Products with high market share but low growthare referred to as "cash cows"• Products with high market share and high growth
are referred to as "stars"

7/28/2019 35344125-BCG-Matrix
http://slidepdf.com/reader/full/35344125-bcg-matrix 22/28
BCG Analysis
• Products with low market share in a low growthmarket are referred to as "dogs" Products with lowmarket share but high market growth are referredto as "question marks" or "problem children".
• A "question mark" has the potential to become a"star" in the future if it is developed.
• A company should have a balanced portfolio
•This implies having at least one "cash cow" whichcan generate revenue that can be used to developone or more “question mark" - referred to as"milking your cash cow”

7/28/2019 35344125-BCG-Matrix
http://slidepdf.com/reader/full/35344125-bcg-matrix 23/28
Limitations
• It neglects the effects of synergy betweenbusiness units.
• Market growth is not the only indicator for attractiveness of a market.
• Sometimes Dogs can earn more cash thanCash Cows.
• The problems of getting data on the marketshare and market growth.
• There is no clear definition of whatconstitutes a "market“.

7/28/2019 35344125-BCG-Matrix
http://slidepdf.com/reader/full/35344125-bcg-matrix 24/28
Limitations
• A high market share does not necessarilylead to profitability all the time.
• The model uses only two dimensions –
market share and growth rate. This maytempt management to emphasize a particular product, or to divest prematurely.
• A business with a low market share can be
profitable too.• The model neglects small competitors that
have fast growing market shares.

7/28/2019 35344125-BCG-Matrix
http://slidepdf.com/reader/full/35344125-bcg-matrix 25/28
Conclusion
• BCG Matrix is useful for a company toachieve balance between the four categoriesof products a company produces
• As a particular industry matures and itsgrowth slows, all business units becomeeither cash cows or dogs.
• The overall goal of this ranking is to help
corporate analysts decide which of their business units to fund, and how much; andwhich units to sell

7/28/2019 35344125-BCG-Matrix
http://slidepdf.com/reader/full/35344125-bcg-matrix 26/28
BCG Matrix – Coca Cola
7/28/2019 35344125-BCG-Matrix
http://slidepdf.com/reader/full/35344125-bcg-matrix 27/28
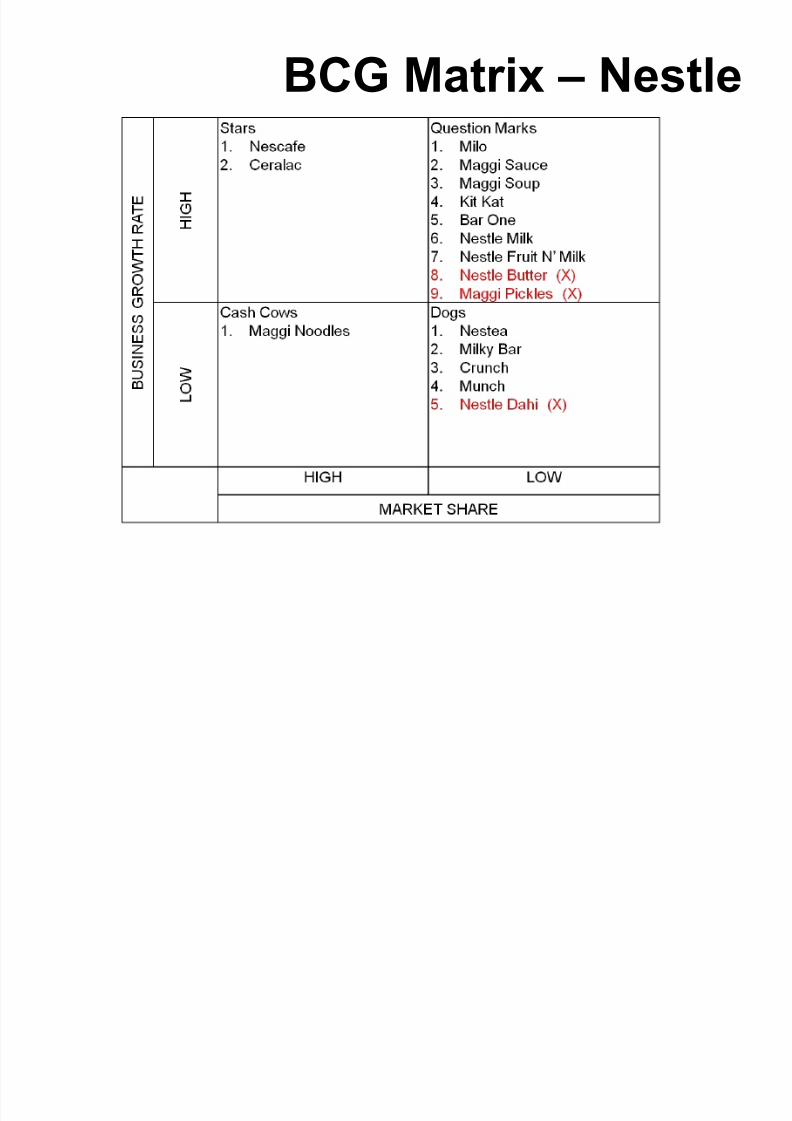
BCG Matrix – Nestle

7/28/2019 35344125-BCG-Matrix
http://slidepdf.com/reader/full/35344125-bcg-matrix 28/28
Thank you..


