295 295 Weather – November 2014, Vol. 69, No. 11 The hydrological setting of the 2013 floods in Mexico Adrián Pedrozo-Acuña, J. Agustín Breña-Naranjo and Ramón Domínguez-Mora Universidad Nacional Autónoma de México, Instituto de Ingeniería, Cd. Universitaria, Coyoacán, México Introduction There is increasing evidence that more fre- quent flooding, resulting from increases in the frequency and intensity of storms, is likely to be one consequence of anthro- pogenic climate change in many parts of the world (Feng et al., 2013; Kumar, 2013). In recent years, large-scale floods have been recorded in Australia, Brazil, Thailand and the United Kingdom; not to mention those associated with hurricanes Katrina and Sandy, which generated combined economic losses of hundreds of billions of dollars in the USA (Michel-Kerjan, 2012). In Mexico, flooding is currently the major and most costly natural hazard; its geo- graphical location makes the country highly vulnerable to the strike of landfalling tropical cyclones along both the Pacific and Atlantic coasts. Indeed, this was recently observed during September 2013, when the simulta- neous occurrence of two tropical cyclones affecting both basins of the country was recorded (see Figure 1). Figure 1 shows the tracks of both storms as they travelled over the entire Mexican territory; the star repre- sents the spatial location of both phenom- ena at the time at which the picture was taken. Tropical storm Manuel in the Pacific and Hurricane Ingrid (category 1) in the Gulf of Mexico made multiple landfalls between 13 and 20 September. Both systems affected 77% of Mexican territory, with heavy rain- fall producing landslides and severe flood- ing along many of the country’s rivers; as a result, more than 45 000 homes were damaged or destroyed and 192 lives were lost (Aon Benfield, 2013). To give a specific example of one of the recorded impacts: in the tourist resort of Acapulco-Diamante the overflowing of La Sabana river left sev- eral residential and commercial properties flooded, including the international airport. Figure 1. Satellite image (NASA Worldview, 2013) taken on 15 September 2013 during the simultaneous occurrence of two tropical cyclones in Mexico, along with the recorded tracks for Manuel (blue dots) and Ingrid (red dots); stars represents the spatial location of both phenomena at the time the picture was taken.
Transcript
295295
Weather – Novem
ber 2014, Vol. 69, No. 11
The hydrological setting of the 2013 floods in Mexico
Adrián Pedrozo-Acuña, J. Agustín Breña-Naranjo and Ramón Domínguez-MoraUniversidad Nacional Autónoma de México, Instituto de Ingeniería, Cd. Universitaria, Coyoacán, México
IntroductionThere is increasing evidence that more fre-quent flooding, resulting from increases in the frequency and intensity of storms, is likely to be one consequence of anthro-pogenic climate change in many parts of the world (Feng et al., 2013; Kumar, 2013).
In recent years, large-scale floods have been recorded in Australia, Brazil, Thailand and the United Kingdom; not to mention those associated with hurricanes Katrina and Sandy, which generated combined economic losses of hundreds of billions of dollars in the USA (Michel-Kerjan, 2012).
In Mexico, flooding is currently the major and most costly natural hazard; its geo-graphical location makes the country highly vulnerable to the strike of landfalling tropical cyclones along both the Pacific and Atlantic coasts. Indeed, this was recently observed during September 2013, when the simulta-neous occurrence of two tropical cyclones affecting both basins of the country was recorded (see Figure 1). Figure 1 shows the tracks of both storms as they travelled over
the entire Mexican territory; the star repre-sents the spatial location of both phenom-ena at the time at which the picture was taken. Tropical storm Manuel in the Pacific and Hurricane Ingrid (category 1) in the Gulf of Mexico made multiple landfalls between 13 and 20 September. Both systems affected 77% of Mexican territory, with heavy rain-fall producing landslides and severe flood-ing along many of the country’s rivers; as a result, more than 45 000 homes were damaged or destroyed and 192 lives were lost (Aon Benfield, 2013). To give a specific example of one of the recorded impacts: in the tourist resort of Acapulco-Diamante the overflowing of La Sabana river left sev-eral residential and commercial properties flooded, including the international airport.
Figure 1. Satellite image (NASA Worldview, 2013) taken on 15 September 2013 during the simultaneous occurrence of two tropical cyclones in Mexico, along with the recorded tracks for Manuel (blue dots) and Ingrid (red dots); stars represents the spatial location of both phenomena at the time the picture was taken.
296
Wea
ther
– N
ovem
ber 2
014,
Vol
. 69,
No.
11
The 2
013 f
lood
s in
Mex
ico
Southern Pacific coast of Mexico, where the tourist resort of Acapulco-Diamante is located. By contrast, in the Gulf of Mexico, towards the northeast of the country, less intense precipitation was observed. Particularly in this case, high cumulative precipitation values on the Gulf of Mexico watersheds are associated with the landfall position of tropical storm Ingrid.
To further investigate the nature of the highest registered rainfall during the inci-dence of this hydrometeorological event, we examined the weather stations located in the Southern Pacific region. For this purpose, we selected the stations that have at least 30 years of data. These stations are listed in Table 1, along with the number of available years of data, the mean annual precipitation at the station and the corre-sponding cumulative precipitation recorded for the period of 1–19 September 2013. Each station also reported the ratio of the cumulative precipitation for the event to its annual mean. It was observed that, by aver-aging across all stations in the region, the cumulative precipitation value recorded for this event was around 52% of the annual mean value, thus quantifying the extreme level of precipitation recorded in the region as a whole. Indeed, for those stations close to the tourist resort of Acapulco-Diamante,
from weather and gauging stations of the Mexican Government we estimate the rainfall return period associated with this hydrometeorological event. Moreover, we search for plausible expectations of future probabilities of extreme floods by estimat-ing the corresponding return periods of riverflows at those locations at which large rainfall return periods were identified. Finally, satellite-derived precipitation products from the Tropical Rainfall Measurement Mission (TRMM) (Huffman et al., 2007), are used to determine, on a month by month basis, how exceptional the 2013 rainfall was in relation to previous years (1998–2012).
Precipitation in 2013The simultaneous occurrence of tropical storms Ingrid and Manuel provides a cru-cial setting for the hydrological conditions observed during September 2013 across Mexico. Figure 2 shows a map of cumula-tive rainfall recorded from 1–19 September 2013. The map was constructed using col-lated data from 1000 rain gauge stations owned by the National Weather Service and the Federal Commission of Electricity (shown as red dots). It reveals that the most intense precipitation (due to tropical storm Manuel) was concentrated along the
The incidence of both tropical storms left anticipated insured losses, as estimated by the Mexican Association of Insurance Institutions, in excess of US $900 million, while economic losses were valued at US $5.7 billion. As a consequence of current economic growth (i.e. increased building on flood plains) and an increase in the fre-quency and severity of storms, these costs are set to rise further. It follows that an improved ability to forecast, quantify and manage flood risks is essential to protect the public, property and infrastructure, and to maintain a sustainable economy. This can be achieved through the careful identifica-tion of the causes of an extreme flood, in combination with a better understanding of the frequency, intensity and structural behaviour of such hydrometeorological events across several aspects of the earth system sciences. Although the probability of the simultaneous occurrence of two storms on both coasts is low, it is necessary to carry out a careful assessment of the observed rainfall and river discharges during their incidence (Figures S1–S3).
In this article we review the hydrological setting of the 2013 Mexican floods through examination of the rainfall totals and anomalies across the whole country. Using precipitation and riverflow data acquired
Figure 2. Precipitation map for the cumulative rainfall recorded from 1–19 September 2013. Pink dots indicate the locations of weather stations.
297
Weather – Novem
ber 2014, Vol. 69, No. 11 The 2013 floods in M
exico
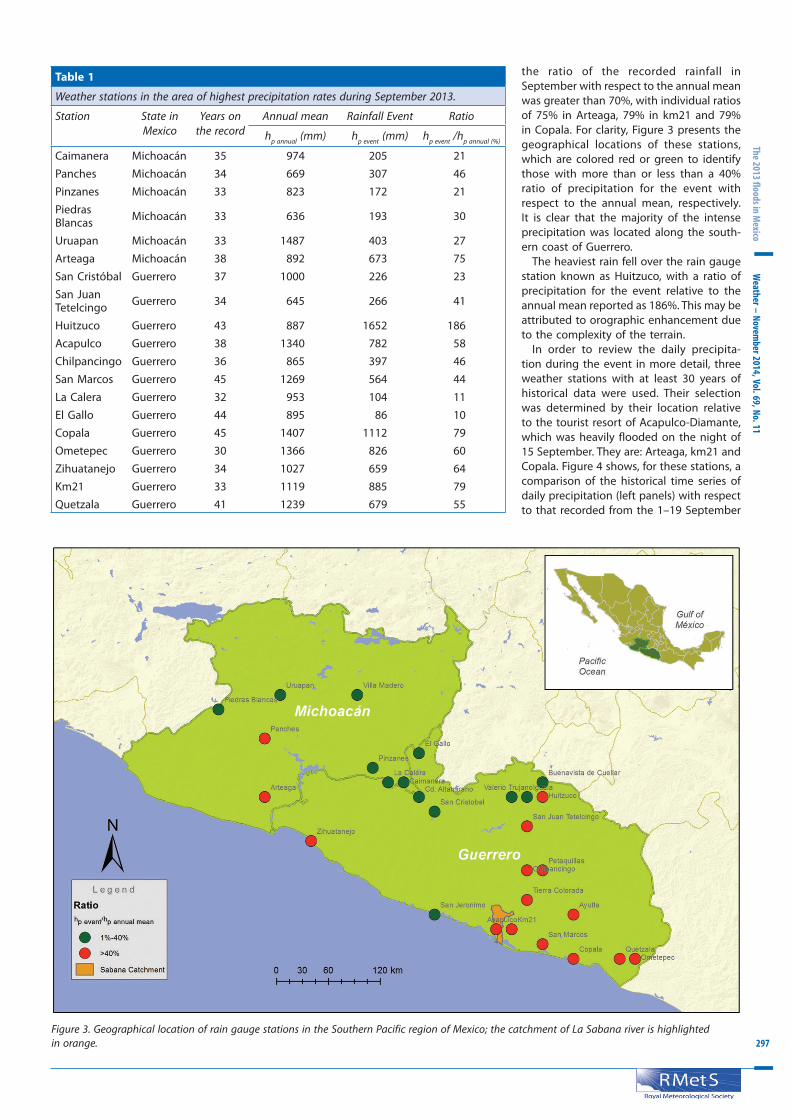
the ratio of the recorded rainfall in September with respect to the annual mean was greater than 70%, with individual ratios of 75% in Arteaga, 79% in km21 and 79% in Copala. For clarity, Figure 3 presents the geographical locations of these stations, which are colored red or green to identify those with more than or less than a 40% ratio of precipitation for the event with respect to the annual mean, respectively. It is clear that the majority of the intense precipitation was located along the south-ern coast of Guerrero.
The heaviest rain fell over the rain gauge station known as Huitzuco, with a ratio of precipitation for the event relative to the annual mean reported as 186%. This may be attributed to orographic enhancement due to the complexity of the terrain.
In order to review the daily precipita-tion during the event in more detail, three weather stations with at least 30 years of historical data were used. Their selection was determined by their location relative to the tourist resort of Acapulco-Diamante, which was heavily flooded on the night of 15 September. They are: Arteaga, km21 and Copala. Figure 4 shows, for these stations, a comparison of the historical time series of daily precipitation (left panels) with respect to that recorded from the 1–19 September
Table 1
Weather stations in the area of highest precipitation rates during September 2013.
Station State in Mexico
Years on the record
Annual mean Rainfall Event Ratio
hp annual (mm) hp event (mm) hp event /hp annual (%)
Figure 3. Geographical location of rain gauge stations in the Southern Pacific region of Mexico; the catchment of La Sabana river is highlighted in orange.
298
Wea
ther
– N
ovem
ber 2
014,
Vol
. 69,
No.
11
The 2
013 f
lood
s in
Mex
ico
Figure 4. Historical time series of daily precipitation hp (left panels) vs. that recorded from 1–19 September 2013 (right panels).
2013 (right panels). The top row of Figure 4 illustrates the comparison for Arteaga sta-tion, located to the west of Acapulco. The plot shows that although the station recorded high values for daily precipitation during September, they are not above the recorded historical maxima at this location. By contrast, the middle row shows results for the km21 station located closest to Acapulco. In this case, the registered daily precipitation is indeed the most exceptional on record, with more than 400mm recorded on 15 September. Finally, the bottom row displays the results for Copala station, located to the east of Acapulco, for which the recorded daily rainfall for the period of analysis is close to the maximum histori-cal values on record. At all stations, abun-dant precipitation was recorded between 14 and 16 September 2013, with individual values as follows: in the region of Arteaga ~400mm, in the central coast of Guerrero (in Acapulco) ~750mm, and in the eastern part of Guerrero ~650mm, with highest totals recorded on 15 September.
These results indicate that the heavy rain-fall was concentrated in a region close to Acapulco in the Mexican State of Guerrero. With rainfall of this magnitude, and daily
precipitation exceeding 200mm within a period of 2 days, widespread flooding was inevitable. Indeed, most of the rivers reported an overflow during the late night of 15 September 2013, after 1 day of inten-sive rainfall over the region.
Return period of the precipitationThe hydrometeorological events recorded in September 2013 produced record-break-ing rainfalls across a number of stations on the southern Pacific coast of Mexico, both on a daily timescale and for the month of September. Intense rainfall occurred over eastern parts of the state of Guerrero, whereas in the eastern part of the country the rainfall was somewhat less intense.
In order to review the return periods of the daily precipitation for this region, an extreme value analysis based on annual maxima was carried out for those stations with suf-ficient historical data and in the proximity of the Acapulco region. These stations were: Arteaga (located to the west of Acapulco), km21 (located at Acapulco), Copala (to the east of Acapulco) and Huitzuco (to the north). Figure 5 shows the estimated return periods
for these rain gauge stations. The blue dots represent the historical annual maxima reg-istered at each station, while the red stars show the daily maximum associated with the September 2013 event.
Figure 5(b) and Figure 5(d) show results for stations Huitzuco and km21, located close to Acapulco. Notably, in both cases, the maximum daily precipitation recorded dur-ing September 2013 represents an extraor-dinary rainfall, relative to historical maxima. Different rainfall patterns are depicted in Figure 5(a) and Figure 5(c), corresponding to the results at Arteaga and Copala sta-tions, which are located to the west and to the east of Acapulco, respectively. In both cases, the precipitation associated with the September 2013 event suggests a return period of between 25 and 40 years. Figure 5, therefore, clearly demonstrates a high spa-tial variability of the return period associ-ated with this hydrometeorological event.
Precipitation anomaly in 2013As a complement to the precipitation analy-sis, we used remotely sensed information
Figure 5. Return periods of daily rainfall estimated with annual maxima at different rain gauge stations within the Southern Pacific region of Mexico (star represents 2013 event). (a) Arteaga; (b) km21; (c) Copala; (d) Huitzuco.
299
Weather – Novem
ber 2014, Vol. 69, No. 11 The 2013 floods in M
exico
In addition, the monthly variation of the precipitation anomaly within the TRMM measurement period (relative to the period 1998–2012) was also estimated for the whole country and for the Pacific and Gulf of Mexico regions. Results for the whole country are reported in Figure 7(a), while Figure 7(b) and Figure 7(c) illustrate results for the Gulf of Mexico and Pacific regions, respectively. It is clear that the precipitation anomaly associated with September 2013 is indeed the second largest anomaly on record for the three cases.
To further examine the temporal variability of the TRMM derived rainfall, Figure 8 shows the monthly average rainfall on a year-by-year basis (blue lines) from 1998 to 2013, spatially averaged for the whole country. The monthly ensemble average precipitation is also shown in dark red, spanning the stand-ard deviation in light red (±σ). The results indicate that one of the largest monthly average precipitation measurements in the last 15 years of observations in Mexico was indeed recorded in September 2013.
Streamflow return periodDue to the exceptional nature of this event, and given the impacts observed in several cities of southern Mexico, especially
tive precipitation for the period 1999–2013. The results are shown in Figure 6, where a positive precipitation anomaly (relative to the period 1998–2012) is identified in those areas of the country in which the tropical storms made their landfall. In particular, a marked rise in precipitation is evident on the Pacific coast.
as recorded by TRMM to estimate the reg-istered precipitation anomaly in Mexico for the year 2013, with respect to the total measurement period of TRMM (1998–2012). At each TRMM cell within the country (25 × 25km), this anomaly was determined by subtracting the recorded cumulative pre-cipitation for 2013 from the average cumula-
Figure 6. 2013 annual precipitation anomaly (mm) in Mexico (relative to period 1998–2012).
Figure 7. Monthly variation of the precipitation anomaly in (a) Mexico (b) Atlantic region and (c) Pacific region, within the TRMM measurement period (cf. 1998–2012).
300
Wea
ther
– N
ovem
ber 2
014,
Vol
. 69,
No.
11
The 2
013 f
lood
s in
Mex
ico
occurrence of the peak flows. It is clear that the estimated value for the peak flow during the 2013 event is of the order of magnitude of other maximum values observed at this gauging station. Horizontal lines represent the different return periods estimated from the analysis, showing that the 2013 event cor-responds to a return period ranging between 1 in 20 years and 1 in 50 years for this river.
The Acapulco flood The results presented above show that the precipitation observed at the Pacific coast of Mexico in September 2013 was generally associated with spatially-varied return peri-ods of 25–70 years. Although these return periods do not represent a low probabil-
as km21, where historical information on the magnitude of the river discharge is available. The Sabana River has a catchment of 1074.4km2 with a concentration time of 6h, and the best estimate of discharge was of the order of 1000–1300m3s−1.
A first-order estimation of the return period for this event was established with the support of an extreme value analysis using historical data from a gauging sta-tion located at the Sabana river watershed; the measurements were available at daily intervals for a period of 45 years from 1958 to 2003 (Figures S4–S6).
Figure 9 shows the time series of daily streamflow measurements from January 1958 to January 2003. The seasonal varia-tion in total discharge is evident from the
in Acapulco-Diamante, a post-flood sur-vey was carried out by members of the Hydraulic Department of the Institute of Engineering at the National University of Mexico. This activity involved the iden-tification of watermarks in the region in order to reconstruct the peak flow value for the event. The flood peak discharge was estimated from a stage-discharge rela-tion, which is anchored at high discharges by indirect discharge measurements. This stage-discharge curve was applied to a point of the river upstream of the zone of the overflow. This estimate was carried out following recommendations put forward by Lumbroso and Gaume (2012). The loca-tion at which the procedure was applied corresponds to the gauging station known
Figure 8. Deconstruction of a monthly TRMM rainfall (hp ) series on a year by year basis.
Figure 9. Time series of daily streamflow (Qinst) at km21 station from January 1958 to January 2003. Hor izontal lines represent the different return periods (Tr).
301
Weather – Novem
ber 2014, Vol. 69, No. 11 The 2013 floods in M
exico
the impacts were destructive due to the combination of an intense rainfall and the vulnerability of man-made structures built within flood-prone areas, thus showing that economic change has had a profound influence on the impacts of flooding in the region, considerably increasing the risk.
In Mexico, this highlights the urgent need for holistic approaches to flood risk manage-ment, instead of the current focus on emer-gency response and recovery. In particular, this event points towards the necessity for vulnerability monitoring. It is apparent that, through the detection of changes in exposure within floodplains and wetlands, a disaster could be identified before it hap-pens. This could be achieved through the implementation of an adaptive approach to flood risk reduction, as has been observed in the Netherlands (Van Alphen, 2013) and the United Kingdom (Hall and Solomatine, 2008), where coordination of planning and decision making is key in the design of a successful flood risk management strategy.
SummaryRecent events in Mexico and around the world indicate that better communication between researchers, decision makers and society is pivotal for the generation of a successful disaster risk reduction strategy.
ity for the event, it is very likely that the 2013 floods will rank as one of the coun-try’s most damaging hydrometeorological events to date. This may be ascribed to the spatial coverage of intense precipitation over a large area of the Mexican territory, in contrast to a generalised low probability of the precipitation itself.
In particular, the well-known coastal resort of Acapulco-Diamante was heavily damaged by flooding; the intense precipi-tation recorded (~650mm/48h) gave rise to extreme flood discharges in La Sabana river. The impact of this flooding on property and infrastructure was severe, widespread and, in some cases, long-lasting. Figure 10 shows a true color (RGB) version of the satellite image of this region taken on 18 September 2013, and shows that by that date, after the passage of the peak discharge, flood-ing was severely affecting urban develop-ments and hotels. In this image, floodwaters are illustrated by the brown/pink colours that visually represent the large amount of sediment that was transported during the event. Figure S7 shows an infrared version of the same scene, where dark blue regions illustrate floodwaters, red areas represent vegetation, and white areas indicate the presence of urban developments.
The severity of flooding is a consequence of a combination of conditions; in this case,
Figure 10. Satellite image of the flooded area, recorded at Acapulco-Diamante on 18 September 2013.
Moreover, the size of registered damages and losses reveals the urgency of doing so, even under a context of limited predictability.
In the case of the hydrometeorological event recorded in September 2013 in Mexico, a consensus of different estimates suggests a return period ranging from 20–50 years. Recorded rainfall totals for September 2013 exceeded records by, on average, 52% of the annual mean at several rain gauge stations, with extraordinary cases reaching up to 70% of the annual mean in 2 days. However, it should be noted that the estimates may be biased low owing to the limited 30–50 year extent of the historical data used.
In view of the magnitude and ubiquity of the hydro-climatic change now under way, understanding the complexities of the interrelationships of natural and social domains is vital. There is ongoing work to model the flooding that occurs as a result of these hydrometeorological events, with some success in recent times due to greater model capability and access to high qual-ity precipitation and topographic data (e.g. LiDAR). Although results from models have a certain level of uncertainty, a probabilistic methodology is being developed in order to produce an improved flood modelling approach (Pedrozo-Acuña et al., 2013).
Although it is meteorological trends that are important in the evaluation of global cli-mate change, attention should also be paid to vulnerability monitoring and its interac-tion with extreme precipitation events that result in disastrous floods. This analysis is therefore important to those responsible for flood control in their efforts to adopt effec-tive preventive measures and to mitigate the impact of the floods that do occur.
AcknowledgementsThis paper was written with the support of the Institute of Engineering, UNAM, through an internal project. The authors would like to thank the colleagues that participated in the field campaign carried out in October 2013 at Acapulco-Diamante: Antonio Capella Vizcaino, Judith Ramos Hernández, José Luis Herrera and Iskra Mejía Estrada. Miguel A. Laverde-Barajas and Juan P. Rodríguez-Rincon are gratefully acknowl-edged for their help with figure editing.
References A on Benfield. 2013. Global Catastrophe Recap Report. Impact Forecasting LLC, Aon Benfield: Chicago, IL.F eng X, Porporato A, Rodríguez-Iturbe I. 2013. Changes in rainfall seasonality in the tropics. Nat. Clim. Change 3(9): 811–815. doi:10.1038/nclimate1907Hall JW, Solomati ne D. 2008. A frame-work for uncertainty analysis in flood risk management decisions. Int. J. River Basin Manage. 6: 85–98.
302
Wea
ther
– N
ovem
ber 2
014,
Vol
. 69,
No.
11
The 2
013 f
lood
s in
Mex
ico
Figure S2. Flood impacts in recent urban developments along the banks of La Sabana River, Acapulco Diamante. Figure S3. Overflow of La Sabana river (flow is from left to right in the image).Figure S4. Bank scouring erosion at Chilpancingo city, Guerrero. Figure S5. Impacts to urban infrastructure due to bank scouring at Chilpancingo city, Guerrero.Figure S6. Large flow velocities observed at Río Huacapa, Chilpancingo, Guerrero. Figure S7. Infrared satellite image of the 2013 flood in Acapulco-Diamante, Mexico.Supporting information
The following material is available as part of the online article.Figure S1. Aerial overview of the flood impacts registered in Acapulco Diamante, Guerrero, due to the overflowing of La Sabana river (September 2013).
Huffman GJ, Adler RF, Bolvin DT et al. 2007. The TRMM multi-satellite precipita-tion analysis (TMPA): Quasi-global, multi-year, combined-sensor precipitation estimates at fine scales. J. Hydrometeorol. 8: 38–55. doi:10.1175/JHM560.1Kumar P. 2013. Se asonal rain changes. Nat. Clim. Change 3(9): 783–784.Lumbroso D, Gaume E. 2012. Reducing the uncertainty in indirect estimates of extreme flash flood discharges. J. Hydrol. 414–415: 16–30. doi:10.1016/j.jhydrol.2011.08.048Michel-Kerjan E. 2012. How resilient is your country? Nature 491: 497. doi:10.1038/491497aNASA Worldview. 2013. h ttp://1.usa.gov/1eTbpqi (accessed 17 July 2014).Pedrozo-Acuña A, Rodríguez-Rincón JP, Arganis-Juárez M et al. 2013. Estimation
of probabilistic flood inundation maps for an extreme event: Pánuco River, México. J. Flood Risk Manage. doi:10.1111/jfr3.12067Van Alphen J. 2013. The Delta programme in the Netherlands: a long-term perspec-tive on flood risk management, in Floods: From Risk to Opportunity. Chavoshian A, Takeushi K (eds). IAHS Publication: Wallingford, UK, pp 13–20.
The weather of 2013Helen RobertsMet Office, Exeter
2013 was another year of interesting weather, with extremes and records being broken across the globe. This article follows on from the Royal Meteorological Society conference in February 2014: Understanding the Weather of 2013.
JanuaryThe year stared with the coldest weather in northern India for 44 years, with the lowest maximum temperature on record for New Delhi at 9.8°C. The remnants of ex-cyclone Oswald made landfall in north-ern Queensland, bringing extreme rainfall and power outages. Meanwhile, it was the hottest January on record for Australia as a whole, with both average mean and aver-age maximum temperatures exceeding previous records (Bureau of Meteorology, 2014), resulting in large numbers of wild-fires across the country. January also saw one of Beijing’s worst spells of air pollution, causing aviation problems and health con-cerns. Lebanon had some rare snow, nearly 1.5m in some northern parts of the country, with temperatures more than 5 degC below normal. Closer to home, there was plenty of snow for much of the United Kingdom too
in flooding in Angola. Meanwhile, back in the United Kingdom it was still very cold, with the coldest Easter Sunday on record at −12.5°C overnight in Braemar, and the snow continued as well, killing more than 20 000 sheep. It was not just the United Kingdom shivering though, as Spain also saw some unusual spring-time snow.
Figure 1. Snow covering much of the UK on 26 January 2013. (Image credit: NEODAAS/University of Dundee.)
(Figure 1), with blizzards in some northern areas.
FebruaryIn February, Australia confirmed their sum-mer as the hottest on record and it was locally named ‘The Angry Summer’. Saidu Sharif in northern Pakistan experienced nearly double the average monthly rainfall in just 48h, and a powerful northeaster in the USA, named Winter Storm Nemo, pro-duced the all-time greatest snowstorm for Portland (Maine) with 81cm.
MarchIn March, Mississippi sheltered from hail the size of baseballs. Meanwhile, Virginia declared a state of emergency after severe blizzards hit the US east coast. The USA was not the only place to experience blizzards though, with parts of northern Japan buried under feet of snow as well. It was rain rather than snow causing problems in Mauritius, with a day of national mourning after 11 people died in severe floods.
AprilApril saw some torrential rain of its own, with deadly flash flooding in Argentina, when La Plata had 400mm of rainfall in just 2h. Yet more torrential rain also resulted