301


Discrimination Prohibited
Sec. 504(a) of the Rehabilitation Act of 1973 states that “No otherwise qualified individual with a disability in the United States, as defined in section 7(20), shall, solely by reason of her or his disability, be excluded from the participation in, be denied the benefits of, or be subjected to discrimination under any program or activity receiving Federal financial assistance or under any program or activity conducted by any Executive agency or by the United States Postal Service.”
Sec. 601 of the Civil Rights Act of 1964 states that “No person in the United States shall, on the ground of race, color, or national origin, be excluded from participation in, be denied the benefits of, or be subjected to discrimination under any program or activity receiving Federal financial assistance.”

35th Annual Report to Congress on the Implementation of the
Individuals with Disabilities Education Act, 2013
Individuals with Disabilities Education Act: to ensure the free appropriate public education
of all children with disabilities
Office of Special Education and Rehabilitative Services U.S. Department of Education

This report was produced under U.S. Department of Education Contract No. ED-OSE-12-C-0031 with New Editions Consulting, Inc. Richelle Davis served as the contracting officer’s representative. The views expressed herein do not necessarily represent the positions or policies of the Department of Education. No official endorsement by the U.S. Department of Education of any product, commodity, service, or enterprise mentioned in this publication is intended or should be inferred. For the reader’s convenience, this publication contains information about and from outside organizations, including hyperlinks and URLs. Inclusion of such information does not constitute an endorsement by the Department.
U.S. Department of Education Arne Duncan Secretary
Office of Special Education and Rehabilitative Services (OSERS) Michael Yudin Acting Assistant Secretary
Office of Special Education Programs (OSEP) Melody Musgrove Director
May 2014
This report is in the public domain. Authorization to reproduce it in whole or in part is granted. While permission to reprint this report is not necessary, the citation should be U.S. Department of Education, Office of Special Education and Rehabilitative Services, Office of Special Education Programs, 35th Annual Report to Congress on the Implementation of the Individuals with Disabilities Education Act, 2013, Washington, D.C. 2014.
This report is available on the Department’s website at: http://www.ed.gov/about/reports/annual/osep.
To order copies of this report, Write to: ED PUBS, Education Publications Center, U.S. Department of Education, P.O. Box 22207, Alexandria, VA 22304. Or fax your request to: 703-605-6794. Or email your request to: [email protected]. Or call in your request toll-free to: 1-877-433-7827 (1-877-4-ED-PUBS). Those who use a telecommunications device for the deaf (TDD) or a teletypewriter (TTY) should call 1-877-576-7734. If 877 service is not available in your area, call 1-800-872-5327 (1-800-USA-LEARN). Or order online at: www.edpubs.gov.
Availability of Alternate Formats Requests for documents in alternate formats such as Braille or large print should be submitted to the Alternate Format Center by calling 202-260-0852 or by contacting the 504 coordinator via email at [email protected].
Notice to Limited English Proficient Persons If you have difficulty understanding English, you may request language assistance services for Department information that is available to the public. These language assistance services are available free of charge. If you need more information about interpretation or translation services, please call 1-800-USA-LEARN (1-800-872-5327) (TTY: 1-800-437-0833), or email us at: [email protected]. Or write to: U.S. Department of Education, Information Resource Center, LBJ Education Building, 400 Maryland Ave. SW, Washington, DC 20202.
Content Contact: Richelle Davis Phone: 202-245-7401 Email: [email protected]
Contents
Page List of Exhibits ........................................................................................................................................... vi Preface ........................................................................................................................................................ xv Key Findings at the National Level ........................................................................................................ xxi Data Sources Used in This Report ............................................................................................................. 1 Section I. Summary and Analysis of IDEA Section 618 Data at the National Level ............................. 9
Infants and Toddlers Served Under IDEA, Part C ...................................................................... 11
Numbers and Percentages of Infants and Toddlers Birth Through Age 2 Served
Under IDEA, Part C ....................................................................................................... 12 Primary Early Intervention Service Settings for Infants and Toddlers Birth Through
Age 2 Served Under IDEA, Part C ................................................................................ 15 Part C Exiting Status for Children Served Under IDEA, Part C .......................................... 18 Dispute Resolution for Infants and Toddlers Served Under IDEA, Part C .......................... 21
Children Ages 3 Through 5 Served Under IDEA, Part B ............................................................ 26
Numbers and Percentages of Children Ages 3 Through 5 Served Under IDEA,
Part B ............................................................................................................................. 27 Educational Environments for Children Ages 3 Through 5 Served Under IDEA,
Part B ............................................................................................................................. 31 Special Education Teachers and Paraprofessionals Employed to Serve Children
Ages 3 Through 5 Under IDEA, Part B ......................................................................... 34 Students Ages 6 Through 21 Served Under IDEA, Part B .......................................................... 36
Numbers and Percentages of Students Ages 6 Through 21 Served Under IDEA,
Part B ............................................................................................................................. 37 Educational Environments for Students Ages 6 Through 21 Served Under IDEA,
Part B ............................................................................................................................. 46 Part B Participation and Performance on State Assessments ............................................... 52 Part B Exiting ....................................................................................................................... 59 Special Education Teachers and Paraprofessionals Employed to Serve Students
Ages 6 Through 21 Under IDEA, Part B ....................................................................... 65 Children and Students Ages 3 Through 21 Served Under IDEA, Part B ................................... 67
Personnel Employed To Provide Related Services for Children and Students Ages
3 Through 21 Served Under IDEA, Part B .................................................................... 67 Disciplinary Removals of Children and Students From Their Educational
Placements ..................................................................................................................... 69 Dispute Resolution for Children and Students Served Under IDEA, Part B ........................ 73
iii
Contents (continued)
Page Section II. Summary and Analysis of IDEA Section 618 Data at the State Level ............................... 77
Introduction ..................................................................................................................................... 79 Notes Concerning the Exhibits in Section II ................................................................................. 80 Infants and Toddlers Birth Through Age 2 Served Under IDEA, Part C .................................. 82
Part C Child Count ............................................................................................................... 82 Part C Primary Early Intervention Service Settings ............................................................. 88 Part C Exiting ....................................................................................................................... 91 Part C Dispute Resolution .................................................................................................... 95
Children Ages 3 Through 5 Served Under IDEA, Part B ............................................................ 98
Part B Child Count ............................................................................................................... 98 Part B Educational Environments ...................................................................................... 104 Part B Personnel ................................................................................................................. 112
Students Ages 6 Through 21 Served Under IDEA, Part B ........................................................ 115
Part B Child Count ............................................................................................................. 115 Part B Educational Environments ...................................................................................... 130 Part B Participation on State Assessments ......................................................................... 142 Part B Exiting ..................................................................................................................... 150 Part B Personnel ................................................................................................................. 157
Children and Students Ages 3 Through 21 Served Under IDEA, Part B ................................. 160
Part B Discipline ................................................................................................................ 160 Part B Dispute Resolution .................................................................................................. 169
Section III. Findings and Determinations Resulting From Reviews of State Implementation of IDEA .................................................................................................................................................... 177
Findings and Determinations Resulting From Reviews of State Implementation of IDEA .... 179
The SPP and APR .............................................................................................................. 179 Indicators ............................................................................................................................ 180 The Determination Process ................................................................................................ 184 Enforcement ....................................................................................................................... 186 Determination Status .......................................................................................................... 186 Status of Selected Indicators .............................................................................................. 190 Early Childhood Transition: Part B Indicator 12 ............................................................... 191 Early Childhood Transition: Part C Indicator 8 ................................................................. 193 General Supervision: Part B Indicator 15 .......................................................................... 196 General Supervision: Part C Indicator 9 ............................................................................ 198
iv

Contents (continued)
Page Section IV. Summary of Research Conducted Under Part E of the Education Sciences Reform Act of 2002 .................................................................................................................................. 201 Section V. Summary of Studies and Evaluations Under Section 664 of IDEA .................................. 235 Section VI. Extent and Progress of the Assessment of National Activities ........................................ 241 Appendix A. Infants, Toddlers, Children, and Students Served Under IDEA, by Age Group and State .................................................................................................................................................. 247 Appendix B. Developmental Delay Data for Children Ages 3 Through 5 and Students Ages 6 Through 9 Served Under IDEA, Part B ................................................................................................ 257 Appendix C. Differences in State Reporting of IDEA, Part B, Disabilities ....................................... 265
v

Exhibits
Page Exhibit 1 Number of infants and toddlers birth through age 2 served under IDEA, Part C,
and percentage of the population served, by year: Fall 2002 through fall 2011 ............ 12 Exhibit 2 Percentage of the population birth through age 2 served under IDEA, Part C, by
year and age group: Fall 2002 through fall 2011 ........................................................... 13 Exhibit 3 Number of infants and toddlers birth through age 2 served under IDEA, Part C,
and percentage of the population served (risk index), comparison risk index, and risk ratio for infants and toddlers birth through age 2 served under IDEA, Part C, by race/ethnicity: Fall 2011 ............................................................................... 14
Exhibit 4 Percentage of infants and toddlers birth through age 2 served under IDEA,
Part C, by primary early intervention service setting: Fall 2011 ................................... 15 Exhibit 5 Percentage of infants and toddlers birth through age 2 served under IDEA,
Part C, within racial/ethnic groups, by primary early intervention service setting: Fall 2011 ........................................................................................................... 17
Exhibit 6 Percentage of infants and toddlers birth through age 2 served under IDEA,
Part C, by exiting status: 2010−11 ................................................................................. 18 Exhibit 7 Percentage of children served under IDEA, Part C, who reached age 3 and were
eligible to exit Part C, by Part B eligibility status: 2010–11 ......................................... 20 Exhibit 8 Percentage of written, signed complaints for infants and toddlers served under
IDEA, Part C, by complaint status: 2010–11 ................................................................ 22 Exhibit 9 Percentage of due process complaints for infants and toddlers served under
IDEA, Part C, by complaint status: 2010–11 ................................................................ 23 Exhibit 10 Percentage of mediation requests for infants and toddlers served under IDEA,
Part C, by request status: 2010–11 ................................................................................ 24 Exhibit 11 Number of children ages 3 through 5 served under IDEA, Part B, and
percentage of the population served, by year: Fall 2002 through fall 2011 .................. 27 Exhibit 12 Percentage of the population ages 3 through 5 served under IDEA, Part B, by
year and age group: Fall 2002 through fall 2011 ........................................................... 28 Exhibit 13 Percentage of children ages 3 through 5 served under IDEA, Part B, by
disability category: Fall 2011 ........................................................................................ 29 Exhibit 14 Number of children ages 3 through 5 served under IDEA, Part B, and
percentage of the population served (risk index), comparison risk index, and risk ratio for children ages 3 through 5 served under IDEA, Part B, by race/ethnicity: Fall 2011 ................................................................................................ 30
vi
Exhibits (continued)
Page Exhibit 15 Percentage of children ages 3 through 5 served under IDEA, Part B, by
educational environment: Fall 2011 .............................................................................. 31 Exhibit 16 Percentage of children ages 3 through 5 served under IDEA, Part B, within
racial/ethnic groups, by educational environment: Fall 2011 ........................................ 33 Exhibit 17 Number of full-time equivalent (FTE) special education teachers and number
and percentage of FTE highly qualified special education teachers employed to provide special education and related services for children ages 3 through 5 served under IDEA, Part B: Fall 2010 ........................................................................... 34
Exhibit 18 Number of full-time equivalent (FTE) special education paraprofessionals and
number and percentage of FTE qualified special education paraprofessionals employed to provide special education and related services for children ages 3 through 5 served under IDEA, Part B: Fall 2010 .......................................................... 35
Exhibit 19 Number of students ages 6 through 21 served under IDEA, Part B, and
percentage of the population served, by year: Fall 2002 through fall 2011 .................. 37 Exhibit 20 Percentage of the population ages 6 through 21 served under IDEA, Part B, by
year and age group: Fall 2002 through fall 2011 ........................................................... 38 Exhibit 21 Percentage of students ages 6 through 21 served under IDEA, Part B, by
disability category: Fall 2011 ........................................................................................ 39 Exhibit 22 Percentage of the population ages 6 through 21 served under IDEA, Part B, by
year and disability category: Fall 2002 through fall 2011 ............................................. 40 Exhibit 23 Percentage of the population ages 6 through 21 served under IDEA, Part B,
reported under the category of autism, by year and age group: Fall 2002 through fall 2011 ........................................................................................................... 41
Exhibit 24 Percentage of the population ages 6 through 21 served under IDEA, Part B,
reported under the category of other health impairments, by year and age group: Fall 2002 through fall 2011 ................................................................................ 42
Exhibit 25 Percentage of the population ages 6 through 21 served under IDEA, Part B,
reported under the category of specific learning disabilities, by year and age group: Fall 2002 through fall 2011 ................................................................................ 43
Exhibit 26 Number of students ages 6 through 21 served under IDEA, Part B, and
percentage of the population served (risk index), comparison risk index, and risk ratio for children ages 6 through 21 served under IDEA, Part B, by race/ethnicity: Fall 2011 ................................................................................................ 44
Exhibit 27 Percentage of students ages 6 through 21 served under IDEA, Part B, within
racial/ethnic groups, by disability category: Fall 2011 .................................................. 45
vii
Exhibits (continued)
Page Exhibit 28 Percentage of students ages 6 through 21 served under IDEA, Part B, by
educational environment: Fall 2011 .............................................................................. 46 Exhibit 29 Percentage of students ages 6 through 21 served under IDEA, Part B, by year
and educational environment: Fall 2002 through fall 2011 ........................................... 47 Exhibit 30 Percentage of students ages 6 through 21 served under IDEA, Part B, within
disability category, by educational environment: Fall 2011 .......................................... 49 Exhibit 31 Percentage of students ages 6 through 21 served under IDEA, Part B, within
racial/ethnic groups, by educational environment: Fall 2011 ........................................ 50 Exhibit 32 Percentages of students served under IDEA, Part B, in grades 3 through 8 and
high school who participated in state math and reading assessments, by assessment type: School year 2010–11.......................................................................... 52
Exhibit 33 Percentages of students served under IDEA, Part B, in grades 3 through 8 and
high school classified as nonparticipants in state math and reading assessments, by nonparticipant category: School year 2010–11 ........................................................ 54
Exhibit 34 Numbers of states assessing students served under IDEA, Part B, in grades 3
through 8 and high school in math and reading, and median percentages of those students who were proficient, by assessment type: School year 2010–11 ........... 56
Exhibit 35 Percentage of students ages 14 through 21 exiting IDEA, Part B, by exit
reason: 2010–11 ............................................................................................................ 59 Exhibit 36 Percentages of students ages 14 through 21 exiting IDEA, Part B, and school,
who graduated with a regular high school diploma or dropped out of school, by year: 2001–02 through 2010–11 ............................................................................... 60
Exhibit 37 Percentage of students ages 14 through 21 exiting IDEA, Part B, and school,
who graduated with a regular high school diploma, by year and disability category: 2001–02 through 2010–11 ............................................................................. 62
Exhibit 38 Percentage of students ages 14 through 21 exiting IDEA, Part B, and school,
who dropped out of school, by year and disability category: 2001–02 through 2010–11 ......................................................................................................................... 64
Exhibit 39 Number of full-time equivalent (FTE) special education teachers and number
and percentage of FTE highly qualified special education teachers employed to provide special education and related services for students ages 6 through 21 served under IDEA, Part B: Fall 2010 ........................................................................... 65
viii
Exhibits (continued)
Page Exhibit 40 Number of full-time equivalent (FTE) special education paraprofessionals and
number and percentage of FTE qualified special education paraprofessionals employed to provide special education and related services for students ages 6 through 21 served under IDEA, Part B: Fall 2010 ........................................................ 66
Exhibit 41 Number of full-time equivalent (FTE) personnel and number and percentage of
FTE fully certified personnel employed to provide related services for children and students ages 3 through 21 served under IDEA, Part B, by personnel type: Fall 2010 ........................................................................................................................ 67
Exhibit 42 Numbers of children and students ages 3 through 21 who were served under
IDEA, Part B; removed from their educational placements for disciplinary purposes; and removed per 10,000 children and students ages 3 through 21 served under IDEA, Part B, by type of disciplinary removal: School year 2010–11 ......................................................................................................................... 69
Exhibit 43 Numbers of children and students ages 3 through 21 served under IDEA,
Part B, who were removed to an interim alternative educational setting and suspended or expelled for more than 10 days per 10,000 children and students ages 3 through 21 served under IDEA, Part B, by disability category and type of disciplinary removal: School year 2010–11 .............................................................. 71
Exhibit 44 Percentage of written, signed complaints for children and students served under
IDEA, Part B, by complaint status: 2010−11 ................................................................ 74 Exhibit 45 Percentage of due process complaints for children and students served under
IDEA, Part B, by complaint status: 2010−11 ................................................................ 75 Exhibit 46 Percentage of mediation requests for children and students served under IDEA,
Part B, by request status: 2010−11 ................................................................................ 76 Exhibit 47 Percentage of the population birth through age 2 served under IDEA, Part C, by
year and state: Fall 2004 and fall 2011 .......................................................................... 82 Exhibit 48 Percentage of the population birth through age 2 served under IDEA, Part C,
for each racial/ethnic group, by state: Fall 2011 ............................................................ 85 Exhibit 49 Percentage of infants and toddlers birth through age 2 served under IDEA,
Part C, by year, primary early intervention service setting, and state: Fall 2007 and fall 2011 .................................................................................................................. 88
Exhibit 50 Percentage of infants and toddlers birth through age 2 exiting or continuing in
IDEA, Part C, by exiting status and state: 2010–11 ...................................................... 91
ix
Exhibits (continued)
Page Exhibit 51 Number of written, signed complaints; due process complaints; and mediation
requests for infants and toddlers per 1,000 infants and toddlers birth through age 2 served under IDEA, Part C, by state: 2010–11 .................................................... 95
Exhibit 52 Percentage of the population ages 3 through 5 served under IDEA, Part B, by year and state: Fall 2004 and fall 2011 .......................................................................... 98
Exhibit 53 Percentage of the population ages 3 through 5 served under IDEA, Part B, for each racial/ethnic group, by state: Fall 2011 ............................................................... 101
Exhibit 54 Percentage of children ages 3 through 5 served under IDEA, Part B, by educational environment and state: Fall 2011 ............................................................. 104
Exhibit 55 Percentage of children ages 3 through 5 served under IDEA, Part B, who were limited English proficient, by educational environment and state: Fall 2011 ............. 108
Exhibit 56 Number of full-time equivalent (FTE) special education teachers employed to provide special education and related services for children ages 3 through 5 per 100 children ages 3 through 5 served under IDEA, Part B, by qualification status and state: Fall 2010 ............................................................................................ 112
Exhibit 57 Percentage of the population ages 6 through 21 served under IDEA, Part B, by year and state: Fall 2004 and fall 2011 ........................................................................ 115
Exhibit 58 Percentage of the population ages 6 through age 21 served under IDEA, Part B, for each racial/ethnic group, by state: Fall 2011 .......................................................... 118
Exhibit 59 Percentage of students ages 6 through 21 served under IDEA, Part B, reported under the category of autism, by year and state: Fall 2004 and fall 2011 ................... 121
Exhibit 60 Percentage of students ages 6 through 21 served under IDEA, Part B, reported under the category of other health impairments, by year and state: Fall 2004 and fall 2011 ................................................................................................................ 124
Exhibit 61 Percentage of students ages 6 through 21 served under IDEA, Part B, reported under the category of specific learning disabilities, by year and state: Fall 2004 and fall 2011 ................................................................................................................ 127
Exhibit 62 Percentage of students ages 6 through 21 served under IDEA, Part B, by educational environment and state: Fall 2011 ............................................................. 130
Exhibit 63 Percentage of students ages 6 through 21 served under IDEA, Part B, who were limited English proficient, by educational environment and state: Fall 2011 ............. 133
Exhibit 64 Percentage of students ages 6 through 21 served under IDEA, Part B, reported under the category of emotional disturbance, by educational environment and state: Fall 2011............................................................................................................. 136
x
Exhibits (continued)
Page
Exhibit 65 Percentage of students ages 6 through 21 served under IDEA, Part B, reported under the category of intellectual disabilities, by educational environment and state: Fall 2011............................................................................................................. 139
Exhibit 66 Percentages of students served under IDEA, Part B, in grades 4, 8, and high school who participated in state math assessments, by assessment type and state: School year 2010–11 .......................................................................................... 142
Exhibit 67 Percentages of students served under IDEA, Part B, in grades 4, 8, and high school who participated in state reading assessments, by assessment type and state: School year 2010–11 .......................................................................................... 146
Exhibit 68 Percentages of students ages 14 through 21 exiting IDEA, Part B, and school who graduated with a regular high school diploma or dropped out of school, by year and state: 2007–08 and 2010–11 .................................................................... 150
Exhibit 69 Percentage of students ages 14 through 21 exiting IDEA, Part B, by exit reason and state: 2010−11 ....................................................................................................... 154
Exhibit 70 Number of full-time equivalent (FTE) special education teachers employed to provide special education and related services for students ages 6 through 21 per 100 students served under IDEA, Part B, by qualification status and state: Fall 2010 ...................................................................................................................... 157
Exhibit 71 Number of children and students ages 3 through 21 served under IDEA, Part B, removed unilaterally to an interim alternative educational setting by school personnel for drug, weapons, or serious bodily injury offenses per 10,000 children and students ages 3 through 21 served under IDEA, Part B, by state: School year 2010–11 ................................................................................................... 160
Exhibit 72 Number of children and students ages 3 through 21 served under IDEA, Part B, suspended out of school or expelled for more than 10 days during the school year, per 10,000 children and students ages 3 through 21 served under IDEA, Part B, by state: School year 2010–11 ......................................................................... 163
Exhibit 73 Number of children and students ages 3 through 21 served under IDEA, Part B, reported under the category of emotional disturbance and suspended out of school or expelled for more than 10 days during the school year, per 10,000 children and students ages 3 through 21 served under IDEA, Part B, reported under the category of emotional disturbance, by state: School year 2010–11 ............ 166
Exhibit 74 Numbers of written, signed complaints; due process complaints; and mediation requests for children and students served under IDEA, Part B, per 10,000 children and students ages 3 through 21 served, by state: 2010–11 ............................ 169
xi
Exhibits (continued)
Page
Exhibit 75 Number of complaints for children and students served under IDEA, Part B, per 10,000 children and students ages 3 through 21 served, by complaint status and state: 2010–11 ....................................................................................................... 173
Exhibit 76 Compliance and results indicators for determining the extent to which each state met IDEA, Part B, requirements: Federal fiscal year 2010 ................................. 180
Exhibit 77 Compliance and results indicators for determining the extent to which each state met IDEA, Part C, requirements: Federal fiscal year 2010 ................................. 183
Exhibit 78 Process for determining the extent to which each state met IDEA, Part B and Part C, requirements: Federal fiscal year 2010 ............................................................ 185
Exhibit 79 States determined to have met IDEA, Part B, requirements, by determination status: Federal fiscal year 2010 ................................................................................... 187
Exhibit 80 States determined to have met IDEA, Part C, requirements, by determination status: Federal fiscal year 2010 ................................................................................... 188
Exhibit 81 Number of states determined to have met IDEA, Part B, requirements, by determination status and change in status: Federal fiscal years 2009 and 2010 .......... 189
Exhibit 82 Number of states determined to have met IDEA, Part C, requirements, by determination status and change in status: Federal fiscal years 2009 and 2010 .......... 190
Exhibit 83 Number of states, by percentage of children referred to IDEA, Part B, by Part C prior to age 3 who were found eligible for Part B and who had IEPs developed and implemented by their third birthdays: Federal fiscal year 2010 ........................... 191
Exhibit 84 Number of states, by change in performance status on IDEA, Part B, Indicator 12: Federal fiscal year 2010 ......................................................................................... 192
Exhibit 85 Number of states, by percentage of children exiting IDEA, Part C, who received timely transition planning by their third birthdays, by sub-indicators of Part C Indicator 8: Federal fiscal year 2010 ............................................................ 193
Exhibit 86 Number of states, by change in performance status on sub-indicators of IDEA, Part C, Indicator 8: Federal fiscal year 2010 ............................................................... 195
Exhibit 87 Number of states, by percentage of IDEA, Part B, noncompliance findings corrected within one year of identification: Federal fiscal year 2010 ......................... 197
Exhibit 88 Number of states, by change in performance status on IDEA, Part B, Indicator 15: Federal fiscal year 2010 ......................................................................................... 198
Exhibit 89 Number of states, by percentage of IDEA, Part C, noncompliance findings corrected within one year of identification: Federal fiscal year 2010 ......................... 199
xii

Exhibits (continued)
Page
Exhibit 90 Number of states, by change in performance status on IDEA, Part C, Indicator 9: Federal fiscal year 2010 ........................................................................................... 200
Exhibit A-1 Number and percentage of the population of infants and toddlers birth through age 2 served under IDEA, Part C, and children and students ages 3 through 21 served under IDEA, Part B, by age group and state: Fall 2011 ................................... 249
Exhibit A-2 Number of infants and toddlers birth through age 2 served under IDEA, Part C, by race/ethnicity and state: Fall 2011 .......................................................................... 251
Exhibit A-3 Number of children ages 3 through 5 served under IDEA, Part B, by race/ethnicity and state: Fall 2011 ............................................................................... 253
Exhibit A-4 Number of students ages 6 through 21 served under IDEA, Part B, by race/ethnicity and state: Fall 2011 ............................................................................... 255
Exhibit B-1 Number of states reporting children ages 3 through 5 served under IDEA, Part B, under the category of developmental delay and percentage of the population ages 3 through 5 served under IDEA, Part B, reported under the category of developmental delay, by year: Fall 2002 through fall 2011 ..................... 260
Exhibit B-2 Number of states reporting students ages 6 through 9 served under IDEA, Part B, under the category of developmental delay and percentage of the population ages 6 through 9 served under IDEA, Part B, reported under the category of developmental delay, by year: Fall 2002 through fall 2011 ..................... 261
Exhibit B-3 States with different practices in reporting children served under IDEA, Part B, under the category of developmental delay, by reporting practice and state: Fall 2011 ............................................................................................................................. 262
Exhibit C-1 States that reported children and students with other health impairments and multiple disabilities in different disability categories for IDEA, Part B, child count and educational environments data collections: Fall 2011; and exiting and discipline data collections: 2010–11 ..................................................................... 267
xiii


Preface
Since enactment of the Education for All Handicapped Children Act of 1975, Public Law (P.L.) 94-142, the secretary of the U.S. Department of Education (secretary) [and predecessor, the commissioner of education at the U.S. Department of Health, Education, and Welfare] has been required to transmit to Congress an annual report to inform Congress and the public of the progress being made in implementing the act. The annual reports to Congress reflect a history of persistent commitment and effort to expand educational opportunities for children with disabilities.
In December 2004, Congress reauthorized the Individuals with Disabilities Education Act (IDEA) (P.L. 108-446), which was signed into law the same month. The provisions of IDEA became effective on July 1, 2005, with the exception of some of the elements pertaining to the definition of a “highly qualified teacher”∗ that took effect upon the signing of the act. With reauthorization of IDEA, the nation reaffirmed its commitment to improving educational results for children and youths with disabilities.
The 35th Annual Report to Congress on the Implementation of the Individuals with Disabilities Education Act, 2013† describes our nation’s progress in (1) providing a free appropriate public education (FAPE) for all children with disabilities, (2) ensuring that the rights of children with disabilities and their parents are protected, (3) assisting states and localities in providing for the education of all children with disabilities, and (4) assessing the effectiveness of efforts to educate children with disabilities. The report focuses on the children and students with disabilities being served under IDEA, Part C or B, nationally and at the state level. In particular, Part C of IDEA provides funds to states to assist them in developing and implementing statewide, comprehensive, coordinated, multidisciplinary interagency systems to make early intervention services available to all children from birth through age 2 with disabilities and their families, whereas Part B of IDEA provides funds to states to assist them in providing FAPE to children ages 3 through 21 with disabilities who are in need of special education and related services. Throughout this report, infants and toddlers served under IDEA, Part C, children served under IDEA, Part B, and students served under IDEA, Part B, refer to individuals with disabilities who receive services under IDEA, Part C or Part B. “Special education services,” which is referenced throughout this report, is a term
∗ When referring to a “highly qualified teacher,” the term “highly qualified” has the meaning given the term in section 9101 of the Elementary and Secondary Education Act of 1965, as amended (ESEA). For a highly qualified special education teacher, the term “highly qualified” has the same meaning given the term in ESEA, except that such term also includes the requirements described in section 602(10)(B) of IDEA, and the option for teachers to meet the requirements of section 9101 of ESEA, as amended, by meeting the requirements of section 602(10)(C) or (D) of IDEA [see 20 U.S.C. section 1401(10)].
† The year in the title reflects the U.S. Department of Education’s target year for submitting the report to Congress. The most current findings are based on data collected from July 2010 through December 2011. These data have been available to the public prior to their presentation in this report.
xv

that is synonymous with services provided under IDEA, Part B. Similarly, “early intervention services” is a term used synonymously with services provided under IDEA, Part C.
This 35th Annual Report to Congress, 2013 follows the 34th Annual Report to Congress, 2012 in sequence and format, and it continues to focus on IDEA results and accountability. Similar to the 34th Annual Report, 2012, the 35th Annual Report, 2013 contains six major sections that address the five annual report requirements contained in section 664(d) of IDEA. The sections are: (1) a summary and analysis of IDEA section 618 data at the national level; (2) a summary and analysis of IDEA section 618 data at the state level;‡ (3) a summary and analysis of the U.S. Department of Education’s (Department’s) findings and determinations regarding the extent to which states are meeting the requirements of IDEA, Parts B and C; (4) a summary of special education research conducted under Part E of the Education Sciences Reform Act of 2002; (5) a summary of national special education studies and evaluations conducted under sections 664(a) and (c) of IDEA; and (6) a summary of the extent and progress of the assessment of national activities, which focus on determining the effectiveness of IDEA and improving its implementation.
The content of this report differs from that of the 34th Annual Report, 2012 in that it does not include an exhibit in Section II that presents data about exits from Part B for states that used and states that did not use exit exams for students served under IDEA, Part B. The source of information that had been used to classify the states regarding the use of exit exams did not include information about the time period addressed in this report, and no alternative source was identified.
A summary of the six sections and three appendices that make up the 35th Annual Report, 2013 follows.
Section I. Summary and Analysis of IDEA Section 618 Data at the National Level
Section I contains national data pertinent to Parts C and B of IDEA. It contains four subsections. The four subsections focus on infants and toddlers served under IDEA, Part C; children ages 3 through 5 served under IDEA, Part B; students ages 6 through 21 served under IDEA, Part B; and children and students ages 3 through 21 served under IDEA, Part B. The exhibits provide information about the characteristics of children and students receiving services under Parts C and B, their disabilities, the
‡ 618 data consist of (1) the number of infants and toddlers served under IDEA, Part C; the settings in which they receive program services; information on the transition at age 3 out of Part C; and dispute resolutions and (2) the number of children and students served under IDEA, Part B; the environments in which they receive education; their participation in and performance on state assessments; information on their exiting special education services; the personnel employed to provide educational services to them; disciplinary actions that affect them; and dispute resolution information.
xvi

settings in which they receive services, their participation in and performance on state assessments, their exits from Part C and Part B programs, their disciplinary removals, and their legal disputes. Also addressed are the characteristics of the personnel employed to provide special education and related services for the children and students. The data presented in the exhibits and discussed in the bulleted text represent the 50 states, the District of Columbia, Puerto Rico, and the outlying areas (i.e., American Samoa, Guam, the Northern Mariana Islands, and the Virgin Islands). In addition, the report presents data for special education and related services provided under IDEA, Part B, for Bureau of Indian Education (BIE) schools operated or funded by the U.S. Department of the Interior.
Section II. Summary and Analysis of IDEA Section 618 Data at the State Level
Section II contains state-level data regarding Part C and Part B of IDEA. Similar to Section I, this section is organized into four subsections. The first subsection presents information about infants and toddlers served under IDEA, Part C, while the second and third subsections present information about children ages 3 through 5 and students ages 6 through 21 served under IDEA, Part B, respectively. The fourth subsection provides information about children and students ages 3 through 21 served under IDEA, Part B. The four subsections address questions about the characteristics of children and students receiving services under Parts C and B, their disabilities, the settings in which they receive services, their participation in state assessments, their exits from Part C and Part B programs, their disciplinary removals, and their legal disputes. Also addressed are the characteristics of the personnel employed to provide special education and related services for the children and students. The data presented in exhibits and discussed in the bulleted text represent the 50 states, the District of Columbia, BIE schools, and Puerto Rico.
Section III. Findings and Determinations Resulting From Reviews of State Implementation of IDEA
Sections 616(d) and 642 of IDEA require the secretary to make an annual determination as to the extent to which each state’s Part B and Part C programs are meeting the requirements of the statute. To fulfill this requirement, the secretary considers each state’s State Performance Plan (SPP) and Annual Performance Report (APR). Based on the information provided by the state in the SPP and APR, information obtained through monitoring reviews, and any other public information made available, the secretary determines if the state meets the requirements and purposes of IDEA, needs assistance in implementing the requirements, needs intervention in implementing the requirements, or needs substantial intervention in implementing the requirements. In June 2012, the Department issued the determination letters on implementation of IDEA for federal fiscal year (FFY) 2010 to 60 state education agencies for Part B and to 56 state lead agencies for Part C. Section III presents the results of the determinations.
xvii
Section IV. Summary of Research Conducted Under Part E of the Education Sciences Reform Act of 2002
When Congress reauthorized IDEA in December 2004, it amended the Education Sciences Reform Act of 2002 (P.L. 107-279) by adding a new Part E to that act. The new Part E established the National Center for Special Education Research (NCSER) as part of the Institute of Education Sciences (IES). NCSER began operation on July 1, 2005. As specified in section 175(b) of the Education Sciences Reform Act of 2002, NCSER’s mission is to
• Sponsor research to expand knowledge and understanding of the needs of infants, toddlers, and children with disabilities in order to improve the developmental, educational, and transitional results of such individuals;
• Sponsor research to improve services provided under, and support the implementation of, IDEA (20 U.S.C. section 1400 et seq.); and
• Evaluate the implementation and effectiveness of IDEA in coordination with the National Center for Education Evaluation and Regional Assistance.
Section IV of this report describes the research projects funded by grants made during FFY 2012 (October 1, 2011, through September 30, 2012) by NCSER under Part E of the Education Sciences Reform Act of 2002.
Section V. Summary of Studies and Evaluations Under Section 664 of IDEA
In the December 2004 reauthorization of IDEA, Congress required the secretary to delegate to the director of IES responsibility to carry out studies and evaluations under sections 664(a), (b), and (c) of IDEA. As specified in section 664(a) of IDEA, IES, either directly or through grants, contracts, or cooperative agreements awarded to eligible entities on a competitive basis, assesses the progress in the implementation of IDEA, including the effectiveness of state and local efforts to provide (1) FAPE to children with disabilities and (2) early intervention services to infants and toddlers with disabilities and infants and toddlers who would be at risk of having substantial developmental delays if early intervention services were not provided to them. As specified in section 664(c) of IDEA, IES is required to carry out a national study or studies that will inform efforts to ensure accountability for students who are held to alternate achievement standards. This section describes the studies and evaluations authorized by sections 664(a) and (c) of IDEA and supported by IES during FFY 2012 (October 1, 2011, through September 30, 2012).
xviii

Section VI. Extent and Progress of the Assessment of National Activities
Under section 664(b) of IDEA (as amended in 2004), the secretary is responsible for carrying out a “national assessment” of activities carried out with federal funds under IDEA. As delegated by the secretary, IES is carrying out this national assessment to (1) determine the effectiveness of IDEA in achieving the law’s purpose; (2) provide timely information to the president, Congress, the states, local education agencies, and the public on how to implement IDEA more effectively; and (3) to provide the president and Congress with information that will be useful in developing legislation to achieve the purposes of IDEA more effectively. The national assessment is designed to address specific research questions that focus on (1) the implementation and impact of programs assisted under IDEA in addressing developmental and academic outcomes for children with disabilities, (2) identification for early intervention and special education, (3) early intervention and special education services, and (4) early intervention and special education personnel. Studies funded in FFY 2012 that contribute to the national assessment are described in Section VI.
Appendix A. Infants, Toddlers, Children, and Students Served Under IDEA, by Age Group and State
Appendix A presents the numbers and percentages of the resident population represented by the infants and toddlers birth through age 2 served under IDEA, Part C; children ages 3 through 5 served under IDEA, Part B; students ages 6 through 21 served under IDEA, Part B; and students ages 14 through 21 served under IDEA, Part B, in 2011 in each state, the District of Columbia, BIE schools, Puerto Rico, and the four outlying areas. It also presents the number of children served in each state by race/ethnicity.
Appendix B. Developmental Delay Data for Children Ages 3 Through 5 and Students Ages 6 Through 9 Served Under IDEA, Part B
Appendix B presents information on states that reported children ages 3 through 5 and students ages 6 through 9 served under IDEA, Part B, under the category of developmental delay.§ It also provides data on the percentages of resident populations represented by the children ages 3 through 5 and students ages 6 through 9 served under IDEA, Part B, who were reported under the category of developmental delay and information on states with different practices in reporting children and students with developmental delay.
§ This descriptor and other section 618 data descriptors in this report are italicized within exhibits, text, and notes to clarify that the reference is to a grouping of data.
xix

Appendix C. Differences in State Reporting of IDEA, Part B, Disabilities
Appendix C presents information on the states that reported children and students ages 3 through 21 with other health impairments and multiple disabilities in different disability categories for IDEA, Part B, child count and educational environments data collections in 2011, and for the exiting and discipline data collections in 2010–11.
xx

Key Findings at the National Level
The 35th Annual Report to Congress, 2013 showcases data collected from states. The report also includes information from studies, evaluations, and databases of the Institute of Education Sciences and U.S. Census Bureau. Some key findings from Section I of the report, “Summary and Analysis of IDEA, Section 618 Data at the National Level” follow. To more completely understand the meaning and context for each of the findings featured below, the reader is advised to review the exhibit cited and the additional associated bulleted text.
Infants and Toddlers Birth Through Age 2 Served Under IDEA, Part C
• In 2011, there were 336,895 infants and toddlers birth through age 2 served under IDEA, Part C. Of those infants and toddlers, 331,636 were served in the 50 states and the District of Columbia. This number represented 2.8 percent of the birth-through-age-2 population in the 50 states and the District of Columbia (Exhibit 1).
• From 2002 through 2011, the percentage of the resident population of infants and toddlers birth through age 2 served under IDEA, Part C, increased from 2.2 percent to 2.8 percent. With two exceptions, the percentage of the resident population of infants and toddlers served under IDEA, Part C, either increased from the previous year or was approximately the same as in the previous year for the three age groups considered. The exceptions were that a smaller percentage of the resident population of infants and toddlers who were under 1 year old were served under Part C in 2010 (1.0 percent) than in 2009 (1.1 percent), and a smaller percentage of the resident population of infants and toddlers who were 1 year old were served under Part C in 2011 (2.6 percent) than in 2010 (2.7 percent) (Exhibit 2).
• White and Native Hawaiian or Other Pacific Islander infants and toddlers had risk ratios of 1.2 and 1.1, respectively, indicating that infants and toddlers in each of these racial/ethnic groups were slightly more likely than children in all other racial/ethnic groups combined to be served under IDEA, Part C. American Indian or Alaska Native, Hispanic/Latino, and Asian infants and toddlers as well as infants and toddlers associated with two or more races had risk ratios of 0.9, 0.9, 0.8, and 0.6, respectively, indicating that infants and toddlers in each of these groups were slightly less likely than those in all other racial/ethnic groups combined to be served under IDEA, Part C. Black or African American infants and toddlers, with a risk ratio of 1.0, were as likely to be served under Part C as the infants and toddlers of all other racial/ethnic groups combined (Exhibit 3).
• In 2011, more than four-fifths of infants and toddlers served under Part C (86.6 percent) received their early intervention services primarily in the home. The category of community-based setting was reported as the primary early intervention setting for 7.4 percent of those served under Part C. Consequently, a total of 94 percent of infants and toddlers served under IDEA, Part C, in 2011 received their early intervention services primarily in natural environments, which are defined as the home or a community-based setting (Exhibit 4).
• In 2011, home was the primary early intervention service setting for more than 83 percent of the infants and toddlers birth through age 2 served under IDEA, Part C, in each racial/ethnic group. The largest percentage of infants and toddlers served under IDEA, Part C, who
xxi

received early intervention services in a community-based setting was associated with American Indian or Alaska Native children (10.6 percent), while the smallest percentage served in this setting was associated with White children (6.6 percent) (Exhibit 5).
• Of the Part C exiting statuses in 2010–11, Part B eligible, exiting Part C accounted for the largest percentage of infants and toddlers (38.5 percent). An additional 1.7 percent of the infants and toddlers were found to be eligible for Part B but continued to receive services under Part C. No longer eligible for Part C prior to reaching age 3 was the second most prevalent category of exiting status as it accounted for 14.9 percent of the of infants and toddlers (Exhibit 6).
• In 2010–11, slightly less than two-thirds (62.3 percent) of children served under IDEA, Part C, who reached age 3 were determined to be Part B eligible, exiting Part C. An additional 2.8 percent of these children were found to be eligible for Part B but continued to receive services under Part C. In 2010–11, 17 percent of the children served under IDEA, Part C, who had reached age 3 exited Part C without having their eligibility for Part B determined. The remaining 17.9 percent of the children served under Part C who had reached age 3 exited Part C and were determined to be not eligible for Part B. The children who were not eligible for Part B included those who exited with referrals to other programs (11.6 percent) and those who exited with no referrals (6.3 percent) (Exhibit 7).
• During 2010–11, a total of 153 written, signed complaints were received through the dispute resolution process for infants and toddlers birth through age 2 served under IDEA, Part C. A report was issued for 115 (74.7 percent) of the complaints, while 38 (24.7 percent) of the complaints were withdrawn or dismissed. Only one (0.6 percent) of the complaints that were received during the reporting period was pending or unresolved by the end of the period (Exhibit 8).
• A total of 190 due process complaints were received during 2010–11 through the dispute resolution process for infants and toddlers birth through age 2 served under IDEA, Part C. For 170 (89.5 percent) of the due process complaints received during the reporting period, the complaint was withdrawn or dismissed. For 17 (8.9 percent) of the due process complaints received, a hearing was conducted, and a written legal decision was issued. For the remaining three complaints (1.6 percent), a hearing was still pending as of the end of the reporting period (Exhibit 9).
• During 2010–11, a total of 329 mediation requests were received through the dispute resolution process for infants and toddlers birth through age 2 served under IDEA, Part C. A mediation was conducted before the end of the reporting period for 177 (53.8 percent) of the mediation requests received. The mediation that was held in 22 of these cases was related to due process while the session held in 155 of these cases was not related to due process. Of the 152 mediation requests received that did not result in a mediation being held by the end of the reporting period, 151 requests had been withdrawn, dismissed, or otherwise ended without a mediation being held. The remaining one request was still pending at the end of the reporting period (Exhibit 10).
Children Ages 3 Through 5 Served Under IDEA, Part B
• IDEA, Part B, served 745,954 children ages 3 through 5 in 2011. Of these children, 730,558 were served in the 50 states, the District of Columbia, and Bureau of Indian Education (BIE) schools. This number represented 5.9 percent of the resident population ages 3 through 5.
xxii

Since 2002, the number of children ages 3 through 5 served under IDEA, Part B, increased from 647,420 to 745,954. This increase of 98,534 children represented a 15.2 percent increase in the number of children served. Between 2002 and 2004, the percentage of the resident population ages 3 through 5 served under IDEA, Part B, increased from 5.6 percent to 5.9 percent. The percentage remained at 5.9 through 2006 but fell to 5.8 percent in 2007. In 2009, the percentage again reached 5.9 percent, and it remained there through 2011 (Exhibit 11).
• Between 2002 and 2011, the percentage of 3-year-olds in the resident population served under IDEA, Part B, increased from 3.7 to 4.3 percent. In general, the overall change resulted from a set of small annual increases that offset the small decreases that did occur between 2006 and 2007 and between 2009 and 2010. Between 2002 and 2003, the percentage of 4-year-olds in the resident population served under IDEA, Part B, increased from 6.4 percent to 6.6 percent. Between 6.1 percent and 6.3 percent of the resident population were served in every year from 2004 through 2011. The percentage of 5-year-olds in the resident population served under IDEA, Part B, increased from 6.7 percent in 2002 to 7.7 percent in 2004. Between 2005 and 2006, the percentage fell to 7.4 percent. The percentage for each year from 2007 through 2011 was either slightly less or approximately equal to that of the previous year (Exhibit 12).
• In 2011, the most prevalent disability category of children ages 3 through 5 served under IDEA, Part B, was speech or language impairments (45.9 percent). The next most common disability category was developmental delay (37.0 percent), followed by autism (6.9 percent) (Exhibit 13).
• In 2011, American Indian or Alaska Native, Native Hawaiian or Other Pacific Islander, and White children ages 3 through 5 had risk ratios above 1.0 (i.e., 1.4, 1.5, and 1.2, respectively). This indicates that the children in each of these groups were more likely to be served under Part B than were children ages 3 through 5 of in all other racial/ethnic groups combined. Black or African American children ages 3 through 5, with a risk ratio of 1.0, were as likely to be served under Part B as the children ages 3 through 5 in all other racial/ethnic groups combined. Asian and Hispanic/Latino children as well as children associated with multiple races, with risk ratios of less than 1.0 (i.e., 0.7, 0.8, and 0.8, respectively), were less likely to be served under Part B than children ages 3 through 5 in all other racial/ethnic groups combined (Exhibit 14).
• In 2011, a total of 62.4 percent of children ages 3 through 5 served under IDEA, Part B, were in a regular early childhood program for some amount of their time in school. Of the four categories representing children who attended a regular early childhood program, the category representing children who attended a regular early childhood program for at least 10 hours per week and received the majority of hours of special education and related services in that program accounted for the largest percentage of children. Moreover, as this category accounted for 34.5 percent of all children ages 3 through 5 served under IDEA, Part B, it represented more children than any other educational environment category. A separate class accounted for almost one-fourth (23.1 percent) of children ages 3 through 5 served under IDEA, Part B, making it the second-most prevalent educational environment. Collectively, the environments of separate school, residential facility, and home (which are represented by the category “Other environments”), accounted for only 5.2 percent of the children ages 3 through 5 served under IDEA, Part B (Exhibit 15).
xxiii

• In 2011, a regular early childhood program for some amount of the time spent in school was the educational environment for the majority of children ages 3 through 5 served under IDEA, Part B, in each racial/ethnic group. The category representing children who attended a regular early childhood program for at least 10 hours per week and received the majority of hours of special education and related services in that program accounted for the largest percentage of children who attended a regular early childhood program for every racial/ethnic group. Moreover for every racial/ethnic group except Asian, this category accounted for a larger percentage of the children than did any other category of educational environment. In particular, this environment accounted for 41.7 percent of American Indian or Alaska Native children, 29.6 percent of Asian children, 37.6 percent of Black or African American children, 36.1 percent of Hispanic/Latino children, 38.1 percent of Native Hawaiian or Pacific Islander children, 34.7 percent of White children, and 36.3 percent of the children reported as two or more races. A separate class accounted for 33 percent of Asian children ages 3 through 5 served under IDEA, Part B, making it the most prevalent educational environment for Asian children (Exhibit 16).
• In 2010, a total of 38,793, or 95.8 percent, of the 40,481 full-time equivalent (FTE) special education teachers who were employed to provide special education and related services for children ages 3 through 5 under IDEA, Part B, were highly qualified (Exhibit 17).
• In 2010, a total of 43,192, or 94.3 percent, of the 45,807 FTE special education paraprofessionals who were employed to provide special education and related services for children ages 3 through 5 under IDEA, Part B, were qualified (Exhibit 18).
Students Ages 6 Through 21 Served Under IDEA, Part B
• In 2011, a total of 5,789,884 students ages 6 through 21 were served under IDEA, Part B. Of these students, 5,670,680 were served in the 50 states, the District of Columbia, and BIE schools. This number represented 8.4 percent of the resident population ages 6 through 21. The total number of students ages 6 through 21 served under IDEA, Part B, increased from 5,959,282 in 2002 to 6,118,437 in 2004. In each year after 2004 through 2011, the number of students served was less than in the previous year. From 2002 through 2004, the percentage of the resident population ages 6 through 21 served under IDEA, Part B, increased from 8.9 percent to 9.1 percent. In each year after 2004 through 2011, the percentage of the population served was less than or equal to that served in the previous year. Moreover, the percentage served in each year after 2006 was smaller than the percentage served in 2002 (Exhibit 19).
• In 2002, 8.9 percent of the resident population ages 6 through 21 were served under IDEA, Part B. The percentage of the resident population served under IDEA, Part B, increased gradually in each year from 2002 through 2004, when it peaked at 9.1 percent. Thereafter, the percentage decreased gradually, reaching a low of 8.4 percent in 2010 and 2011. The general pattern of an increase and then a decrease to a level slightly below the percentage served in 2002 was observed for the students ages 6 through 11 and the students ages 12 through 17 but not the students ages 18 through 21. The percentage for the latter group, which is much smaller in size than the other two groups, increased or stayed the same in each successive year from 2002 through 2009, when it peaked at 2 percent of the resident population ages 18 through 21. The percentage has not changed since 2009 (Exhibit 20).
• In 2011, the most prevalent disability category of students ages 6 through 21 served under IDEA, Part B, was specific learning disabilities (40.7 percent). The next most common disability category was speech or language impairments (18.5 percent), followed by other
xxiv

health impairments (12.7 percent), intellectual disabilities (7.4 percent), emotional disturbance (6.4 percent), and autism (7.0 percent) (Exhibit 21).
• Only the percentages of the resident population ages 6 through 21 served under IDEA, Part B, reported under four disability categories changed more than one-fifth of a percentage point between 2002 and 2011. The percentages of the population ages 6 through 21 served under IDEA, Part B, reported under other health impairments and under autism increased by 0.5 of a percentage point and 0.4 of a percentage point, respectively. In addition, the percentages of the population reported under specific learning disabilities and under intellectual disabilities decreased by 0.5 of a percentage point and 0.3 of a percentage point, respectively (Exhibit 22).
• Between 2002 and 2011, the percentage of the resident population ages 6 through 21 served under IDEA, Part B, that was reported under the category of autism increased steadily from 0.2 percent to 0.6 percent. Between 2002 and 2011, the percentages of the populations ages 6 through 11, 12 through 17, and 18 through 21 served under IDEA, Part B, that were reported under the category of autism all increased. Specifically, the percentages of these three age groups that were reported under the category of autism were 188 percent, 330 percent, and 321 percent larger, respectively, in 2011 than in 2002 (Exhibit 23).
• From 2002 through 2011, the percentage of the resident population ages 6 through 21 served under IDEA, Part B, that was reported under the category of other health impairments increased from 0.6 percent to 1 percent. The percentages of the populations ages 6 through 11, 12 through 17, and 18 through 21 served under IDEA, Part B, that were reported under the category of other health impairments were 63 percent, 97 percent, and 161 percent larger in 2011 than in 2002, respectively (Exhibit 24).
• From 2002 through 2011, the percentage of the resident population ages 6 through 21 served under IDEA, Part B, that was reported under the category of specific learning disabilities decreased from 4.3 percent to 3.4 percent. The percentages of the populations ages 6 through 11, 12 through 17, and 18 through 21 served under IDEA, Part B, that were reported under the category of specific learning disabilities were 23 percent, 19 percent, and 1 percent smaller in 2011 than in 2002, respectively (Exhibit 25).
• In 2011, American Indian or Alaska Native, Black or African American, and Native Hawaiian or Pacific Islander children had risk ratios above 1.0 (i.e., 1.6, 1.4, and 1.6, respectively). This indicates that the children in each group were more likely to be served under Part B than were the children ages 6 through 21 in all other racial/ethnic groups combined. Asian, Hispanic/Latino, and White children as well as children associated with more than one race, with risk ratios of less than 1.0 (i.e., 0.5, 0.9, 0.9, and 0.7, respectively), were less likely to be served under Part B than were the children ages 6 through 21 in all other racial/ethnic groups combined (Exhibit 26).
• For the students ages 6 through 21served under IDEA, Part B, in 2011, specific learning disabilities was the most prevalent disability category for every racial/ethnic group except Asian. In particular, this disability category accounted for 46.2 percent of American Indian or Alaska Native students, 27.3 percent of Asian students, 42.4 percent of Black or African American students, 49.7 percent of Hispanic/Latino students, 49.8 percent of Native Hawaiian or Other Pacific Islander students, 36.8 percent of White students, and 36.5 percent of the children reported as of two or more races (Exhibit 27).
xxv
• In 2011, a total of 94.9 percent of students ages 6 through 21 served under IDEA, Part B, were educated in regular classrooms for at least some portion of the school day. More than 60 percent of students ages 6 through 21 served under IDEA, Part B, (61.1 percent), were educated inside the regular class 80% or more of the day. A total of 19.8 percent of students served under IDEA, Part B, were educated inside the regular class no more than 79% of the day and no less than 40% of the day, and 14 percent were educated inside the regular class less than 40% of the day. Only 5.1 percent were educated outside of the regular classroom in “Other environments” (Exhibit 28).
• From 2002 through 2011, the percentage of students ages 6 through 21 served under IDEA, Part B, educated inside the regular class 80% or more of the day increased from 48.2 percent to 61.1 percent. The percentage of students ages 6 through 21 served under IDEA, Part B, educated inside the regular class no more than 79% of the day and no less than 40% of the day decreased from 28.7 percent in 2002 to 19.8 percent in 2011. Similarly, the percentage of students educated inside the regular class less than 40% of the day decreased from 19 percent to 14 percent between these years. The percentage of students ages 6 through 21 served under IDEA, Part B, educated in “Other environments” increased from 4 percent in 2002 to 5.1 percent in 2011. However, during that time period, it had accounted for as much as 5.3 percent in 2007 and 2009 (Exhibit 29).
• In 2011, the percentage of students ages 6 through 21 served under IDEA, Part B, in each educational environment varied by disability category. Nearly 9 in 10 students reported under the category of speech or language impairments (86.9 percent) were educated inside the regular class 80% or more of the day. Only 17 percent of students reported under the category of intellectual disabilities and 13 percent of students reported under the category of multiple disabilities were educated inside the regular class 80% or more of the day. Almost one-half of students reported under the category of intellectual disabilities (48.8 percent) and students reported under the category of multiple disabilities (46.2 percent) were educated inside the regular class less than 40% of the day. In 2011, larger percentages of students reported under the categories of deaf-blindness (29.9 percent) and multiple disabilities (24.4 percent) than under other disability categories were educated in “Other environments” (Exhibit 30).
• In 2011, for each racial/ethnic group, the largest percentage of students ages 6 through 21 served under IDEA, Part B, was educated inside the regular class 80% or more of the day. The students who were educated inside the regular class 80% or more of the day accounted for at least 50 percent of the students in each of the racial/ethnic groups except for the Native Hawaiian or Other Pacific Islander group. The percentages of students in the racial/ethnic groups who were educated inside the regular class 80% or more of the day ranged from 45.5 percent to 64.3 percent. The category inside the regular class no more than 79% of the day and no less than 40% of the day accounted for between 16.8 and 31.6 percent of the students within each racial/ethnic group. In contrast, less than 20 percent of each of the racial/ethnic groups, except for Asian (21.0 percent), was educated inside the regular class less than 40% of the day. “Other environments” accounted for less than 6.2 percent of the students within each racial/ethnic group (Exhibit 31).
• In school year 2010–11, between 75.9 and 78.8 percent of students served under IDEA, Part B, in each of grades 4 through 8 and high school participated in a regular assessment based on grade-level academic achievement standards in math. In contrast, 81.4 percent of the students in grade 3 participated in a regular assessment in math. Between 75.7 percent and 79.9 percent of students served under IDEA, Part B, in each of grades 4 through 8 and high
xxvi

school participated in a regular assessment based on grade-level academic achievement standards in reading (Exhibit 32).
• No more than 2.41 percent of students served under IDEA, Part B, who were expected to take a math assessment test in each of grades 3 through 8 in school year 2010–11 were classified as nonparticipants. Similarly, no more than 2.12 percent of students served under IDEA, Part B, who were expected to take a reading assessment test in each of grades 3 through 8 in school year 2010–11 were classified as nonparticipants. Larger percentages of the students served under IDEA, Part B, in high school in school year 2010–11 were classified as nonparticipants for both the math assessment (5.70 percent) and the reading assessment (6.08 percent) (Exhibit 33).
• In school year 2010–11, all 50 states, the District of Columbia, Puerto Rico, and the four outlying areas administered a regular assessment based on grade-level academic achievement standards in math to some students served under IDEA, Part B, in each of grades 3 through 8 and high school. The median percentage of students served under IDEA, Part B, in grade 3 who were found to be proficient with these math tests was 47.9 percent. The median percentage of students found to be proficient with these tests was less for each successive grade, reaching a low of 17.9 percent for students in high school. An alternate assessment based on alternate academic achievement standards for math was administered by all 50 states, the District of Columbia, Puerto Rico, and the four outlying areas to some students served under IDEA, Part B, in each of grades 3 through 8 and by 49 states, the District of Columbia, Puerto Rico, and the four outlying areas to some students in high school. The median percentages of students served under IDEA, Part B, found to be proficient with these math tests in each grade ranged from 67.6 percent to 71.9 percent (Exhibit 34).
• In school year 2010–11, all 50 states, the District of Columbia, Puerto Rico, and the four outlying areas administered a regular assessment based on grade-level academic achievement standards in reading to some students served under IDEA, Part B, in each of grades 3 through 8 and high school. The median percentage of students served under IDEA, Part B, in grade 3 who were found to be proficient with these reading tests was 40.3 percent. The median percentage of students found to be proficient with these tests was less or was nearly equal for each successive grade, reaching a low of 27.1 percent for students in high school. An alternate assessment based on alternate academic achievement standards for reading was administered by all 50 states, the District of Columbia, Puerto Rico, and the four outlying areas to some students served under IDEA, Part B, in each of grades 3 through 8 and by 49 states, the District of Columbia, Puerto Rico, and the four outlying areas to some students in high school. The median percentages of students served under IDEA, Part B, found to be proficient with these reading tests in each grade ranged from 67.9 percent to 72.2 percent. (Exhibit 34).
• Of the seven exit reason categories, graduated with a regular high school diploma accounted for the largest percentage of students ages 14 through 21 who exited special education in 2010–11 (39.6 percent), followed by moved, known to be continuing in education (28.1 percent) and dropped out (12.5 percent) (Exhibit 35).
• In 2010–11, a total of 63.6 percent of the students ages 14 through 21 who exited IDEA, Part B, and school graduated with a regular high school diploma; an additional 20.1 percent dropped out. From 2001–02 through 2010–11, the percentage of students who exited special education and school by having graduated with a regular high school diploma increased from 51.4 percent to 63.6 percent. From 2001–02 through 2010–11, the percentage of students who
xxvii
exited special education and school by having dropped out decreased from 37.8 percent to 20.1 percent (Exhibit 36).
• From 2001–02 through 2010–11, the graduation percentage increased for students in all disability categories who exited IDEA, Part B, and school. Double-digit increases were associated with the following five disability categories: autism (10.8 percentage point increase), emotional disturbance (20.1 percentage point increase), other health impairments (10.7 percentage point increase), specific learning disabilities (11.4 percentage point increase), and speech or language impairments (16.6 percentage point increase). In every year from 2001–02 through 2010–11, except 2006–07, the disability category of visual impairments was associated with the largest graduation percentage. In contrast, the students who exited special education and school reported under the category of emotional disturbance had the lowest graduation percentages from 2001–02 through 2003–04, while the students reported under the category of intellectual disabilities had the lowest graduation percentages from 2004–05 through 2010–11 (Exhibit 37).
• From 2001–02 through 2010–11, the dropout percentage decreased for students in all disability categories who exited IDEA, Part B, and school. The decreases were most notable for students reported under the categories of emotional disturbance (-24.3 percentage point decrease) and speech or language impairments (-19.9 percentage point decrease). In every year from 2001–02 through 2010–11, a larger percentage of the students reported under the category of emotional disturbance exited special education and school by dropping out. In fact, in each year, the dropout percentage was no less than 37 percent, which was substantially larger than the dropout percentage for any other disability category (Exhibit 38).
• In 2010, a total of 362,165, or 94.2 percent, of the 389,133 FTE special education teachers who provided special education and related services for students ages 6 through 21 under IDEA, Part B, were highly qualified (Exhibit 39).
• In 2010, a total of 384,444, or 95.7 percent, of the 401,792 FTE special education paraprofessionals who provided special education and related services for students ages 6 through 21 under IDEA, Part B, were qualified (Exhibit 40).
Children and Students Ages 3 Through 21 Served Under IDEA, Part B
• In 2010, a total of 97.9 percent of all FTE personnel who were employed to provide related services for children and students ages 3 through 21 served under IDEA, Part B, were fully certified. Ten of the 11 categories of FTE related services personnel had full certification percentages of 97 percent or more. Interpreters had the smallest full certification percentage (90.2 percent), while nearly all psychologists (99.0 percent) were fully certified (Exhibit 41).
• During school year 2010–11, 8,884 children and students ages 3 through 21 served under IDEA, Part B, were removed unilaterally to an interim alternative educational setting by school personnel for offenses involving drugs, weapons, or serious bodily injury. Given that 6,598,891 children and students ages 3 through 21 were served under Part B in 2010, this type of action occurred with only 14 children and students for every 10,000 children and students who were served under Part B in 2010. Only 270 children and students ages 3 through 21 served under IDEA, Part B, or fewer than 5 for every 100,000 children and students served in 2010, were removed to an interim alternative educational setting by a hearing officer for likely injury to themselves or others in school year 2010–11. There were 62,592 children and students ages 3 through 21 served under IDEA, Part B, or 96 for every
xxviii

10,000 children and students served in 2010, who received out-of-school suspensions or expulsions for more than 10 cumulative days in school year 2010–11. There were 24,560 children and students ages 3 through 21 served under IDEA, Part B, or 37 for every 10,000 children and students served in 2010, who received in-school suspensions for more than 10 cumulative days in school year 2010–11 (Exhibit 42).
• For every 10,000 children and students ages 3 through 21 served under IDEA, Part B, reported under the category of emotional disturbance in 2010, there were 39 children and students removed unilaterally to an interim alternative educational setting by school personnel for offenses involving drugs, weapons, or serious bodily during school year 2010–11. The ratio for the children and students reported under each of the other disability categories was less than 22 per 10,000 children and students served. Without regard for disability category, for every 10,000 children and students ages 3 through 21 served under IDEA, Part B, in 2010, no more than 3 children and students were removed by a hearing officer for likely injury during school year 2010–11. For every 10,000 children and students ages 3 through 21 served under IDEA, Part B, reported under the category of emotional disturbance in 2010, there were 393 children and students who received out-of-school suspensions or expulsions for more than 10 cumulative days during school year 2010–11. The ratio for the children and students reported under each of the other disability categories was less than 157 per 10,000. For every 10,000 children and students ages 3 through 21 served under IDEA, Part B, reported under the category of emotional disturbance in 2010, there were 123 children and students who received in-school suspensions for more than 10 cumulative days during school year 2010–11. The ratio for the children and students reported under each of the other disability categories was less than 66 per 10,000 (Exhibit 43).
• During 2010–11, a total of 5,035 written, signed complaints were received through the dispute resolution process for children and students ages 3 through 21 served under IDEA, Part B. A report was issued for 3,201 (63.6 percent) of the complaints, while 1,707 (33.9 percent) of the complaints were withdrawn or dismissed. A total of 127 (2.5 percent) of the complaints that were received during the 2010–11 reporting period were pending or unresolved by the end of the period (Exhibit 44).
• A total of 17,380 due process complaints were received during 2010–11 through the dispute resolution process for children and students served under IDEA, Part B. For 12,219 (70.3 percent) of the due process complaints received during the 2010–11 reporting period, a resolution was achieved without a hearing. For 1,997 (11.5 percent) of the due process complaints received, a hearing was conducted, and a written legal decision was issued. For 3,164 (18.2 percent) of the due process complaints received, a resolution was still pending at the end of the reporting period (Exhibit 45)
• During the 2010–11, a total of 8,693 mediation requests were received through the dispute resolution process for children and students served under IDEA, Part B. For 2,784 (32.0 percent) of the mediation requests received, a mediation related to a due process complaint was conducted. For 2,735 (31.5 percent) of the mediation requests received, a mediation that was not related to a due process complaint was conducted. For 725 requests (8.3 percent), a mediation session was still pending as of the end of the 2010–11 reporting period. The remaining 2,449 mediation requests (28.2 percent) were withdrawn or otherwise not to be held by the end of the reporting period (Exhibit 46).
xxix


Data Sources Used in This Report
This 35th Annual Report to Congress, 2013 contains data obtained from the U.S. Department of Education’s (Department’s) Office of Special Education Programs’ (OSEP’s) Data Analysis System (DANS). Other data sources used in this report include the Department’s Institute of Education Sciences, OSEP’s Regional Resource Center Program, and the U.S. Census Bureau. Brief descriptions of all these data sources1 follow below. Further information about each data source can be found at the website referenced at the end of each description. Unless otherwise specified, each URL provided below was last accessed in July 2013.
Data Analysis System
Data Collections
The text and exhibits contained in the 35th Annual Report to Congress, 2013 were developed primarily from data in OSEP’s DANS. DANS is a repository for all of the data mandated by section 618 of the Individuals with Disabilities Education Act (IDEA) to be collected from states. The state data that are in DANS are obtained each year through a set of data collections. Each data collection concerns a distinct domain of information. The data collections considered in this report concern:
• The number of infants and toddlers served under Part C of IDEA and the number of children and students served under Part B of IDEA,
• The settings in which Part C program services and environments in which Part B education services are received,
• The exiting status of infants and toddlers from Part C and the reasons students exit from Part B,
• Part C and Part B legal disputes and their resolution status,
• Participation in and performance on state assessments in math and reading by students served under Part B,
• The personnel employed to provide special education and related services for children and students under Part B, and
• Disciplinary actions for Part B program participants.
1 When a data source referenced in the report is a website, the accompanying access date refers to the time when the data were originally gathered for preparing the exhibits or summaries that appear herein.
1
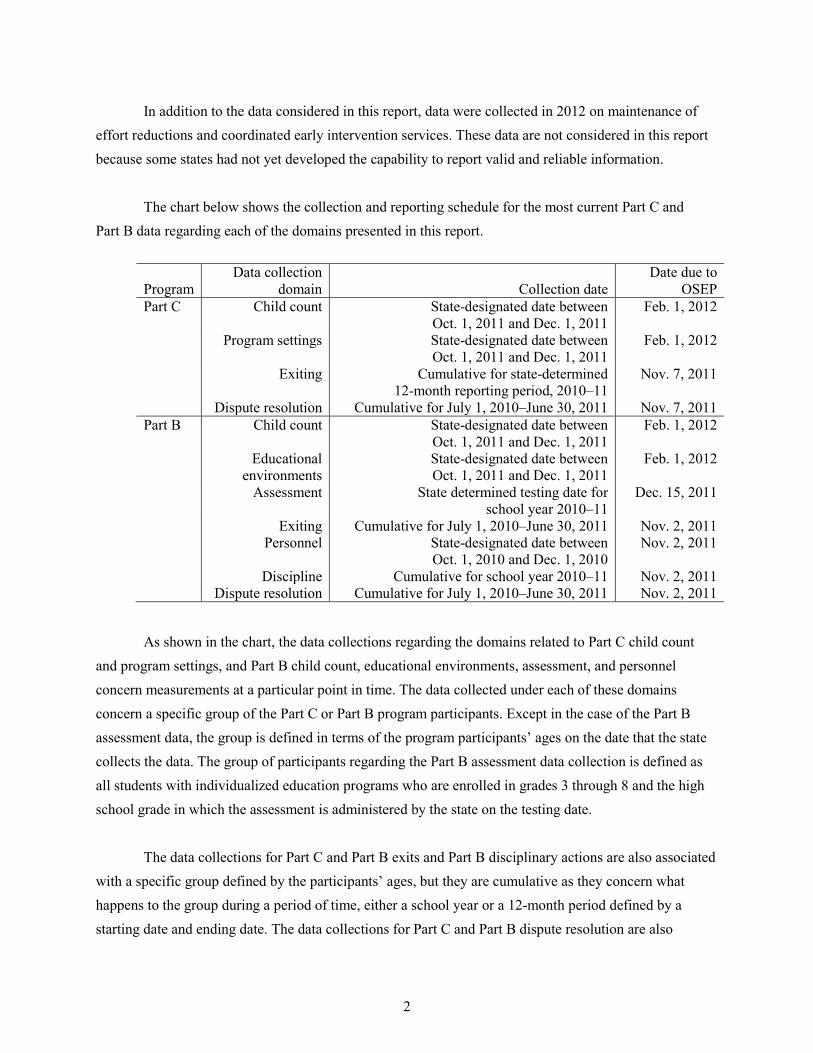
In addition to the data considered in this report, data were collected in 2012 on maintenance of effort reductions and coordinated early intervention services. These data are not considered in this report because some states had not yet developed the capability to report valid and reliable information.
The chart below shows the collection and reporting schedule for the most current Part C and Part B data regarding each of the domains presented in this report.
Program Data collection
domain Collection date Date due to
OSEP Part C Child count State-designated date between
Oct. 1, 2011 and Dec. 1, 2011 Feb. 1, 2012
Program settings State-designated date between Oct. 1, 2011 and Dec. 1, 2011
Feb. 1, 2012
Exiting Cumulative for state-determined 12-month reporting period, 2010–11
Nov. 7, 2011
Dispute resolution Cumulative for July 1, 2010–June 30, 2011 Nov. 7, 2011 Part B Child count State-designated date between
Oct. 1, 2011 and Dec. 1, 2011 Feb. 1, 2012
Educational environments
State-designated date between Oct. 1, 2011 and Dec. 1, 2011
Feb. 1, 2012
Assessment State determined testing date for school year 2010–11
Dec. 15, 2011
Exiting Cumulative for July 1, 2010–June 30, 2011 Nov. 2, 2011 Personnel State-designated date between
Oct. 1, 2010 and Dec. 1, 2010 Nov. 2, 2011
Discipline Cumulative for school year 2010–11 Nov. 2, 2011 Dispute resolution Cumulative for July 1, 2010–June 30, 2011 Nov. 2, 2011
As shown in the chart, the data collections regarding the domains related to Part C child count and program settings, and Part B child count, educational environments, assessment, and personnel concern measurements at a particular point in time. The data collected under each of these domains concern a specific group of the Part C or Part B program participants. Except in the case of the Part B assessment data, the group is defined in terms of the program participants’ ages on the date that the state collects the data. The group of participants regarding the Part B assessment data collection is defined as all students with individualized education programs who are enrolled in grades 3 through 8 and the high school grade in which the assessment is administered by the state on the testing date.
The data collections for Part C and Part B exits and Part B disciplinary actions are also associated with a specific group defined by the participants’ ages, but they are cumulative as they concern what happens to the group during a period of time, either a school year or a 12-month period defined by a starting date and ending date. The data collections for Part C and Part B dispute resolution are also
2

cumulative as they concern any complaint that was made during a 12-month period, defined by a starting date and ending date. The complaints concern all program participants during that time period as opposed to a specific group of participants defined by the participants’ ages or grades.
All Part C and Part B data discussed in this report except dispute resolution and assessment are discussed in terms of the participants’ ages used to identify the group being represented. For example, an exhibit may present data for infants and toddlers birth through age 2, children ages 3 through 5, or students ages 6 through 21. In addition, the titles of exhibits have been worded to indicate the point in time or time period represented by the corresponding data collections. Specifically, the exhibits contain data that were collected by states at a particular point in time (e.g., Part C child count and program settings) have titles that refer to fall of the particular year or span of years considered. Similarly, the exhibits that contain data collected over the course of a school year (e.g., Part B discipline) or during a particular 12-month period (e.g., Part B exiting) have titles that indicate the school year(s) or the 12-month period(s) represented (e.g., 2010–11).
As was the case for the most recent data collections examined in the 34th Annual Report to Congress, 2012, all of the states submitted their most recent data examined in the 35th Annual Report to Congress, 2013 directly into DANS through the Education Data Exchange Network (EDEN), which was developed as part of the Department’s EDFacts initiative to consolidate the collection of kindergarten through grade 12 education program information about states, districts, and schools.
All Part C and Part B data in this report were tabulated from data files maintained in DANS, which is not accessible to the public, rather than from published reports. Consequently, DANS is cited as the source for these data in the notes that accompany the exhibits. Given that these data are based on data collection forms that were approved by the Office of Management and Budget (OMB), the citations also provide the OMB approval number for each of the forms. For more information on IDEA, Part C and Part B data collections, go to http://www.tadnet.org/.
Many of the exhibits in this report present only Part B or Part C data for the most current reporting period considered (i.e., fall 2011; school year 2010–11). However, some exhibits present data for multiple years. The data presented for the most current reporting period were accessed from files prepared as of fall 2012 to take advantage of the fact that OSEP permitted states to update data as necessary after their initial submissions. The data for previous time periods were derived from files that were prepared at different points in time, but in no instance less than one year after the date of the original submission by the state to ensure that the state had a chance to update the data. The use of files with updated data allowed for the possibility that problematic data in the files originally submitted by states
3

that may not have had a notable impact on the statistics for the nation as a whole, but might have incorrectly distinguished a state, were detected and corrected. The source notes for the exhibits in this report indicate the date on which each data file used was accessed and provide the address for the website on which a set of Excel files containing all of the data is available. Along with the actual data records, each Excel file presents the date on which those data were created and, if appropriate, the dates on which the data were revised and updated. This approach ensures that the data presented in the report are available, and the source notes present the necessary information about the data as succinctly as possible. Additional tables and data related to the Part C and Part B data collections are available at http://www.tadnet.org/.
Many of the data categories associated with the domains of information considered in this report, comprise a set of subcategories. Some of these subcategories require detailed descriptors.2 These descriptors are italicized within exhibit titles, text, and notes to clarify that the reference is to an actual subcategory or classification.
Changes in Data Categories and Subcategories
The most current Part C and Part B data examined in this report were collected using the same categories and corresponding subcategories that were used to collect the most current data examined in the 34th Annual Report to Congress, 2012. However, the data regarding educational environments for children ages 3 through 5 participating in Part B were examined for the first time in an annual report using the subcategories that were adopted for the 2010 data collection. The presentation of the educational environmental data in the 34th Annual Report to Congress, 2012, which was derived from the 2010 data collection, was not able to reflect the new classifications because many states were not able to use the new subcategories. The new subcategories used in the 2010 data collection concerned only students who attended a regular early childhood program. The subcategories used for the students who did not attend a regular early childhood program were the same. The four new subcategories for children who attended a regular early childhood program were defined based on the amount of time the children spent in those programs and the location where the majority of special education services were received. Specifically, states were to classify those children into the following four groups:
1. children who attended a regular early childhood program for at least 10 hours per week and received the majority of hours of special education and related services in that program;
2 In regard to the subcategories of data for Part B, please note that Rosa’s Law (P.L. 111-256, enacted on Oct. 5, 2010), amended IDEA and other federal laws to replace the term “mental retardation” with the term “intellectual disabilities.” Therefore, the U.S. Department of Education refers to the disability subcategory “intellectual disabilities” rather than “mental retardation” in this report.
4

2. children who attended a regular early childhood program for at least 10 hours per week but received the majority of hours of special education and related services in some other location;
3. children who attended a regular early childhood program for less than 10 hours per week and received the majority of hours of special education and related services in that program; and
4. children who attended a regular early childhood program for less than 10 hours per week but received the majority of hours of special education and related services in some other location.
Before 2010, the children who attended regular early childhood programs were classified into three categories: (1) in the regular early childhood program at least 80% of the time, (2) in the regular class 40% to 79% of the time, and (3) in the regular early childhood program less than 40% of the time.
In sum, this edition of the ARC is different from previous ARCs in that it is the first to examine the educational environment data with the new subcategories adopted for the 2010 data collection.
Data Notes
States may provide information on the ways in which they collected and reported data differently from the OSEP data formats and instructions, and they may provide explanations of substantial changes or other changes in the data from the previous year. This information is presented in the data notes documents available at http://www.tadnet.org/.
Institute of Education Sciences
The Institute of Education Sciences (IES), established under the Education Sciences Reform Act of 2002, is the research arm of the Department. The work of IES is carried out through its four centers: the National Center for Education Research, the National Center for Education Statistics, the National Center for Education Evaluation and Regional Assistance, and the National Center for Special Education Research. IES sponsors research nationwide to expand knowledge of what works for students from preschool through postsecondary education, including interventions for special education students and young children and their families receiving early intervention services. It collects and analyzes statistics on the condition of education, conducts long-term longitudinal studies and surveys, supports international assessments, and carries out the National Assessment of Educational Progress.
IES data in this report were obtained from IES published reports and an IES database on funded research grants. More information about IES is available at http://ies.ed.gov.
5

Regional Resource Center Program
The Regional Resource Center Program (RRCP) is composed of six regional program centers that are funded by OSEP to assist state education agencies in the systemic improvement of education programs, practices, and policies that affect children and youths with disabilities. Services offered by the RRCP include consultation, information services, specially designed technical assistance, training, and product development. In particular, to assist states with the preparation and timely completion of the State Performance Plan (SPP) and Annual Performance Report (APR) that OSEP requires to determine state progress in meeting specific IDEA requirements, the RRCP disseminates OSEP guidance and provides technical assistance related to SPP/APR indicators and determinations via an OSEP-funded IDEA technical assistance and guidance website (http://therightidea.tadnet.org).
In this report, data from summaries of state determinations and data from SPP/APR indicator analyses were obtained from the website referenced above. Additional information about RRCP is available at http://www.rrcprogram.org.
U.S. Census Bureau
Each year, the Population Estimates Program of the U.S. Census Bureau publishes estimates of the resident population for each state and county. These estimates exclude: (1) residents of outlying areas, such as American Samoa, Guam, the Northern Mariana Islands, and the Virgin Islands; (2) members of the Armed Forces on active duty stationed outside the United States; (3) military dependents living abroad; and (4) other U.S. citizens living abroad. The population estimates are produced by age, sex, race, and Hispanic origin. The state population estimates are solely the sum of the county population estimates. The reference date for county estimates is July 1.
Estimates are used as follows: (1) in determining federal funding allocations, (2) in calculating percentages for vital rates and per capita time series, (3) as survey controls, and (4) in monitoring recent demographic changes. With each new issue of July 1 estimates, the estimates for prior years are revised back to the last census. Previously published estimates are superseded and archived. See the U.S. Census Bureau’s document Methodology for the United States Resident Population Estimates by Age, Sex, Race, and Hispanic Origin and the State and County Total Resident Population Estimates (Vintage 2011): April 1, 2010 to July 1, 2011, for more information about how population estimates are produced (http://www.census.gov/popest/data/intercensal/index.html).
In this report, annual resident population estimates for the 50 states and the District of Columbia were used to determine the percentages of the resident population served under IDEA, Part C and Part B,
6
and to develop comparisons and conduct data analyses. When available, annual resident population estimates for Puerto Rico were also used.
As the race/ethnicity categories used by the Census Bureau are not the same as those that were used by the Department of Education, the following set of rules was used to allocate the resident population data from the Census into the seven categories of race/ethnicity used by the Department of Education. The populations for all of the Census categories referencing “Hispanic,” regardless of race, were combined and assigned to the category “Hispanic/Latino.” The populations for the Census categories of “White alone not Hispanic,” “Black alone not Hispanic,” “American Indian or Alaska Native alone not Hispanic,” “Asian alone not Hispanic,” “Native Hawaiian and Other Pacific Islander alone not Hispanic,” and “Two or more races, not Hispanic” were assigned to the categories “White,” “Black or African American,” “American Indian or Alaska Native,” “Asian,” “Native Hawaiian or Other Pacific Islander,” and “Two or more races,” respectively.
Specific population data estimates used in this report are available at http://www.ed.gov/about/reports/annual/osep. More information about the U.S. Census Bureau is available at http://www.census.gov.
7


Section I
Summary and Analysis of IDEA Section 618 Data at the National Level


Infants and Toddlers Served Under IDEA, Part C
The Education of the Handicapped Act Amendments of 1986 established the Early Intervention Program for Infants and Toddlers with Disabilities under Part H (now Part C) of the IDEA. Providing early intervention services to children with disabilities as early as birth through age 2 and their families helps to improve child developmental outcomes that are critical to educational success. Early intervention services are designed to identify and meet children’s needs in five developmental areas: physical development, cognitive development, communication development, social or emotional development, and adaptive development. The early intervention program assists states in developing and implementing a statewide, comprehensive, coordinated, and multidisciplinary interagency system to make early intervention services available for all infants and toddlers with disabilities and their families.
An infant or toddler with a disability is defined as an individual under 3 years of age who needs early intervention services because the individual is experiencing a developmental delay in one or more of the five developmental areas listed above or has a diagnosed physical or mental condition that has a high probability of resulting in developmental delay [see IDEA, section 632(5)(A)]. States have the authority to define the level of developmental delay needed for Part C eligibility [see IDEA, section 635(a)(1)]. States also have the authority to define other Part C eligibility criteria. For example, at a state’s discretion, infants or toddlers with a disability may also include (1) individuals younger than 3 years of age who would be at risk of having substantial developmental delay if they did not receive early intervention services, and (2) children 3 years of age and older with disabilities until such children are eligible to enter kindergarten3 [see IDEA, section 632(5)(B)]. The decisions that states make regarding these options may explain some of the differences found between states with respect to Part C data.
The Part C exhibits that follow present data for the infants and toddlers with disabilities who were served in the 50 states and the District of Columbia (DC). Where indicated in the notes, the exhibits include data from Puerto Rico (PR) and the outlying areas of American Samoa, Guam, the Northern Mariana Islands, and the Virgin Islands that receive Part C funds. Data about infants and toddlers with disabilities that are contacted or identified through tribal entities that receive Part C funds through the
3 Most of the Part C data concern infants and toddlers birth through age 2 as Part C is designed primarily to serve them. Nevertheless, a small number of children age 3 and older do participate in Part C. For example in 2010, 1,513 children age 3 or older participated in Part C.
11

Bureau of Indian Education (BIE)4 schools, for which reporting is required by the U.S. Department of the Interior to the U.S. Department of Education, are not represented in these exhibits.
Numbers and Percentages of Infants and Toddlers Birth Through Age 2 Served Under IDEA, Part C
How many infants and toddlers birth through age 2 received early intervention services, and how has the percentage of infants and toddlers birth through age 2 served under IDEA, Part C, changed over time?
Exhibit 1. Number of infants and toddlers birth through age 2 served under IDEA, Part C, and percentage of the population served, by year: Fall 2002 through fall 2011
Year
Total served under Part C (birth through age 2)
Resident population birth through age 2 in the 50 states and DC
Percentagea of resident population birth through age 2
served under Part C in the 50 states and
DC
In the 50 states, DC, PR, and the
four outlying areas In the 50 states
and DC 2002 268,735 265,549 11,812,249 2.2 2003 274,747 271,889 11,914,846 2.3 2004 284,536 280,957 11,901,056 2.4 2005 299,048 294,714 11,944,057 2.5 2006 304,510 299,848 12,001,981 2.5 2007 321,925 316,761 12,123,691 2.6 2008 342,985 337,706 12,237,637 2.8 2009 348,604 343,203 12,185,386 2.8 2010 342,821 337,185 11,990,542 2.8 2011 336,895 331,636 11,937,319 2.8 aPercentage was calculated by dividing the number of infants and toddlers birth through age 2 served under IDEA, Part C, in the year by the estimated U.S. resident population birth through age 2 for that year, then multiplying the result by 100. SOURCE: U.S. Department of Education, Office of Special Education Programs, Data Analysis System (DANS), OMB #1820-0557: “Report of Children Receiving Early Intervention Services in Accordance with Part C,” 2002–11. U.S. Department of Commerce, U.S. Census Bureau. “Intercensal Estimates of the Resident Population by Single Year of Age and Sex for States and the United States: April 1, 2000 to July 1, 2011,” 2002–11. Data for 2002 through 2010 were accessed spring 2012. Data for 2011 were accessed fall 2012. For actual data used, go to http://www.ed.gov/about/reports/annual/osep.
• In 2011, there were 336,895 infants and toddlers birth through age 2 served under IDEA, Part C. Of those infants and toddlers, 331,636 were served in the 50 states and the District of Columbia. This number represented 2.8 percent of the birth-through-age-2 population in the 50 states and the District of Columbia.
4 The BIE receives IDEA, Part C, funds under IDEA section 643(b) and reports separately every two years (or biennially) under IDEA section 643(b)(5) on the number of children contacted and served under IDEA, Part C, and reports annually under 34 CFR section 303.731(e)(3) on the amount and dates of each payment distributed to tribal entities and the names of the tribal entities. Beginning with the biennial report submitted after July 1, 2012, under 34 CFR section 303.731(e)(1) and (2), tribal entities must submit to BIE (and BIE provides the Department) as part of its report under IDEA section 643(b)(5) on the number of children contacted and served under IDEA Part C an assurance that the tribal entities have provided child find information to the state lead agency in the state where the children reside to ensure an unduplicated child count.
12

• Between 2002 and 2011, the total number of infants and toddlers served under IDEA, Part C, increased from 268,735 to 336,895. This addition of 68,160 infants and toddlers represented a 25.4 percent increase in the number of infants and toddlers served.
• In the 50 states and the District of Columbia, the percentage of the birth-through-age-2 population served under IDEA, Part C, increased between 2002 and 2011. In 2002, Part C served 2.2 percent of the population of infants and toddlers birth through age 2. By 2011, Part C served 2.8 percent of the population.
How have the percentages of resident populations birth through age 2 served under IDEA, Part C, changed over time?
Exhibit 2. Percentage of the population birth through age 2 served under IDEA, Part C, by year and age group: Fall 2002 through fall 2011
0.0
0.5
1.0
1.5
2.0
2.5
3.0
3.5
4.0
4.5
5.0
2002 2003 2004 2005 2006 2007 2008 2009 2010 2011
Percent
Year
2 years old
Birth through age 2
1 year old
Under 1 year old
NOTE: Percentage was calculated by dividing the number of infants and toddlers in the age group served under IDEA, Part C, in the year by the estimated U.S. resident population in the age group for that year, then multiplying the result by 100. SOURCE: U.S. Department of Education, Office of Special Education Programs, Data Analysis System (DANS), OMB #1820-0557: “Report of Children Receiving Early Intervention Services in Accordance with Part C,” 2002–11. U.S. Department of Commerce, U.S. Census Bureau. “Intercensal Estimates of the Resident Population by Single Year of Age and Sex for States and the United States: April 1, 2000 to July 1, 2011,” 2002–11. These data are for the 50 states and DC. Data for 2002 through 2010 were accessed spring 2012. Data for 2011 were accessed fall 2012. For actual data used, go to http://www.ed.gov/about/reports/annual/osep.
• From 2002 through 2011, the percentage of the resident population of infants and toddlers birth through age 2 served under IDEA, Part C, increased from 2.2 percent to 2.8 percent.
• With two exceptions, the percentage of the resident population of infants and toddlers served under IDEA, Part C, either increased from the previous year or was approximately the same as in the previous year for the three age groups considered. The exceptions were that a
13

smaller percentage of the resident population of infants and toddlers who were under 1 year old were served under Part C in 2010 (1.0 percent) than in 2009 (1.1 percent), and a smaller percentage of the resident population of infants and toddlers who were 1 year old were served under Part C in 2011 (2.6 percent) than in 2010 (2.7 percent).
For infants and toddlers birth through age 2, how did the percentage of the resident population of a particular racial/ethnic group that was served under IDEA, Part C, compare to the percentage served of the resident population of all infants and toddlers in all other racial/ethnic groups combined?
Exhibit 3. Number of infants and toddlers birth through age 2 served under IDEA, Part C, and percentage of the population served (risk index), comparison risk index, and risk ratio for infants and toddlers birth through age 2 served under IDEA, Part C, by race/ethnicity: Fall 2011
Race/ethnicity Child counta in the 50 states
and DC
Resident population
birth through age
2 in the 50 states and DC
Risk indexb
(%)
Risk index for all other racial/ethnic
groups combinedc
(%) Risk
ratiod Total 331,636 11,937,319 2.8 † †
American Indian or Alaska Native 2,719 103,255 2.6 2.8 0.9 Asian 11,245 530,938 2.1 2.8 0.8 Black or African American 46,294 1,645,079 2.8 2.8 1.0 Hispanic/Latino 80,224 3,097,809 2.6 2.8 0.9 Native Hawaiian or Other Pacific
Islander 729 23,322 3.1 2.8 1.1 White 180,306 5,965,900 3.0 2.5 1.2 Two or more races 10,119 571,016 1.8 2.8 0.6 † Not applicable. aChild count is the number of infants and toddlers birth through age 2 served under IDEA, Part C, in the racial/ethnic group(s). bPercentage of the population served may be referred to as the risk index. It was calculated by dividing the number of infants and toddlers birth through age 2 served under IDEA, Part C, in the racial/ethnic group by the estimated U.S. resident population birth through age 2 in the racial/ethnic group, then multiplying the result by 100. cRisk index for all other racial/ethnic groups combined (i.e., children who are not in the racial/ethnic group of interest) was calculated by dividing the number of infants and toddlers birth through age 2 served under IDEA, Part C, in all of the other racial/ethnic groups by the estimated U.S. resident population birth through age 2 in all of the other racial/ethnic groups, then multiplying the result by 100. dRisk ratio compares the proportion of a particular racial/ethnic group served under IDEA, Part C, to the proportion served among the other racial/ethnic groups combined. For example, if racial/ethnic group X has a risk ratio of 2 for receipt of early intervention services, then that group’s likelihood of receiving early intervention services is twice as great as for all of the other racial/ethnic groups combined. Risk ratio was calculated by dividing the risk index for the racial/ethnic group by the risk index for all the other racial/ethnic groups combined. SOURCE: U.S. Department of Education, Office of Special Education Programs, Data Analysis System (DANS), OMB #1820-0557: “Report of Children Receiving Early Intervention Services in Accordance with Part C,” 2011. U.S. Department of Commerce, U.S. Census Bureau. “Intercensal Estimates of the Resident Population by Single Year of Age, Sex, Race and Hispanic Origin for States and the United States: April 1, 2000 to July 1, 2011,” 2011. These data are for the 50 states and DC. Data were accessed fall 2012. For actual data used, go to http://www.ed.gov/about/reports/annual/osep.
• White and Native Hawaiian or Other Pacific Islander infants and toddlers had risk ratios of 1.2 and 1.1, respectively, indicating that infants and toddlers in each of these racial/ethnic groups were slightly more likely than children in all other racial/ethnic groups combined to be served under IDEA, Part C.
14
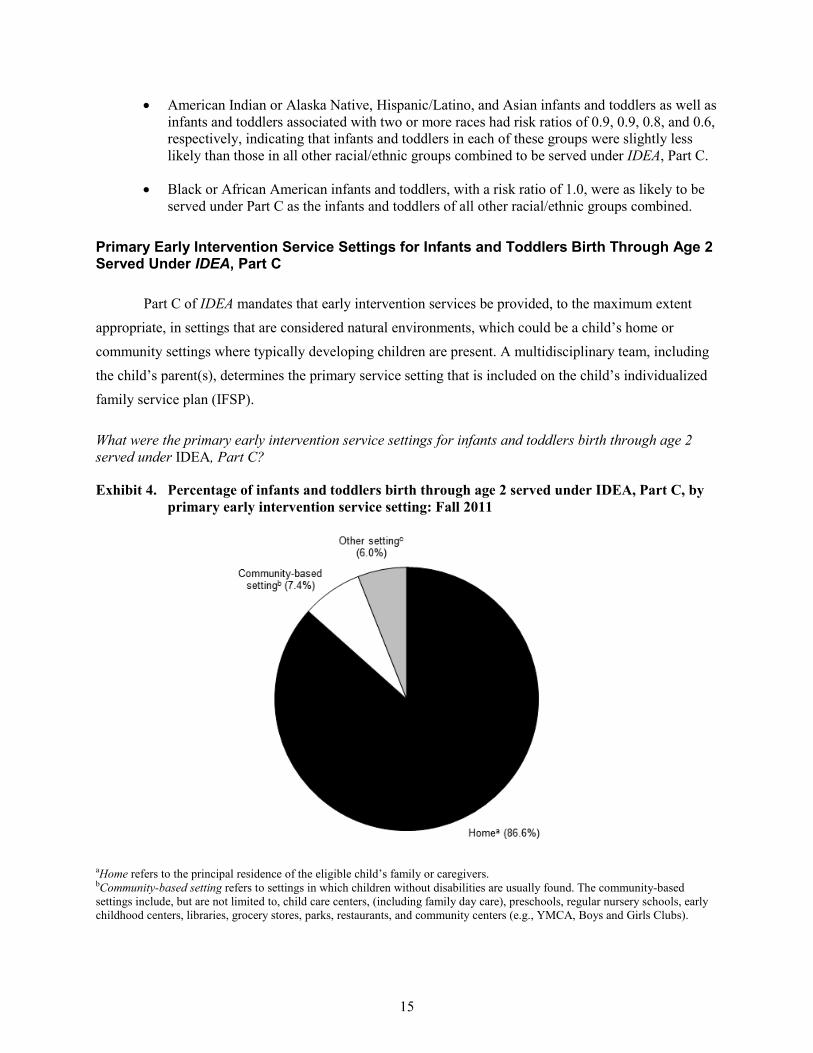
• American Indian or Alaska Native, Hispanic/Latino, and Asian infants and toddlers as well as infants and toddlers associated with two or more races had risk ratios of 0.9, 0.9, 0.8, and 0.6, respectively, indicating that infants and toddlers in each of these groups were slightly less likely than those in all other racial/ethnic groups combined to be served under IDEA, Part C.
• Black or African American infants and toddlers, with a risk ratio of 1.0, were as likely to be served under Part C as the infants and toddlers of all other racial/ethnic groups combined.
Primary Early Intervention Service Settings for Infants and Toddlers Birth Through Age 2 Served Under IDEA, Part C
Part C of IDEA mandates that early intervention services be provided, to the maximum extent appropriate, in settings that are considered natural environments, which could be a child’s home or community settings where typically developing children are present. A multidisciplinary team, including the child’s parent(s), determines the primary service setting that is included on the child’s individualized family service plan (IFSP).
What were the primary early intervention service settings for infants and toddlers birth through age 2 served under IDEA, Part C?
Exhibit 4. Percentage of infants and toddlers birth through age 2 served under IDEA, Part C, by primary early intervention service setting: Fall 2011
aHome refers to the principal residence of the eligible child’s family or caregivers. bCommunity-based setting refers to settings in which children without disabilities are usually found. The community-based settings include, but are not limited to, child care centers, (including family day care), preschools, regular nursery schools, early childhood centers, libraries, grocery stores, parks, restaurants, and community centers (e.g., YMCA, Boys and Girls Clubs).
15
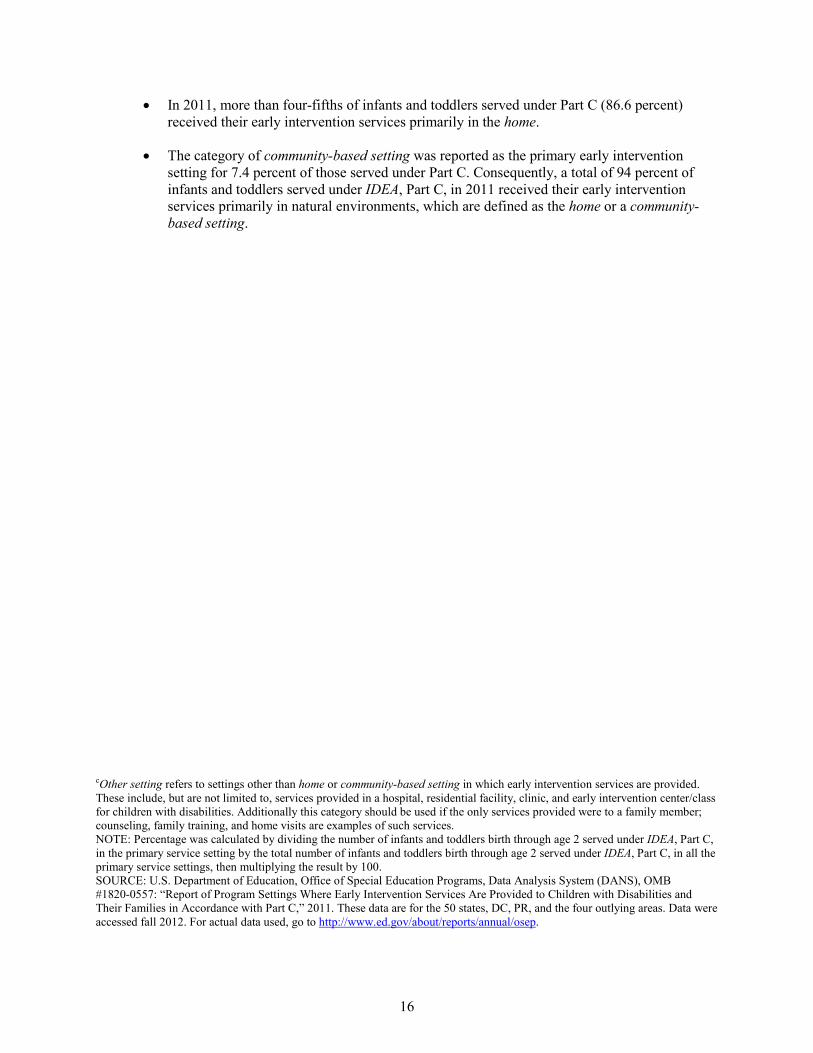
• In 2011, more than four-fifths of infants and toddlers served under Part C (86.6 percent) received their early intervention services primarily in the home.
• The category of community-based setting was reported as the primary early intervention setting for 7.4 percent of those served under Part C. Consequently, a total of 94 percent of infants and toddlers served under IDEA, Part C, in 2011 received their early intervention services primarily in natural environments, which are defined as the home or a community-based setting.
cOther setting refers to settings other than home or community-based setting in which early intervention services are provided. These include, but are not limited to, services provided in a hospital, residential facility, clinic, and early intervention center/class for children with disabilities. Additionally this category should be used if the only services provided were to a family member; counseling, family training, and home visits are examples of such services. NOTE: Percentage was calculated by dividing the number of infants and toddlers birth through age 2 served under IDEA, Part C, in the primary service setting by the total number of infants and toddlers birth through age 2 served under IDEA, Part C, in all the primary service settings, then multiplying the result by 100. SOURCE: U.S. Department of Education, Office of Special Education Programs, Data Analysis System (DANS), OMB #1820-0557: “Report of Program Settings Where Early Intervention Services Are Provided to Children with Disabilities and Their Families in Accordance with Part C,” 2011. These data are for the 50 states, DC, PR, and the four outlying areas. Data were accessed fall 2012. For actual data used, go to http://www.ed.gov/about/reports/annual/osep.
16

How did infants and toddlers birth through age 2 served under IDEA, Part C, within racial/ethnic groups differ by primary early intervention service settings?
Exhibit 5. Percentage of infants and toddlers birth through age 2 served under IDEA, Part C, within racial/ethnic groups, by primary early intervention service setting: Fall 2011
aHome refers to the principal residence of the eligible infant’s or toddler’s family or caregivers. bCommunity-based setting refers to settings in which children without disabilities are usually found. Community-based settings include, but are not limited to, child care centers, (including family day care), preschools, regular nursery schools, early childhood centers, libraries, grocery stores, parks, restaurants, and community centers (e.g., YMCA, Boys and Girls Clubs). cOther setting refers to settings other than home or community-based setting in which early intervention services are provided. These include, but are not limited to, services provided in a hospital, residential facility, clinic, and early intervention center/class for children with disabilities. NOTE: Percentage was calculated by dividing the number of infants and toddlers birth through age 2 served under IDEA, Part C, in the racial/ethnic group and primary service setting by the total number of infants and toddlers birth through age 2 served under IDEA, Part C, in the racial/ethnic group and all the primary service settings, then multiplying the result by 100. The sum of bar percentages may not total 100 because of rounding. SOURCE: U.S. Department of Education, Office of Special Education Programs, Data Analysis System (DANS), OMB #1820-0557: “Report of Program Settings Where Early Intervention Services Are Provided to Children with Disabilities and Their Families in Accordance with Part C,” 2011. These data are for the 50 states, DC, PR, and the four outlying areas. Data were accessed fall 2012. For actual data used, go to http://www.ed.gov/about/reports/annual/osep.
• In 2011, home was the primary early intervention service setting for more than 83 percent of the infants and toddlers birth through age 2 served under IDEA, Part C, in each racial/ethnic group.
17
• The largest percentage of infants and toddlers served under IDEA, Part C, who received early intervention services in a community-based setting was associated with American Indian or Alaska Native children (10.6 percent), while the smallest percentage served in this setting was associated with White children (6.6 percent).
Part C Exiting Status for Children Served Under IDEA, Part C
What were the exiting statuses of infants and toddlers birth through age 2 who exited Part C or reached age 3?
Exhibit 6. Percentage of infants and toddlers birth through age 2 served under IDEA, Part C, by exiting status: 2010−11
aThe Part B eligibility not determined category comprises children who were referred for Part B evaluation at the time they were eligible to exit Part C, but for whom the Part B eligibility determination had not yet been made or reported, and children for whom parents did not consent to transition planning. bThe category of no longer eligible for Part C prior to reaching age 3 was previously labeled completion of IFSP prior to reaching age 3. c“Other exiting categories” includes not eligible for Part B, exit with no referrals (3.9 percent); deceased (0.4 percent); and moved out of state (3.7 percent). NOTE: The U.S. Department of Education collects Part C data on 10 categories of exiting: five categories that speak to Part B eligibility (i.e., Part B eligible, exiting Part C; Part B eligible, continuing in Part C; not eligible for Part B, exit with referrals to other programs; not eligible for Part B, exit with no referrals; and Part B eligibility not determined) and five categories that do not speak to Part B eligibility (i.e., no longer eligible for Part C prior to reaching age 3, deceased, moved out of state, withdrawal by parent [or guardian], and attempts to contact unsuccessful). The 10 categories are mutually exclusive. Part B eligibility status refers to eligibility for Part B preschool services under section 619 (Preschool Grants program) of IDEA. Percentage was calculated by dividing the number of infants and toddlers birth through age 2 served under IDEA, Part C, in the exiting category by the total number of infants and toddlers birth through age 2 served under IDEA, Part C, in all the exiting categories, then multiplying the result by 100. Data are from a cumulative 12-month reporting period, which may have varied from state to state.
18
• Of the Part C exiting statuses in 2010–11, Part B eligible, exiting Part C accounted for the largest percentage of infants and toddlers (38.5 percent). An additional 1.7 percent of the infants and toddlers were found to be eligible for Part B but continued to receive services under Part C.
• No longer eligible for Part C prior to reaching age 3 was the second most prevalent category of exiting status as it accounted for 14.9 percent of the infants and toddlers.
SOURCE: U.S. Department of Education, Office of Special Education Programs, Data Analysis System (DANS), OMB #1820-0557: “Report of Infants and Toddlers Exiting Part C,” 2010–11. These data are for the 50 states, DC, PR, and the four outlying areas. Data were accessed fall 2012. For actual data used, go to http://www.ed.gov/about/reports/annual/osep.
19

What were the Part B eligibility statuses of children served under Part C, when they reached age 3?
Exhibit 7. Percentage of children served under IDEA, Part C, who reached age 3 and were eligible to exit Part C, by Part B eligibility status: 2010–11
aThe Part B eligibility not determined category comprises children who were referred for Part B evaluation at the time they were eligible to exit Part C, but for whom the Part B eligibility determination had not yet been made or reported, and children for whom parents did not consent to transition planning. NOTE: The U.S. Department of Education collects Part C data on 10 categories of exiting: five categories that speak to Part B eligibility (i.e., Part B eligible, exiting Part C; Part B eligible, continuing in Part C; not eligible for Part B, exit with referrals to other programs; not eligible for Part B, exit with no referrals; and Part B eligibility not determined) and five categories that do not speak to Part B eligibility (i.e., no longer eligible for Part C prior to reaching age 3, deceased, moved out of state, withdrawal by parent [or guardian], and attempts to contact unsuccessful). The 10 categories are mutually exclusive. For data on all 10 categories, see exhibit 6. Part B eligibility status refers to eligibility for Part B preschool services under section 619 (Preschool Grants program) of IDEA. Percentage was calculated by dividing the number of children served under IDEA, Part C, who reached age 3 and were in the Part B eligibility status exiting category by the total number of children served under IDEA, Part C, who reached age 3 and were in the five Part B eligibility status exiting categories, then multiplying the result by 100. Data are from a cumulative 12-month reporting period, which may have varied from state to state. SOURCE: U.S. Department of Education, Office of Special Education Programs, Data Analysis System (DANS), OMB #1820-0557: “Report of Infants and Toddlers Exiting Part C,” 2010–11. These data are for the 50 states, DC, PR, and the four outlying areas. Data were accessed fall 2012. For actual data used, go to http://www.ed.gov/about/reports/annual/osep.
• In 2010–11, slightly less than two-thirds (62.3 percent) of children served under IDEA, Part C, who reached age 3 were determined to be Part B eligible, exiting Part C. An additional 2.8 percent of these children were found to be eligible for Part B but continued to receive services under Part C.
• In 2010–11, 17 percent of the children served under IDEA, Part C, who had reached age 3 exited Part C without having their eligibility for Part B determined.
20
• The remaining 17.9 percent of the children served under Part C who had reached age 3 exited Part C and were determined to be not eligible for Part B. The children who were not eligible for Part B included those who exited with referrals to other programs (11.6 percent) and those who exited with no referrals (6.3 percent).
Dispute Resolution for Infants and Toddlers Served Under IDEA, Part C
To protect the interests of children served under IDEA, Part C, and their families, IDEA requires public agencies to implement a formal set of procedural safeguards for children served under IDEA, Part C. Among these procedural safeguards are three formal options for registering and resolving disputes. One of these options is a written, signed complaint. Any individual or organization can file a written, signed complaint alleging a violation of any Part C requirement by a local early intervention service (EIS) provider or the state lead agency. A second option available to parents and public agencies is a due process complaint. By filing a due process complaint, a parent may request a due process hearing5 regarding any matter relating to a proposal or a refusal to initiate or change the identification, evaluation, or placement of their infant or toddler with a disability, or to the provision of early intervention services to such child or the child’s family. Mediation is a third option available through which parents and EIS providers, including public agencies, can try to resolve disputes and reach an agreement about any matter under Part C of IDEA, including matters arising prior to the filing of a due process complaint. The agreements reached through the mediation process are legally binding and enforceable. For more information about these and other procedural safeguards, go to http://www.nectac.org/topics/procsafe/procsafe.asp.
Unlike the other Part C data collections, which are associated with a specific group of Part C participants defined by the participants’ ages, the Part C dispute resolution data collection is associated with all infants and toddlers served under IDEA, Part C. These infants and toddlers may include individuals who are 3 years or older and eligible under Part B but whose parents elect for them to continue receiving Part C services, as states have the authority to define “infants and toddlers” as individuals under 3 years of age and as individuals 3 years of age and older [see IDEA, section 632(5)(B)] and serve them under Part C [see IDEA, section 635(c)] until the children are eligible to enter kindergarten. The Part C legal disputes and resolution data represent all complaints associated with any participant in Part C during the 12 months during which the data were collected.
5 A due process hearing is designed to be a fair, timely, and impartial procedure for resolving disputes that arise from parents and public agencies regarding the identification and evaluation of, or provision of early intervention services to children referred to IDEA, Part C.
21

What were the statuses of the written, signed complaints that alleged a violation of a requirement of Part C of IDEA?
Exhibit 8. Percentage of written, signed complaints for infants and toddlers served under IDEA, Part C, by complaint status: 2010–11
aA complaint with report issued refers to a written decision that was provided by the state lead agency to the complainant regarding alleged violations of a requirement of Part C of IDEA. bA complaint withdrawn or dismissed refers to a written, signed complaint that was withdrawn by the complainant for any reason or that was determined by the state lead agency to be resolved by the complainant and the early intervention service provider or state lead agency through mediation or other dispute resolution means, and no further action by the state lead agency was required to resolve the complaint or a complaint dismissed by the state lead agency for any reason, including that the complaint did not include all of the required content. cA complaint pending is a written, signed complaint that is either still under investigation or the state lead agency’s written decision has not been issued. NOTE: A written, signed complaint is a signed document with specific content requirements that is submitted to a state lead agency by an individual or organization (i.e., complainant) that alleges a violation of a requirement of Part C of IDEA or 34 CFR 303, including cases in which some required content is absent from the document. Percentage was calculated by dividing the number of complaints in the status category by the total number of written, signed complaints, then multiplying the result by 100. Percentage was based on a total of 153 written, signed complaints. Data are from the reporting period between July 1, 2010, and June 30, 2011. SOURCE: U.S. Department of Education, Office of Special Education Programs, Data Analysis System (DANS), OMB #1820-0678: “Report of Dispute Resolution Under Part C of the Individuals with Disabilities Education Act,” 2010–11. These data are for the 50 states, DC, PR, and the four outlying areas. Data were accessed summer 2012. For actual data used, go to http://www.ed.gov/about/reports/annual/osep.
• During 2010–11, a total of 153 written, signed complaints were received through the dispute resolution process for infants and toddlers birth through age 2 served under IDEA, Part C.
• A report was issued for 115 (74.7 percent) of the complaints, while 38 (24.7 percent) of the complaints were withdrawn or dismissed. Only one (0.6 percent) of the complaints that were received during the reporting period was pending or unresolved by the end of the period.
22
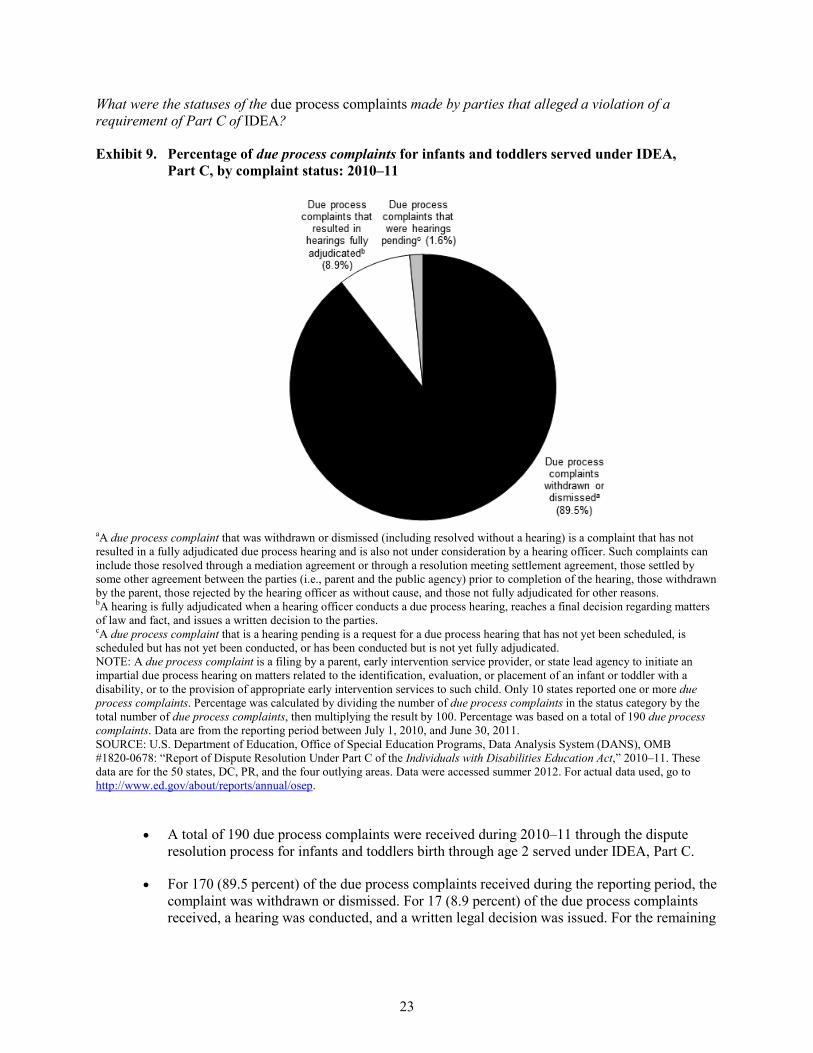
What were the statuses of the due process complaints made by parties that alleged a violation of a requirement of Part C of IDEA?
Exhibit 9. Percentage of due process complaints for infants and toddlers served under IDEA, Part C, by complaint status: 2010–11
aA due process complaint that was withdrawn or dismissed (including resolved without a hearing) is a complaint that has not resulted in a fully adjudicated due process hearing and is also not under consideration by a hearing officer. Such complaints can include those resolved through a mediation agreement or through a resolution meeting settlement agreement, those settled by some other agreement between the parties (i.e., parent and the public agency) prior to completion of the hearing, those withdrawn by the parent, those rejected by the hearing officer as without cause, and those not fully adjudicated for other reasons. bA hearing is fully adjudicated when a hearing officer conducts a due process hearing, reaches a final decision regarding matters of law and fact, and issues a written decision to the parties. cA due process complaint that is a hearing pending is a request for a due process hearing that has not yet been scheduled, is scheduled but has not yet been conducted, or has been conducted but is not yet fully adjudicated. NOTE: A due process complaint is a filing by a parent, early intervention service provider, or state lead agency to initiate an impartial due process hearing on matters related to the identification, evaluation, or placement of an infant or toddler with a disability, or to the provision of appropriate early intervention services to such child. Only 10 states reported one or more due process complaints. Percentage was calculated by dividing the number of due process complaints in the status category by the total number of due process complaints, then multiplying the result by 100. Percentage was based on a total of 190 due process complaints. Data are from the reporting period between July 1, 2010, and June 30, 2011. SOURCE: U.S. Department of Education, Office of Special Education Programs, Data Analysis System (DANS), OMB #1820-0678: “Report of Dispute Resolution Under Part C of the Individuals with Disabilities Education Act,” 2010–11. These data are for the 50 states, DC, PR, and the four outlying areas. Data were accessed summer 2012. For actual data used, go to http://www.ed.gov/about/reports/annual/osep.
• A total of 190 due process complaints were received during 2010–11 through the dispute resolution process for infants and toddlers birth through age 2 served under IDEA, Part C.
• For 170 (89.5 percent) of the due process complaints received during the reporting period, the complaint was withdrawn or dismissed. For 17 (8.9 percent) of the due process complaints received, a hearing was conducted, and a written legal decision was issued. For the remaining
23

three complaints (1.6 percent), a hearing was still pending as of the end of the reporting period.
What were the statuses of the mediation requests made by parties that alleged a violation of a requirement of Part C of IDEA?
Exhibit 10. Percentage of mediation requests for infants and toddlers served under IDEA, Part C, by request status: 2010–11
aA mediation held related to due process complaint is a process that was conducted by a qualified and impartial mediator to resolve a disagreement between parties that was initiated by the filing of a due process complaint or included issues that were the subject of a due process complaint. bA mediation held not related to due process complaint is a process that was conducted by a qualified and impartial mediator to resolve a disagreement between parties to a dispute involving any matter under Part C of IDEA that was not initiated by the filing of a due process complaint or did not include issues that were the subject of a due process complaint. cA mediation that has been withdrawn or not held is a request for mediation that did not result in a mediation being conducted by a qualified and impartial mediator. This includes requests that were withdrawn, requests that were dismissed, requests where one party refused to mediate, and requests that were settled by some agreement other than a mediation agreement between the parties. dA mediation pending is a request for mediation that has not yet been scheduled or is scheduled but has not yet been held. NOTE: A mediation request is a request by a party to a dispute involving any matter under Part C of IDEA for the parties to meet with a qualified and impartial mediator to resolve the dispute(s). Only 11 states and VI reported one or more mediation requests. Percentage was calculated by dividing the number of mediation requests in the status category by the total number of mediation requests, then multiplying the result by 100. Percentage was based on a total of 328 mediation requests. Data are from the reporting period between July 1, 2010, and June 30, 2011. SOURCE: U.S. Department of Education, Office of Special Education Programs, Data Analysis System (DANS), OMB #1820-0678: “Report of Dispute Resolution Under Part C of the Individuals with Disabilities Education Act,” 2010–11. These data are for the 50 states, DC, PR, and the four outlying areas. Data were accessed summer 2012. For actual data used, go to http://www.ed.gov/about/reports/annual/osep.
24

• During 2010–11, a total of 329 mediation requests were received through the dispute resolution process for infants and toddlers birth through age 2 served under IDEA, Part C.
• A mediation was conducted before the end of the reporting period for 177 (53.8 percent) of the mediation requests received. The mediation that was held in 22 of these cases was related to a due process complaint, while the session held in 155 of these cases was not related to a due process complaint. Of the 152 mediation requests received that did not result in a mediation being held by the end of the reporting period, 151 requests had been withdrawn, dismissed, or otherwise ended without a mediation being held. The remaining one request was still pending at the end of the reporting period.
25

Children Ages 3 Through 5 Served Under IDEA, Part B
Under Part B of IDEA, the secretary provides funds to states to assist them in providing a free appropriate public education (FAPE) to children ages 3 through 21 with disabilities who are in need of special education and related services. The Preschool Grants program (IDEA, section 619) supplements funding available for children ages 3 through 5 under the Grants to States program (IDEA, section 611). To be eligible for funding under the Preschool Grants program and the Grants to States program for children ages 3 through 5, a state must make FAPE available to all children ages 3 through 5 with disabilities residing in the state.
IDEA, Part B, has four primary purposes:
• To ensure that all children with disabilities have FAPE available to them and receive special education and related services designed to meet their individual needs,
• To ensure that the rights of children with disabilities and their parents are protected,
• To assist states and localities to provide for the education of all children with disabilities, and
• To assess and ensure the effectiveness of efforts to educate children with disabilities.
The data presented in the Part B exhibits in Section I represent the 50 states, the District of Columbia (DC), and the Bureau of Indian Education (BIE) schools.6 In addition, where indicated in the notes, the exhibits include data from Puerto Rico (PR) and the outlying areas of American Samoa, Guam, the Northern Mariana Islands, and the Virgin Islands.7
6 Although BIE schools do not receive funds under IDEA, Part B, section 619, BIE schools may report 5-year old children who are enrolled in elementary schools for American Indian children operated or funded by BIE and who receive services funded under IDEA, Part B, section 611(h)(1)(A).
7 The four outlying areas do not receive funds under IDEA, Part B, section 619. However, the outlying areas may report children ages 3 through 5 who receive services funded under IDEA, Part B, section 611(b)(1)(A).
26

Numbers and Percentages of Children Ages 3 Through 5 Served Under IDEA, Part B
How have the number and percentage of children ages 3 through 5 served under IDEA, Part B, changed over time?
Exhibit 11. Number of children ages 3 through 5 served under IDEA, Part B, and percentage of the population served, by year: Fall 2002 through fall 2011
Year
Total served under Part B (ages 3 through 5)
Resident population ages 3 through 5 in the
50 statesa and DC
Percentageb of resident population
ages 3 through 5 served under Part B
in the 50 states, DC, and BIE schools
In the 50 states, DC, BIE schools,
PR, and the four outlying areas
In the 50 states, DC, and BIE
schools 2002 647,420 638,700 11,454,130 5.6 2003 680,142 670,750 11,501,168 5.8 2004 701,949 693,245 11,714,436 5.9 2005 704,087 698,938 11,866,471 5.9 2006 714,384 706,635 11,987,484 5.9 2007 709,136 698,931 11,975,329 5.8 2008 709,004 700,296 12,037,364 5.8 2009 731,832 716,569 12,129,397 5.9 2010 735,245 720,740 12,255,590 5.9 2011 745,954 730,558 12,312,888 5.9 aChildren served through BIE schools are included in the population estimates of the individual states in which they reside. bPercentage was calculated by dividing the number of children ages 3 through 5 served under IDEA, Part B, in the year by the estimated U.S. resident population ages 3 through 5 for that year, then multiplying the result by 100. SOURCE: U.S. Department of Education, Office of Special Education Programs, Data Analysis System (DANS), OMB #1820-0043: “Report of Children with Disabilities Receiving Special Education Under Part B of the Individuals with Disabilities Education Act, as Amended,” 2002–11. For 2007 and 2008, data for Vermont were not available. For 2010, data for Wyoming were not available. For 2011, data for BIE schools were not available. U.S. Department of Commerce, U.S. Census Bureau. “Intercensal Estimates of the Resident Population by Single Year of Age and Sex for States and the United States: April 1, 2000 to July 1, 2011,” 2002–11. For 2007 and 2008, data for Vermont were excluded. For 2010, data for Wyoming were excluded. Data for 2002 through 2010 were accessed spring 2012. Data for 2011 were accessed fall 2012. For actual data used, go to http://www.ed.gov/about/reports/annual/osep.
• IDEA, Part B, served 745,954 children ages 3 through 5 in 2011. Of these children, 730,558 were served in the 50 states, the District of Columbia, and BIE schools. This number represented 5.9 percent of the resident population ages 3 through 5.
• Since 2002, the number of children ages 3 through 5 served under IDEA, Part B, increased from 647,420 to 745,954. This addition of 98,534 children represented a 15.2 percent increase in the number of children served.
• Between 2002 and 2004, the percentage of the resident population ages 3 through 5 served under IDEA, Part B, increased from 5.6 percent to 5.9 percent. The percentage remained at 5.9 through 2006 but fell to 5.8 percent in 2007. In 2009, the percentage again reached 5.9 percent, and it remained there through 2011.
27
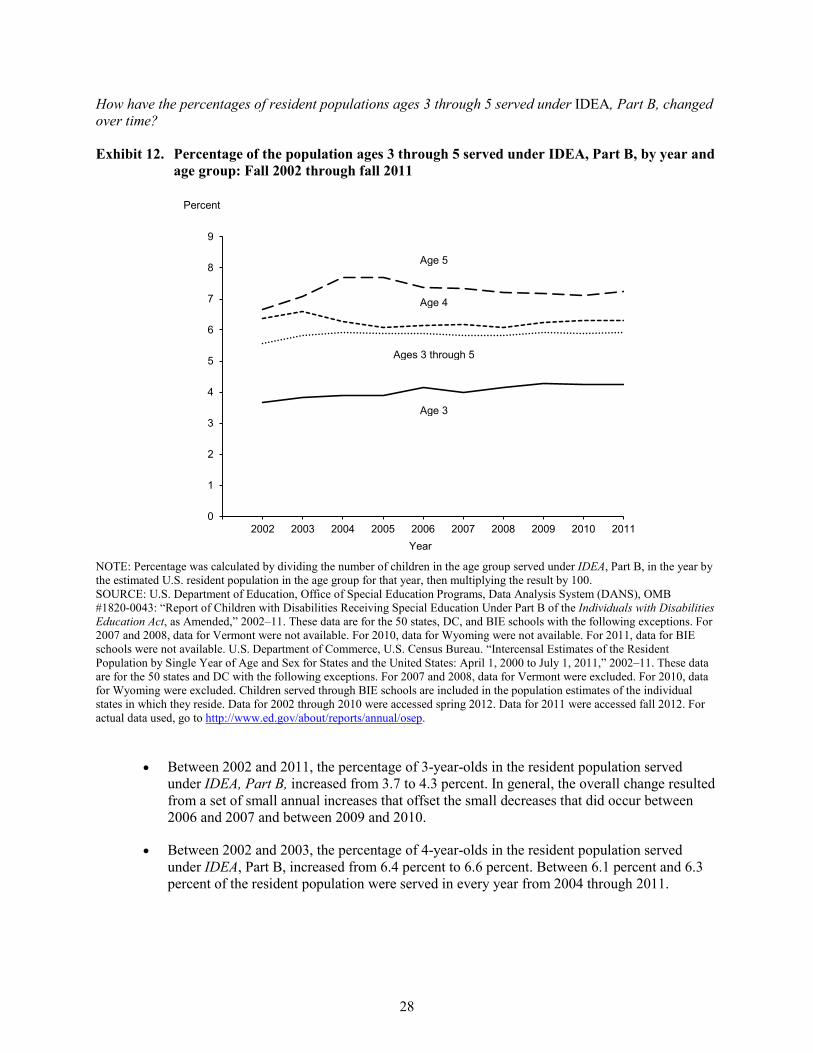
How have the percentages of resident populations ages 3 through 5 served under IDEA, Part B, changed over time?
Exhibit 12. Percentage of the population ages 3 through 5 served under IDEA, Part B, by year and age group: Fall 2002 through fall 2011
0
1
2
3
4
5
6
7
8
9
2002 2003 2004 2005 2006 2007 2008 2009 2010 2011
Percent
Year
Ages 3 through 5
Age 3
Age 4
Age 5
NOTE: Percentage was calculated by dividing the number of children in the age group served under IDEA, Part B, in the year by the estimated U.S. resident population in the age group for that year, then multiplying the result by 100. SOURCE: U.S. Department of Education, Office of Special Education Programs, Data Analysis System (DANS), OMB #1820-0043: “Report of Children with Disabilities Receiving Special Education Under Part B of the Individuals with Disabilities Education Act, as Amended,” 2002–11. These data are for the 50 states, DC, and BIE schools with the following exceptions. For 2007 and 2008, data for Vermont were not available. For 2010, data for Wyoming were not available. For 2011, data for BIE schools were not available. U.S. Department of Commerce, U.S. Census Bureau. “Intercensal Estimates of the Resident Population by Single Year of Age and Sex for States and the United States: April 1, 2000 to July 1, 2011,” 2002–11. These data are for the 50 states and DC with the following exceptions. For 2007 and 2008, data for Vermont were excluded. For 2010, data for Wyoming were excluded. Children served through BIE schools are included in the population estimates of the individual states in which they reside. Data for 2002 through 2010 were accessed spring 2012. Data for 2011 were accessed fall 2012. For actual data used, go to http://www.ed.gov/about/reports/annual/osep.
• Between 2002 and 2011, the percentage of 3-year-olds in the resident population served under IDEA, Part B, increased from 3.7 to 4.3 percent. In general, the overall change resulted from a set of small annual increases that offset the small decreases that did occur between 2006 and 2007 and between 2009 and 2010.
• Between 2002 and 2003, the percentage of 4-year-olds in the resident population served under IDEA, Part B, increased from 6.4 percent to 6.6 percent. Between 6.1 percent and 6.3 percent of the resident population were served in every year from 2004 through 2011.
28

• The percentage of 5-year-olds in the resident population served under IDEA, Part B, increased from 6.7 percent in 2002 to 7.7 percent in 2004. Between 2005 and 2006, the percentage fell to 7.4 percent. The percentage for each year from 2007 through 2011 was either slightly less or approximately equal to that of the previous year.
How did the percentage of children ages 3 through 5 served under IDEA, Part B, vary by disability category?
Exhibit 13. Percentage of children ages 3 through 5 served under IDEA, Part B, by disability category: Fall 2011
aStates’ use of the developmental delay category is optional for children ages 3 through 9 and is not applicable to children older than 9 years of age. For more information on children ages 3 through 5 reported under the category of developmental delay and states with differences in developmental delay reporting practices, see exhibits B-1 and B-3 in Appendix B. b“Other disabilities combined” includes deaf-blindness (less than 0.05 percent), emotional disturbance (0.4 percent), hearing impairments (1.3 percent), intellectual disabilities (1.6 percent), multiple disabilities (1.1 percent), orthopedic impairments (1.0 percent), other health impairments (2.8 percent), specific learning disabilities (1.2 percent), traumatic brain injury (0.1 percent), and visual impairments (0.5 percent). Due to rounding, it may not be possible to reproduce the value presented in the exhibit for this combination from the sum of the percentages associated with these individual categories. NOTE: Percentage was calculated by dividing the number of children ages 3 through 5 served under IDEA, Part B, in the disability category by the total number of children ages 3 through 5 served under IDEA, Part B, then multiplying the result by 100. SOURCE: U.S. Department of Education, Office of Special Education Programs, Data Analysis System (DANS), OMB #1820-0043: “Report of Children with Disabilities Receiving Special Education Under Part B of the Individuals with Disabilities Education Act, as Amended,” 2011. These data are for 50 states, DC, PR, and the four outlying areas. Data were accessed fall 2012. For actual data used, go to http://www.ed.gov/about/reports/annual/osep.
• In 2011, the most prevalent disability category of children ages 3 through 5 served under IDEA, Part B, was speech or language impairments (45.9 percent). The next most common disability category was developmental delay (37.0 percent), followed by autism (6.9 percent).
• Children ages 3 through 5 in “Other disabilities combined” accounted for the remaining 8.3 percent of children served under IDEA, Part B.
29
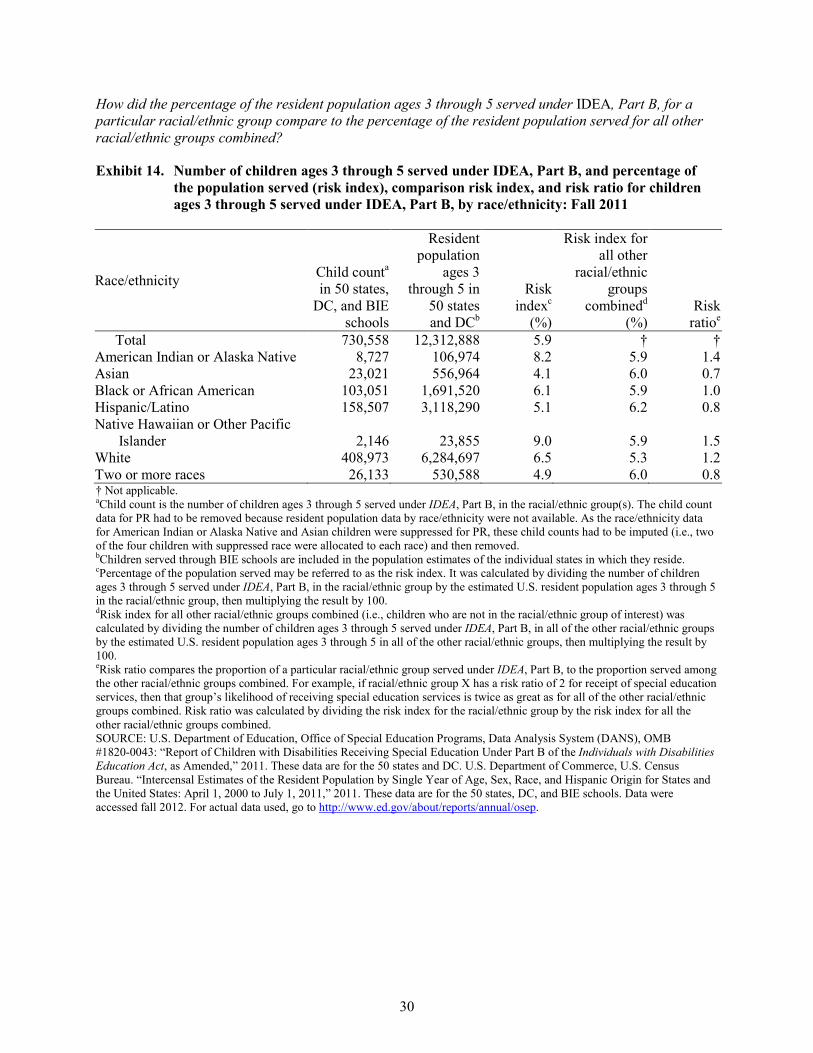
How did the percentage of the resident population ages 3 through 5 served under IDEA, Part B, for a particular racial/ethnic group compare to the percentage of the resident population served for all other racial/ethnic groups combined?
Exhibit 14. Number of children ages 3 through 5 served under IDEA, Part B, and percentage of the population served (risk index), comparison risk index, and risk ratio for children ages 3 through 5 served under IDEA, Part B, by race/ethnicity: Fall 2011
Race/ethnicity Child counta in 50 states,
DC, and BIE schools
Resident population
ages 3 through 5 in
50 states and DCb
Risk indexc
(%)
Risk index for all other
racial/ethnic groups
combinedd
(%) Risk
ratioe Total 730,558 12,312,888 5.9 † †
American Indian or Alaska Native 8,727 106,974 8.2 5.9 1.4 Asian 23,021 556,964 4.1 6.0 0.7 Black or African American 103,051 1,691,520 6.1 5.9 1.0 Hispanic/Latino 158,507 3,118,290 5.1 6.2 0.8 Native Hawaiian or Other Pacific
Islander 2,146 23,855 9.0 5.9 1.5 White 408,973 6,284,697 6.5 5.3 1.2 Two or more races 26,133 530,588 4.9 6.0 0.8 † Not applicable. aChild count is the number of children ages 3 through 5 served under IDEA, Part B, in the racial/ethnic group(s). The child count data for PR had to be removed because resident population data by race/ethnicity were not available. As the race/ethnicity data for American Indian or Alaska Native and Asian children were suppressed for PR, these child counts had to be imputed (i.e., two of the four children with suppressed race were allocated to each race) and then removed. bChildren served through BIE schools are included in the population estimates of the individual states in which they reside. cPercentage of the population served may be referred to as the risk index. It was calculated by dividing the number of children ages 3 through 5 served under IDEA, Part B, in the racial/ethnic group by the estimated U.S. resident population ages 3 through 5 in the racial/ethnic group, then multiplying the result by 100. dRisk index for all other racial/ethnic groups combined (i.e., children who are not in the racial/ethnic group of interest) was calculated by dividing the number of children ages 3 through 5 served under IDEA, Part B, in all of the other racial/ethnic groups by the estimated U.S. resident population ages 3 through 5 in all of the other racial/ethnic groups, then multiplying the result by 100. eRisk ratio compares the proportion of a particular racial/ethnic group served under IDEA, Part B, to the proportion served among the other racial/ethnic groups combined. For example, if racial/ethnic group X has a risk ratio of 2 for receipt of special education services, then that group’s likelihood of receiving special education services is twice as great as for all of the other racial/ethnic groups combined. Risk ratio was calculated by dividing the risk index for the racial/ethnic group by the risk index for all the other racial/ethnic groups combined. SOURCE: U.S. Department of Education, Office of Special Education Programs, Data Analysis System (DANS), OMB #1820-0043: “Report of Children with Disabilities Receiving Special Education Under Part B of the Individuals with Disabilities Education Act, as Amended,” 2011. These data are for the 50 states and DC. U.S. Department of Commerce, U.S. Census Bureau. “Intercensal Estimates of the Resident Population by Single Year of Age, Sex, Race, and Hispanic Origin for States and the United States: April 1, 2000 to July 1, 2011,” 2011. These data are for the 50 states, DC, and BIE schools. Data were accessed fall 2012. For actual data used, go to http://www.ed.gov/about/reports/annual/osep.
30
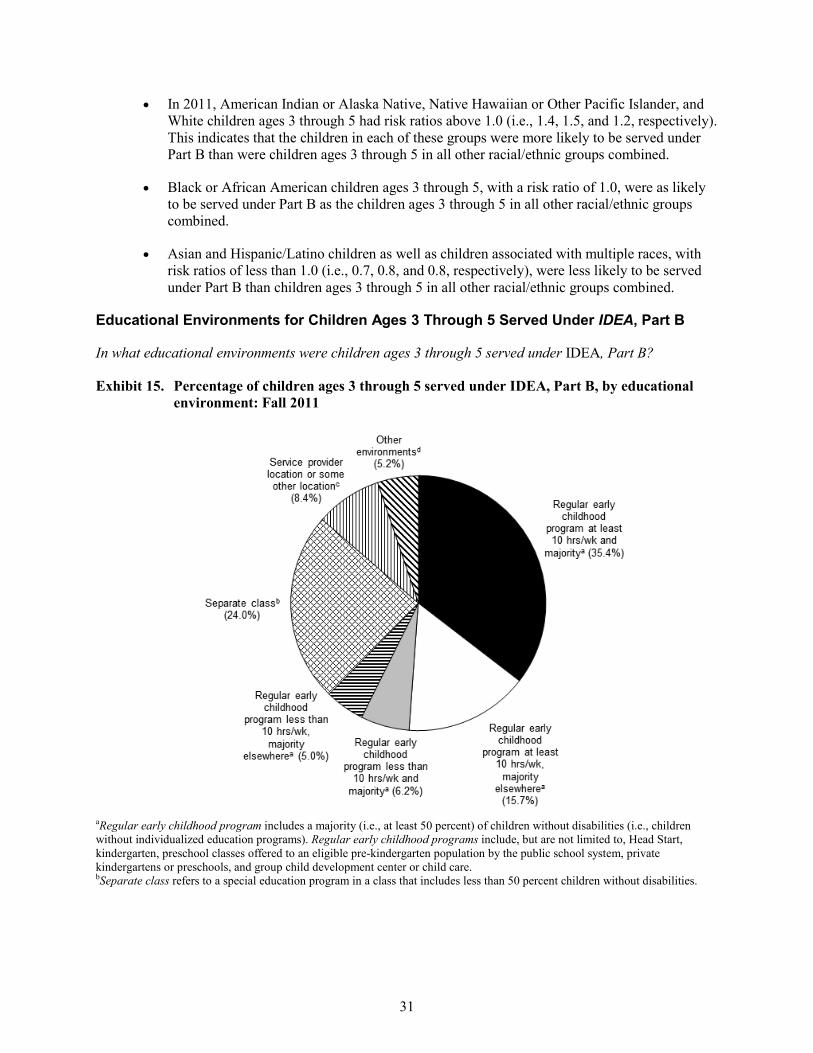
• In 2011, American Indian or Alaska Native, Native Hawaiian or Other Pacific Islander, and White children ages 3 through 5 had risk ratios above 1.0 (i.e., 1.4, 1.5, and 1.2, respectively). This indicates that the children in each of these groups were more likely to be served under Part B than were children ages 3 through 5 in all other racial/ethnic groups combined.
• Black or African American children ages 3 through 5, with a risk ratio of 1.0, were as likely to be served under Part B as the children ages 3 through 5 in all other racial/ethnic groups combined.
• Asian and Hispanic/Latino children as well as children associated with multiple races, with risk ratios of less than 1.0 (i.e., 0.7, 0.8, and 0.8, respectively), were less likely to be served under Part B than children ages 3 through 5 in all other racial/ethnic groups combined.
Educational Environments for Children Ages 3 Through 5 Served Under IDEA, Part B
In what educational environments were children ages 3 through 5 served under IDEA, Part B?
Exhibit 15. Percentage of children ages 3 through 5 served under IDEA, Part B, by educational environment: Fall 2011
aRegular early childhood program includes a majority (i.e., at least 50 percent) of children without disabilities (i.e., children without individualized education programs). Regular early childhood programs include, but are not limited to, Head Start, kindergarten, preschool classes offered to an eligible pre-kindergarten population by the public school system, private kindergartens or preschools, and group child development center or child care. bSeparate class refers to a special education program in a class that includes less than 50 percent children without disabilities.
31

• In 2011, a total of 62.4 percent of children ages 3 through 5 served under IDEA, Part B, were in a regular early childhood program for some amount of their time in school.
• Of the four categories representing children who attended a regular early childhood program, the category representing children who attended a regular early childhood program for at least 10 hours per week and received the majority of hours of special education and related services in that program accounted for the largest percentage of children. Moreover, as this category accounted for 34.5 percent of all children ages 3 through 5 served under IDEA, Part B, it represented more children than any other educational environment category.
• A separate class accounted for almost one-fourth (24 percent) of children ages 3 through 5 served under IDEA, Part B, making it the second-most prevalent educational environment.
• Collectively the environments of separate school, residential facility, and home (which are represented by the category “Other environments”), accounted for only 5.2 percent of the children ages 3 through 5 served under IDEA, Part B.
• The educational environment for the remaining students, representing only 8.4 percent of the children ages 3 through 5 served under IDEA, Part B, was a service provider location or some other location.
cService provider location or some other location not in any other category refers to a situation in which a child receives all special education and related services from a service provider and does not attend a regular early childhood program or special education program in a separate class, separate school, or residential facility. This does not include children who receive special education and related services in the home. An example is a situation in which a child receives only speech instruction, and it is provided in a clinician’s office. d“Other environments” consists of separate school, residential facility, and home. NOTE: Percentage was calculated by dividing the number of children ages 3 through 5 served under IDEA, Part B, in the educational environment by the total number of children ages 3 through 5 served under IDEA, Part B, in all the educational environments, then multiplying the result by 100. The sum may not total 100 percent because of rounding. SOURCE: U.S. Department of Education, Office of Special Education Programs, Data Analysis System (DANS), OMB #1820-0517: “Part B, Individuals with Disabilities Education Act, Implementation of FAPE Requirements,” 2011. These data are for 50 states, DC, PR, and the four outlying areas. Data were not available for BIE schools. Data were accessed fall 2012. For actual data used, go to http://www.ed.gov/about/reports/annual/osep.
32

How did children ages 3 through 5 served under IDEA, Part B, within racial/ethnic groups differ by educational environments?
Exhibit 16. Percentage of children ages 3 through 5 served under IDEA, Part B, within racial/ethnic groups, by educational environment: Fall 2011
aRegular early childhood program includes a majority (i.e., at least 50 percent) of children without disabilities (i.e., children without individualized education programs). Regular early childhood programs include, but are not limited to, Head Start, kindergarten, preschool classes offered to an eligible pre-kindergarten population by the public school system, private kindergartens or preschools, and group child development center or child care. bSeparate class refers to a special education program in a class that includes less than 50 percent children without disabilities. cService provider location or other location refers to a situation in which a child receives all special education and related services from a service provider or in another location not associated with another category and does not attend a regular early childhood program or special education program in a separate class, separate school, or residential facility or receive special education and related services in the home. An example is a situation in which a child receives only speech instruction, and it is provided in a clinician’s office. d“Other environments” consists of separate school, residential facility, and home. NOTE: Percentage was calculated for each racial/ethnic group by dividing the number of children ages 3 through 5 served under IDEA, Part B, in the educational environment by the total number of children ages 3 through 5 served under IDEA, Part B, in all the educational environments, then multiplying the result by 100. The sum of the row percentages may not total 100 because of rounding. SOURCE: U.S. Department of Education, Office of Special Education Programs, Data Analysis System (DANS), OMB #1820-0517: “Part B, Individuals with Disabilities Education Act, Implementation of FAPE Requirements,” 2011. These data are for 50 states, DC, PR, and the four outlying areas. Data were not available for BIE schools. Data were accessed fall 2012. For actual data used, go to http://www.ed.gov/about/reports/annual/osep.
33

• In 2011, a regular early childhood program for some amount of the time spent in school was the educational environment for the majority of children ages 3 through 5 served under IDEA, Part B, in each racial/ethnic group.
• The category representing children who attended a regular early childhood program for at least 10 hours per week and received the majority of hours of special education and related services in that program, accounted for the largest percentage of children who attended a regular early childhood program for every racial/ethnic group. Moreover, for every racial/ethnic group except Asian, this category accounted for a larger percentage of the children than did any other category of educational environment. In particular, this environment accounted for 41.7 percent of American Indian or Alaska Native children, 29.6 percent of Asian children, 37.6 percent of Black or African American children, 36.1 percent of Hispanic/Latino children, 38.1 percent of Native Hawaiian or Pacific Islander children, 34.7 percent of White children, and 36.3 percent of the children reported as two or more races.
• A separate class accounted for 33 percent of Asian children ages 3 through 5 served under IDEA, Part B, making it the most prevalent educational environment for Asians.
Special Education Teachers and Paraprofessionals Employed to Serve Children Ages 3 Through 5 Under IDEA, Part B
To what extent were full-time equivalent teachers who were employed to provide special education and related services for children ages 3 through 5 served under IDEA, Part B, highly qualified?
Exhibit 17. Number of full-time equivalent (FTE) special education teachers and number and percentage of FTE highly qualified special education teachers employed to provide special education and related services for children ages 3 through 5 served under IDEA, Part B: Fall 2010
Year Total number FTE employed
Number FTE highly qualifieda
Percentageb FTE highly qualified
2010 40,481 38,793 95.8 aSpecial education teachers reported as highly qualified met the state standard for highly qualified based on the criteria identified in 20 U.S.C. section 1401(10). For highly qualified special education teachers, the term “highly qualified” has the same meaning given the term in section 9101 of the Elementary and Secondary Education Act of 1965, as amended (ESEA), except that such term also includes the requirements described in section 602(10)(B) of IDEA, and the option for teachers to meet the requirements of section 9101 of ESEA, by meeting the requirements of section 602(10)(C) or (D) of IDEA [20 U.S.C. section 1401(10)]. In states where teachers who work with children ages 3 through 5 were not included in the state’s definition of highly qualified, teachers were considered highly qualified if they were (a) personnel who held appropriate state certification or licensure for the position held or (b) personnel who held positions for which no state certification or licensure requirements existed. bPercentage was calculated by dividing the number of FTE highly qualified special education teachers employed to provide special education and related services for children ages 3 through 5 served under IDEA, Part B, by the total number of FTE special education teachers employed to provide special education and related services for children ages 3 through 5 served under IDEA, Part B, then multiplying the result by 100. SOURCE: U.S. Department of Education, Office of Special Education Programs, Data Analysis System (DANS), OMB #1820-0518: “Personnel (in Full-Time Equivalency of Assignment) Employed to Provide Special Education and Related Services for Children with Disabilities,” 2010. These data are for 49 states, DC, BIE schools, PR, and the four outlying areas. Data for Wyoming were not available. Data were accessed summer 2012. For actual data used, go to http://www.ed.gov/about/reports/annual/osep.
34

• In 2010, a total of 38,793, or 95.8 percent, of the 40,481 full-time equivalent (FTE) special education teachers who were employed to provide special education and related services for children ages 3 through 5 under IDEA, Part B, were highly qualified.
To what extent were full-time equivalent paraprofessionals who were employed to provide special education and related services for children ages 3 through 5 served under IDEA, Part B, qualified?
Exhibit 18. Number of full-time equivalent (FTE) special education paraprofessionals and number and percentage of FTE qualified special education paraprofessionals employed to provide special education and related services for children ages 3 through 5 served under IDEA, Part B: Fall 2010
Year Total number
FTE employed Number
FTE qualifieda Percentageb
FTE qualified 2010 45,807 43,192 94.3 aSpecial education paraprofessionals reported as qualified (a) met the state standard for qualified based on the criteria identified in 20 U.S.C. section 1412(a)(14)(B), or (b) if paraprofessionals were not included in the state’s definition of qualified, either held appropriate state certification or licensure for the position held, or held positions for which no state certification or licensure requirements existed. bPercentage was calculated by dividing the number of FTE qualified special education paraprofessionals employed to provide special education and related services for children ages 3 through 5 served under IDEA, Part B, by the total number of FTE special education paraprofessionals employed to provide special education and related services for children ages 3 through 5 served under IDEA, Part B, then multiplying the result by 100. NOTE: Paraprofessionals are employees who provide instructional support, including those who: (1) provide one-on-one tutoring if such tutoring is scheduled at a time when a student would not otherwise receive instruction from a teacher; (2) assist with classroom management, such as organizing instructional and other materials; (3) provide instructional assistance in a computer laboratory; (4) conduct parental involvement activities; (5) provide support in a library or media center; (6) act as a translator; or (7) provide instructional support services under the direct supervision of a teacher. SOURCE: U.S. Department of Education, Office of Special Education Programs, Data Analysis System (DANS), OMB #1820-0518: “Personnel (in Full-Time Equivalency of Assignment) Employed to Provide Special Education and Related Services for Children with Disabilities,” 2010. These data are for 49 states, DC, BIE schools, PR, and the four outlying areas. Data for Wyoming were not available. Data were accessed summer 2012. For actual data used, go to http://www.ed.gov/about/reports/annual/osep.
• In 2010, a total of 43,192, or 94.3 percent, of the 45,807 FTE special education paraprofessionals who were employed to provide special education and related services for children ages 3 through 5 under IDEA, Part B, were qualified.
35

Students Ages 6 Through 21 Served Under IDEA, Part B
Since the 1975 passage of the Education for All Handicapped Children Act (P.L. 94-142), the U.S. Department of Education has collected data on the number of children served under the law. Early collections of data on the number of children served under Part B of IDEA focused on nine disability categories. Through the subsequent years and multiple reauthorizations of the act, the disability categories have been expanded to 13 and revised, and new data collections have been required.8
In 1997, the law was reauthorized with several major revisions (IDEA Amendments of 1997; P.L. 105-17). One revision was the requirement that race/ethnicity data be collected on the number of children served. The reauthorization also allowed states the option of using the developmental delay category9 for children ages 3 through 9.
The data presented in the Part B exhibits in Section I represent the 50 states, the District of Columbia (DC), and the Bureau of Indian Education (BIE) schools. Where indicated in the notes, the exhibits also include data for Puerto Rico (PR) and the outlying areas of American Samoa, Guam, the Northern Mariana Islands, and the Virgin Islands. In this section, there are occasional references to “special education services.” The term is synonymous with services provided under IDEA, Part B.
8 This section presents some data by disability category. Please note that for two categories—multiple disabilities and other health impairments—a few states used different categories. For details, see Appendix C, exhibit C-1.
9 States’ use of the developmental delay category is optional for children ages 3 through 9 and is not applicable to children older than 9 years of age. For more information on students ages 6 through 9 reported under the category of developmental delay, see Appendix B.
36

Numbers and Percentages of Students Ages 6 Through 21 Served Under IDEA, Part B
How have the number and percentage of students ages 6 through 21 served under IDEA, Part B, changed over time?
Exhibit 19. Number of students ages 6 through 21 served under IDEA, Part B, and percentage of the population served, by year: Fall 2002 through fall 2011
Year
Total served under Part B (ages 6 through 21)
Resident population ages 6 through 21
in the 50 statesa and DC
Percentageb of resident population
ages 6 through 21 served under Part B in the 50 states, DC,
and BIE schools
In the 50 states, DC, BIE schools, PR, and the four
outlying areas
In the 50 states, DC, and BIE
schools 2002 5,959,282 5,893,038 66,248,595 8.9 2003 6,046,051 5,971,495 66,334,233 9.0 2004 6,118,437 6,033,425 66,450,824 9.1 2005 6,109,569 6,021,462 66,586,587 9.0 2006 6,081,890 5,986,644 66,841,838 9.0 2007 5,999,205 5,903,959 66,993,376 8.8 2008 5,889,849 5,789,806 67,243,169 8.6 2009 5,882,157 5,770,718 67,656,650 8.5 2010 5,822,808 5,705,466 67,788,496 8.4 2011 5,789,884 5,670,680 67,783,391 8.4 aStudents served through BIE schools are included in the population estimates of the individual states in which they reside. bPercentage was calculated by dividing the number of students ages 6 through 21 served under IDEA, Part B, in the year by the estimated U.S. resident population ages 6 through 21 for that year, then multiplying the result by 100. SOURCE: U.S. Department of Education, Office of Special Education Programs, Data Analysis System (DANS), OMB #1820-0043: “Report of Children with Disabilities Receiving Special Education Under Part B of the Individuals with Disabilities Education Act, as Amended,” 2002–11. For 2007 and 2008, data for Vermont were not available. For 2010, data for Wyoming were not available. For 2011, data for BIE schools were not available. U.S. Department of Commerce, U.S. Census Bureau. “Intercensal Estimates of the Resident Population by Single Year of Age and Sex for States and the United States: April 1, 2000 to July 1, 2011,” 2002–11. For 2007 and 2008, data for Vermont were excluded. For 2010, data for Wyoming were excluded. Data for 2002 through 2010 were accessed spring 2012. Data for 2011 were accessed fall 2012. For actual data used, go to http://www.ed.gov/about/reports/annual/osep.
• In 2011, a total of 5,789,884 students ages 6 through 21 were served under IDEA, Part B. Of these students, 5,670,680 were served in the 50 states, the District of Columbia, and BIE schools. This number represented 8.4 percent of the resident population ages 6 through 21.
• The total number of students ages 6 through 21 served under IDEA, Part B, increased from 5,959,282 in 2002 to 6,118,437 in 2004. In each year after 2004 through 2011, the number of students served was less than in the previous year.
• From 2002 through 2004, the percentage of the resident population ages 6 through 21 served under IDEA, Part B, increased from 8.9 percent to 9.1 percent. In each year after 2004 through 2011, the percentage of the population served was less than or equal to that served in the previous year. Moreover, the percentage served in each year after 2006 was smaller than the percentage served in 2002.
37

How have the percentages of resident populations ages 6 through 21 served under IDEA, Part B, changed over time?
Exhibit 20. Percentage of the population ages 6 through 21 served under IDEA, Part B, by year and age group: Fall 2002 through fall 2011
0
2
4
6
8
10
12
14
2002 2003 2004 2005 2006 2007 2008 2009 2010 2011
Percent
Year
18 through 21
6 through 21
6 through 11
12 through 17
NOTE: Percentage was calculated by dividing the number of students in the age group served under IDEA, Part B, in the year by the estimated U.S. resident population in the age group for that year, then multiplying the result by 100. SOURCE: U.S. Department of Education, Office of Special Education Programs, Data Analysis System (DANS), OMB #1820-0043: “Report of Children with Disabilities Receiving Special Education Under Part B of the Individuals with Disabilities Education Act, as Amended,” 2002–11. These data are for the 50 states, DC, and BIE schools with the following exceptions. For 2007 and 2008, data for Vermont were not available. For 2010, data for Wyoming were not available. For 2011, data for BIE schools were not available. U.S. Department of Commerce, U.S. Census Bureau. “Intercensal Estimates of the Resident Population by Single Year of Age and Sex for States and the United States: April 1, 2000 to July 1, 2011,” 2002–11. These data are for the 50 states and DC with the following exceptions. For 2007 and 2008, data for Vermont were excluded. For 2010, data for Wyoming were excluded. Students served through BIE schools are included in the population estimates of the individual states in which they reside. Data for 2002 through 2010 were accessed spring 2012. Data for 2011 were accessed fall 2012. For actual data used, go to http://www.ed.gov/about/reports/annual/osep.
• In 2002, 8.9 percent of the resident population ages 6 through 21 was served under IDEA, Part B. The percentage of the resident population served under IDEA, Part B, increased gradually in each year from 2002 through 2004, when it peaked at 9.1 percent. Thereafter, the percentage decreased gradually, reaching a low of 8.4 percent in 2010 and 2011.
• The general pattern of an increase and then a decrease to a level slightly below the percentage served in 2002 was observed for the students ages 6 through 11 and the students ages 12 through 17 but not the students ages 18 through 21. The percentage for the latter group, which accounts for many fewer students than the other two groups, increased or stayed the
38
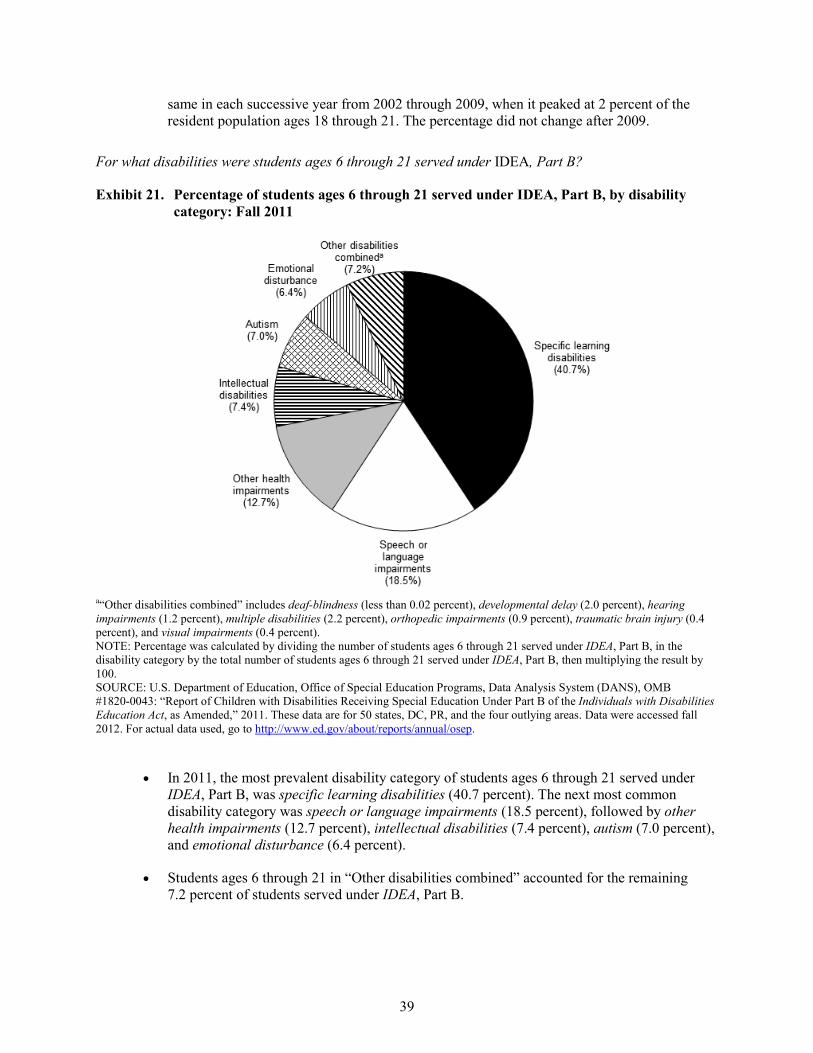
same in each successive year from 2002 through 2009, when it peaked at 2 percent of the resident population ages 18 through 21. The percentage did not change after 2009.
For what disabilities were students ages 6 through 21 served under IDEA, Part B?
Exhibit 21. Percentage of students ages 6 through 21 served under IDEA, Part B, by disability category: Fall 2011
a“Other disabilities combined” includes deaf-blindness (less than 0.02 percent), developmental delay (2.0 percent), hearing impairments (1.2 percent), multiple disabilities (2.2 percent), orthopedic impairments (0.9 percent), traumatic brain injury (0.4 percent), and visual impairments (0.4 percent). NOTE: Percentage was calculated by dividing the number of students ages 6 through 21 served under IDEA, Part B, in the disability category by the total number of students ages 6 through 21 served under IDEA, Part B, then multiplying the result by 100. SOURCE: U.S. Department of Education, Office of Special Education Programs, Data Analysis System (DANS), OMB #1820-0043: “Report of Children with Disabilities Receiving Special Education Under Part B of the Individuals with Disabilities Education Act, as Amended,” 2011. These data are for 50 states, DC, PR, and the four outlying areas. Data were accessed fall 2012. For actual data used, go to http://www.ed.gov/about/reports/annual/osep.
• In 2011, the most prevalent disability category of students ages 6 through 21 served under IDEA, Part B, was specific learning disabilities (40.7 percent). The next most common disability category was speech or language impairments (18.5 percent), followed by other health impairments (12.7 percent), intellectual disabilities (7.4 percent), autism (7.0 percent), and emotional disturbance (6.4 percent).
• Students ages 6 through 21 in “Other disabilities combined” accounted for the remaining 7.2 percent of students served under IDEA, Part B.
39
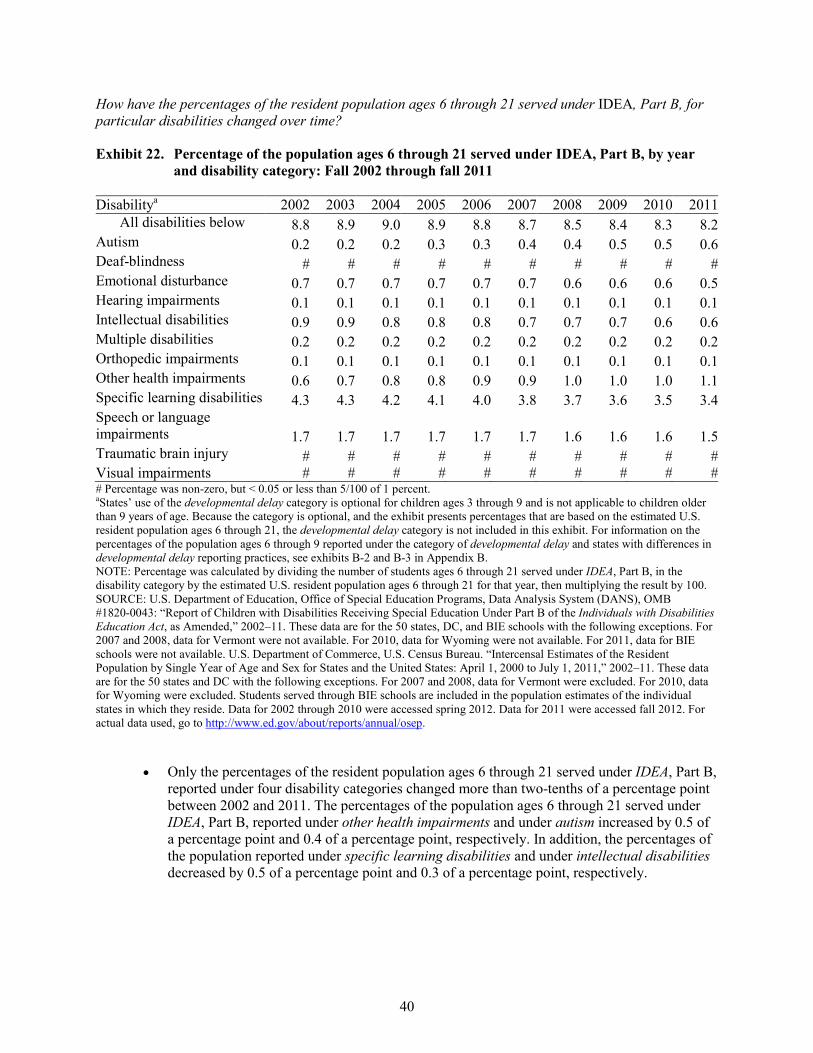
How have the percentages of the resident population ages 6 through 21 served under IDEA, Part B, for particular disabilities changed over time?
Exhibit 22. Percentage of the population ages 6 through 21 served under IDEA, Part B, by year and disability category: Fall 2002 through fall 2011
Disabilitya 2002 2003 2004 2005 2006 2007 2008 2009 2010 2011 All disabilities below 8.8 8.9 9.0 8.9 8.8 8.7 8.5 8.4 8.3 8.2
Autism 0.2 0.2 0.2 0.3 0.3 0.4 0.4 0.5 0.5 0.6 Deaf-blindness # # # # # # # # # # Emotional disturbance 0.7 0.7 0.7 0.7 0.7 0.7 0.6 0.6 0.6 0.5 Hearing impairments 0.1 0.1 0.1 0.1 0.1 0.1 0.1 0.1 0.1 0.1 Intellectual disabilities 0.9 0.9 0.8 0.8 0.8 0.7 0.7 0.7 0.6 0.6 Multiple disabilities 0.2 0.2 0.2 0.2 0.2 0.2 0.2 0.2 0.2 0.2 Orthopedic impairments 0.1 0.1 0.1 0.1 0.1 0.1 0.1 0.1 0.1 0.1 Other health impairments 0.6 0.7 0.8 0.8 0.9 0.9 1.0 1.0 1.0 1.1 Specific learning disabilities 4.3 4.3 4.2 4.1 4.0 3.8 3.7 3.6 3.5 3.4 Speech or language impairments 1.7 1.7 1.7 1.7 1.7 1.7 1.6 1.6 1.6 1.5 Traumatic brain injury # # # # # # # # # # Visual impairments # # # # # # # # # # # Percentage was non-zero, but < 0.05 or less than 5/100 of 1 percent. aStates’ use of the developmental delay category is optional for children ages 3 through 9 and is not applicable to children older than 9 years of age. Because the category is optional, and the exhibit presents percentages that are based on the estimated U.S. resident population ages 6 through 21, the developmental delay category is not included in this exhibit. For information on the percentages of the population ages 6 through 9 reported under the category of developmental delay and states with differences in developmental delay reporting practices, see exhibits B-2 and B-3 in Appendix B. NOTE: Percentage was calculated by dividing the number of students ages 6 through 21 served under IDEA, Part B, in the disability category by the estimated U.S. resident population ages 6 through 21 for that year, then multiplying the result by 100. SOURCE: U.S. Department of Education, Office of Special Education Programs, Data Analysis System (DANS), OMB #1820-0043: “Report of Children with Disabilities Receiving Special Education Under Part B of the Individuals with Disabilities Education Act, as Amended,” 2002–11. These data are for the 50 states, DC, and BIE schools with the following exceptions. For 2007 and 2008, data for Vermont were not available. For 2010, data for Wyoming were not available. For 2011, data for BIE schools were not available. U.S. Department of Commerce, U.S. Census Bureau. “Intercensal Estimates of the Resident Population by Single Year of Age and Sex for States and the United States: April 1, 2000 to July 1, 2011,” 2002–11. These data are for the 50 states and DC with the following exceptions. For 2007 and 2008, data for Vermont were excluded. For 2010, data for Wyoming were excluded. Students served through BIE schools are included in the population estimates of the individual states in which they reside. Data for 2002 through 2010 were accessed spring 2012. Data for 2011 were accessed fall 2012. For actual data used, go to http://www.ed.gov/about/reports/annual/osep.
• Only the percentages of the resident population ages 6 through 21 served under IDEA, Part B, reported under four disability categories changed more than two-tenths of a percentage point between 2002 and 2011. The percentages of the population ages 6 through 21 served under IDEA, Part B, reported under other health impairments and under autism increased by 0.5 of a percentage point and 0.4 of a percentage point, respectively. In addition, the percentages of the population reported under specific learning disabilities and under intellectual disabilities decreased by 0.5 of a percentage point and 0.3 of a percentage point, respectively.
40

How have the percentages of resident populations ages 6 through 21 served under IDEA, Part B, that were reported under the category of autism changed over time?
Exhibit 23. Percentage of the population ages 6 through 21 served under IDEA, Part B, reported under the category of autism, by year and age group: Fall 2002 through fall 2011
0.0
0.1
0.2
0.3
0.4
0.5
0.6
0.7
0.8
0.9
1.0
2002 2003 2004 2005 2006 2007 2008 2009 2010 2011
Percent
Year
18 through 21
12 through 17
6 through 21
6 through 11
NOTE: Percentage was calculated by dividing the number of students in the age group served under IDEA, Part B, reported under the category of autism by the estimated U.S. resident population in the age group for that year, then multiplying the result by 100. This graph is scaled to demonstrate the change in the percentage of the population represented by students reported under the category of autism. The slope cannot be compared with the slopes of exhibits 24 and 25. SOURCE: U.S. Department of Education, Office of Special Education Programs, Data Analysis System (DANS), OMB #1820-0043: “Report of Children with Disabilities Receiving Special Education Under Part B of the Individuals with Disabilities Education Act, as Amended,” 2002–11. These data are for the 50 states, DC, and BIE schools with the following exceptions. For 2007 and 2008, data for Vermont were not available. For 2010, data for Wyoming were not available. For 2011, data for BIE schools were not available. U.S. Department of Commerce, U.S. Census Bureau. “Intercensal Estimates of the Resident Population by Single Year of Age and Sex for States and the United States: April 1, 2000 to July 1, 2011,” 2002–11. These data are for the 50 states and DC with the following exceptions. For 2007 and 2008, data for Vermont were excluded. For 2010, data for Wyoming were excluded. Students served through BIE schools are included in the population estimates of the individual states in which they reside. Data for 2002 through 2010 were accessed spring 2012. Data for 2011 were accessed fall 2012. For actual data used, go to http://www.ed.gov/about/reports/annual/osep.
• Between 2002 and 2011, the percentage of the resident population ages 6 through 21 served under IDEA, Part B, that was reported under the category of autism increased steadily from 0.2 percent to 0.6 percent.
• Between 2002 and 2011, the percentages of the populations ages 6 through 11, 12 through 17, and 18 through 21 served under IDEA, Part B, that were reported under the category of autism all increased. Specifically, the percentages of these three age groups that were reported under the category of autism were 188 percent, 330 percent, and 321 percent larger, respectively, in 2011 than in 2002.
41
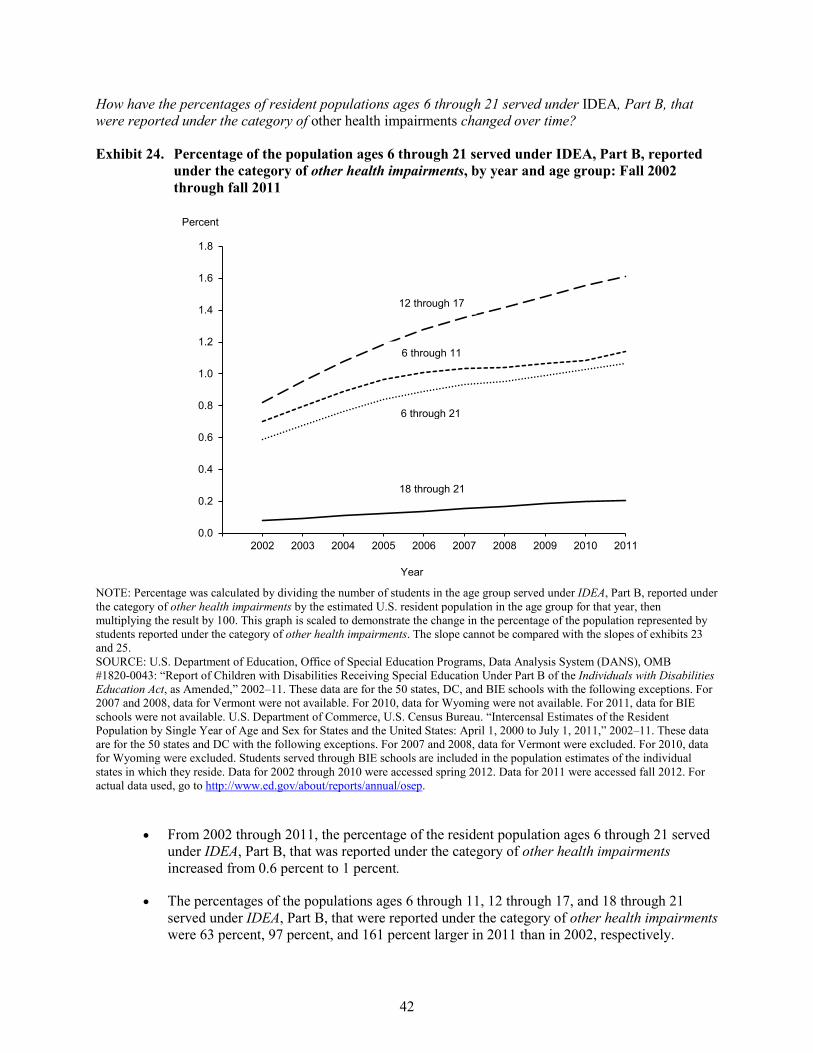
How have the percentages of resident populations ages 6 through 21 served under IDEA, Part B, that were reported under the category of other health impairments changed over time?
Exhibit 24. Percentage of the population ages 6 through 21 served under IDEA, Part B, reported under the category of other health impairments, by year and age group: Fall 2002 through fall 2011
0.0
0.2
0.4
0.6
0.8
1.0
1.2
1.4
1.6
1.8
2002 2003 2004 2005 2006 2007 2008 2009 2010 2011
Percent
Year
18 through 21
6 through 21
6 through 11
12 through 17
NOTE: Percentage was calculated by dividing the number of students in the age group served under IDEA, Part B, reported under the category of other health impairments by the estimated U.S. resident population in the age group for that year, then multiplying the result by 100. This graph is scaled to demonstrate the change in the percentage of the population represented by students reported under the category of other health impairments. The slope cannot be compared with the slopes of exhibits 23 and 25. SOURCE: U.S. Department of Education, Office of Special Education Programs, Data Analysis System (DANS), OMB #1820-0043: “Report of Children with Disabilities Receiving Special Education Under Part B of the Individuals with Disabilities Education Act, as Amended,” 2002–11. These data are for the 50 states, DC, and BIE schools with the following exceptions. For 2007 and 2008, data for Vermont were not available. For 2010, data for Wyoming were not available. For 2011, data for BIE schools were not available. U.S. Department of Commerce, U.S. Census Bureau. “Intercensal Estimates of the Resident Population by Single Year of Age and Sex for States and the United States: April 1, 2000 to July 1, 2011,” 2002–11. These data are for the 50 states and DC with the following exceptions. For 2007 and 2008, data for Vermont were excluded. For 2010, data for Wyoming were excluded. Students served through BIE schools are included in the population estimates of the individual states in which they reside. Data for 2002 through 2010 were accessed spring 2012. Data for 2011 were accessed fall 2012. For actual data used, go to http://www.ed.gov/about/reports/annual/osep.
• From 2002 through 2011, the percentage of the resident population ages 6 through 21 served under IDEA, Part B, that was reported under the category of other health impairments increased from 0.6 percent to 1 percent.
• The percentages of the populations ages 6 through 11, 12 through 17, and 18 through 21 served under IDEA, Part B, that were reported under the category of other health impairments were 63 percent, 97 percent, and 161 percent larger in 2011 than in 2002, respectively.
42

How have the percentages of resident populations ages 6 through 21 served under IDEA, Part B, that were reported under the category of specific learning disabilities changed over time?
Exhibit 25. Percentage of the population ages 6 through 21 served under IDEA, Part B, reported under the category of specific learning disabilities, by year and age group: Fall 2002 through fall 2011
0
1
2
3
4
5
6
7
8
2002 2003 2004 2005 2006 2007 2008 2009 2010 2011
Percent
Year
18 through 21
6 through 11
6 through 21
12 through 17
NOTE: Percentage was calculated by dividing the number of students in the age group served under IDEA, Part B, reported under the category of specific learning disabilities by the estimated U.S. resident population in the age group for that year, then multiplying the result by 100. This graph is scaled to demonstrate the change in the percentage of the population represented by students reported under the category of specific learning disabilities. The slope cannot be compared with the slopes of exhibits 23 and 24. SOURCE: U.S. Department of Education, Office of Special Education Programs, Data Analysis System (DANS), OMB #1820-0043: “Report of Children with Disabilities Receiving Special Education Under Part B of the Individuals with Disabilities Education Act, as Amended,” 2002–11. These data are for the 50 states, DC, and BIE schools with the following exceptions. For 2007 and 2008, data for Vermont were not available. For 2010, data for Wyoming were not available. For 2011, data for BIE schools were not available. U.S. Department of Commerce, U.S. Census Bureau. “Intercensal Estimates of the Resident Population by Single Year of Age and Sex for States and the United States: April 1, 2000 to July 1, 2011,” 2002–11. These data are for the 50 states and DC with the following exceptions. For 2007 and 2008, data for Vermont were excluded. For 2010, data for Wyoming were excluded. Students served through BIE schools are included in the population estimates of the individual states in which they reside. Data for 2002 through 2010 were accessed spring 2012. Data for 2011 were accessed fall 2012. For actual data used, go to http://www.ed.gov/about/reports/annual/osep.
• From 2002 through 2011, the percentage of the resident population ages 6 through 21 served under IDEA, Part B, that was reported under the category of specific learning disabilities decreased from 4.3 percent to 3.4 percent.
• The percentages of the populations ages 6 through 11, 12 through 17, and 18 through 21 served under IDEA, Part B, that were reported under the category of specific learning disabilities were 23 percent, 19 percent, and 1 percent smaller in 2011 than in 2002, respectively.
43
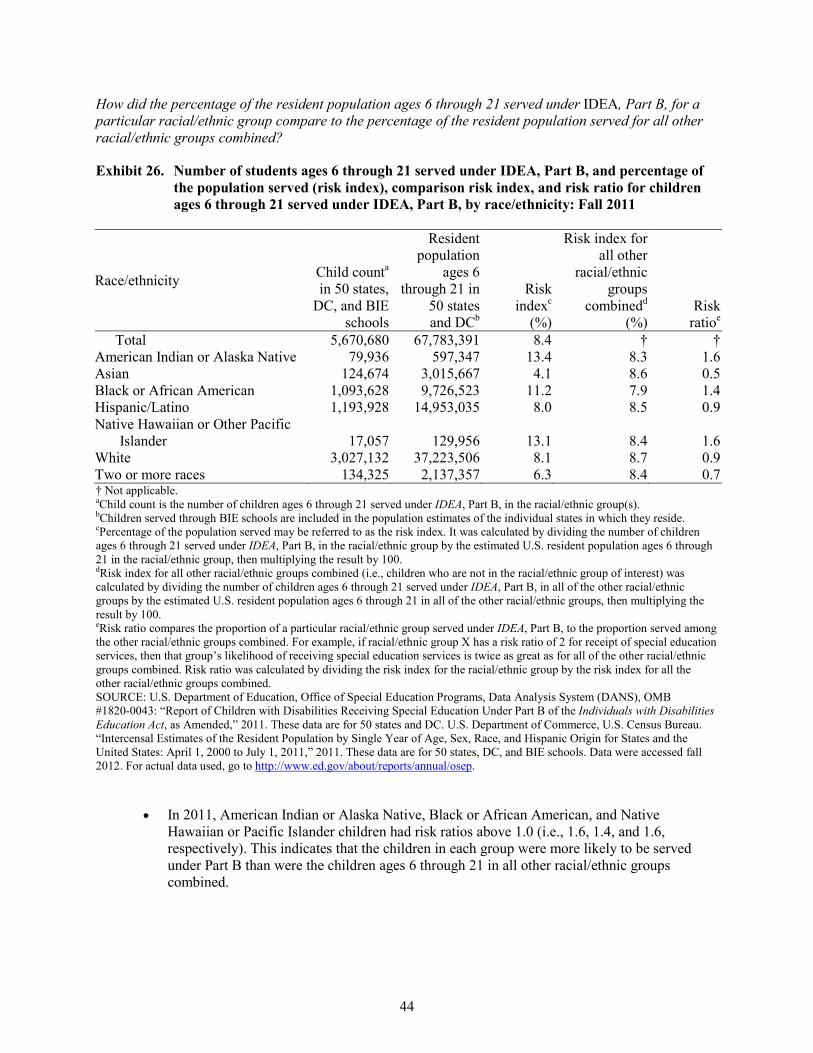
How did the percentage of the resident population ages 6 through 21 served under IDEA, Part B, for a particular racial/ethnic group compare to the percentage of the resident population served for all other racial/ethnic groups combined?
Exhibit 26. Number of students ages 6 through 21 served under IDEA, Part B, and percentage of the population served (risk index), comparison risk index, and risk ratio for children ages 6 through 21 served under IDEA, Part B, by race/ethnicity: Fall 2011
Race/ethnicity Child counta in 50 states,
DC, and BIE schools
Resident population
ages 6 through 21 in
50 states and DCb
Risk indexc
(%)
Risk index for all other
racial/ethnic groups
combinedd
(%) Risk
ratioe Total 5,670,680 67,783,391 8.4 † †
American Indian or Alaska Native 79,936 597,347 13.4 8.3 1.6 Asian 124,674 3,015,667 4.1 8.6 0.5 Black or African American 1,093,628 9,726,523 11.2 7.9 1.4 Hispanic/Latino 1,193,928 14,953,035 8.0 8.5 0.9 Native Hawaiian or Other Pacific
Islander 17,057 129,956 13.1 8.4 1.6 White 3,027,132 37,223,506 8.1 8.7 0.9 Two or more races 134,325 2,137,357 6.3 8.4 0.7 † Not applicable. aChild count is the number of children ages 6 through 21 served under IDEA, Part B, in the racial/ethnic group(s). bChildren served through BIE schools are included in the population estimates of the individual states in which they reside. cPercentage of the population served may be referred to as the risk index. It was calculated by dividing the number of children ages 6 through 21 served under IDEA, Part B, in the racial/ethnic group by the estimated U.S. resident population ages 6 through 21 in the racial/ethnic group, then multiplying the result by 100. dRisk index for all other racial/ethnic groups combined (i.e., children who are not in the racial/ethnic group of interest) was calculated by dividing the number of children ages 6 through 21 served under IDEA, Part B, in all of the other racial/ethnic groups by the estimated U.S. resident population ages 6 through 21 in all of the other racial/ethnic groups, then multiplying the result by 100. eRisk ratio compares the proportion of a particular racial/ethnic group served under IDEA, Part B, to the proportion served among the other racial/ethnic groups combined. For example, if racial/ethnic group X has a risk ratio of 2 for receipt of special education services, then that group’s likelihood of receiving special education services is twice as great as for all of the other racial/ethnic groups combined. Risk ratio was calculated by dividing the risk index for the racial/ethnic group by the risk index for all the other racial/ethnic groups combined. SOURCE: U.S. Department of Education, Office of Special Education Programs, Data Analysis System (DANS), OMB #1820-0043: “Report of Children with Disabilities Receiving Special Education Under Part B of the Individuals with Disabilities Education Act, as Amended,” 2011. These data are for 50 states and DC. U.S. Department of Commerce, U.S. Census Bureau. “Intercensal Estimates of the Resident Population by Single Year of Age, Sex, Race, and Hispanic Origin for States and the United States: April 1, 2000 to July 1, 2011,” 2011. These data are for 50 states, DC, and BIE schools. Data were accessed fall 2012. For actual data used, go to http://www.ed.gov/about/reports/annual/osep.
• In 2011, American Indian or Alaska Native, Black or African American, and Native Hawaiian or Pacific Islander children had risk ratios above 1.0 (i.e., 1.6, 1.4, and 1.6, respectively). This indicates that the children in each group were more likely to be served under Part B than were the children ages 6 through 21 in all other racial/ethnic groups combined.
44
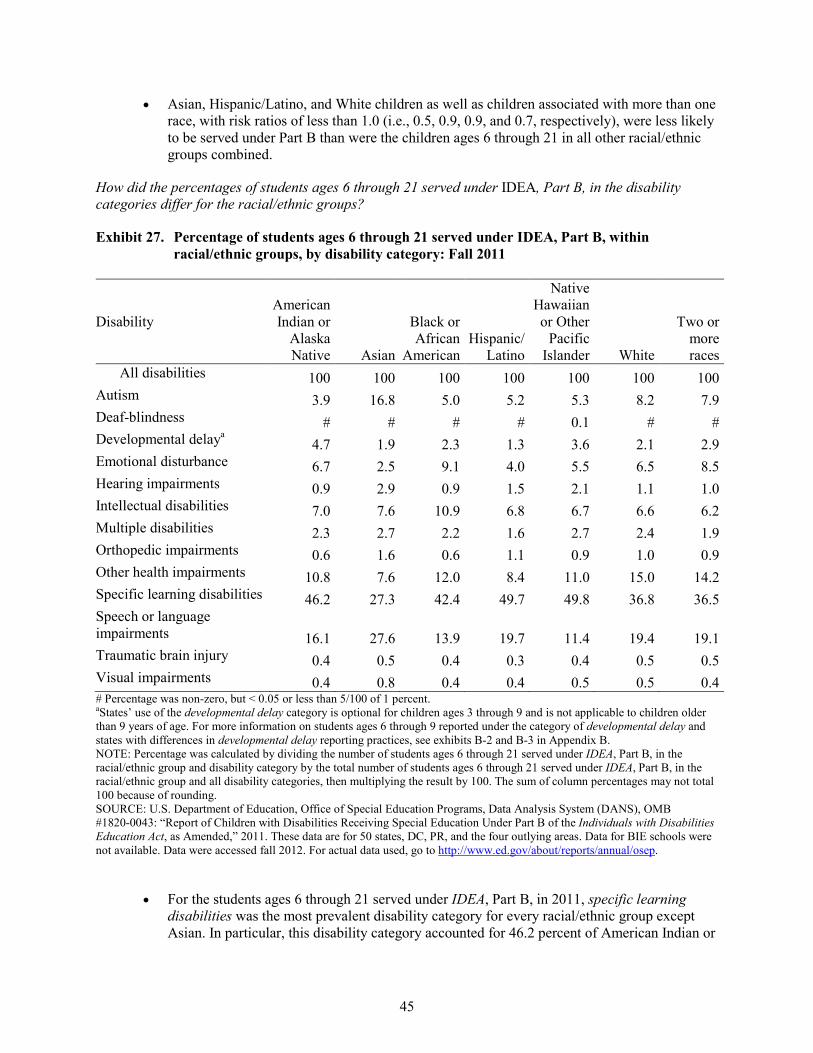
• Asian, Hispanic/Latino, and White children as well as children associated with more than one race, with risk ratios of less than 1.0 (i.e., 0.5, 0.9, 0.9, and 0.7, respectively), were less likely to be served under Part B than were the children ages 6 through 21 in all other racial/ethnic groups combined.
How did the percentages of students ages 6 through 21 served under IDEA, Part B, in the disability categories differ for the racial/ethnic groups?
Exhibit 27. Percentage of students ages 6 through 21 served under IDEA, Part B, within racial/ethnic groups, by disability category: Fall 2011
Disability American Indian or
Alaska Native Asian
Black or African
American Hispanic/
Latino
Native Hawaiian or Other
Pacific Islander White
Two or more races
All disabilities 100 100 100 100 100 100 100 Autism 3.9 16.8 5.0 5.2 5.3 8.2 7.9 Deaf-blindness # # # # 0.1 # # Developmental delaya 4.7 1.9 2.3 1.3 3.6 2.1 2.9 Emotional disturbance 6.7 2.5 9.1 4.0 5.5 6.5 8.5 Hearing impairments 0.9 2.9 0.9 1.5 2.1 1.1 1.0 Intellectual disabilities 7.0 7.6 10.9 6.8 6.7 6.6 6.2 Multiple disabilities 2.3 2.7 2.2 1.6 2.7 2.4 1.9 Orthopedic impairments 0.6 1.6 0.6 1.1 0.9 1.0 0.9 Other health impairments 10.8 7.6 12.0 8.4 11.0 15.0 14.2 Specific learning disabilities 46.2 27.3 42.4 49.7 49.8 36.8 36.5 Speech or language impairments 16.1 27.6 13.9 19.7 11.4 19.4 19.1 Traumatic brain injury 0.4 0.5 0.4 0.3 0.4 0.5 0.5 Visual impairments 0.4 0.8 0.4 0.4 0.5 0.5 0.4 # Percentage was non-zero, but < 0.05 or less than 5/100 of 1 percent. aStates’ use of the developmental delay category is optional for children ages 3 through 9 and is not applicable to children older than 9 years of age. For more information on students ages 6 through 9 reported under the category of developmental delay and states with differences in developmental delay reporting practices, see exhibits B-2 and B-3 in Appendix B. NOTE: Percentage was calculated by dividing the number of students ages 6 through 21 served under IDEA, Part B, in the racial/ethnic group and disability category by the total number of students ages 6 through 21 served under IDEA, Part B, in the racial/ethnic group and all disability categories, then multiplying the result by 100. The sum of column percentages may not total 100 because of rounding. SOURCE: U.S. Department of Education, Office of Special Education Programs, Data Analysis System (DANS), OMB #1820-0043: “Report of Children with Disabilities Receiving Special Education Under Part B of the Individuals with Disabilities Education Act, as Amended,” 2011. These data are for 50 states, DC, PR, and the four outlying areas. Data for BIE schools were not available. Data were accessed fall 2012. For actual data used, go to http://www.ed.gov/about/reports/annual/osep.
• For the students ages 6 through 21 served under IDEA, Part B, in 2011, specific learning disabilities was the most prevalent disability category for every racial/ethnic group except Asian. In particular, this disability category accounted for 46.2 percent of American Indian or
45
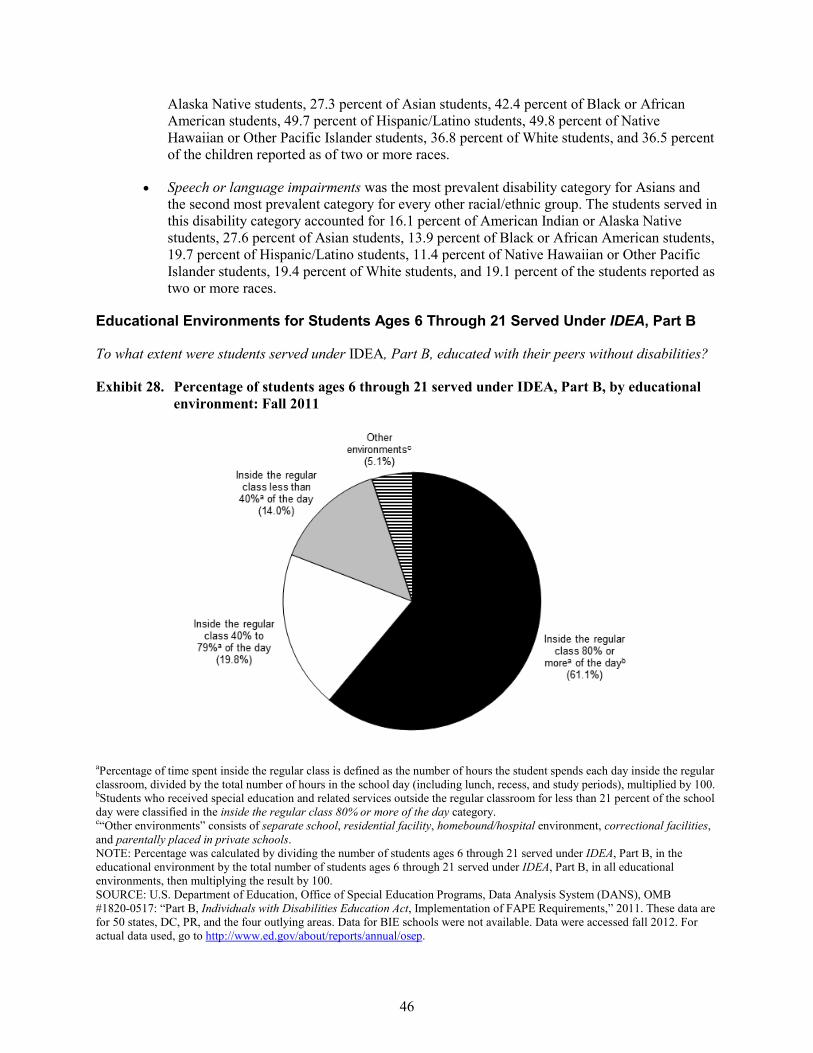
Alaska Native students, 27.3 percent of Asian students, 42.4 percent of Black or African American students, 49.7 percent of Hispanic/Latino students, 49.8 percent of Native Hawaiian or Other Pacific Islander students, 36.8 percent of White students, and 36.5 percent of the children reported as of two or more races.
• Speech or language impairments was the most prevalent disability category for Asians and the second most prevalent category for every other racial/ethnic group. The students served in this disability category accounted for 16.1 percent of American Indian or Alaska Native students, 27.6 percent of Asian students, 13.9 percent of Black or African American students, 19.7 percent of Hispanic/Latino students, 11.4 percent of Native Hawaiian or Other Pacific Islander students, 19.4 percent of White students, and 19.1 percent of the students reported as two or more races.
Educational Environments for Students Ages 6 Through 21 Served Under IDEA, Part B
To what extent were students served under IDEA, Part B, educated with their peers without disabilities?
Exhibit 28. Percentage of students ages 6 through 21 served under IDEA, Part B, by educational environment: Fall 2011
aPercentage of time spent inside the regular class is defined as the number of hours the student spends each day inside the regular classroom, divided by the total number of hours in the school day (including lunch, recess, and study periods), multiplied by 100. bStudents who received special education and related services outside the regular classroom for less than 21 percent of the school day were classified in the inside the regular class 80% or more of the day category. c“Other environments” consists of separate school, residential facility, homebound/hospital environment, correctional facilities, and parentally placed in private schools. NOTE: Percentage was calculated by dividing the number of students ages 6 through 21 served under IDEA, Part B, in the educational environment by the total number of students ages 6 through 21 served under IDEA, Part B, in all educational environments, then multiplying the result by 100. SOURCE: U.S. Department of Education, Office of Special Education Programs, Data Analysis System (DANS), OMB #1820-0517: “Part B, Individuals with Disabilities Education Act, Implementation of FAPE Requirements,” 2011. These data are for 50 states, DC, PR, and the four outlying areas. Data for BIE schools were not available. Data were accessed fall 2012. For actual data used, go to http://www.ed.gov/about/reports/annual/osep.
46

• In 2011, a total of 94.9 percent of students ages 6 through 21 served under IDEA, Part B, were educated in regular classrooms for at least some portion of the school day.
• More than 60 percent of students ages 6 through 21 served under IDEA, Part B, (61.1 percent) were educated inside the regular class 80% or more of the day.
• A total of 19.8 percent of students served under IDEA, Part B, were educated inside the regular class no more than 79% of the day and no less than 40% of the day, and 14 percent were educated inside the regular class less than 40% of the day.
• Only 5.1 percent of students served under IDEA, Part B, were educated outside of the regular classroom in “Other environments.”
How have the educational environments of students served under IDEA, Part B, changed over time?
Exhibit 29. Percentage of students ages 6 through 21 served under IDEA, Part B, by year and educational environment: Fall 2002 through fall 2011
0
10
20
30
40
50
60
70
2002 2003 2004 2005 2006 2007 2008 2009 2010 2011
Percent
Year
Inside the regular class less than 40%a of the day
Inside the regular class 80% or morea of the dayb
Inside the regular class 40% to 79%a of the day
Other environmentsc
aPercentage of time spent inside the regular class is defined as the number of hours the student spends each day inside the regular classroom, divided by the total number of hours in the school day (including lunch, recess, and study periods), multiplied by 100. bStudents who received special education and related services outside the regular classroom for less than 21 percent of the school day were classified in the inside the regular class 80% or more of the day category. c“Other environments” consists of separate school, residential facility, homebound/hospital environment, correctional facilities, and parentally placed in private schools. After the 2005 data collection, other environment categories were slightly redefined so that counts of children served in correctional facilities and counts of children parentally placed in private schools were reported only under the correctional facilities and parentally placed in private schools categories, respectively, as unduplicated counts of children. NOTE: Percentage was calculated by dividing the number of students ages 6 through 21 served under IDEA, Part B, in the educational environment in the year by the total number of students ages 6 through 21 served under IDEA, Part B, in all educational environments for that year, then multiplying the result by 100.
47

• From 2002 through 2011, the percentage of students ages 6 through 21 served under IDEA, Part B, educated inside the regular class 80% or more of the day increased from 48.2 percent to 61.1 percent.
• The percentage of students ages 6 through 21 served under IDEA, Part B, educated inside the regular class no more than 79% of the day and no less than 40% of the day decreased from 28.7 percent in 2002 to 19.8 percent in 2011. Similarly, the percentage of students educated inside the regular class less than 40% of the day decreased from 19 percent to 14 percent between these years.
• The percentage of students ages 6 through 21 served under IDEA, Part B, educated in “Other environments” increased from 4 percent in 2002 to 5.1 percent in 2011. However, during that time period, it had accounted for as much as 5.3 percent in 2007 and 2009.
SOURCE: U.S. Department of Education, Office of Special Education Programs, Data Analysis System (DANS), OMB #1820-0517: “Part B, Individuals with Disabilities Education Act, Implementation of FAPE Requirements,” 2002–11. These data are for the 50 states, DC, BIE schools, PR, and the four outlying areas with the following exceptions. For 2007 and 2008, data for Vermont were not available. For 2010, data for Wyoming were not available. For 2011, data for BIE schools were not available. Data for 2002 through 2010 were accessed spring 2012. Data for 2011 were accessed fall 2012. For actual data used, go to http://www.ed.gov/about/reports/annual/osep.
48

How did educational environments differ by disability category?
Exhibit 30. Percentage of students ages 6 through 21 served under IDEA, Part B, within disability category, by educational environment: Fall 2011
Disability Percentage of time inside the regular classa
80% or more of the dayb
40% to 79% of the day
Less than 40% of the day
Other environmentsc
All disabilities 61.1 19.8 14.0 5.1 Autism 39.0 18.2 33.7 9.1 Deaf-blindness 27.0 10.5 32.6 29.9 Developmental delayd 62.5 19.5 16.3 1.7 Emotional disturbance 43.1 18.0 20.6 18.2 Hearing impairments 56.7 16.8 13.0 13.5 Intellectual disabilities 17.0 26.6 48.8 7.6 Multiple disabilities 13.0 16.4 46.2 24.4 Orthopedic impairments 54.0 16.3 22.2 7.4 Other health impairments 63.5 22.7 10.0 3.9 Specific learning disabilities 66.2 25.1 6.8 1.8 Speech or language impairments 86.9 5.5 4.5 3.1 Traumatic brain injury 48.5 22.8 20.4 8.3 Visual impairments 64.3 13.1 11.3 11.4 aPercentage of time spent inside the regular class is defined as the number of hours the student spends each day inside the regular classroom, divided by the total number of hours in the school day (including lunch, recess, and study periods), multiplied by 100. bStudents who received special education and related services outside the regular classroom for less than 21 percent of the school day were classified in the inside the regular class 80% or more of the day category. c“Other environments” consists of separate school, residential facility, homebound/hospital environment, correctional facilities, and parentally placed in private schools. dStates’ use of the developmental delay category is optional for children ages 3 through 9 and is not applicable to children older than 9 years of age. For more information on students ages 6 through 9 reported under the category of developmental delay and states with differences in developmental delay reporting practices, see exhibits B-2 and B-3 in Appendix B. NOTE: Percentage was calculated by dividing the number of students ages 6 through 21 served under IDEA, Part B, in the disability category and the educational environment by the total number of students ages 6 through 21 served under IDEA, Part B, in the disability category and all educational environments for that year, then multiplying the result by 100. The sum of row percentages may not total 100 because of rounding. SOURCE: U.S. Department of Education, Office of Special Education Programs, Data Analysis System (DANS), OMB #1820-0517: “Part B, Individuals with Disabilities Education Act, Implementation of FAPE Requirements,” 2011. These data are for 50 states, DC, PR, and the four outlying areas. Data for BIE schools were not available. Data were accessed fall 2012. For actual data used, go to http://www.ed.gov/about/reports/annual/osep.
• In 2011, the percentage of students ages 6 through 21 served under IDEA, Part B, in each educational environment varied by disability category.
• Nearly 9 in 10 students reported under the category of speech or language impairments (86.9 percent) were educated inside the regular class 80% or more of the day.
• Only 17 percent of students reported under the category of intellectual disabilities and 13 percent of students reported under the category of multiple disabilities were educated inside the regular class 80% or more of the day.
49

• Almost one-half of students reported under the category of intellectual disabilities (48.8 percent) and students reported under the category of multiple disabilities (46.2 percent) were educated inside the regular class less than 40% of the day.
• In 2011, larger percentages of students reported under the categories of deaf-blindness (29.9 percent) and multiple disabilities (24.4 percent) than under other disability categories were educated in “Other environments.”
To what extent were students with disabilities in different racial/ethnic groups being educated with their peers without disabilities?
Exhibit 31. Percentage of students ages 6 through 21 served under IDEA, Part B, within racial/ethnic groups, by educational environment: Fall 2011
aPercentage of time spent inside the regular class is defined as the number of hours the student spends each day inside the regular classroom, divided by the total number of hours in the school day (including lunch, recess, and study periods), multiplied by 100. bStudents who received special education and related services outside the regular classroom for less than 21 percent of the school day were classified in the inside the regular class 80% or more of the day category. c“Other environments” includes separate school, residential facility, homebound/hospital environment, correctional facilities, and parentally placed in private schools. NOTE: Percentage was calculated by dividing the number of students ages 6 through 21 served under IDEA, Part B, in the racial/ethnic group and educational environment by the total number of students ages 6 through 21 served under IDEA, Part B, in the racial/ethnic group and all the educational environments, then multiplying the result by 100. The sum of bar percentages may not total 100 because of rounding. SOURCE: U.S. Department of Education, Office of Special Education Programs, Data Analysis System (DANS), OMB #1820-0517: “Part B, Individuals with Disabilities Education Act, Implementation of FAPE Requirements,” 2011. These data are for 50 states, DC, PR, and the four outlying areas. Data for BIE schools were not available. Data were accessed fall 2012. For actual data used, go to http://www.ed.gov/about/reports/annual/osep.
50

• In 2011, for each racial/ethnic group, the largest percentage of students ages 6 through 21 served under IDEA, Part B, was educated inside the regular class 80% or more of the day. The students who were educated inside the regular class 80% or more of the day accounted for at least 50 percent of the students in each of the racial/ethnic groups except for the Native Hawaiian or Other Pacific Islander group. The percentages of students in the racial/ethnic groups who were educated inside the regular class 80% or more of the day ranged from 45.5 percent to 64.3 percent.
• The category inside the regular class no more than 79% of the day and no less than 40% of the day accounted for between 16.8 and 31.6 percent of the students within each racial/ethnic group. In contrast, less than 20 percent of the students within each racial/ethnic groups, except for Asian (21.0 percent), was educated inside the regular class less than 40% of the day.
• “Other environments” accounted for less than 6.2 percent of the students within each racial/ethnic group.
51
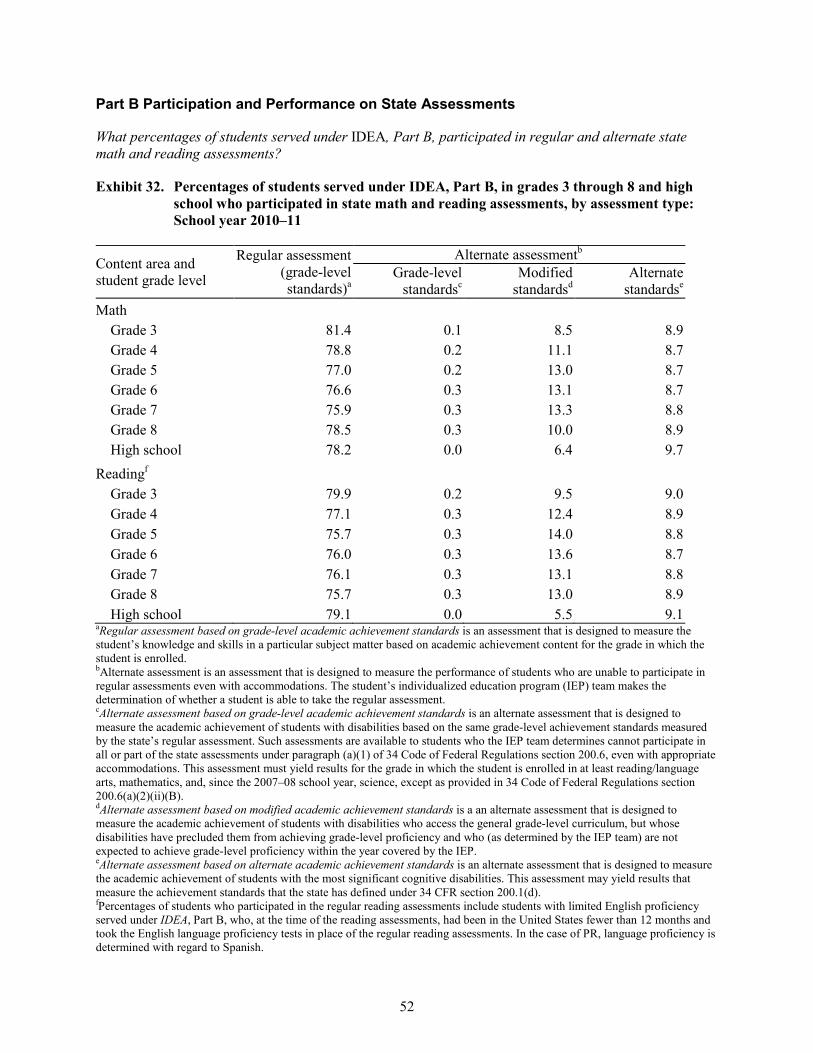
Part B Participation and Performance on State Assessments
What percentages of students served under IDEA, Part B, participated in regular and alternate state math and reading assessments?
Exhibit 32. Percentages of students served under IDEA, Part B, in grades 3 through 8 and high school who participated in state math and reading assessments, by assessment type: School year 2010–11
Content area and student grade level
Regular assessment (grade-level standards)a
Alternate assessmentb Grade-level
standardsc Modified
standardsd Alternate
standardse Math
Grade 3 81.4 0.1 8.5 8.9 Grade 4 78.8 0.2 11.1 8.7 Grade 5 77.0 0.2 13.0 8.7 Grade 6 76.6 0.3 13.1 8.7 Grade 7 75.9 0.3 13.3 8.8 Grade 8 78.5 0.3 10.0 8.9 High school 78.2 0.0 6.4 9.7
Readingf Grade 3 79.9 0.2 9.5 9.0 Grade 4 77.1 0.3 12.4 8.9 Grade 5 75.7 0.3 14.0 8.8 Grade 6 76.0 0.3 13.6 8.7 Grade 7 76.1 0.3 13.1 8.8 Grade 8 75.7 0.3 13.0 8.9 High school 79.1 0.0 5.5 9.1
aRegular assessment based on grade-level academic achievement standards is an assessment that is designed to measure the student’s knowledge and skills in a particular subject matter based on academic achievement content for the grade in which the student is enrolled. bAlternate assessment is an assessment that is designed to measure the performance of students who are unable to participate in regular assessments even with accommodations. The student’s individualized education program (IEP) team makes the determination of whether a student is able to take the regular assessment. cAlternate assessment based on grade-level academic achievement standards is an alternate assessment that is designed to measure the academic achievement of students with disabilities based on the same grade-level achievement standards measured by the state’s regular assessment. Such assessments are available to students who the IEP team determines cannot participate in all or part of the state assessments under paragraph (a)(1) of 34 Code of Federal Regulations section 200.6, even with appropriate accommodations. This assessment must yield results for the grade in which the student is enrolled in at least reading/language arts, mathematics, and, since the 2007–08 school year, science, except as provided in 34 Code of Federal Regulations section 200.6(a)(2)(ii)(B). dAlternate assessment based on modified academic achievement standards is a an alternate assessment that is designed to measure the academic achievement of students with disabilities who access the general grade-level curriculum, but whose disabilities have precluded them from achieving grade-level proficiency and who (as determined by the IEP team) are not expected to achieve grade-level proficiency within the year covered by the IEP. eAlternate assessment based on alternate academic achievement standards is an alternate assessment that is designed to measure the academic achievement of students with the most significant cognitive disabilities. This assessment may yield results that measure the achievement standards that the state has defined under 34 CFR section 200.1(d). fPercentages of students who participated in the regular reading assessments include students with limited English proficiency served under IDEA, Part B, who, at the time of the reading assessments, had been in the United States fewer than 12 months and took the English language proficiency tests in place of the regular reading assessments. In the case of PR, language proficiency is determined with regard to Spanish.
52

• In school year 2010–11, between 75.9 and 78.8 percent of students served under IDEA, Part B, in each of grades 4 through 8 and high school participated in a regular assessment based on grade-level academic achievement standards in math. In contrast, 81.4 percent of the students in grade 3 participated in a regular assessment in math.
• Of all students who participated in some type of alternate assessment in math in school year 2010–11, larger percentages of the students in grade 3 and high school took an alternate assessment based on alternate academic achievement standards. In contrast, larger percentages of these students in each of grades 4 through 8 took an alternate assessment based on modified academic achievement standards than the other two types of alternate tests.
• Between 75.7 percent and 79.9 percent of students served under IDEA, Part B, in each of grades 4 through 8 and high school participated in a regular assessment based on grade-level academic achievement standards in reading.
• Of the students in each of grades 3 through 8 who participated in some type of alternate assessment in reading in school year 2010–11, a larger percentage took an alternate assessment based on modified academic achievement standards. In contrast, a larger percentage of the students in high school who participated in some type of alternate assessment in reading took an alternate assessment based on alternate academic achievement standards.
NOTE: Percentage was calculated by dividing the number of students served under IDEA, Part B, in the grade level who participated in the specific content area assessment and received a valid score and achievement level by the total number of students served under IDEA, Part B, who were enrolled in the grade level during or near the content area testing date, then multiplying the result by 100. SOURCE: U.S. Department of Education, Office of Special Education Programs, Data Analysis System (DANS), OMB #1820-0659: “Report of the Participation and Performance of Students with Disabilities on State Assessments,” 2010–11. These data are for 50 states, DC, PR, and the four outlying areas. Data for BIE schools were not available. Data were accessed fall 2012. For actual data used go to http://www.ed.gov/about/reports/annual/osep.
53

What percentages of students served under IDEA, Part B, were classified as nonparticipants in state math and reading assessments?
Exhibit 33. Percentages of students served under IDEA, Part B, in grades 3 through 8 and high school classified as nonparticipants in state math and reading assessments, by nonparticipant category: School year 2010–11
Content area and student grade level
Students whose assessment results
were invalida
Students who took an out-of-
level testb
Students who did not take any
assessmentc Total Math
Grade 3 0.25 0.02 0.95 1.21 Grade 4 0.22 0.03 0.88 1.13 Grade 5 0.24 0.02 0.85 1.12 Grade 6 0.29 0.03 1.07 1.39 Grade 7 0.40 0.02 1.39 1.81 Grade 8 0.68 0.02 1.71 2.41 High school 0.54 0.10 5.06 5.70
Readingd
Grade 3 0.42 0.02 0.95 1.40 Grade 4 0.33 0.03 0.90 1.26 Grade 5 0.29 0.03 0.85 1.17 Grade 6 0.36 0.04 1.06 1.46 Grade 7 0.43 0.03 1.33 1.78 Grade 8 0.49 0.02 1.61 2.12 High school 1.00 0.05 5.03 6.08
aStudents whose assessment results were invalid were students whose assessment results could not be used for reporting assessment performance to OSEP/ED due to problems in the testing process and/or changes in testing materials that resulted in a score deemed by the state to not yield a valid evaluation of a student’s level of achievement on grade-level content. Students whose test results were determined to be invalid are counted as nonparticipants. bStudents who took an out-of-level test were students who took an assessment that was at a grade level below which the students were enrolled during the reporting period. Students who are tested out of level are considered nonparticipants because out-of-grade-level tests do not result in a valid score. Note that out-of-level testing is not in accordance with the Elementary and Secondary Education Act, as specified in 34 CFR section 200.1(b)(2). This category is included in this report only to ensure that all students with individualized education programs (IEPs) are fully accounted. States are expected to eliminate the out-of-level testing practice as required by statute. cStudents who did not take any assessment included students who received parental exemptions, students who were absent, and students who did not take any assessment for other reasons (e.g., exemptions due to a medical emergency, expulsions, or suspensions). dPercentages of nonparticipants in the reading assessments can include students with limited English proficiency served under IDEA, Part B, who, at the time of the reading assessments, had been in the United States fewer than 12 months and took or were scheduled to take the English language proficiency tests in place of the regular reading assessments. In the case of PR, language proficiency is determined with regard to Spanish. NOTE: Percentage was calculated by dividing the number of students served under IDEA, Part B, in the grade level, content area, and nonparticipant category by the total number of students served under IDEA, Part B, who were enrolled in the grade level during or near the content area testing date, then multiplying the result by 100. SOURCE: U.S. Department of Education, Office of Special Education Programs, Data Analysis System (DANS), OMB #1820-0659: “Report of the Participation and Performance of Students with Disabilities on State Assessments,” 2010–11. These data are for 50 states, DC, PR, and the four outlying areas. Data for BIE schools were not available. Data were accessed fall 2012. For actual data used, go to http://www.ed.gov/about/reports/annual/osep.
54

• No more than 2.41 percent of students served under IDEA, Part B, who were expected to take a math assessment test in each of grades 3 through 8 in school year 2010–11 were classified as nonparticipants. Similarly, no more than 2.12 percent of students served under IDEA, Part B, who were expected to take a reading assessment test in each of grades 3 through 8 in school year 2010–11 were classified as nonparticipants. Larger percentages of the students served under IDEA, Part B, in high school in school year 2010–11 were classified as nonparticipants for both the math assessment (5.70 percent) and the reading assessment (6.08 percent).
• Of the three nonparticipant categories, students who did not take any assessment accounted for more of the nonparticipants in each grade in both math and reading. However, the percentage only exceeded 2 percent for high school students expected to be assessed in math (5.06 percent) and high school students expected to be assessed in reading (5.03 percent).
55

What percentages of students served under IDEA, Part B, were found to be proficient with state math and reading assessments?
Exhibit 34. Numbers of states assessing students served under IDEA, Part B, in grades 3 through 8 and high school in math and reading, and median percentages of those students who were proficient, by assessment type: School year 2010–11
Content area and student grade level
Regular assessment (grade-level standards)a
Alternate assessmentb Grade-level standardsc Modified standardsd Alternate standardse
Number of states
Median percent
students proficient
Number of states
Median percent
students proficient
Number of states
Median percent
students proficient
Number of states
Median percent
students proficient
Math Grade 3 56 47.9 3 45.3 12 50.6 56 69.0 Grade 4 56 43.7 3 48.0 13 53.4 56 71.8 Grade 5 56 35.1 3 46.1 14 46.3 56 70.6 Grade 6 56 28.8 3 44.3 14 50.0 56 71.9 Grade 7 56 26.2 3 46.6 14 41.1 56 68.3 Grade 8 56 25.8 3 45.6 14 38.4 56 69.4 High school 56 17.9 2 0.0 9 33.5 55 67.6
Readingf Grade 3 56 40.3 3 45.9 12 48.9 56 70.4 Grade 4 56 39.8 3 45.3 13 50.4 56 70.6 Grade 5 56 38.3 3 47.6 14 62.6 56 71.9 Grade 6 56 32.2 3 45.9 14 48.1 56 67.9 Grade 7 56 32.3 3 43.7 14 46.1 56 72.2 Grade 8 56 29.6 3 43.0 14 46.9 56 70.9 High school 56 27.1 3 9.1 9 55.3 55 69.5
aRegular assessment based on grade-level academic achievement standards is an assessment that is designed to measure the student’s knowledge and skills in a particular subject matter based on academic achievement content for the grade in which the student is enrolled. bAlternate assessment is an assessment that is designed to measure the performance of students who are unable to participate in regular assessments even with accommodations. The student’s individualized education program (IEP) team makes the determination of whether a student is able to take the regular assessment. cAlternate assessment based on grade-level academic achievement standards is an alternate assessment that is designed to measure the academic achievement of students with disabilities based on the same grade-level achievement standards measured by the state’s regular assessment. dAlternate assessment based on modified academic achievement standards is an alternate assessment that is designed to measure the academic achievement of students with disabilities who access the general grade-level curriculum, but whose disabilities have precluded them from achieving grade-level proficiency and who (as determined by the IEP team) are not expected to achieve grade-level proficiency within the year covered by the IEP. eAlternate assessment based on alternate academic achievement standards is an alternate assessment that is designed to measure the academic achievement of students with the most significant cognitive disabilities. This assessment may yield results that measure the achievement standards that the state has defined under 34 CFR section 200.1(d). fStudents with limited English proficiency served under IDEA, Part B, who at the time of the reading assessments had been in the United States fewer than 12 months and took English language proficiency tests in place of the regular reading assessments were not considered in the calculations of the percentage of students who were proficient in reading. In the case of PR, language proficiency is determined with regard to Spanish.
56

• In school year 2010–11, all 50 states, the District of Columbia, Puerto Rico, and the four outlying areas administered a regular assessment based on grade-level academic achievement standards in math to some students served under IDEA, Part B, in each of grades 3 through 8 and high school. The median percentage of students served under IDEA, Part B, in grade 3 who were found to be proficient with these math tests was 47.9 percent. The median percentage of students who were found to be proficient with these tests was less for each successive grade, reaching a low of 17.9 percent for students in high school.
• An alternate assessment based on grade-level academic achievement standards for math was administered by three states to some students served under IDEA, Part B, in each of grades 3 through 8 and by two states to some students in high school. The median percentage of students served under IDEA, Part B, in each of grades 3 through 8 who were found to be proficient with these math tests was in a range from 45.3 percent to 48 percent.
• An alternate assessment based on modified academic achievement standards for math was administered by between 12 and 14 states to some students served under IDEA, Part B, in each of grades 3 through 8 and by nine states to some students in high school. The median percentage of students served under IDEA, Part B, in each of grades 3 through 7 who were found to be proficient with these math tests was in a range from 41.1 percent to 53.4 percent. The median percentages for students in grade 8 and high school were 38.4 percent and 33.5 percent, respectively.
• An alternate assessment based on alternate academic achievement standards for math was administered by all 50 states, the District of Columbia, Puerto Rico, and the four outlying areas to some students served under IDEA, Part B, in each of grades 3 through 8 and by 49 states, the District of Columbia, Puerto Rico, and the four outlying areas to some students in high school. The median percentage of students served under IDEA, Part B, in each grade who were found to be proficient with these math tests was in a range from 67.6 percent to 71.9 percent.
• In school year 2010–11, all 50 states, the District of Columbia, Puerto Rico, and the four outlying areas administered a regular assessment based on grade-level academic achievement standards in reading to some students served under IDEA, Part B, in each of grades 3 through 8 and high school. The median percentage of students served under IDEA, Part B, in grade 3 who were found to be proficient with these reading tests was 40.3 percent. The median percentage of students who were found to be proficient with these tests was less or was nearly equal for each successive grade, reaching a low of 27.1 percent for students in high school.
NOTE: “Students who were proficient” were students whom states considered proficient for purposes of Adequate Yearly Progress as reported under the Elementary and Secondary Education Act of 1965, as amended (ESEA). Median percentage represents the mid-point of the percentages calculated for all of the states for which data were available. The percentage for each state was calculated by dividing the number of students served under IDEA, Part B, in the grade level who were proficient in the specific content area assessment in the state by the total number of students served under IDEA, Part B, in the grade level who participated in the specific content area assessment and received a valid score and achievement level in the state, then multiplying the result by 100. SOURCE: U.S. Department of Education, Office of Special Education Programs, Data Analysis System (DANS), OMB #1820-0659: “Report of the Participation and Performance of Students with Disabilities on State Assessments,” 2010–11. These data are for 50 states, DC, PR, and the four outlying areas. Data for BIE schools were not available. Data were accessed fall 2012. For actual data used, go to http://www.ed.gov/about/reports/annual/osep.
57

• An alternate assessment based on grade-level academic achievement standards for reading was administered by three states to some students served under IDEA, Part B, in each of grades 3 through 8 and high school. The median percentage of students served under IDEA, Part B, in each grade except high school who were found to be proficient with these reading tests was in a range from 43 percent to 47.6 percent. The median percentage of students in high school who were found to be proficient was only 9.1 percent.
• An alternate assessment based on modified academic achievement standards for reading was administered by 12 to 14 states to some students served under IDEA, Part B, in each of grades 3 through 8 and by nine states to some students in high school. The median percentage of students served under IDEA, Part B, in each grade except grade 5 and high school who were found to be proficient with these reading tests was in a range from 46.1 percent to 48.9 percent. For students in grade 5 and high school, the medians were 50.4 percent and 55.3 percent, respectively.
• An alternate assessment based on alternate academic achievement standards for reading was administered by all 50 states, the District of Columbia, Puerto Rico, and the four outlying areas to some students served under IDEA, Part B, in each of grades 3 through 8 and by 49 states, the District of Columbia, Puerto Rico, and the four outlying areas to some students in high school. The median percentage of students served under IDEA, Part B, in each grade who were found to be proficient with these reading tests was in a range from 67.9 percent to 72.2 percent.
58

Part B Exiting
What were the percentages of students ages 14 through 21 exiting IDEA, Part B, for specific reasons?
Exhibit 35. Percentage of students ages 14 through 21 exiting IDEA, Part B, by exit reason: 2010–11
aThe moved, known to be continuing in education category includes exiters who moved out of the catchment area (e.g., state, school district) and are known to be continuing in an educational program. The catchment area is defined by the state education agency. b“Other exiting reasons” includes reached maximum age for services (0.8 percent) and died (0.2 percent). NOTE: The U.S. Department of Education collects data on seven categories of exiters from special education (i.e., the Part B program in which the student was enrolled at the start of the reporting period). The categories include five categories of exiters from both special education and school (i.e., graduated with a regular high school diploma, received a certificate, dropped out, reached maximum age for services, and died) and two categories of exiters from special education, but not school (i.e., transferred to regular education and moved, known to be continuing in education). The seven categories are mutually exclusive. Percentage was calculated by dividing the number of students ages 14 through 21 served under IDEA, Part B, reported in the exit reason category by the total number of students ages 14 through 21 served under IDEA, Part B, reported in all the exit reason categories, then multiplying the result by 100. The sum may not total 100 percent because of rounding. Data are from the reporting period between July 1, 2010, and June 30, 2011. SOURCE: U.S. Department of Education, Office of Special Education Programs, Data Analysis System (DANS), OMB #1820-0521: “Report of Children with Disabilities Exiting Special Education,” 2010–11. These data are for the 50 states, DC, BIE schools, PR, and the four outlying areas. Data were accessed fall 2012. For actual data used, go to http://www.ed.gov/about/reports/annual/osep.
• Of the seven exit reason categories, graduated with a regular high school diploma accounted for the largest percentage of students ages 14 through 21 who exited special education in 2010–11 (39.6 percent), followed by moved, known to be continuing in education (28.1 percent) and dropped out (12.5 percent).
59

How have graduation and dropout percentages for students exiting IDEA, Part B, and school changed over time?
Exhibit 36. Percentages of students ages 14 through 21 exiting IDEA, Part B, and school, who graduated with a regular high school diploma or dropped out of school, by year: 2001–02 through 2010–11
aGraduated with a regular high school diploma refers to students ages 14 through 21 served under IDEA, Part B, who exited an educational program through receipt of a high school diploma identical to that for which students without disabilities were eligible. These were students with disabilities who met the same standards for graduation as those for students without disabilities. As defined in 34 CFR section 300.102(a)(3)(iv), “the term regular high school diploma does not include an alternative degree that is not fully aligned with the State’s academic standards, such as a certificate or a general educational development credential (GED).” bDropped out refers to students ages 14 through 21 served under IDEA, Part B, who were enrolled at the start of the reporting period, were not enrolled at the end of the reporting period, and did not exit special education through any other basis (see seven exit reason categories described below). Starting in 2004–05, moved, not known to be continuing, used in previous years, was eliminated, and exiters who moved and were not known to be continuing in an education program were added to the dropped out category. NOTE: The U.S. Department of Education collects data on seven categories of exiters from special education (i.e., the Part B program in which the student was enrolled at the start of the reporting period). The categories include five categories of exiters from both special education and school (i.e., graduated with a regular high school diploma, received a certificate, dropped out, reached maximum age for services, and died) and two categories of exiters from special education, but not school (i.e., transferred to regular education and moved, known to be continuing in education). The seven categories are mutually exclusive. This exhibit provides percentages for only two categories of exiters from both special education and school (i.e., graduated with a regular high school diploma and dropped out). For data on all seven categories of exiters, see exhibit 35. Percentage was calculated by dividing the number of students ages 14 through 21 served under IDEA, Part B, reported in the exit reason category (i.e., graduated with a regular high school diploma or dropped out) for the year by the total number of students ages 14 through 21 served under IDEA, Part B, reported in the five exit-from-both-special education-and-school categories for that year, then multiplying the result by 100. The percentages of students who exited special education and school by graduating and dropping out as required under IDEA and included in this report are not comparable to the graduation and dropout rates required under the Elementary and Secondary Education Act of 1965, as amended (ESEA). The data used to calculate percentages of students who exited special education and school by graduating or dropping out are different from those used to calculate graduation and
60

• In 2010–11, a total of 63.6 percent of the students ages 14 through 21 who exited IDEA, Part B, and school graduated with a regular high school diploma; an additional 20.1 percent dropped out.
• From 2001–02 through 2010–11, the percentage of students who exited special education and school by having graduated with a regular high school diploma increased from 51.4 percent to 63.6 percent.
• From 2001–02 through 2010–11, the percentage of students who exited special education and school by having dropped out decreased from 37.8 percent to 20.1 percent.
dropout rates. In particular, states often use data such as the number of students who graduated in four years with a regular high school diploma and the number of students who entered high school four years earlier to determine their graduation and dropout rates under ESEA. For 2001–02 through 2004–05, data are from a cumulative 12-month reporting period, which may have varied from state to state. For 2005–06 through 2010–11, data are from the reporting period between July 1 and June 30 of the referenced year. SOURCE: U.S. Department of Education, Office of Special Education Programs, Data Analysis System (DANS), OMB #1820-0521: “Report of Children with Disabilities Exiting Special Education,” 2001–02 through 2010–11. These data are for the 50 states, DC, BIE schools, PR, and the four outlying areas with the following exceptions. For 2004–05, data for Washington and DC were not available. For 2005–06, data for DC were not available. For 2006–07, data for Vermont and Washington were not available. For 2007–08, data for Texas, Vermont, and DC were not available. For 2008–09, data for Vermont were not available. For 2010–11, data for BIE schools were not available. Data for 2001–02 through 2009–10 were accessed spring 2012. Data for 2010–11 were accessed fall 2012. For actual data used, go to http://www.ed.gov/about/reports/annual/osep.
61
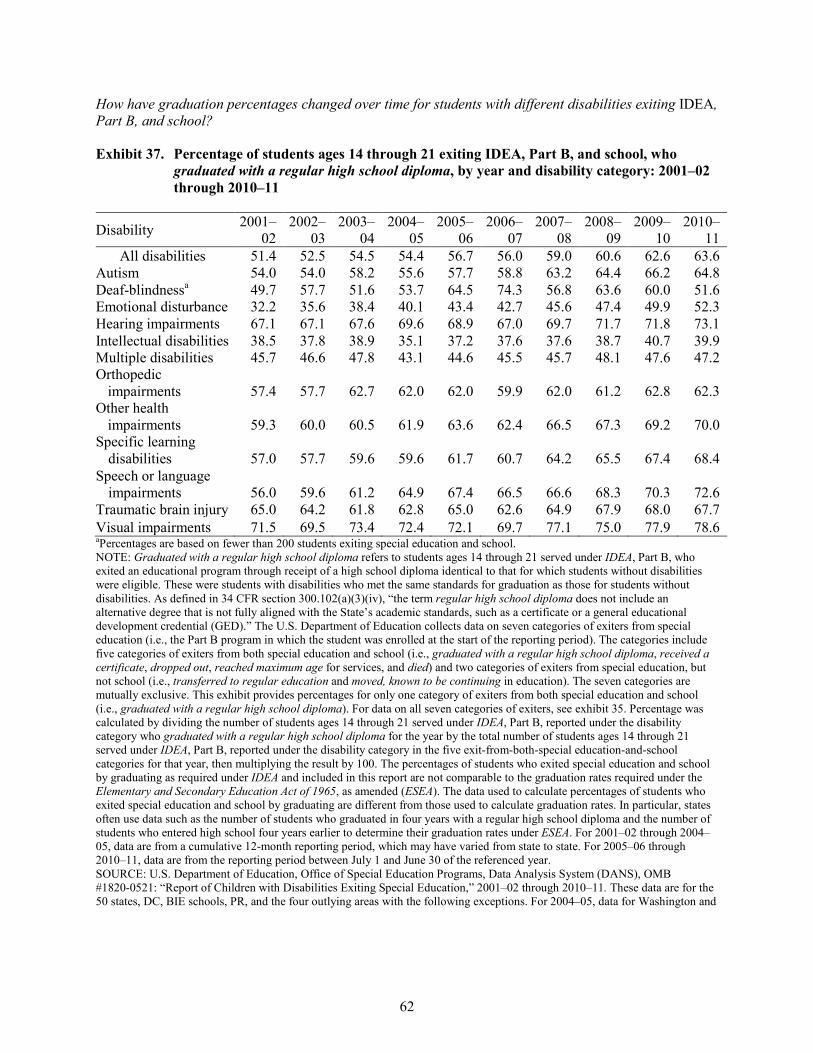
How have graduation percentages changed over time for students with different disabilities exiting IDEA, Part B, and school?
Exhibit 37. Percentage of students ages 14 through 21 exiting IDEA, Part B, and school, who graduated with a regular high school diploma, by year and disability category: 2001–02 through 2010–11
Disability 2001–02
2002–03
2003–04
2004–05
2005–06
2006–07
2007–08
2008–09
2009–10
2010–11
All disabilities 51.4 52.5 54.5 54.4 56.7 56.0 59.0 60.6 62.6 63.6 Autism 54.0 54.0 58.2 55.6 57.7 58.8 63.2 64.4 66.2 64.8 Deaf-blindnessa 49.7 57.7 51.6 53.7 64.5 74.3 56.8 63.6 60.0 51.6 Emotional disturbance 32.2 35.6 38.4 40.1 43.4 42.7 45.6 47.4 49.9 52.3 Hearing impairments 67.1 67.1 67.6 69.6 68.9 67.0 69.7 71.7 71.8 73.1 Intellectual disabilities 38.5 37.8 38.9 35.1 37.2 37.6 37.6 38.7 40.7 39.9 Multiple disabilities 45.7 46.6 47.8 43.1 44.6 45.5 45.7 48.1 47.6 47.2 Orthopedic
impairments 57.4 57.7 62.7 62.0 62.0 59.9 62.0 61.2 62.8 62.3 Other health
impairments 59.3 60.0 60.5 61.9 63.6 62.4 66.5 67.3 69.2 70.0 Specific learning
disabilities 57.0 57.7 59.6 59.6 61.7 60.7 64.2 65.5 67.4 68.4 Speech or language
impairments 56.0 59.6 61.2 64.9 67.4 66.5 66.6 68.3 70.3 72.6 Traumatic brain injury 65.0 64.2 61.8 62.8 65.0 62.6 64.9 67.9 68.0 67.7 Visual impairments 71.5 69.5 73.4 72.4 72.1 69.7 77.1 75.0 77.9 78.6 aPercentages are based on fewer than 200 students exiting special education and school. NOTE: Graduated with a regular high school diploma refers to students ages 14 through 21 served under IDEA, Part B, who exited an educational program through receipt of a high school diploma identical to that for which students without disabilities were eligible. These were students with disabilities who met the same standards for graduation as those for students without disabilities. As defined in 34 CFR section 300.102(a)(3)(iv), “the term regular high school diploma does not include an alternative degree that is not fully aligned with the State’s academic standards, such as a certificate or a general educational development credential (GED).” The U.S. Department of Education collects data on seven categories of exiters from special education (i.e., the Part B program in which the student was enrolled at the start of the reporting period). The categories include five categories of exiters from both special education and school (i.e., graduated with a regular high school diploma, received a certificate, dropped out, reached maximum age for services, and died) and two categories of exiters from special education, but not school (i.e., transferred to regular education and moved, known to be continuing in education). The seven categories are mutually exclusive. This exhibit provides percentages for only one category of exiters from both special education and school (i.e., graduated with a regular high school diploma). For data on all seven categories of exiters, see exhibit 35. Percentage was calculated by dividing the number of students ages 14 through 21 served under IDEA, Part B, reported under the disability category who graduated with a regular high school diploma for the year by the total number of students ages 14 through 21 served under IDEA, Part B, reported under the disability category in the five exit-from-both-special education-and-school categories for that year, then multiplying the result by 100. The percentages of students who exited special education and school by graduating as required under IDEA and included in this report are not comparable to the graduation rates required under the Elementary and Secondary Education Act of 1965, as amended (ESEA). The data used to calculate percentages of students who exited special education and school by graduating are different from those used to calculate graduation rates. In particular, states often use data such as the number of students who graduated in four years with a regular high school diploma and the number of students who entered high school four years earlier to determine their graduation rates under ESEA. For 2001–02 through 2004–05, data are from a cumulative 12-month reporting period, which may have varied from state to state. For 2005–06 through 2010–11, data are from the reporting period between July 1 and June 30 of the referenced year. SOURCE: U.S. Department of Education, Office of Special Education Programs, Data Analysis System (DANS), OMB #1820-0521: “Report of Children with Disabilities Exiting Special Education,” 2001–02 through 2010–11. These data are for the 50 states, DC, BIE schools, PR, and the four outlying areas with the following exceptions. For 2004–05, data for Washington and
62

• From 2001–02 through 2010–11, the graduation percentage increased for students in all disability categories who exited IDEA, Part B, and school. Double-digit increases were associated with the following five disability categories: autism (10.8 percentage point increase), emotional disturbance (20.1 percentage point increase), other health impairments (10.7 percentage point increase), specific learning disabilities (11.4 percentage point increase), and speech or language impairments (16.6 percentage point increase).
• In every year from 2001–02 through 2010–11, except 2006–07, the disability category of visual impairments was associated with the largest graduation percentage. Moreover, the students who exited special education and school reported under the category of emotional disturbance had the lowest graduation percentages from 2001–02 through 2003–04, while the students reported under the category of intellectual disabilities had the lowest graduation percentages from 2004–05 through 2010–11.
DC were not available. For 2005–06, data for DC were not available. For 2006–07, data for Vermont and Washington were not available. For 2007–08, data for Texas, Vermont, and DC were not available. For 2008–09, data for Vermont were not available. For 2010–11, data for BIE schools were not available. Data for 2001–02 through 2009–10 were accessed spring 2012. Data for 2010–11 were accessed fall 2012. For actual data used, go to http://www.ed.gov/about/reports/annual/osep.
63
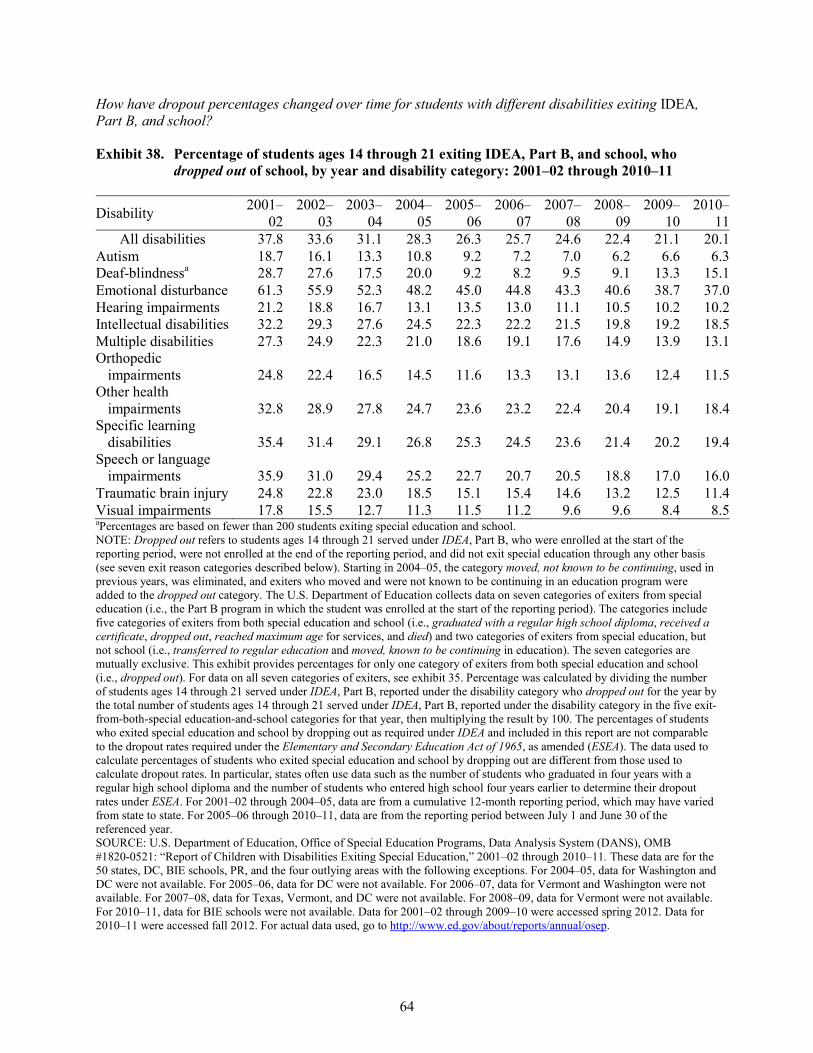
How have dropout percentages changed over time for students with different disabilities exiting IDEA, Part B, and school?
Exhibit 38. Percentage of students ages 14 through 21 exiting IDEA, Part B, and school, who dropped out of school, by year and disability category: 2001–02 through 2010–11
Disability 2001–02
2002–03
2003–04
2004–05
2005–06
2006–07
2007–08
2008–09
2009–10
2010–11
All disabilities 37.8 33.6 31.1 28.3 26.3 25.7 24.6 22.4 21.1 20.1 Autism 18.7 16.1 13.3 10.8 9.2 7.2 7.0 6.2 6.6 6.3 Deaf-blindnessa 28.7 27.6 17.5 20.0 9.2 8.2 9.5 9.1 13.3 15.1 Emotional disturbance 61.3 55.9 52.3 48.2 45.0 44.8 43.3 40.6 38.7 37.0 Hearing impairments 21.2 18.8 16.7 13.1 13.5 13.0 11.1 10.5 10.2 10.2 Intellectual disabilities 32.2 29.3 27.6 24.5 22.3 22.2 21.5 19.8 19.2 18.5 Multiple disabilities 27.3 24.9 22.3 21.0 18.6 19.1 17.6 14.9 13.9 13.1 Orthopedic
impairments 24.8 22.4 16.5 14.5 11.6 13.3 13.1 13.6 12.4 11.5 Other health
impairments 32.8 28.9 27.8 24.7 23.6 23.2 22.4 20.4 19.1 18.4 Specific learning
disabilities 35.4 31.4 29.1 26.8 25.3 24.5 23.6 21.4 20.2 19.4 Speech or language
impairments 35.9 31.0 29.4 25.2 22.7 20.7 20.5 18.8 17.0 16.0 Traumatic brain injury 24.8 22.8 23.0 18.5 15.1 15.4 14.6 13.2 12.5 11.4 Visual impairments 17.8 15.5 12.7 11.3 11.5 11.2 9.6 9.6 8.4 8.5 aPercentages are based on fewer than 200 students exiting special education and school. NOTE: Dropped out refers to students ages 14 through 21 served under IDEA, Part B, who were enrolled at the start of the reporting period, were not enrolled at the end of the reporting period, and did not exit special education through any other basis (see seven exit reason categories described below). Starting in 2004–05, the category moved, not known to be continuing, used in previous years, was eliminated, and exiters who moved and were not known to be continuing in an education program were added to the dropped out category. The U.S. Department of Education collects data on seven categories of exiters from special education (i.e., the Part B program in which the student was enrolled at the start of the reporting period). The categories include five categories of exiters from both special education and school (i.e., graduated with a regular high school diploma, received a certificate, dropped out, reached maximum age for services, and died) and two categories of exiters from special education, but not school (i.e., transferred to regular education and moved, known to be continuing in education). The seven categories are mutually exclusive. This exhibit provides percentages for only one category of exiters from both special education and school (i.e., dropped out). For data on all seven categories of exiters, see exhibit 35. Percentage was calculated by dividing the number of students ages 14 through 21 served under IDEA, Part B, reported under the disability category who dropped out for the year by the total number of students ages 14 through 21 served under IDEA, Part B, reported under the disability category in the five exit-from-both-special education-and-school categories for that year, then multiplying the result by 100. The percentages of students who exited special education and school by dropping out as required under IDEA and included in this report are not comparable to the dropout rates required under the Elementary and Secondary Education Act of 1965, as amended (ESEA). The data used to calculate percentages of students who exited special education and school by dropping out are different from those used to calculate dropout rates. In particular, states often use data such as the number of students who graduated in four years with a regular high school diploma and the number of students who entered high school four years earlier to determine their dropout rates under ESEA. For 2001–02 through 2004–05, data are from a cumulative 12-month reporting period, which may have varied from state to state. For 2005–06 through 2010–11, data are from the reporting period between July 1 and June 30 of the referenced year. SOURCE: U.S. Department of Education, Office of Special Education Programs, Data Analysis System (DANS), OMB #1820-0521: “Report of Children with Disabilities Exiting Special Education,” 2001–02 through 2010–11. These data are for the 50 states, DC, BIE schools, PR, and the four outlying areas with the following exceptions. For 2004–05, data for Washington and DC were not available. For 2005–06, data for DC were not available. For 2006–07, data for Vermont and Washington were not available. For 2007–08, data for Texas, Vermont, and DC were not available. For 2008–09, data for Vermont were not available. For 2010–11, data for BIE schools were not available. Data for 2001–02 through 2009–10 were accessed spring 2012. Data for 2010–11 were accessed fall 2012. For actual data used, go to http://www.ed.gov/about/reports/annual/osep.
64

• From 2001–02 through 2010–11, the dropout percentage decreased for students in all disability categories who exited IDEA, Part B, and school. The decreases were most notable for students reported under the categories of emotional disturbance (-24.3 percentage point decrease) and speech or language impairments (-19.9 percentage point decrease).
• In every year from 2001–02 through 2010–11, a larger percentage of the students reported under the category of emotional disturbance exited special education and school by dropping out. In fact, in each year, the dropout percentage was no less than 37 percent, which was substantially larger than the dropout percentage for any other disability category.
Special Education Teachers and Paraprofessionals Employed to Serve Students Ages 6 Through 21 Under IDEA, Part B
To what extent were full-time equivalent teachers who were employed to provide special education and related services for students ages 6 through 21 served under IDEA, Part B, highly qualified?
Exhibit 39. Number of full-time equivalent (FTE) special education teachers and number and percentage of FTE highly qualified special education teachers employed to provide special education and related services for students ages 6 through 21 served under IDEA, Part B: Fall 2010
Year Total number FTE employed
Number FTE highly qualifieda
Percentageb FTE highly qualified
2010 370,986 349,516 94.2 aSpecial education teachers reported as highly qualified met the state standard for highly qualified based on the criteria identified in 20 U.S.C. section 1401(10). For highly qualified special education teachers, the term “highly qualified” has the same meaning given the term in section 9101 of the Elementary and Secondary Education Act of 1965, as amended (ESEA), except that such term also includes the requirements described in section 602(10)(B) of IDEA, and the option for teachers to meet the requirements of section 9101 of ESEA by meeting the requirements of section 602(10)(C) or (D) of IDEA [20 U.S.C. section 1401(10)]. bPercentage was calculated by dividing the number of FTE highly qualified special education teachers employed to provide special education and related services for students ages 6 through 21 served under IDEA, Part B, by the total number of FTE special education teachers employed to provide special education and related services for students ages 6 through 21 served under IDEA, Part B, then multiplying the result by 100. SOURCE: U.S. Department of Education, Office of Special Education Programs, Data Analysis System (DANS), OMB #1820-0518: “Personnel (in Full-Time Equivalency of Assignment) Employed to Provide Special Education and Related Services for Children with Disabilities,” 2010. These data are for 49 states, DC, BIE schools, PR, and the four outlying areas. Data for Wyoming were not available. Data were accessed summer 2012. For actual data used, go to http://www.ed.gov/about/reports/annual/osep.
• In 2010, a total of 349,516, or 94.2 percent, of the 370,986 FTE special education teachers who provided special education and related services for students ages 6 through 21 under IDEA, Part B, were highly qualified.
65

To what extent were full-time equivalent paraprofessionals who were employed to provide special education and related services for students ages 6 through 21 served under IDEA, Part B, qualified?
Exhibit 40. Number of full-time equivalent (FTE) special education paraprofessionals and number and percentage of FTE qualified special education paraprofessionals employed to provide special education and related services for students ages 6 through 21 served under IDEA, Part B: Fall 2010
Year Total number FTE employed
Number FTE qualifieda
Percentageb FTE qualified
2010 401,792 384,444 95.7 aSpecial education paraprofessionals reported as qualified (a) met the state standard for qualified based on the criteria identified in 20 U.S.C. section 1412(14)(B) or (b) if no state standard for qualified paraprofessionals existed, either held appropriate state certification or licensure for the position held or held positions for which no state certification or licensure requirements existed. bPercentage was calculated by dividing the number of FTE qualified special education paraprofessionals employed to provide special education and related services for students ages 6 through 21 served under IDEA, Part B, by the total number of FTE special education paraprofessionals employed to provide special education and related services for students ages 6 through 21 served under IDEA, Part B, then multiplying the result by 100. NOTE: Paraprofessionals are employees who provide instructional support, including those who: (1) provide one-on-one tutoring if such tutoring is scheduled at a time when a student would not otherwise receive instruction from a teacher; (2) assist with classroom management, such as organizing instructional and other materials; (3) provide instructional assistance in a computer laboratory; (4) conduct parental involvement activities; (5) provide support in a library or media center; (6) act as a translator; or (7) provide instructional support services under the direct supervision of a teacher. SOURCE: U.S. Department of Education, Office of Special Education Programs, Data Analysis System (DANS), OMB #1820-0518: “Personnel (in Full-Time Equivalency of Assignment) Employed to Provide Special Education and Related Services for Children with Disabilities,” 2010. These data are for 49 states, DC, BIE schools, PR, and the four outlying areas. Data for Wyoming were not available. Data were accessed summer 2012. For actual data used, go to http://www.ed.gov/about/reports/annual/osep.
• In 2010, a total of 384,444, or 95.7 percent, of the 401,792 FTE special education paraprofessionals who provided special education and related services for students ages 6 through 21 under IDEA, Part B, were qualified.
66

Children and Students Ages 3 Through 21 Served Under IDEA, Part B
Personnel Employed To Provide Related Services for Children and Students Ages 3 Through 21 Served Under IDEA, Part B
In 2010, the 50 states, the District of Columbia (DC), Bureau of Indian Education (BIE) schools, Puerto Rico (PR), and the outlying areas of American Samoa, Guam, the Northern Mariana Islands, and the Virgin Islands were asked to report the numbers of full-time equivalent fully certified and not fully certified personnel employed to provide related services for children and students ages 3 through 21 served under IDEA, Part B. Personnel who were fully certified for the position either held appropriate state certification or licensure for the position held or held positions for which no state certification or licensure requirements existed.
To what extent were full-time equivalent personnel who were employed to provide related services for children and students ages 3 through 21 served under IDEA, Part B, fully certified?
Exhibit 41. Number of full-time equivalent (FTE) personnel and number and percentage of FTE fully certified personnel employed to provide related services for children and students ages 3 through 21 served under IDEA, Part B, by personnel type: Fall 2010
Personnel category Total number FTE employed
Number FTE fully certified
Percentagea FTE fully certified
Total 197,792 193,540 97.9 Audiologists 1,379 1,345 97.5 Counselors and Rehabilitation Counselors 14,430 14,090 97.6 Interpreters 6,815 6,150 90.2 Medical/Nursing Service Staff 15,615 15,146 97.0 Occupational Therapists 19,667 19,309 98.2 Orientation and Mobility Specialists 1,446 1,410 97.5 Physical Education Teachers and Recreation
and Therapeutic Recreation Specialists 14,269 13,999 98.1 Physical Therapists 8,366 8,228 98.3 Psychologists 33,018 32,699 99.0 Social Workers 20,362 19,971 98.1 Speech-Language Pathologists 62,424 61,194 98.0 aPercentage was calculated by dividing the number of FTE fully certified personnel employed to provide related services for children and students ages 3 through 21 served under IDEA, Part B, by the total number of FTE personnel (fully certified and not fully certified) employed to provide related services for children and students ages 3 through 21 served under IDEA, Part B, then multiplying the result by 100. NOTE: Not all states use all 11 related services personnel categories. The term “related services” refers to transportation and such developmental, corrective, and other supportive services as are required to assist a child with a disability to benefit from special education. Related services include speech-language pathology and audiology services; interpreting services; psychological services; physical and occupational therapy; recreation, including therapeutic recreation; early identification and assessment of disabilities in children; counseling services, including rehabilitation counseling; orientation and mobility services; medical
67

• In 2010, a total of 97.9 percent of all FTE personnel who were employed to provide related services for children and students ages 3 through 21 served under IDEA, Part B, were fully certified.
• Ten of the 11 categories of FTE related services personnel had full certification percentages of 97 percent or more. Interpreters had the smallest full certification percentage (90.2 percent), while nearly all psychologists (99.0 percent) were fully certified.
services for diagnostic or evaluation purposes; school health services and school nurse services; social work services in schools; and parent counseling and training. Related services do not include a medical device that is surgically implanted, the optimization of that device’s functioning (e.g., mapping), maintenance of that device, or the replacement of that device [34 CFR section 300.34(a) and (b)(1)]. SOURCE: U.S. Department of Education, Office of Special Education Programs, Data Analysis System (DANS), OMB #1820-0518: “Personnel (in Full-Time Equivalency of Assignment) Employed to Provide Special Education and Related Services for Children with Disabilities,” 2010. These data are for 49 states, DC, BIE schools, PR, and the four outlying areas. Data for 2010 for Wyoming were not available. Data were accessed summer 2012. For actual data used, go to http://www.ed.gov/about/reports/annual/osep.
68

Disciplinary Removals of Children and Students From Their Educational Placements
For school year 2010–11, the 50 states, District of Columbia, Puerto Rico, and the four outlying areas reported information on children and students ages 3 through 21 served under IDEA, Part B, who were removed from their educational placements for disciplinary reasons.
How many children and students ages 3 through 21 served under IDEA, Part B, were removed to an interim alternative educational setting and suspended or expelled for more than 10 days during the school year?
Exhibit 42. Numbers of children and students ages 3 through 21 who were served under IDEA, Part B; removed from their educational placements for disciplinary purposes; and removed per 10,000 children and students ages 3 through 21 served under IDEA, Part B, by type of disciplinary removal: School year 2010–11
Type of disciplinary removal Number serveda
Number disciplinedb
Number disciplined per 10,000 servedc
Removed to an interim alternative educational settingd Removed unilaterally by school personnele for
drugs, weapons, or serious bodily injuryf 6,551,252 8,884 14 Removed by hearing officer for likely injuryg 6,532,644 270 #
Suspended or expelled >10 days during school yearh Received out-of-school suspensions or expulsionsf 6,551,252 62,592 96 Received in-school suspensionsf 6,551,252 24,560 37
# Ratio was non-zero, but smaller than 5 per 100,000. aExcludes counts from states that did not have disciplinary removal category data available. bThe number reported within each of the four disciplinary categories is an unduplicated count of children and students. However, children and students who were involved in two or more incidents may be reported in more than one disciplinary category. cRatio was calculated by dividing the number of children and students ages 3 through 21 served under IDEA, Part B, in the disciplinary removal category by the total number of children and students ages 3 through 21 served under IDEA, Part B, then multiplying the result by 10,000. The numerator is based on data from the entire 2010–11 school year, whereas the denominator is based on point-in-time data from fall 2010. dAn appropriate setting determined by the child’s/student’s individualized education program (IEP) team in which the child/student is placed for no more than 45 school days. This setting enables the child/student to continue to progress in the general curriculum; to continue to receive the services and modifications, including those described in the child’s/student’s current IEP; and to meet the goals set out in the IEP. Setting includes services and modifications to address the problem behavior and to prevent the behavior from recurring. eInstances in which school personnel (not the IEP team) order the removal of children and students with disabilities from their current educational placement to an appropriate interim alternative educational setting for not more than 45 school days. fData for BIE schools were not available for this disciplinary removal category. Data for Wyoming were excluded for this disciplinary removal category because data were not available for the number of children served. gData for Delaware and BIE schools were not available for this disciplinary removal category. Data for Wyoming were excluded for this disciplinary removal category because data were not available for the number of children served. hThe children and students reported in this category are those subject to multiple short-term suspensions/expulsions summing to more than 10 days during the school year, those subject to single suspension(s)/expulsion(s) over 10 days during the school year, and those subject to both. SOURCE: U.S. Department of Education, Office of Special Education Programs, Data Analysis System (DANS), OMB #1820-0621: “Report of Children with Disabilities Subject to Disciplinary Removal,” 2010–11. Data were accessed summer 2012. Data Analysis System (DANS), OMB #1820-0043: “Report of Children with Disabilities Receiving Special Education Under Part B of the Individuals with Disabilities Education Act, as Amended,” 2010. Data were accessed spring 2012. These data are for the 50 states, DC, PR, and the four outlying areas with the exceptions noted above. For actual data used, go to http://www.ed.gov/about/reports/annual/osep.
69

• During school year 2010–11, 8,884 children and students ages 3 through 21 served under IDEA, Part B, were removed unilaterally to an interim alternative educational setting by school personnel for offenses involving drugs, weapons, or serious bodily injury. Given that 6,598,891 children and students ages 3 through 21 were served under Part B in 2010, this type of action occurred with only 14 children and students for every 10,000 children and students who were served under Part B in 2010.
• Only 270 children and students ages 3 through 21 served under IDEA, Part B, or less than 5 for every 100,000 children and students served in 2010, were removed to an interim alternative educational setting by a hearing officer for likely injury to themselves or others in school year 2010–11.
• There were 62,592 children and students ages 3 through 21 served under IDEA, Part B, or 96 for every 10,000 children and students served in 2010, who received out-of-school suspensions or expulsions for more than 10 cumulative days in school year 2010–11.
• There were 24,560 children and students ages 3 through 21 served under IDEA, Part B, or 37 for every 10,000 children and students served in 2010, who received in-school suspensions for more than 10 cumulative days in school year 2010–11.
70

How did the numbers of children and students ages 3 through 21 served under IDEA, Part B, who were removed to an interim alternative educational setting or suspended or expelled for more than 10 days, per 10,000 children and students ages 3 through 21 served, vary by disability category?
Exhibit 43. Numbers of children and students ages 3 through 21 served under IDEA, Part B, who were removed to an interim alternative educational setting and suspended or expelled for more than 10 days per 10,000 children and students ages 3 through 21 served under IDEA, Part B, by disability category and type of disciplinary removal: School year 2010–11
Disability
Removed to an interim alternative educational settinga
Suspended or expelled >10 days during school yearb
Removed unilaterally by
school personnelc for drugs,
weapons, or serious bodily
injuryd
Removed by hearing officer
for likely injurye
Received out-of-school
suspensions or expulsionsd
Received in-school
suspensionsd All disabilities 14 # 96 37
Autismf,g 3 # 14 5 Deaf-blindness 0 0 26 7 Developmental delayh 1 # 3 1 Emotional disturbance i 39 3 393 123 Hearing impairments 8 0 31 12 Intellectual disabilitiesf,g 7 # 89 35 Multiple disabilities 4 1 35 11 Orthopedic impairments 3 0 28 6 Other health impairmentsi 21 # 156 65 Specific learning disabilities 20 # 116 49 Speech or language impairmentsg 2 # 15 7 Traumatic brain injuryf,g 11 1 73 24 Visual impairments 4 0 25 12 # Ratio was non-zero, but smaller than 5 per 100,000. aAn appropriate setting determined by the child’s/student’s individualized education program (IEP) team in which the child/student is placed for no more than 45 school days. This setting enables the child/student to continue to progress in the general curriculum; to continue to receive the services and modifications, including those described in the child’s/student’s current IEP; and to meet the goals set out in the IEP. Setting includes services and modifications to address the problem behavior and to prevent the behavior from recurring. bThe children and students reported in this category are those subject to multiple short-term suspensions/expulsions summing to more than 10 days during the school year, those subject to single suspension(s)/expulsion(s) over 10 days during the school year, and those subject to both. cInstances in which school personnel (not the IEP team) order the removal of children and students with disabilities from their current educational placement to an appropriate interim alternative educational setting for not more than 45 school days. dData for BIE schools were not available for this disciplinary removal category. Data for Wyoming were excluded for this disciplinary removal category because data were not available for the number of children served. eData for Delaware and BIE schools were not available for this disciplinary removal category. Data for Wyoming were excluded for this disciplinary removal category because data were not available for the number of children served. fNumber of children in this category in Wyoming who received out-of-school suspensions and in-school suspensions were suppressed, and therefore were imputed using national distribution and then removed from the total.
71

• For every 10,000 children and students ages 3 through 21 served under IDEA, Part B, reported under the category of emotional disturbance in 2010, there were 39 children and students removed unilaterally to an interim alternative educational setting by school personnel for offenses involving drugs, weapons, or serious bodily during school year 2010–11. The ratio for the children and students reported under each of the other disability categories was less than 22 per 10,000 children and students served.
• Without regard for disability category, for every 10,000 children and students ages 3 through 21 served under IDEA, Part B, in 2010, no more than 3 children and students were removed by a hearing officer for likely injury during school year 2010–11.
• For every 10,000 children and students ages 3 through 21 served under IDEA, Part B, reported under the category of emotional disturbance in 2010, there were 393 children and students who received out-of-school suspensions or expulsions for more than 10 cumulative days during school year 2010–11. The ratio for the children and students reported under each of the other disability categories was less than 157 per 10,000 children and students.
• For every 10,000 children and students ages 3 through 21 served under IDEA, Part B, reported under the category of emotional disturbance in 2010, there were 123 children and students who received in-school suspensions for more than 10 cumulative days during school year 2010–11. The ratio for the children and students reported under each of the other disability categories was less than 66 per 10,000 children and students.
gNumber of children in this category in Wyoming who received in-school suspensions were suppressed and therefore imputed using national distribution and then removed from the total. hStates’ use of the developmental delay category is optional for children ages 3 through 9 and is not applicable to children older than 9 years of age. iNumber of children in this disability category in Wyoming removed unilaterally by school personnel for drugs, weapons, or serious bodily injury were suppressed and therefore imputed using national distribution and then removed from the total. NOTE: The ratio reported within each of the four disciplinary categories is based on an unduplicated count of children and students. However, children and students who were involved in two or more incidents may be reported in more than one disciplinary category. Ratio was calculated by dividing the number of children and students ages 3 through 21 served under IDEA, Part B, reported under the disability category for the disciplinary removal category by the total number of children and students ages 3 through 21 served under IDEA, Part B, reported under the disability category, then multiplying the result by 10,000. The numerator is based on data from the entire 2010–11 school year, whereas the denominator is based on point-in-time data from fall 2010. The denominator for the disability category of deaf-blindness is fewer than 1,600 children and students ages 3 through 21 served under IDEA, Part B. The denominator for each of the other disability categories exceeded 25,000 children and students. SOURCE: U.S. Department of Education, Office of Special Education Programs, Data Analysis System (DANS), OMB #1820-0621: “Report of Children with Disabilities Subject to Disciplinary Removal,” 2010–11. Data were accessed summer 2012. Data Analysis System (DANS), OMB #1820-0043: “Report of Children with Disabilities Receiving Special Education Under Part B of the Individuals with Disabilities Education Act, as Amended,” 2010. Data were accessed fall 2011. These data are for the 50 states, DC, PR, and the four outlying areas with the exceptions noted above. For actual data used, go to http://www.ed.gov/about/reports/annual/osep.
72

Dispute Resolution for Children and Students Served Under IDEA, Part B
To protect the interests of children and students served under IDEA, Part B, the law requires states to implement a formal set of procedural safeguards for children and students served under IDEA, Part B. Among these procedural safeguards are three formal options for registering and resolving disputes. One of these options is a written, signed complaint. Any individual or organization can file a written, signed complaint alleging a violation of any Part B requirement by a school district, the state education agency (SEA), or any other public agency. A second option available to parents, school districts, or other public agencies is a due process complaint. By filing a due process complaint, a parent or public agency may request a due process hearing10 regarding any matter relating to a proposal or a refusal to initiate or change the identification, evaluation, or educational placement of a child with a disability, or the provision of a free appropriate public education (FAPE) to the child. Mediation is a third option available through which parents and school districts can try to resolve disputes and reach an agreement about any matter under Part B of IDEA, including matters arising prior to the filing of a due process complaint. The agreements reached through the mediation process are legally binding and enforceable. For more information about these and other procedural safeguards, go to http://www.nectac.org/topics/procsafe/procsafe.asp.
Unlike the other Part B data collections, which are associated with a specific group of Part B participants defined by the participants’ ages, the Part B dispute resolution data collection is associated with all children and students served under IDEA, Part B. These children and students include individuals ages 3 through 21, as well as older individuals, as states have the option of serving students 22 years of age and older. The Part B legal disputes and resolution data represent all complaints associated with any participant in Part B during the 12 months during which the data were collected.
10 A due process hearing is designed to be a fair, timely, and impartial procedure for resolving disputes that arise from parents and public agencies regarding the education of children and students served under IDEA, Part B.
73

What were the statuses of the written, signed complaints that alleged a violation of a requirement of Part B of IDEA?
Exhibit 44. Percentage of written, signed complaints for children and students served under IDEA, Part B, by complaint status: 2010−11
aA complaint with report issued refers to a written decision that was provided by the state education agency (SEA) to the complainant and public agency regarding alleged violations of a requirement of Part B of IDEA. bA complaint withdrawn or dismissed refers to a written, signed complaint that was withdrawn by the complainant for any reason or that was determined by the SEA to be resolved by the complainant and the public agency through mediation or other dispute resolution means, and no further action by the SEA was required to resolve the complaint, or a complaint dismissed by the SEA for any reason, including that the complaint did not include all required content. cA complaint pending is a written, signed complaint that is either still under investigation or the SEA’s written decision has not been issued. NOTE: A written, signed complaint is a signed document with specific content requirements that is submitted to the SEA by an individual or organization (i.e., complainant) that alleges a violation of a requirement of Part B of IDEA or 34 CFR section 300, including cases in which some required content is absent from the document. Percentage was calculated by dividing the number of complaints in the status category by the total number of written, signed complaints, and then multiplying the result by 100. Percentage was based on a total of 5,035 written, signed complaints. Data are from the reporting period between July 1, 2010, and June 30, 2011. SOURCE: U.S. Department of Education, Office of Special Education Programs, Data Analysis System (DANS), OMB #1820-0677: “Report of Dispute Resolution Under Part B of the Individuals with Disabilities Education Act,” 2010–11. These data are for the 50 states, DC, BIE schools, PR, and the four outlying areas. Data were accessed summer 2012. For actual data used, go to http://www.ed.gov/about/reports/annual/osep.
• During 2010–11, a total of 5,035 written, signed complaints were received through the dispute resolution process for children and students ages 3 through 21 served under IDEA, Part B.
• A report was issued for 3,201 (63.6 percent) of the complaints, while 1,707 (33.9 percent) of the complaints were withdrawn or dismissed. A total of 127 (2.5 percent) of the complaints that were received during the 2010–11 reporting period were pending or unresolved by the end of the period.
74
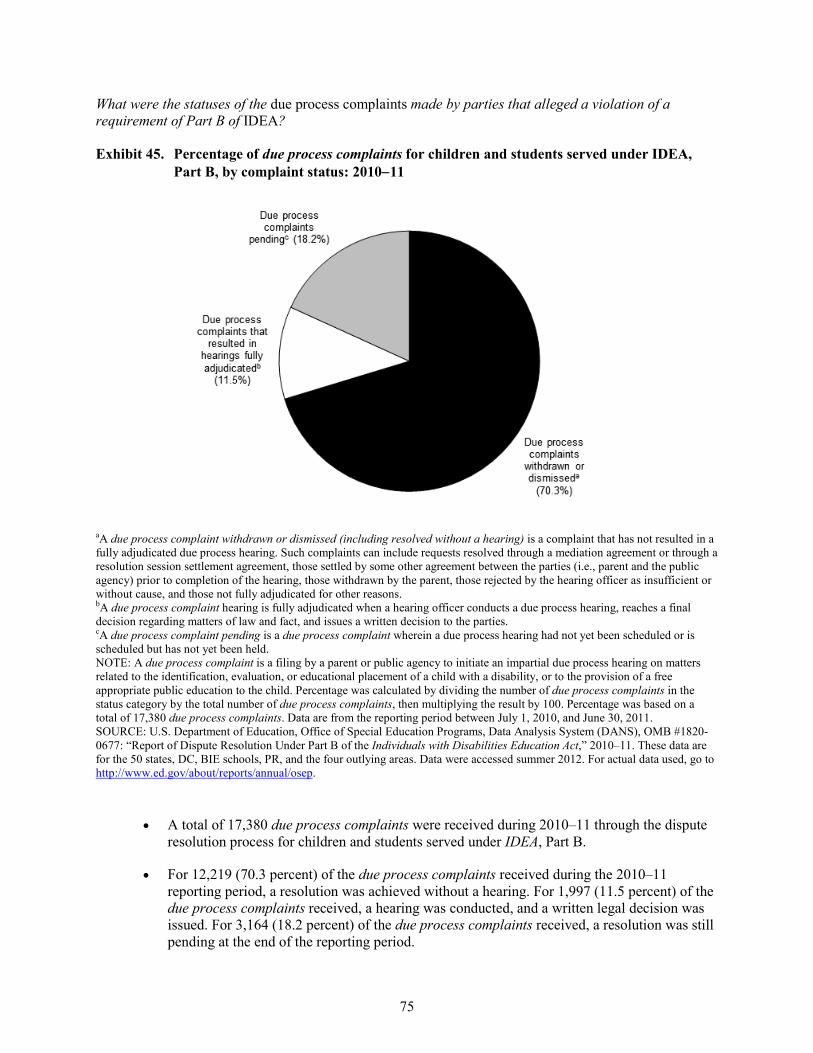
What were the statuses of the due process complaints made by parties that alleged a violation of a requirement of Part B of IDEA?
Exhibit 45. Percentage of due process complaints for children and students served under IDEA, Part B, by complaint status: 2010−11
aA due process complaint withdrawn or dismissed (including resolved without a hearing) is a complaint that has not resulted in a fully adjudicated due process hearing. Such complaints can include requests resolved through a mediation agreement or through a resolution session settlement agreement, those settled by some other agreement between the parties (i.e., parent and the public agency) prior to completion of the hearing, those withdrawn by the parent, those rejected by the hearing officer as insufficient or without cause, and those not fully adjudicated for other reasons. bA due process complaint hearing is fully adjudicated when a hearing officer conducts a due process hearing, reaches a final decision regarding matters of law and fact, and issues a written decision to the parties. cA due process complaint pending is a due process complaint wherein a due process hearing had not yet been scheduled or is scheduled but has not yet been held. NOTE: A due process complaint is a filing by a parent or public agency to initiate an impartial due process hearing on matters related to the identification, evaluation, or educational placement of a child with a disability, or to the provision of a free appropriate public education to the child. Percentage was calculated by dividing the number of due process complaints in the status category by the total number of due process complaints, then multiplying the result by 100. Percentage was based on a total of 17,380 due process complaints. Data are from the reporting period between July 1, 2010, and June 30, 2011. SOURCE: U.S. Department of Education, Office of Special Education Programs, Data Analysis System (DANS), OMB #1820-0677: “Report of Dispute Resolution Under Part B of the Individuals with Disabilities Education Act,” 2010–11. These data are for the 50 states, DC, BIE schools, PR, and the four outlying areas. Data were accessed summer 2012. For actual data used, go to http://www.ed.gov/about/reports/annual/osep.
• A total of 17,380 due process complaints were received during 2010–11 through the dispute resolution process for children and students served under IDEA, Part B.
• For 12,219 (70.3 percent) of the due process complaints received during the 2010–11 reporting period, a resolution was achieved without a hearing. For 1,997 (11.5 percent) of the due process complaints received, a hearing was conducted, and a written legal decision was issued. For 3,164 (18.2 percent) of the due process complaints received, a resolution was still pending at the end of the reporting period.
75

What were the statuses of the mediation requests made by parties that alleged a violation of a requirement of Part B of IDEA?
Exhibit 46. Percentage of mediation requests for children and students served under IDEA, Part B, by request status: 2010−11
aA mediation held related to due process complaint is a process that was conducted by a qualified and impartial mediator to resolve a disagreement between a parent and public agency that was initiated by the filing of a due process complaint or included issues that were the subject of a due process complaint. bA mediation held not related to due process complaint is a process that was conducted by a qualified and impartial mediator to resolve a disagreement between a parent and public agency that was not initiated by the filing of a due process complaint or did not include issues that were the subject of a due process complaint. cA mediation withdrawn or not held is a request for mediation that did not result in a mediation being conducted by a qualified and impartial mediator. This includes mediation requests withdrawn, mediation requests that were dismissed, requests where one party refused to mediate, and requests that were settled by some agreement other than a mediation agreement between the parties. dA mediation pending is a request for mediation that has not yet been scheduled or is scheduled but has not yet been held. NOTE: A mediation request is a request by a party to a dispute involving any matter under Part B of IDEA for the parties to meet with a qualified and impartial mediator to resolve the dispute(s). Percentage was calculated by dividing the number of mediation requests in the status category by the total number of mediation requests, then multiplying the result by 100. Percentage was based on a total of 8,693 mediation requests. Data are from the reporting period between July 1, 2010, and June 30, 2011. SOURCE: U.S. Department of Education, Office of Special Education Programs, Data Analysis System (DANS), OMB #1820-0677: “Report of Dispute Resolution Under Part B of the Individuals with Disabilities Education Act,” 2010–11. These data are for the 50 states, DC, BIE schools, PR, and the four outlying areas. Data were accessed summer 2012. For actual data used, go to http://www.ed.gov/about/reports/annual/osep.
• During 2010–11, a total of 8,693 mediation requests were received through the dispute resolution process for children and students served under IDEA, Part B. For 2,784 (32.0 percent) of the mediation requests received, a mediation related to a due process complaint was conducted. For 2,735 (31.5 percent) of the mediation requests received, a mediation that was not related to a due process complaint was conducted. For 725 requests (8.3 percent), a mediation session was still pending as of the end of the 2010–11 reporting period. The remaining 2,449 mediation requests (28.2 percent) were withdrawn or otherwise not to be held by the end of the reporting period.
76

Section II
Summary and Analysis of IDEA Section 618 Data at the State Level


Introduction
This section of the 35th Annual Report to Congress, 2013 addresses a set of questions developed by the U.S. Department of Education based on information requests made by the public. The questions show the breadth and depth of information available and call for the examination of data elements addressing areas of particular interest.
The discussion in this section offers a different perspective from that presented in Section I, where the discussion features counts, percentages, and ratios that represent the nation as a whole. The measures in Section I for Parts B and C represent the 50 states, the District of Columbia, Puerto Rico, and the outlying areas of American Samoa, Guam, the Northern Mariana Islands, and the Virgin Islands; for Part B only, the measures usually also represent the Bureau of Indian Education (BIE) schools. In contrast, the discussion in this section reflects a state-level perspective that features comparisons among the states for which data were available. The measures presented in this section do not include counts; they include only percentages and ratios and thereby provide a common basis for comparing the states. For Parts B and C, these measures are based on data for the 50 states, the District of Columbia, and Puerto Rico; for Part B only, the measures usually also represent BIE schools. They are referred to collectively as “All states,” and individually by the term “state” in the exhibits and discussion. Consequently, the discussion may refer to as many as 53 individual “states” in total.
The objective of the analyses in this section is to examine similarities and differences among and within states for specific time periods. For some elements, data for two time periods for each state are presented and examined. In these cases, the analysis focuses on comparing data for the two time periods presented to determine what, if any, substantial change occurred. The more recent (comparison) time periods depicted in the state-level data exhibits are consistent with the more recent time periods depicted in the national level data exhibits found in Section I. Earlier (baseline) time periods were selected for exhibits in this section based on data availability and the comparability of the data categories or definitions (see “Data Sources Used in This Report”).
As was the case in Section I, any reference in this section to “special education services” is synonymous with services provided under IDEA, Part B. Similarly, “early intervention services” is a term used synonymously with services provided under IDEA, Part C.
79

Notes Concerning the Exhibits in Section II
The following will assist readers of this section:
1. Majority is defined as greater than 50 percent.
2. Exhibits presenting statistics based on resident population measures include Puerto Rico except when cross-tabulated by race/ethnicity. The U.S. Census’ annual resident population estimates by race/ethnicity exclude residents of Puerto Rico. These data exhibits do not include data for BIE schools because no distinct geographic boundaries exist for defining the associated resident population. The relevant resident population for BIE schools is dispersed throughout all of the states and is counted as part of the resident populations of the individual states.
3. The four outlying areas are not included in the exhibits because data were frequently not available due to cell suppression or data were not reported. For example, the U.S. Census’ annual population estimates exclude residents of the four outlying areas even though the most recent decennial census (collected in 2010) did include residents of the four outlying areas. The unavailability of annual population data results in an inability to calculate associated percentages.
4. Available on the Web at http://www.tadnet.org/ are several documents that can provide important background information to these exhibits. Prior to making any state-to-state comparisons, please consult the posted data dictionaries, fact sheets, and data notes. The data notes provide information on the ways in which states collected and reported data differently from the Office of Special Education Programs (OSEP) data formats and instructions. In addition, the data notes provide explanations of substantial changes in the data from the previous year.
5. The suppression of numerical data results in an inability to calculate associated percentages. Suppression of certain data occurs to limit disclosure of personally identifiable information consistent with federal law. Under IDEA section 618(b)(1), the data collected by the U.S. Department of Education (Department ) under IDEA section 618(a) must be publicly reported by each state in a manner that does not result in the disclosure of data identifiable to individual children. Additionally, under 34 CFR section 99.35(a)(1) of the Family Educational Rights and Privacy Act (FERPA) regulations, authorized representatives of the secretary may have access to education records in connection with an audit or evaluation of
80

federal or state-supported education programs or for the enforcement of or compliance with federal legal requirements that relate to those programs. However, under 34 CFR section 99.35(b)(1) of the FERPA regulations, information collected by authorized representatives of the secretary for these purposes must be protected in a manner that does not permit personal identification of individuals by anyone other than those officials. Only those officials may make further disclosures in accordance with the requirements in 34 CFR section 99.33(b). It is the policy of the Department to be consistent with the provisions of IDEA and FERPA privacy statutes and regulations. Each office in the Department has different purposes for its data collections. Therefore, each office develops its own approach to data presentation that ensures the protection of privacy while meeting the purposes of the data collection and the Department’s Information Quality Guidelines, which were developed as required by the Office of Management and Budget. The 2003-04 data presented in the 28th Annual Report to Congress, 2006, were the first data in these reports to which OSEP applied its cell suppression policy.
In preparing this report, OSEP determined that certain numbers required for calculating the percentages in the exhibits that follow would be suppressed in order to avoid the identification of children and students through data publication. In particular, counts of one to five children or students were suppressed. When necessary, counts of zero or more than five children were suppressed to prevent the calculation of another suppressed number. When counts were suppressed for a state, percentages and ratios that required those counts could not be calculated. However, national counts that were used to calculate the national percentages and ratios presented for “All states” in the exhibits that follow were not suppressed.
81
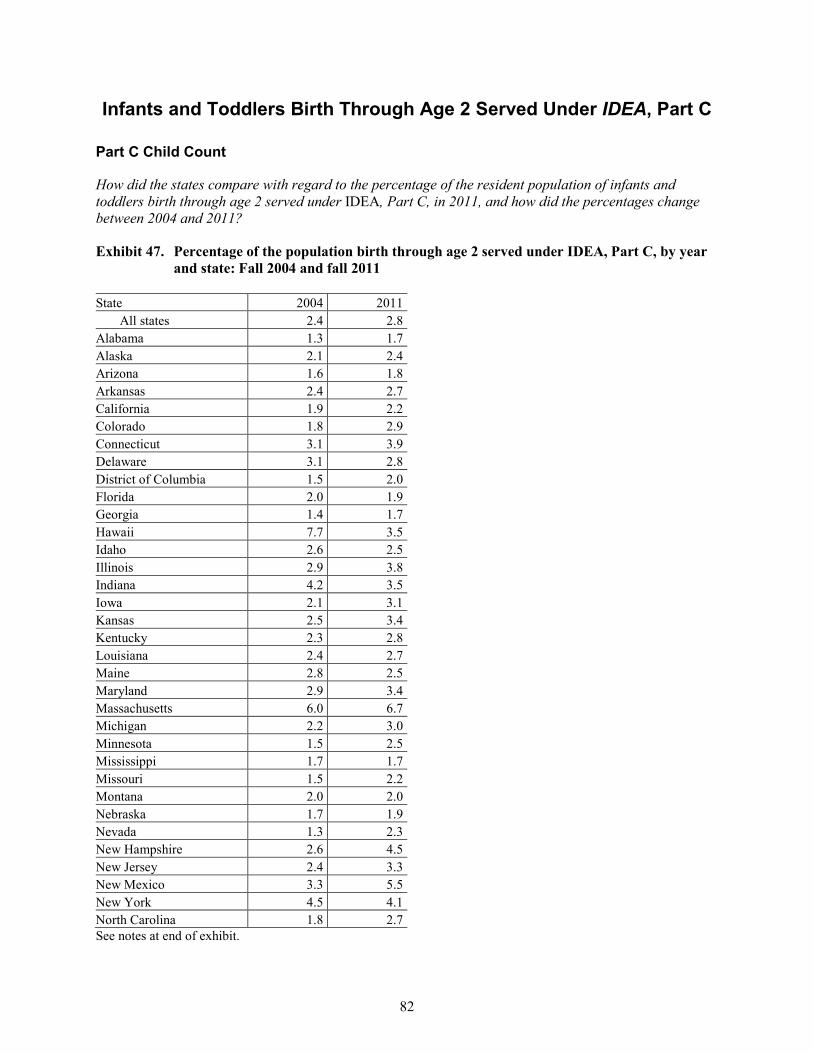
Infants and Toddlers Birth Through Age 2 Served Under IDEA, Part C
Part C Child Count
How did the states compare with regard to the percentage of the resident population of infants and toddlers birth through age 2 served under IDEA, Part C, in 2011, and how did the percentages change between 2004 and 2011?
Exhibit 47. Percentage of the population birth through age 2 served under IDEA, Part C, by year and state: Fall 2004 and fall 2011
State 2004 2011 All states 2.4 2.8
Alabama 1.3 1.7 Alaska 2.1 2.4 Arizona 1.6 1.8 Arkansas 2.4 2.7 California 1.9 2.2 Colorado 1.8 2.9 Connecticut 3.1 3.9 Delaware 3.1 2.8 District of Columbia 1.5 2.0 Florida 2.0 1.9 Georgia 1.4 1.7 Hawaii 7.7 3.5 Idaho 2.6 2.5 Illinois 2.9 3.8 Indiana 4.2 3.5 Iowa 2.1 3.1 Kansas 2.5 3.4 Kentucky 2.3 2.8 Louisiana 2.4 2.7 Maine 2.8 2.5 Maryland 2.9 3.4 Massachusetts 6.0 6.7 Michigan 2.2 3.0 Minnesota 1.5 2.5 Mississippi 1.7 1.7 Missouri 1.5 2.2 Montana 2.0 2.0 Nebraska 1.7 1.9 Nevada 1.3 2.3 New Hampshire 2.6 4.5 New Jersey 2.4 3.3 New Mexico 3.3 5.5 New York 4.5 4.1 North Carolina 1.8 2.7 See notes at end of exhibit.
82

Exhibit 47. Percentage of the population birth through age 2 served under IDEA, Part C, by year and state: Fall 2004 and fall 2011―Continued
State 2004 2011 North Dakota 2.6 3.4 Ohio 2.2 3.4 Oklahoma 2.0 1.6 Oregon 1.5 2.1 Pennsylvania 3.1 4.4 Puerto Rico 2.0 3.8 Rhode Island 3.4 5.9 South Carolina 1.4 2.5 South Dakota 2.8 3.1 Tennessee 1.7 1.7 Texas 1.9 2.0 Utah 1.8 2.2 Vermont 3.1 4.4 Virginia 1.8 2.8 Washington 1.6 2.1 West Virginia 3.2 4.1 Wisconsin 2.8 2.9 Wyoming 3.8 5.1 NOTE: Percentage for each state was calculated by dividing the number of infants and toddlers birth through age 2 served under IDEA, Part C, by the state in the year by the estimated U.S. resident population birth through age 2 in the state for that year, then multiplying the result by 100. Percentage for “All states” was calculated for all states with available data by dividing the number of infants and toddlers birth through age 2 served under IDEA, Part C, by all states in the year by the estimated U.S. resident population birth through age 2 in all states for that year, then multiplying the result by 100. SOURCE: U.S. Department of Education, Office of Special Education Programs, Data Analysis System (DANS), OMB #1820-0557: “Report of Children Receiving Early Intervention Services in Accordance with Part C,” 2004 and 2011. U.S. Department of Commerce, U.S. Census Bureau. “State Single Year of Age and Sex Population Estimates: April 1, 2000 to July 1, 2011—RESIDENT,” 2004 and 2011. Data for 2004 were accessed spring 2012. Data for 2011 were accessed fall 2012. For actual data used, go to http://www.ed.gov/about/reports/annual/osep.
• In 2011, 2.8 percent of infants and toddlers birth through age 2 in the resident population in “All states” were served under IDEA, Part C. The percentages served in the 52 individual states ranged from 1.6 percent to 6.7 percent. The percentage was less than 2 percent in the following eight states: Nebraska (1.9 percent), Florida (1.9 percent), Arizona (1.8 percent), Mississippi (1.7 percent), Tennessee (1.7 percent), Alabama (1. 7 percent), Georgia (1.7 percent), and Oklahoma (1.6 percent). In contrast, the percentage was more than 5 percent in the following four states: Massachusetts (6.7 percent), Rhode Island (5.9 percent), New Mexico (5.5 percent), and Wyoming (5.1 percent).
• In 2004, 2.4 percent of infants and toddlers birth through age 2 in the resident population in “All states” were served under IDEA, Part C.
83

• For 41 of the 52 states, the percentage of the population served increased between 2004 and 2011. For 29 of those states, the increase represented a percent change11 of more than 20 percent. In the following five states, the percent change increase exceeded 70 percent: Puerto Rico (86.5 percent), Nevada (82.2 percent), South Carolina (78.1 percent), New Hampshire (73.1 percent), and Rhode Island (72.3 percent).
• For eight of the 52 states, the percentage of the population served decreased between 2004 and 2011. However, the decrease represented a percent change of less than 20 percent in all of these states except Hawaii and Oklahoma, where the percentages served decreased by 54.8 and 20.8 percent, respectively.
11 Percent change between 2004 and 2011 was calculated for each state and “All states” by subtracting the percentage for 2004 from the percentage for 2011, dividing the difference by the percentage for 2004, and then multiplying the result by 100.
84

How did the states compare with regard to the percentage of the resident population birth through age 2 within each racial/ethnic group who were served under IDEA, Part C, in 2011?
Exhibit 48. Percentage of the population birth through age 2 served under IDEA, Part C, for each racial/ethnic group, by state: Fall 2011
State American Indian or
Alaska Native Asian
Black or African
American Hispanic/
Latino
Native Hawaiian or Other
Pacific Islander White
Two or more races
All states 2.6 2.1 2.8 2.6 3.1 3.0 1.8 Alabama x x 1.7 1.5 0.0 1.7 1.3 Alaska 4.5 1.0 2.1 1.3 2.7 2.2 1.9 Arizona 2.0 0.8 0.9 1.4 x 2.6 x Arkansas 1.2 x 5.4 1.6 x 2.4 1.0 California 1.3 2.0 2.4 2.2 1.0 2.3 0.8 Colorado 2.2 3.2 2.9 2.7 2.2 3.0 2.2 Connecticut 5.2 2.1 3.7 4.5 29.6 3.9 1.8 Delaware x 1.6 2.7 2.5 x 2.5 7.3 District of Columbia 0.0 x 2.8 2.6 x 0.9 x Florida 1.1 1.6 2.2 2.1 3.8 1.6 1.4 Georgia 1.2 1.2 1.8 1.3 3.9 1.7 1.1 Hawaii x 5.1 x 1.6 3.9 3.4 3.5 Idaho 2.4 1.9 2.3 1.8 7.7 2.7 1.2 Illinois x 2.4 3.7 4.2 x 3.9 1.2 Indiana 1.9 2.3 3.1 3.3 16.1 3.7 2.6 Iowa x 1.8 3.7 3.4 x 3.0 4.4 Kansas 1.4 2.8 3.6 3.1 8.7 3.7 1.8 Kentucky 5.1 2.5 2.7 2.4 8.1 2.8 2.7 Louisiana x x 3.0 1.5 0.0 2.8 2.2 Maine x x 0.9 1.2 0.0 2.7 0.8 Maryland 2.3 2.7 3.3 2.9 4.7 3.8 2.7 Massachusetts 10.6 4.3 8.3 8.9 10.2 6.3 4.3 Michigan 4.1 1.5 3.3 2.5 7.1 3.2 1.4 Minnesota 3.5 1.5 2.9 2.0 7.2 2.6 1.9 Mississippi x 1.7 1.8 0.9 x 1.8 0.7 Missouri 1.2 1.7 2.6 1.2 2.4 2.2 2.3 Montana 3.4 x x 1.2 0.0 1.9 1.4 Nebraska 2.6 x 1.6 1.5 x 2.1 1.3 Nevada 1.1 1.5 2.3 2.0 2.5 2.7 2.5 New Hampshire 0.0 3.8 x 2.9 x 4.8 2.6 New Jersey 1.7 2.0 2.5 3.4 26.8 3.9 3.2 New Mexico 5.4 x 5.4 5.9 x 4.9 1.6 New York 2.4 2.8 3.5 3.7 6.9 4.9 1.7 North Carolina 2.8 1.8 3.2 2.8 2.6 2.7 1.3 See notes at end of exhibit.
85

Exhibit 48. Percentage of the population birth through age 2 served under IDEA, Part C, for each racial/ethnic group, by state: Fall 2011―Continued
State American Indian or
Alaska Native Asian
Black or African
American Hispanic/
Latino
Native Hawaiian or Other
Pacific Islander White
Two or more races
North Dakota 3.8 x 2.9 1.7 x 3.5 3.7 Ohio 2.0 2.1 4.0 3.2 8.8 3.4 2.4 Oklahoma 1.1 x 1.7 0.5 x 2.2 0.8 Oregon 2.3 2.0 2.9 2.1 2.6 2.3 0.3 Pennsylvania 3.1 2.9 4.7 4.6 5.5 4.5 4.0 Rhode Island x 3.3 4.5 7.9 x 5.5 4.4 South Carolina x 1.8 2.6 2.3 x 2.5 1.5 South Dakota 4.9 2.7 4.7 3.0 50.0 2.8 1.5 Tennessee 2.0 1.8 1.7 1.4 4.3 1.7 1.1 Texas 1.2 1.3 1.8 2.1 2.6 2.2 0.7 Utah 4.5 1.7 2.2 2.3 1.7 2.2 1.2 Vermont 0.0 2.4 3.8 2.0 0.0 4.5 4.8 Virginia 1.1 1.8 2.7 2.1 4.0 3.1 3.1 Washington 2.6 1.6 1.9 2.5 2.6 2.1 1.6 West Virginia x 3.5 3.7 2.0 x 4.3 1.9 Wisconsin 2.5 1.5 3.6 3.6 8.6 2.7 2.8 Wyoming 5.9 x 8.5 4.3 x 5.3 2.4 x Percentage cannot be calculated because data were suppressed to limit disclosure. NOTE: Percentage for each state was calculated by dividing the number of infants and toddlers birth through age 2 served under IDEA, Part C, reported in the racial/ethnic group by the state by the estimated U.S. resident population birth through age 2 of the racial/ethnic group in the state, then multiplying the result by 100. Percentage for “All states” was calculated by dividing the number of infants and toddlers birth through age 2 served under IDEA, Part C, reported in the racial/ethnic group by all states by the estimated U.S. resident population birth through age 2 in the racial/ethnic group in all states, then multiplying the result by 100. Percentage for “All states” includes suppressed data. SOURCE: U.S. Department of Education, Office of Special Education Programs, Data Analysis System (DANS), OMB #1820-0557: “Report of Children Receiving Early Intervention Services in Accordance with Part C,” 2011. Data for PR were excluded. U.S. Department of Commerce, U.S. Census Bureau. “Intercensal Estimates of the Resident Population by Single Year of Age and Sex for States and the United States: April 1, 2000 to July 1, 2011,” 2011. Data for PR were not available. Data were accessed fall 2012. For actual data used, go to http://www.ed.gov/about/reports/annual/osep.
• A larger percentage of the resident population birth through age 2 who were Native Hawaiian or Other Pacific Islander than any other racial/ethnic group was served under IDEA, Part C, in “All states.” Specifically, 3.1 percent of the resident population of Native Hawaiian or Other Pacific Islanders were served under Part C. In contrast, a smaller percentage of the resident population associated with more than one race than any particular racial/ethnic group was served under IDEA, Part C, in “All states.” Specifically, 1.8 percent of those who were associated with more than one race were served under Part C.
• IDEA, Part C, served 2.6 percent of the resident population birth through age 2 who were American Indian or Alaska Native in “All states.” The percentages ranged from zero to 10.6 percent in the 40 individual states for which non-suppressed data were available. In the following five states, the percentage was at least 5 percent: Massachusetts (10.6 percent),
86

Wyoming (5.9 percent), New Mexico (5.4 percent), Connecticut (5.2 percent), and Kentucky (5.1 percent). In contrast, zero percent of the resident population birth through age 2 who were American Indian or Alaska Native were served under Part C in the following three states: the District of Columbia, New Hampshire, and Vermont.
• IDEA, Part C, served 2.1 percent of the resident population birth through age 2 who were Asian in “All states.” The percentages ranged from 0.8 percent to 5.1 percent in the 40 individual states for which non-suppressed data were available. The percentage was 4 percent or more in two states: Hawaii (5.1 percent) and Massachusetts (4.3 percent). In contrast, no more than 1 percent was served in two states: Alaska (1.0 percent) and Arizona (0.8 percent).
• IDEA, Part C, served 2.8 percent of the resident population birth through age 2 who were Black or African American in “All states.” The percentages ranged from 0.9 to 8.5 percent in the 48 individual states for which non-suppressed data were available. In the following four states, the percentage was 5 percent or more: Wyoming (8.5 percent), Massachusetts (8.3 percent), Arkansas (5.4 percent), and New Mexico (5.4 percent). In contrast, the percentage was less than 1 percent in Maine (0.9 percent) and Arizona (0.9 percent).
• IDEA, Part C, served 2.6 percent of the resident population birth through age 2 who were Hispanic/Latino in “All states.” The percentages ranged from 0.5 to 8.9 percent in the 51 individual states for which non-suppressed data were available. In the following three states, the percentage was 5 percent or more: Massachusetts (8.9 percent), Rhode Island (7.9 percent), and New Mexico (5.9 percent). In contrast, the percentage was less than 1 percent in Mississippi (0.9 percent) and Oklahoma (0.5 percent).
• IDEA, Part C, served 3.1 percent of the resident population birth through age 2 who were Native Hawaiian or Other Pacific Islander in “All states.” The percentages ranged from zero to 50 percent in the 35 states for which non-suppressed data were available. The percentage was larger than 10 percent in the following five states: South Dakota (50.0 percent), Connecticut (29.6 percent), New Jersey (26.8 percent), Indiana (16.1 percent), and Massachusetts (10.2 percent). However, the percentage was zero in the following five states: Alabama, Louisiana, Maine, Montana, and Vermont.
• IDEA, Part C, served 3 percent of the resident population birth through age 2 who were White in “All states.” The percentages ranged from 0.9 to 6.3 percent in the 51 individual states for which non-suppressed data were available. The percentage was larger than 4 percent in nine states, including the following three states in which the percentage was larger than 5 percent: Massachusetts (6.3 percent), Rhode Island (5.5 percent), and Wyoming (5.3 percent). In contrast, the percentage was no more than 2 percent in the following seven states: Montana (1.9 percent), Mississippi (1.8 percent), Georgia (1.7 percent), Tennessee (1.7 percent), Alabama (1.7 percent), Florida (1.6 percent), and the District of Columbia (0.9 percent).
• IDEA, Part C, served 1.8 percent of the resident population birth through age 2 who were associated with multiple races in “All states.” The percentages ranged from 0.3 to 7.3 percent in the 49 individual states for which non-suppressed data were available. In the following six states, the percentage was 4 percent or more: Delaware (7.3 percent), Vermont (4.8 percent), Rhode Island (4.4 percent), Iowa (4.4 percent), Massachusetts (4.3 percent), and Pennsylvania (4.0 percent). In contrast, the percentage was less than 1 percent in following six states: Maine (0.8 percent), Oklahoma (0.8 percent), California (0.8 percent), Texas (0.7 percent), Mississippi (0.7 percent), and Oregon (0.3 percent).
87
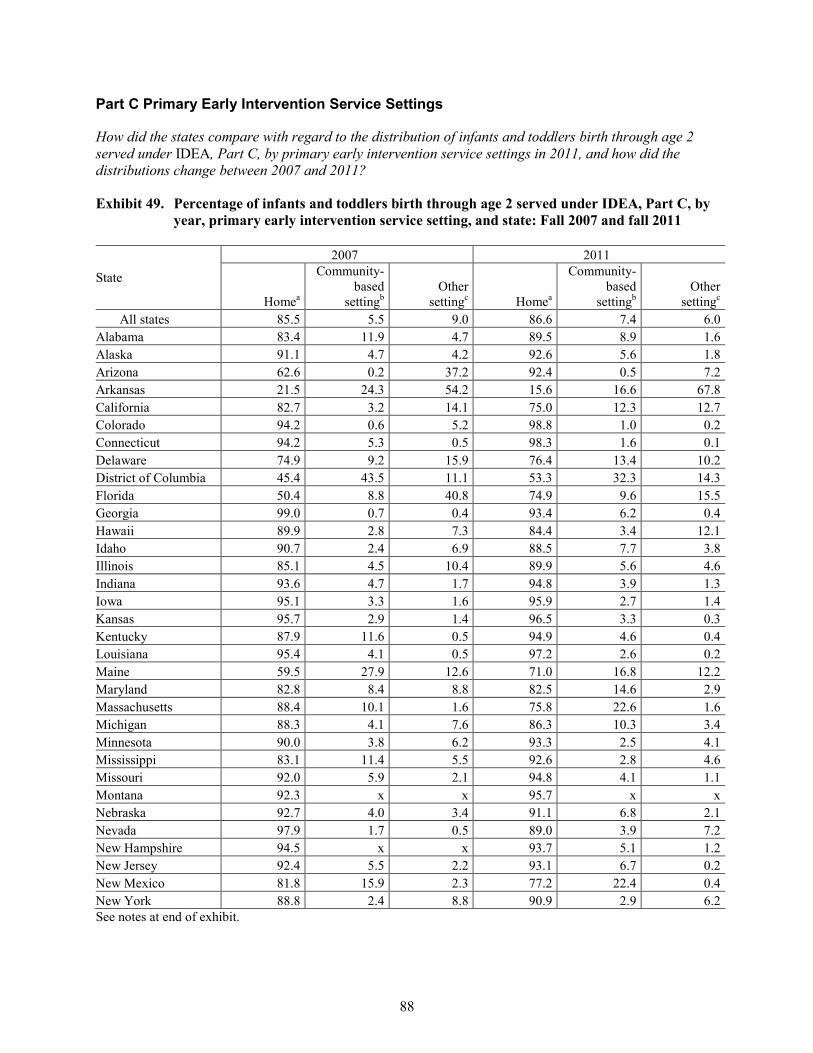
Part C Primary Early Intervention Service Settings
How did the states compare with regard to the distribution of infants and toddlers birth through age 2 served under IDEA, Part C, by primary early intervention service settings in 2011, and how did the distributions change between 2007 and 2011?
Exhibit 49. Percentage of infants and toddlers birth through age 2 served under IDEA, Part C, by year, primary early intervention service setting, and state: Fall 2007 and fall 2011
State
2007 2011
Homea
Community-based
settingb Other
settingc Homea
Community-based
settingb Other
settingc All states 85.5 5.5 9.0 86.6 7.4 6.0
Alabama 83.4 11.9 4.7 89.5 8.9 1.6 Alaska 91.1 4.7 4.2 92.6 5.6 1.8 Arizona 62.6 0.2 37.2 92.4 0.5 7.2 Arkansas 21.5 24.3 54.2 15.6 16.6 67.8 California 82.7 3.2 14.1 75.0 12.3 12.7 Colorado 94.2 0.6 5.2 98.8 1.0 0.2 Connecticut 94.2 5.3 0.5 98.3 1.6 0.1 Delaware 74.9 9.2 15.9 76.4 13.4 10.2 District of Columbia 45.4 43.5 11.1 53.3 32.3 14.3 Florida 50.4 8.8 40.8 74.9 9.6 15.5 Georgia 99.0 0.7 0.4 93.4 6.2 0.4 Hawaii 89.9 2.8 7.3 84.4 3.4 12.1 Idaho 90.7 2.4 6.9 88.5 7.7 3.8 Illinois 85.1 4.5 10.4 89.9 5.6 4.6 Indiana 93.6 4.7 1.7 94.8 3.9 1.3 Iowa 95.1 3.3 1.6 95.9 2.7 1.4 Kansas 95.7 2.9 1.4 96.5 3.3 0.3 Kentucky 87.9 11.6 0.5 94.9 4.6 0.4 Louisiana 95.4 4.1 0.5 97.2 2.6 0.2 Maine 59.5 27.9 12.6 71.0 16.8 12.2 Maryland 82.8 8.4 8.8 82.5 14.6 2.9 Massachusetts 88.4 10.1 1.6 75.8 22.6 1.6 Michigan 88.3 4.1 7.6 86.3 10.3 3.4 Minnesota 90.0 3.8 6.2 93.3 2.5 4.1 Mississippi 83.1 11.4 5.5 92.6 2.8 4.6 Missouri 92.0 5.9 2.1 94.8 4.1 1.1 Montana 92.3 x x 95.7 x x Nebraska 92.7 4.0 3.4 91.1 6.8 2.1 Nevada 97.9 1.7 0.5 89.0 3.9 7.2 New Hampshire 94.5 x x 93.7 5.1 1.2 New Jersey 92.4 5.5 2.2 93.1 6.7 0.2 New Mexico 81.8 15.9 2.3 77.2 22.4 0.4 New York 88.8 2.4 8.8 90.9 2.9 6.2 See notes at end of exhibit.
88

Exhibit 49. Percentage of infants and toddlers birth through age 2 served under IDEA, Part C, by year, primary early intervention service setting, and state: Fall 2007 and fall 2011― Continued
State
2007 2011
Homea
Community-based
settingb Other
settingc Homea
Community-based
settingb Other
settingc North Carolina 90.0 8.9 1.1 91.5 6.9 1.5 North Dakota 93.1 1.2 5.7 97.5 1.5 1.0 Ohio 84.0 4.3 11.7 77.5 6.4 16.1 Oklahoma 95.5 2.8 1.7 92.7 2.5 4.8 Oregon 87.2 3.2 9.6 92.7 3.2 4.1 Pennsylvania 97.6 2.0 0.4 98.6 1.3 0.1 Puerto Rico 87.5 12.4 0.1 84.6 15.4 0.0 Rhode Island 77.4 8.5 14.1 84.6 4.6 10.8 South Carolina 80.6 0.9 18.5 96.4 2.9 0.7 South Dakota 79.7 x x 83.9 15.6 0.5 Tennessee 68.6 19.4 12.0 67.4 16.5 16.2 Texas 96.0 3.4 0.6 94.8 4.3 0.9 Utah 68.2 2.7 29.1 85.2 2.2 12.6 Vermont 86.1 10.9 3.0 84.2 x x Virginia 78.8 4.6 16.6 84.6 3.1 12.3 Washington 61.1 13.4 25.5 72.0 19.4 8.7 West Virginia 95.7 3.9 0.4 98.8 1.2 0.0 Wisconsin 89.0 4.9 6.0 76.8 7.4 15.8 Wyoming 75.0 24.5 0.5 79.1 x x x Percentage cannot be calculated because data were suppressed to limit disclosure. aHome refers to the principal residence of the eligible infant’s or toddler’s family or caregivers. bCommunity-based setting refers to settings in which children without disabilities are usually found. The community-based settings include, but are not limited to, child care centers (including family day care), preschools, regular nursery schools, early childhood centers, libraries, grocery stores, parks, restaurants, and community centers (e.g., YMCA, Boys and Girls Clubs). cOther setting refers to settings other than home or community-based setting in which early intervention services are provided. These include, but are not limited to, services provided in a hospital, residential facility, clinic, and early intervention center/class for children with disabilities. NOTE: Percentage for each state was calculated by dividing the number of infants and toddlers birth through age 2 served under IDEA, Part C, by the state who were reported in the primary service setting in the year by the total number of infants and toddlers birth through age 2 served under IDEA, Part C, by the state in the year, then multiplying the result by 100. Percentage for “All states” was calculated by dividing the number of infants and toddlers birth through age 2 served under IDEA, Part C, by all states who were reported in the primary service setting in the year by the total number of infants and toddlers birth through age 2 served under IDEA, Part C, by all states in the year, then multiplying the result by 100. Percentage for “All states” includes suppressed data. The sum of row percentages for a year may not total 100 because of rounding. SOURCE: U.S. Department of Education, Office of Special Education Programs, Data Analysis System (DANS), OMB #1820-0557: “Report of Program Settings Where Early Intervention Services Are Provided to Children with Disabilities and Their Families in Accordance With Part C,” 2007 and 2011. Data for 2007 were accessed spring 2012. Data for 2011 were accessed fall 2012. For actual data used, go to http://www.ed.gov/about/reports/annual/osep.
• The percentages of infants and toddlers birth through age 2 served under IDEA, Part C, primarily in a home, a community-based setting, and some other setting in “All states” in 2011, were 86.6 percent, 7.4 percent, and 6 percent, respectively. In 2007, the values were very comparable with 85.5 percent, 5.5 percent, and 9 percent being primarily served in a home, a community-based setting, and some other setting, respectively.
89

• Home was the primary setting for 90 percent or more of infants and toddlers served under IDEA, Part C, in 26 states in 2011 and 20 states in 2007. Moreover, more than 50 percent of infants and toddlers in every state except Arkansas were served in a home in 2011. In Arkansas, other setting was the most prevalent primary setting, accounting for 67.8 percent of the infants and toddlers.
• In 2007, more than 50 percent of infants and toddlers in every state except Arkansas and the District of Columbia were served in a home. In Arkansas, other setting was the primary setting for 54.2 percent of infants and toddlers. In the District of Columbia, home and community-based setting accounted for 45.4 percent and 43.5 percent, respectively.
90

91
Part C Exiting
How did the states compare with regard to the percentage of infants and toddlers birth through age 2 exiting or continuing in IDEA, Part C, by exiting status in 2010–11?
Exhibit 50. Percentage of infants and toddlers birth through age 2 exiting or continuing in IDEA, Part C, by exiting status and state: 2010–11
State
No longer eligible for
Part C prior to reaching
age 3a
Part B eligible, exiting Part C
Part B eligible,
continuing in Part C
Not eligible for Part B,
exit with referrals to other
programs
Not eligible for Part B,
exit with no referrals
Part B eligibility
not determinedb Deceased
Moved out of state
Withdrawal by parent
(or guardian)
Attempts to contact
unsuccessful All states 14.9 38.5 1.7 7.2 3.9 10.5 0.4 3.7 11.5 7.8
Alabama 14.2 40.0 — 3.2 2.9 4.4 0.6 4.1 18.8 11.9 Alaska 8.6 45.5 — x 4.0 4.2 x 9.8 11.7 13.8 Arizona 13.4 52.5 — 3.0 1.9 7.1 0.5 5.0 7.4 9.3 Arkansas 5.1 63.7 — 7.4 6.5 4.2 x x 9.8 1.7 California 7.7 41.9 — 19.3 0.0 17.5 0.4 1.5 9.2 2.6 Colorado 15.5 44.7 — 5.4 6.2 7.9 0.3 6.7 8.5 4.8 Connecticut 9.6 48.1 — 6.1 4.8 6.4 0.2 4.3 12.2 8.1 Delaware 11.3 61.8 — 6.0 x 3.2 x 6.3 8.5 1.8 District of Columbia 4.6 27.9 — 3.0 x 30.9 x 9.8 7.4 14.2 Florida 6.8 44.2 — 4.2 2.3 20.7 0.4 3.8 7.4 10.2 Georgia 5.9 49.6 — 4.4 2.3 12.1 0.7 5.1 8.2 11.8 Hawaii 27.1 21.2 — 7.8 x 13.1 x 7.5 9.8 8.5 Idaho 21.7 41.1 — 8.4 4.4 3.1 0.5 6.1 7.9 6.8 Illinois 17.6 44.7 — 6.0 0.4 13.0 0.3 2.9 7.6 7.5 Indiana 24.9 31.1 — 13.5 7.6 3.5 0.4 3.7 14.0 1.2 Iowa 9.5 39.0 — 15.5 3.9 0.2 0.3 3.7 21.2 6.6 Kansas 23.4 49.4 — 2.4 2.1 3.3 0.5 5.8 7.2 5.9 Kentucky 11.8 53.0 — 3.2 4.2 10.4 0.3 3.6 7.3 6.2 Louisiana 5.4 51.2 — 6.5 3.3 9.8 0.5 4.6 10.2 8.5 Maine 14.3 55.8 — x 4.6 1.8 x 3.2 12.0 7.9 See notes at end of exhibit.

92
Exhibit 50. Percentage of infants and toddlers birth through age 2 exiting or continuing in IDEA, Part C, by exiting status and state: 2010–11―Continued
State
No longer eligible for
Part C prior to reaching
age 3a
Part B eligible, exiting Part C
Part B eligible,
continuing in Part C
Not eligible for Part B,
exit with referrals to other
programs
Not eligible for Part B,
exit with no referrals
Part B eligibility
not determinedb Deceased
Moved out of state
Withdrawal by parent
(or guardian)
Attempts to contact
unsuccessful Maryland 41.1 9.1 17.8 2.6 0.4 4.6 0.4 4.1 9.7 10.2 Massachusetts 27.8 39.3 — 6.5 0.9 0.2 0.1 3.0 10.9 11.4 Michigan 13.9 41.2 — 4.8 9.5 2.2 0.5 6.9 9.1 12.0 Minnesota 6.9 65.1 — 7.3 6.2 0.5 0.5 3.2 8.9 1.4 Mississippi 13.0 33.5 — 5.0 8.0 12.4 0.7 6.5 13.3 7.7 Missouri 3.0 60.5 — 6.2 8.8 5.9 0.6 5.3 8.9 0.8 Montana 21.5 32.9 — 5.8 2.0 7.1 0.9 5.7 13.2 10.9 Nebraska 5.2 27.5 59.0 0.4 0.6 0.0 x x 2.7 2.7 Nevada 7.8 45.7 — 1.5 2.5 14.0 1.0 9.3 7.1 11.1 New Hampshire 23.6 38.3 — 5.0 5.2 4.5 0.3 5.3 9.7 8.0 New Jersey 17.5 28.6 — 2.5 17.3 15.3 0.2 3.2 10.6 4.7 New Mexico 11.7 34.1 0.7 5.0 4.2 1.9 0.5 8.8 17.7 15.3 New York 15.1 39.6 11.3 3.4 8.2 11.2 0.2 2.7 5.2 3.3 North Carolina 8.8 30.9 — 3.5 5.4 18.6 0.5 5.1 16.3 10.8 North Dakota — 49.4 — 16.1 x 7.4 x 5.9 13.6 3.6 Ohio 3.9 39.0 — 12.1 7.8 4.7 0.7 4.2 15.0 12.6 Oklahoma 7.7 15.0 — 1.6 0.4 5.8 0.3 3.3 28.4 37.5 Oregon 11.7 64.3 — x 0.8 0.0 x 5.9 9.9 7.0 Pennsylvania 25.3 42.6 — 2.2 2.7 11.1 0.3 2.9 6.3 6.4 Puerto Rico 19.9 35.4 — 0.1 0.2 29.7 0.1 3.9 4.3 6.4 Rhode Island 19.4 37.8 — 7.5 3.0 6.0 0.3 4.0 8.7 13.3 South Carolina 22.5 28.0 — 3.4 7.8 6.1 0.6 6.2 12.9 12.5 South Dakota 7.3 50.2 — 17.8 3.8 x x 6.0 5.3 6.4 Tennessee 9.4 36.4 — 3.6 3.1 21.6 0.5 4.8 12.1 8.3 Texas 12.2 26.9 — 7.2 2.2 12.7 0.3 3.5 23.5 11.4 Utah 13.2 39.4 — 1.9 7.9 9.9 0.4 5.4 16.8 5.1 See notes at end of exhibit.

93
Exhibit 50. Percentage of infants and toddlers birth through age 2 exiting or continuing in IDEA, Part C, by exiting status and state: 2010–11―Continued
State
No longer eligible for
Part C prior to reaching
age 3a
Part B eligible, exiting Part C
Part B eligible,
continuing in Part C
Not eligible for Part B,
exit with referrals to other
programs
Not eligible for Part B,
exit with no referrals
Part B eligibility
not determinedb Deceased
Moved out of state
Withdrawal by parent
(or guardian)
Attempts to contact
unsuccessful Vermont 13.0 65.1 — 4.2 x x x 5.5 4.9 6.4 Virginia 21.6 34.7 — 6.1 7.8 5.8 0.4 5.5 10.1 8.1 Washington 11.5 48.9 — 7.5 7.0 4.7 0.3 5.8 6.9 7.3 West Virginia 21.4 30.9 — 7.3 2.2 14.3 0.3 4.9 11.5 7.3 Wisconsin 31.7 25.6 — 2.3 1.4 6.7 0.2 1.7 21.3 9.2 Wyoming 17.2 46.0 — 5.3 3.4 x x 11.4 6.6 9.1 x Percentage cannot be calculated because data were suppressed to limit disclosure. — Percentage cannot be calculated because data were not available. aThe category of no longer eligible for Part C prior to reaching age 3 was previously labeled completion of IFSP prior to reaching age 3. bThe Part B eligibility not determined category comprises children who were referred for Part B evaluation at the time they were eligible to exit Part C, but for whom the Part B eligibility determination had not yet been made or reported and children for whom parents did not consent to transition planning. NOTE: The U.S. Department of Education collects Part C data on 10 exit status categories: five categories that speak to Part B eligibility (i.e., Part B eligible, exiting Part C; Part B eligible, continuing in Part C; not eligible for Part B, exit with referrals to other programs; not eligible for Part B, exit with no referrals; and Part B eligibility not determined) and five categories that do not speak to Part B eligibility (i.e., no longer eligible for Part C prior to reaching age 3, deceased, moved out of state, withdrawal by parent [or guardian], and attempts to contact unsuccessful). The 10 categories are mutually exclusive. Percentage for each state was calculated by dividing the number of infants and toddlers birth through age 2 served under IDEA, Part C, by the state who were reported in the exiting category by the total number of infants and toddlers birth through age 2 served under IDEA, Part C, by the state who were reported in all the exiting categories, then multiplying the result by 100. Percentage for “All states” was calculated for all states with available data by dividing the number of infants and toddlers birth through age 2 served under IDEA, Part C, by all states who were reported in the exiting category by the total number of infants and toddlers birth through age 2 served under IDEA, Part C, by all states who were reported in all the exiting categories, then multiplying the result by 100. Percentage for “All states” includes suppressed data. The sum of row percentages may not total 100 because of rounding. Data are from a cumulative 12-month reporting period, which may have varied from state to state. SOURCE: U.S. Department of Education, Office of Special Education Programs, Data Analysis System (DANS), OMB #1820-0557: “Report of Infants and Toddlers Exiting Part C,” 2010–11. Data were accessed fall 2012. For actual data used, go to http://www.ed.gov/about/reports/annual/osep.

• In 2010–11, the most prevalent Part C exit status was Part B eligible, exiting Part C. This exit status accounted for 38.5 percent of the infants and toddlers birth through age 2 exiting Part C in “All states.” This exit status also was associated with the largest percentage in 46 of the 52 states. In 11 of those states, this reason accounted for the majority of exits. In the following six of those states, the value was larger than 60 percent: Minnesota (65.1 percent), Vermont (65.1 percent), Oregon (64.3 percent), Arkansas (63.7 percent), Delaware (61.8 percent), and Missouri (60.5 percent).
• The percentage of those exiting Part C classified under no longer eligible for Part C prior to reaching age 3, was the second largest for “All states” but it accounted for only 14.9 percent of the exits. Moreover, this category accounted for the largest percentage of exits in only the following three states: Maryland (41.1 percent), Wisconsin (31.7 percent), and Hawaii (27.1 percent).
94

Part C Dispute Resolution
Unlike the other Part C data collections, which are associated with a specific group of Part C participants defined by the participants’ ages, the Part C dispute resolution data collection is associated with all infants and toddlers served under IDEA, Part C. These infants and toddlers include individuals who are 3 years or older and eligible under Part B but whose parents elect for them to continue receiving Part C services, as states have the authority to define “infants and toddlers” as individuals under 3 years of age and as individuals 3 years of age and older [see IDEA, section 632(5)(B)] and serve them under Part C [see IDEA, section 635(c)] until the children are eligible to enter kindergarten. The Part C legal disputes and resolution data represent all complaints associated with any participant in Part C during the 12 months during which the data were collected. Nevertheless, since infants and toddlers birth through age 2 served under IDEA, Part C, account for nearly all of the participants in Part C in all states, the count for infants and toddlers birth through age 2 served as of the state-designated date for the year was deemed a meaningful basis for creating a ratio by which to compare the volume of Part C disputes that occurred in the individual states during the year. For an overview of the Part C dispute resolution process, see the Section I discussion of these same data at the national level.
How did the states compare with regard to the following ratios in 2010–11:
1. the number of written, signed complaints for infants and toddlers served under IDEA, Part C, per 1,000 infants and toddlers birth through age 2 served;
2. the number of due process complaints for infants and toddlers served under IDEA, Part C, per 1,000 infants and toddlers birth through age 2 served; and
3. the number of mediation requests for infants and toddlers served under IDEA, Part C, per 1,000 infants and toddlers birth through age 2 served?
Exhibit 51. Number of written, signed complaints; due process complaints; and mediation requests
for infants and toddlers per 1,000 infants and toddlers birth through age 2 served under IDEA, Part C, by state: 2010–11
State Written, signed
complaintsa Due process complaintsb
Mediation requestsc
Per 1,000 infants and toddlers served All states 0.4 0.6 1.0
Alabama 0.3 0.0 0.0 Alaska 0.0 0.0 0.0 Arizona 0.4 0.4 0.0 Arkansas 0.3 0.0 0.0 California 0.6 4.1 3.3 Colorado 0.0 0.0 0.0 Connecticut 1.1 0.0 0.2 See notes at end exhibit.
95

Exhibit 51. Number of written, signed complaints; due process complaints; and mediation requests for infants and toddlers per 1,000 infants and toddlers birth through age 2 served under IDEA, Part C, by state: 2010–11―Continued
State Written, signed
complaintsa Due process complaintsb
Mediation requestsc
Per 1,000 infants and toddlers served Delaware 0.0 0.0 0.0 District of Columbia 0.0 0.0 0.0 Florida 0.1 0.0 0.1 Georgia 0.2 0.0 0.0 Hawaii 0.0 0.0 0.0 Idaho 0.6 0.6 0.0 Illinois 0.9 0.0 0.0 Indiana 0.0 0.0 0.0 Iowa 0.0 0.0 0.0 Kansas 0.0 0.0 0.0 Kentucky 0.9 0.2 0.0 Louisiana 3.8 0.0 0.0 Maine 0.0 0.0 0.0 Maryland 0.3 0.1 0.3 Massachusetts 0.1 0.0 0.0 Michigan 0.0 0.0 0.0 Minnesota 0.0 0.0 0.0 Mississippi 0.8 0.0 0.0 Missouri 0.2 0.0 0.0 Montana 0.0 0.0 0.0 Nebraska 0.0 0.0 0.0 Nevada 4.3 0.0 0.0 New Hampshire 0.0 0.0 0.0 New Jersey 0.6 0.4 0.5 New Mexico 0.0 0.0 0.0 New York 1.0 1.6 6.7 North Carolina 0.4 0.3 0.2 North Dakota 0.0 0.0 0.0 Ohio 0.2 0.0 0.0 Oklahoma 0.0 0.0 0.0 Oregon 0.3 0.0 0.3 Pennsylvania 0.1 0.0 0.2 Puerto Rico 0.6 0.0 0.0 Rhode Island 0.0 0.0 0.0 South Carolina 0.6 0.0 0.0 South Dakota 0.0 0.0 0.0 Tennessee 0.0 0.0 0.0 Texas 0.1 0.0 0.0 Utah 0.0 0.0 0.0 Vermont 0.0 0.0 0.0 Virginia 0.4 0.1 0.1 See notes at end exhibit.
96

Exhibit 51. Number of written, signed complaints; due process complaints; and mediation requests for infants and toddlers per 1,000 infants and toddlers birth through age 2 served under IDEA, Part C, by state: 2010–11―Continued
State Written, signed
complaintsa Due process complaintsb
Mediation requestsc
Per 1,000 infants and toddlers served Washington 0.0 0.0 0.0 West Virginia 4.1 0.0 0.0 Wisconsin 0.3 0.2 0.5 Wyoming 0.0 0.0 0.0 aA written, signed complaint is a signed document with specific content requirements that is submitted to a state lead agency by an individual or organization that alleges a violation of a requirement of Part C of IDEA. The total number of written, signed complaints in 2010–11 was 153. bA due process complaint is a filing by any party to initiate a due process hearing on matters related to the identification, evaluation, or early intervention setting of a child with a disability, or to the provision of early intervention services to such child. The total number of due process complaints in 2010–11 was 190. cA mediation request is a request by a party to a dispute involving any matter under Part C of IDEA to meet with a qualified and impartial mediator to resolve the dispute. The total number of mediation requests in 2010–11 was 328. NOTE: Ratio for each state was calculated by dividing the number of written, signed complaints; hearing requests; or mediation requests reported by the state by the total number of infants and toddlers birth through age 2 served under IDEA, Part C, by the state, then multiplying the result by 1,000. Ratio for “All states” was calculated for all states with available data by dividing the number of written, signed complaints; hearing requests; or mediation requests reported by all states by the total number of infants and toddlers birth through age 2 served under IDEA, Part C, by all states, then multiplying the result by 1,000. The numerator is based on data from the reporting period between July 1, 2010, and June 30, 2011, whereas the denominator is based on point-in-time data from fall 2010. SOURCE: U.S. Department of Education, Office of Special Education Programs, Data Analysis System (DANS), OMB #1820-0678: “Report of Dispute Resolution Under Part C of the Individuals with Disabilities Education Act,” 2010–11. Data were accessed summer 2012. Data Analysis System (DANS), OMB #1820-0557: “Report of Children Receiving Early Intervention Services in Accordance with Part C,” 2010. Data were accessed spring 2012. For actual data used, go to http://www.ed.gov/about/reports/annual/osep.
• In 2010–11, there were 0.4 written, signed complaints per 1,000 infants and toddlers birth through age 2 served under IDEA, Part C, in “All states.” However, the ratios were zero in 24 states and ranged from 0.1 to 4.3 in the other states. In only the following three states was the ratio larger than 2 per 1,000 infants and toddlers served: Nevada (4.3 per 1,000 infants and toddlers), West Virginia (4.1 per 1,000 infants and toddlers), and Louisiana (3.8 per 1,000 infants and toddlers).
• In 2010–11, there were 0.6 due process complaints per 1,000 infants and toddlers birth through age 2 served under IDEA, Part C, in “All states.” However, the ratios were zero in 42 states and no larger than 0.6 per 1,000 in all of the other states except California (4.1 per 1,000 infants and toddlers) and New York (1.6 per 1,000 infants and toddlers).
• In 2010–11, there was 1 mediation request per 1,000 infants and toddlers birth through age 2 served under IDEA, Part C, in “All states.” However, the ratios were zero in 41 states and ranged from 0.1 to 6.7 in the other states. In only the following two states was the ratio larger than 0.5 per 1,000 infants and toddlers served: New York (6.7 per 1,000 infants and toddlers) and California (3.3 per 1,000 infants and toddlers).
97

Children Ages 3 Through 5 Served Under IDEA, Part B
Part B Child Count
How did the states compare with regard to the percentage of the resident population of children ages 3 through 5 served under IDEA, Part B, in 2011, and how did the percentages change between 2004 and 2011?
Exhibit 52. Percentage of the population ages 3 through 5 served under IDEA, Part B, by year and state: Fall 2004 and fall 2011
State 2004 2011 All states 5.9 6.0
Alabama 4.6 4.0 Alaska 7.1 6.7 Arizona 5.5 5.5 Arkansas 10.5 11.0 California 4.3 4.8 Colorado 5.5 5.8 Connecticut 6.0 6.4 Delaware 6.3 6.6 District of Columbia 3.3 7.5 Florida 5.7 5.7 Georgia 5.5 3.9 Hawaii 5.0 4.7 Idaho 6.2 4.6 Illinois 6.7 7.3 Indiana 7.3 6.9 Iowa 5.3 6.1 Kansas 8.0 8.6 Kentucky 12.7 10.2 Louisiana 6.1 5.9 Maine 11.0 9.0 Maryland 5.6 5.9 Massachusetts 6.4 7.4 Michigan 6.0 5.8 Minnesota 6.3 7.1 Mississippi 6.7 8.1 Missouri 6.7 6.8 Montana 5.6 4.5 Nebraska 6.5 6.5 Nevada 5.3 6.7 New Hampshire 5.9 7.3 New Jersey 5.6 5.1 New Mexico 7.9 5.6 New York 8.5 9.2 North Carolina 5.8 4.9 See notes at end of exhibit.
98

Exhibit 52. Percentage of the population ages 3 through 5 served under IDEA, Part B, by year and state: Fall 2004 and fall 2011―Continued
State 2004 2011 North Dakota 6.8 6.7 Ohio 4.6 5.5 Oklahoma 5.6 5.3 Oregon 5.8 6.8 Pennsylvania 5.8 7.4 Puerto Rico 4.8 11.0 Rhode Island 7.7 8.5 South Carolina 7.0 5.9 South Dakota 8.8 7.5 Tennessee 5.0 5.4 Texas 4.0 3.4 Utah 5.5 5.6 Vermont 7.4 8.9 Virginia 5.9 5.4 Washington 5.4 5.5 West Virginia 9.2 8.7 Wisconsin 7.6 7.4 Wyoming 12.3 14.1 NOTE: Percentage for each state was calculated by dividing the number of children ages 3 through 5 served under IDEA, Part B, by the state in the year by the estimated U.S. resident population ages 3 through 5 in the state for that year, then multiplying the result by 100. Percentage for “All states” was calculated by dividing the number of children ages 3 through 5 served under IDEA, Part B, by all states in the year by the estimated U.S. resident population ages 3 through 5 in all states for that year, then multiplying the result by 100. Percentage for “All states” includes data for children served by BIE schools. SOURCE: U.S. Department of Education, Office of Special Education Programs, Data Analysis System (DANS), OMB #1820-0043: “Report of Children with Disabilities Receiving Special Education Under Part B of the Individuals with Disabilities Education Act, as Amended,” 2004 and 2011. U.S. Department of Commerce, U.S. Census Bureau. “Intercensal Estimates of the Resident Population by Single Year of Age and Sex for States and the United States: April 1, 2000 to July 1, 2011,” 2004 and 2011. Data about children served through BIE schools in 2011 are not available; however, data for these children are included in the population estimates of the individual states in which they reside. Data for 2004 were accessed spring 2012. Data for 2011 were accessed fall 2012. For actual data used, go to http://www.ed.gov/about/reports/annual/osep.
• In 2011, 6 percent of children ages 3 through 5 in the resident population in “All states” were served under IDEA, Part B. The percentages served in the individual states ranged from 3.4 percent to 14.1 percent. Values of 10 percent or more were observed in the following four states: Wyoming (14.1 percent), Arkansas (11.0 percent), Puerto Rico (11.0 percent), and Kentucky (10.2 percent). Values less than 4 percent were found only in Georgia (3.9 percent) and Texas (3.4 percent).
• In 2004, 5.9 percent of children ages 3 through 5 in the resident population in “All states” were served under IDEA, Part B.
• In 27 of the 52 states, the percentage of the resident population served under IDEA, Part B, increased between 2004 and 2011. However, the increase represented a percent change of 20 percent or more in only the following seven states: Puerto Rico (128.7 percent), the District of Columbia (126.2 percent), Pennsylvania (27.0 percent), Nevada (25.3 percent), New Hampshire (23.9 percent), Mississippi (20.6 percent), and Vermont (20.6 percent).
99

• In 22 of the 52 states, the percentage of the population served decreased between 2004 and 2011. However, the decrease represented a percent change of 20 percent or more in only the following four states: New Mexico (-28.3 percent), Georgia (-28.2 percent), Idaho (-26.2 percent), and Kentucky (-20.1 percent).
100

How did the states compare with regard to the percentage of the resident population ages 3 through 5 within each racial/ethnic group who were served under IDEA, Part B, in 2011?
Exhibit 53. Percentage of the population ages 3 through 5 served under IDEA, Part B, for each racial/ethnic group, by state: Fall 2011
State American Indian or
Alaska Native Asian
Black or African
American Hispanic/
Latino
Native Hawaiian or Other
Pacific Islander White
Two or more races
All states 8.2 4.1 6.1 5.1 9.0 6.5 4.9 Alabama x 4.3 4.0 1.8 x 4.3 2.0 Alaska 10.0 4.7 6.8 5.7 7.3 6.3 5.1 Arizona 6.6 4.3 5.3 5.3 6.9 5.9 3.0 Arkansas 3.4 5.3 16.7 7.5 4.7 10.6 6.4 California 7.5 3.9 5.2 4.7 4.4 5.2 4.8 Colorado 8.0 4.6 6.4 6.1 8.5 5.7 4.9 Connecticut 12.7 4.2 6.9 6.8 22.2 6.4 3.3 Delaware x 4.3 7.9 5.4 x 6.7 2.5 District of Columbia x 4.0 8.9 11.2 x 2.7 1.9 Florida 4.8 4.0 6.6 5.7 12.3 5.5 4.6 Georgia 4.0 2.7 4.1 3.1 9.6 4.2 3.6 Hawaii 8.3 4.3 7.9 3.8 11.7 6.0 1.9 Idaho 7.0 4.7 4.0 4.0 9.9 4.8 2.7 Illinois 16.3 4.9 5.9 6.1 63.3 8.5 7.1 Indiana 6.5 4.1 6.3 5.2 18.3 7.2 8.2 Iowa 8.1 4.1 8.1 5.2 7.1 6.1 5.8 Kansas 16.1 5.9 7.6 6.7 17.7 9.4 6.4 Kentucky 6.3 6.2 9.7 7.6 10.7 10.6 7.3 Louisiana 4.4 4.4 6.2 3.3 8.7 6.1 3.3 Maine 13.2 5.3 7.4 4.7 33.3 9.3 4.5 Maryland 7.8 4.3 6.0 6.1 25.7 6.2 4.3 Massachusetts 7.3 5.4 7.2 8.6 19.4 7.4 5.3 Michigan 7.7 3.5 5.5 4.7 40.8 6.3 3.4 Minnesota 11.4 4.7 8.2 7.9 19.4 7.1 5.5 Mississippi 1.8 4.1 8.7 3.6 17.9 8.5 2.0 Missouri 8.3 5.3 6.7 4.6 4.8 7.2 3.8 Montana 7.4 5.9 6.8 3.0 27.3 4.3 1.7 Nebraska 10.7 x 7.1 5.7 x 6.7 4.9 Nevada 8.9 3.4 8.2 5.8 6.3 7.8 6.1 New Hampshire 6.7 4.4 11.2 5.8 100 7.7 1.4 New Jersey 4.5 4.0 4.8 5.5 42.4 5.4 2.2 New Mexico 5.7 4.1 6.7 5.3 25.5 6.8 1.9 New York 14.6 5.5 8.0 9.0 31.0 9.5 20.8 North Carolina 10.7 2.9 5.7 3.8 41.0 4.9 3.4 See notes at end of exhibit.
101
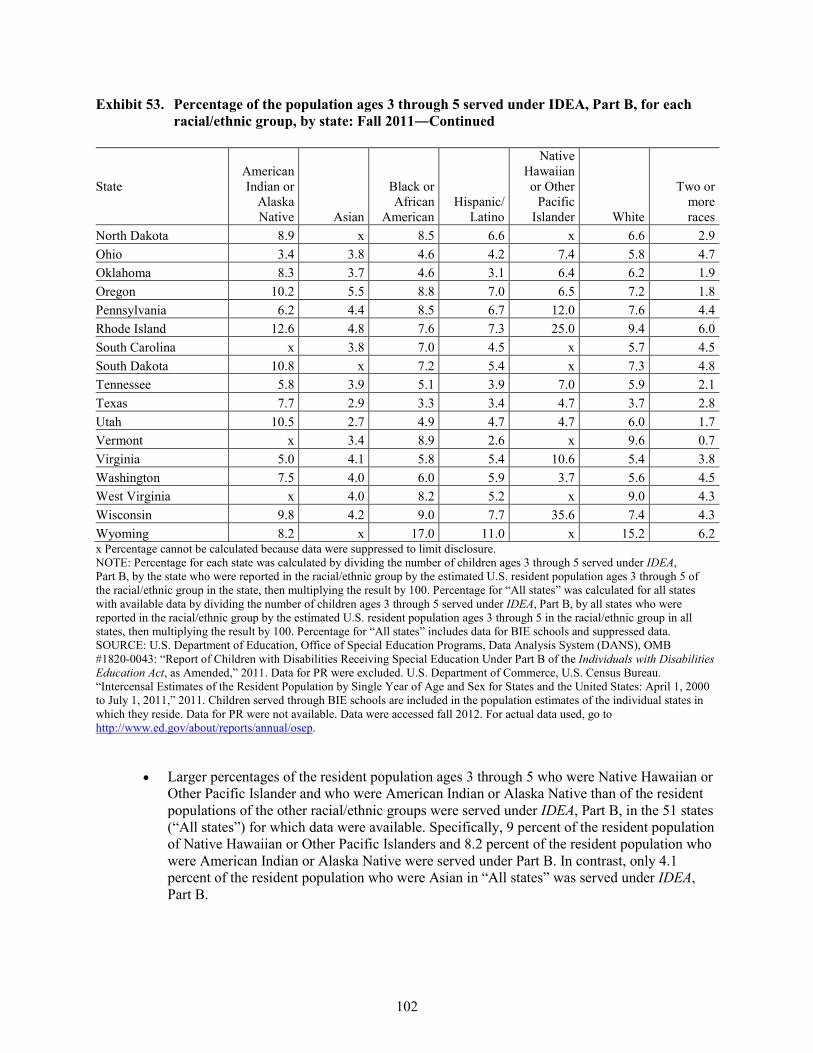
Exhibit 53. Percentage of the population ages 3 through 5 served under IDEA, Part B, for each racial/ethnic group, by state: Fall 2011―Continued
State American Indian or
Alaska Native Asian
Black or African
American Hispanic/
Latino
Native Hawaiian or Other
Pacific Islander White
Two or more races
North Dakota 8.9 x 8.5 6.6 x 6.6 2.9 Ohio 3.4 3.8 4.6 4.2 7.4 5.8 4.7 Oklahoma 8.3 3.7 4.6 3.1 6.4 6.2 1.9 Oregon 10.2 5.5 8.8 7.0 6.5 7.2 1.8 Pennsylvania 6.2 4.4 8.5 6.7 12.0 7.6 4.4 Rhode Island 12.6 4.8 7.6 7.3 25.0 9.4 6.0 South Carolina x 3.8 7.0 4.5 x 5.7 4.5 South Dakota 10.8 x 7.2 5.4 x 7.3 4.8 Tennessee 5.8 3.9 5.1 3.9 7.0 5.9 2.1 Texas 7.7 2.9 3.3 3.4 4.7 3.7 2.8 Utah 10.5 2.7 4.9 4.7 4.7 6.0 1.7 Vermont x 3.4 8.9 2.6 x 9.6 0.7 Virginia 5.0 4.1 5.8 5.4 10.6 5.4 3.8 Washington 7.5 4.0 6.0 5.9 3.7 5.6 4.5 West Virginia x 4.0 8.2 5.2 x 9.0 4.3 Wisconsin 9.8 4.2 9.0 7.7 35.6 7.4 4.3 Wyoming 8.2 x 17.0 11.0 x 15.2 6.2 x Percentage cannot be calculated because data were suppressed to limit disclosure. NOTE: Percentage for each state was calculated by dividing the number of children ages 3 through 5 served under IDEA, Part B, by the state who were reported in the racial/ethnic group by the estimated U.S. resident population ages 3 through 5 of the racial/ethnic group in the state, then multiplying the result by 100. Percentage for “All states” was calculated for all states with available data by dividing the number of children ages 3 through 5 served under IDEA, Part B, by all states who were reported in the racial/ethnic group by the estimated U.S. resident population ages 3 through 5 in the racial/ethnic group in all states, then multiplying the result by 100. Percentage for “All states” includes data for BIE schools and suppressed data. SOURCE: U.S. Department of Education, Office of Special Education Programs, Data Analysis System (DANS), OMB #1820-0043: “Report of Children with Disabilities Receiving Special Education Under Part B of the Individuals with Disabilities Education Act, as Amended,” 2011. Data for PR were excluded. U.S. Department of Commerce, U.S. Census Bureau. “Intercensal Estimates of the Resident Population by Single Year of Age and Sex for States and the United States: April 1, 2000 to July 1, 2011,” 2011. Children served through BIE schools are included in the population estimates of the individual states in which they reside. Data for PR were not available. Data were accessed fall 2012. For actual data used, go to http://www.ed.gov/about/reports/annual/osep.
• Larger percentages of the resident population ages 3 through 5 who were Native Hawaiian or Other Pacific Islander and who were American Indian or Alaska Native than of the resident populations of the other racial/ethnic groups were served under IDEA, Part B, in the 51 states (“All states”) for which data were available. Specifically, 9 percent of the resident population of Native Hawaiian or Other Pacific Islanders and 8.2 percent of the resident population who were American Indian or Alaska Native were served under Part B. In contrast, only 4.1 percent of the resident population who were Asian in “All states” was served under IDEA, Part B.
102

• IDEA, Part B, served 8.2 percent of the resident population who were American Indian or Alaska Native in “All states.” The percentages ranged from 1.8 to 16.3 percent in the 45 individual states for which non-suppressed data were available. The percentage was 15 percent or more in two states: Illinois (16.3 percent) and Kansas (16.1 percent). In contrast, the percentage was 4 percent or less in the following four states: Georgia (4.0 percent), Ohio (3.4 percent), Arkansas (3.4 percent), and Mississippi (1.8 percent).
• IDEA, Part B, served 4.1 percent of the resident population ages 3 through 5 who were Asian in “All states.” The percentages ranged from 2.7 to 6.2 percent in the 47 individual states for which non-suppressed data were available. The percentage was more than 5 percent in nine states but only exceeded 6 percent in Kentucky (6.2 percent). In contrast, the percentage was less than 3 percent in the following four states: North Carolina (2.9 percent), Texas (2.9 percent), Utah (2.7 percent), and Georgia (2.7 percent).
• IDEA, Part B, served 6.1 percent of the resident population ages 3 through 5 who were Black or African American in “All states.” The percentages ranged from 3.3 to 17 percent in the 51 individual states. In the following three states, the percentage was more than 10 percent: Wyoming (17.0 percent), Arkansas (16.7 percent), and New Hampshire (11.2 percent). In contrast, the percentage was less than 4 percent in Texas (3.3 percent).
• IDEA, Part B, served 5.1 percent of the resident population ages 3 through 5 who were Hispanic/Latino in “All states.” The percentages ranged from 1.8 to 11.2 percent in the 51 individual states. In the following four states, the percentage was larger than 8 percent: the District of Columbia (11.2 percent), Wyoming (11.0 percent), New York (9.0 percent), and Massachusetts (8.6 percent). In contrast, the percentage was no more than 3 percent in Montana (3.0 percent), Vermont (2.6 percent), and Alabama (1.8 percent).
• IDEA, Part B, served 9 percent of the resident population ages 3 through 5 who were Native Hawaiian or Other Pacific Islander in “All states.” The percentages ranged from 3.7 to 100 percent in the 41 states for which non-suppressed data were available. The percentage was larger than 40 percent in the following five states: New Hampshire (100 percent), Illinois (63.3 percent), New Jersey (42.4 percent), North Carolina (41.0 percent), and Michigan (40.8 percent). In contrast, the percentage was less than 5 percent in the following six states: Missouri (4.8 percent), Texas (4.7 percent), Arkansas (4.7 percent), Utah (4.7 percent), California (4.4 percent), and Washington (3.7 percent).
• IDEA, Part B, served 6.5 percent of the resident population ages 3 through 5 who were White in “All states.” The percentages ranged from 2.7 to 15.2 percent in the 51 individual states. The percentage was larger than 10 percent in the following three states: Wyoming (15.2 percent), Kentucky (10.6 percent), and Arkansas (10.6 percent). In contrast, the percentage was less than 4 percent in Texas (3.7 percent) and the District of Columbia (2.7 percent).
• IDEA, Part B, served 4.9 percent of the resident population ages 3 through 5 who were associated with multiple races in “All states.” The percentages ranged from 0.7 to 20.8 percent in the 51 individual states. In the following four states, the percentage was larger than 7 percent: New York (20.8 percent), Indiana (8.2 percent), Kentucky (7.3 percent), and Illinois (7.1 percent). In contrast, the percentage was less than 2 percent in 10 states, including Vermont in which less than 1 percent (0.7 percent) of the resident population was served.
103

104
Part B Educational Environments
How did the states compare with regard to the distribution of children ages 3 through 5 served under IDEA, Part B, by educational environment in 2011?
Exhibit 54. Percentage of children ages 3 through 5 served under IDEA, Part B, by educational environment and state: Fall 2011
State
Regular early childhood programa
Separate classb
Separate schoolb
Residential facilityb Home
Service provider locationc
At least 10 hours per week and majority
At least 10 hours per
week, majority
elsewhere
Less than 10 hours per week and majority
Less than 10 hours per
week, majority
elsewhere All states 35.4 15.8 6.2 5.0 24.1 2.8 0.1 2.4 8.4
Alabama 45.7 22.6 6.8 3.7 5.2 1.2 0.2 3.8 10.8 Alaska 26.4 22.8 1.2 5.0 38.5 x x 0.6 5.2 Arizona 39.7 2.2 8.3 1.0 44.8 1.3 x x 2.4 Arkansas 30.7 37.5 0.3 0.4 3.1 24.4 0.1 0.3 3.1 BIE schools — — — — — — — — — California 30.8 6.1 8.2 3.2 32.7 4.1 0.1 4.4 10.5 Colorado 77.2 8.3 7.0 0.8 3.2 3.0 x x 0.5 Connecticut 66.5 5.8 5.0 2.2 13.9 0.7 1.0 0.2 4.7 Delaware 73.5 9.6 6.4 3.0 3.5 2.2 0.0 x x District of Columbia 46.4 28.0 6.3 x 15.0 3.1 x x 0.8 Florida 21.7 12.0 8.1 5.0 44.0 4.8 # 0.6 3.7 Georgia 42.7 22.4 3.4 4.4 21.9 x x 1.5 2.9 Hawaii 26.1 9.9 7.8 31.8 23.3 0.4 x x x Idaho 20.1 8.6 10.2 2.5 45.7 4.6 x x 7.0 Illinois 29.8 21.3 2.4 5.7 28.6 2.6 # 0.2 9.3 Indiana 33.7 9.3 5.0 4.4 33.7 1.5 x x 12.0 Iowa 34.5 35.1 4.1 9.3 9.1 x x 0.8 6.9 Kansas 28.9 21.9 9.7 5.7 32.1 x x 1.3 0.1 Kentucky 61.2 24.9 2.1 1.7 6.3 0.5 0.0 0.5 2.8 Louisiana 19.5 49.4 1.0 15.7 3.8 x x 4.9 5.7 Maine 58.6 15.1 9.3 4.5 7.9 0.9 0.0 0.2 3.5 See notes at end of exhibit.

105
Exhibit 54. Percentage of children ages 3 through 5 served under IDEA, Part B, by educational environment and state: Fall 2011― Continued
State
Regular early childhood programa
Separate classb
Separate schoolb
Residential facilityb Home
Service provider locationc
At least 10 hours per week and majority
At least 10 hours per
week, majority
elsewhere
Less than 10 hours per week and majority
Less than 10 hours per
week, majority
elsewhere Maryland 58.3 2.6 5.3 3.7 17.3 2.3 x x 9.8 Massachusetts 17.7 46.1 6.2 7.3 12.6 1.4 x x 8.5 Michigan 23.2 12.5 4.1 4.2 42.6 x x 1.9 10.0 Minnesota 35.5 15.1 15.9 7.7 19.3 x x 2.7 3.2 Mississippi 57.5 9.8 7.2 2.1 12.3 2.6 0.1 2.1 6.1 Missouri 43.5 16.7 3.7 4.3 21.5 1.4 0.0 0.8 8.0 Montana 39.3 11.0 5.6 x 23.9 3.7 x 1.2 14.0 Nebraska 51.0 2.1 12.0 3.5 14.1 x x 10.3 5.9 Nevada 22.0 8.4 1.9 6.2 53.3 1.1 x x 6.6 New Hampshire 35.5 19.6 14.5 19.6 10.1 x 0.0 x 0.4 New Jersey 31.2 4.9 7.5 15.7 33.7 6.1 0.2 0.3 0.4 New Mexico 38.3 9.6 9.4 1.6 23.1 10.4 x x 7.4 New York 39.3 19.2 2.9 4.0 21.3 5.4 # 6.3 1.4 North Carolina 47.4 14.2 3.6 2.3 18.8 2.3 0.1 2.1 9.2 North Dakota 26.2 30.6 3.1 3.9 26.6 2.1 x x 6.4 Ohio 48.2 3.5 2.4 1.4 35.8 3.8 # 2.2 2.7 Oklahoma 37.2 29.5 2.1 3.7 17.7 0.5 0.4 0.8 8.1 Oregon 24.8 26.3 7.9 10.3 24.5 1.0 0.0 3.4 1.8 Pennsylvania 45.9 2.8 18.8 7.3 13.4 1.6 # 4.6 5.6 Puerto Rico 71.9 2.0 0.0 0.0 0.8 0.0 0.0 14.2 11.1 Rhode Island 42.6 8.7 0.2 x 20.8 1.9 x 0.9 24.8 South Carolina 47.2 11.3 5.5 2.5 22.9 1.0 0.1 1.1 8.4 South Dakota 13.4 51.6 7.5 5.1 15.8 x x 1.2 4.4 Tennessee 9.3 73.6 0.0 x 12.4 0.9 x 0.5 3.2 Texas 10.2 5.4 11.4 4.7 19.6 # 0.1 0.6 48.0 Utah 25.3 2.6 11.0 9.0 39.2 2.1 x x 10.6 See notes at end of exhibit.

106
Exhibit 54. Percentage of children ages 3 through 5 served under IDEA, Part B, by educational environment and state: Fall 2011― Continued
State
Regular early childhood programa
Separate classb
Separate schoolb
Residential facilityb Home
Service provider locationc
At least 10 hours per week and majority
At least 10 hours per
week, majority
elsewhere
Less than 10 hours per week and majority
Less than 10 hours per
week, majority
elsewhere Vermont 58.5 6.1 13.1 2.6 5.4 1.0 0.0 5.1 8.2 Virginia 27.9 12.0 5.6 18.7 26.5 0.3 # 2.6 6.4 Washington 23.3 19.7 4.5 4.3 36.8 2.6 x x 8.4 West Virginia 29.2 49.7 0.5 1.9 10.2 x x 0.8 7.3 Wisconsin 27.8 27.8 3.2 5.4 25.4 0.4 0.1 1.5 8.5 Wyoming 44.2 3.6 15.7 0.7 25.9 4.9 0.0 2.5 2.5 x Percentage cannot be calculated because data were suppressed to limit disclosure. — Percentage cannot be calculated because data were not available. # Percentage was non-zero, but < 0.05 or less than 5/100 of 1 percent. aRegular early childhood program includes a majority (i.e., at least 50 percent) of children without disabilities (i.e., children without individualized education programs). Regular early childhood programs include, but are not limited to, Head Start, kindergarten, preschool classes offered to an eligible pre-kindergarten population by the public school system, private kindergartens or preschools, and group child development center or child care. bSeparate class, separate school, and residential facility are categories of special education programs that include less than 50 percent children without disabilities. cService provider location or some other location not in any other category refers to a situation in which a child receives all special education and related services from a service provider and does not attend a regular early childhood program or special education program in a separate class, separate school, or residential facility. This does not include children who receive special education and related services in the home. An example is a situation in which a child receives only speech instruction, and it is provided in a clinician’s office. NOTE: Percentage for each state was calculated by dividing the number of children ages 3 through 5 served under IDEA, Part B, by the state who were reported in the educational environment by the total number of children ages 3 through 5 served under IDEA, Part B, by the state, then multiplying the result by 100. Percentage for “All states” was calculated for all states with available data by dividing the number of children ages 3 through 5 served under IDEA, Part B, by all states who were reported in the educational environment by the total number of children ages 3 through 5 served under IDEA, Part B, by all states, then multiplying the result by 100. Percentage for “All states” includes suppressed data. SOURCE: U.S. Department of Education, Office of Special Education Programs, Data Analysis System (DANS), OMB #1820-0517: “Part B, Individuals with Disabilities Education Act, Implementation of FAPE Requirements,” 2011. Data were accessed fall 2012. For actual data used, go to http://www.ed.gov/about/reports/annual/osep.

• In 2011, the educational environment category representing children who attended a regular early childhood program for at least 10 hours per week and received the majority of hours of special education and related services in that program accounted for the largest percentage of children ages 3 to 5 served under IDEA, Part B, in the 52 states (“All states”) for which data were available. Specifically, the percentage associated with this category for “All states” was 35.4 percent. The category that accounted for the second largest percentage of students in “All states” was separate class, which accounted for 24.1 percent of the children.
• In 29 individual states, the educational environment category representing children who attended a regular early childhood program for at least 10 hours per week and received the majority of hours of special education and related services in that program accounted for a larger percentage of children than any other category. In the following 10 of those states, the category accounted for a majority of the children: Colorado (77.2 percent), Delaware (73.5 percent), Puerto Rico (71.9 percent), Connecticut (66.5 percent), Kentucky (61.2 percent), Maine (58.6 percent), Vermont (58.5 percent), Maryland (58.3 percent), Mississippi (57.5 percent), and Nebraska (51.0 percent).
• In 12 states, the educational environment category representing children who attended a separate class accounted for a larger percentage of children than any other category. The percentage of children accounted for by a separate class was less than a majority in all of these states except Nevada, in which 53.3 percent were accounted for by this category.
• In nine states, the educational environment category representing children who attended a regular early childhood program for at least 10 hours per week but received the majority of hours of special education and related services elsewhere accounted for a larger percentage of children than any other category. The percentage represented a majority of the children in only South Dakota (51.6) and Tennessee (73.6 percent).
107

108
How did the states compare with regard to the distribution of children ages 3 through 5 served under IDEA, Part B, who were limited English proficient, by educational environment in 2011?
Exhibit 55. Percentage of children ages 3 through 5 served under IDEA, Part B, who were limited English proficient, by educational environment and state: Fall 2011
State
Regular early childhood programa
Separate classb
Separate schoolb
Residential facilityb Home
Service provider locationc
At least 10 hours per week and majority
At least 10 hours per
week, majority
elsewhere
Less than 10 hours per week and majority
Less than 10 hours per
week, majority
elsewhere All states 37.3 10.5 6.5 3.4 25.1 2.8 # 2.3 12.1
Alabama 54.7 25.0 x 7.8 x x 0.0 0.0 x Alaska 38.7 48.0 x 0.0 8.0 x x 0.0 0.0 Arizona 89.1 0.0 x 0.0 0.0 0.0 x x 0.0 Arkansas 19.7 30.2 0.0 x x 43.1 x 0.0 3.7 BIE schools — — — — — — — — — California 32.6 5.5 8.1 2.4 32.6 4.2 0.1 4.5 10.2 Colorado 71.5 15.3 7.6 0.7 4.4 x x x x Connecticut 81.7 4.2 x 1.8 10.5 0.0 x 0.0 x Delaware 93.9 x x 0.0 0.0 0.0 0.0 x x District of Columbia x x x x x x x x x Florida 24.1 12.4 9.5 4.8 43.8 2.6 x x 2.5 Georgia 51.0 33.4 2.2 5.9 7.1 x x 0.0 x Hawaii 37.5 21.6 5.7 6.8 26.1 x x x x Idaho 35.1 15.6 x x 40.3 0.0 x x x Illinois 52.3 8.3 1.3 x 31.6 2.5 x x 3.2 Indiana 57.0 11.3 3.4 x 22.2 0.0 x x 4.4 Iowa 32.6 48.9 0.0 5.4 12.0 x x 0.0 0.0 Kansas 51.4 21.8 9.2 5.6 11.3 x x x 0.0 Kentucky 67.1 21.5 x x 4.7 0.0 0.0 x 0.0 Louisiana 18.6 65.7 x 8.6 x x x 0.0 x Maine 98.3 x x x 0.5 0.7 0.0 x 0.0 Maryland 65.3 2.0 3.7 2.6 15.8 1.5 x x 7.8 See notes at end of exhibit.
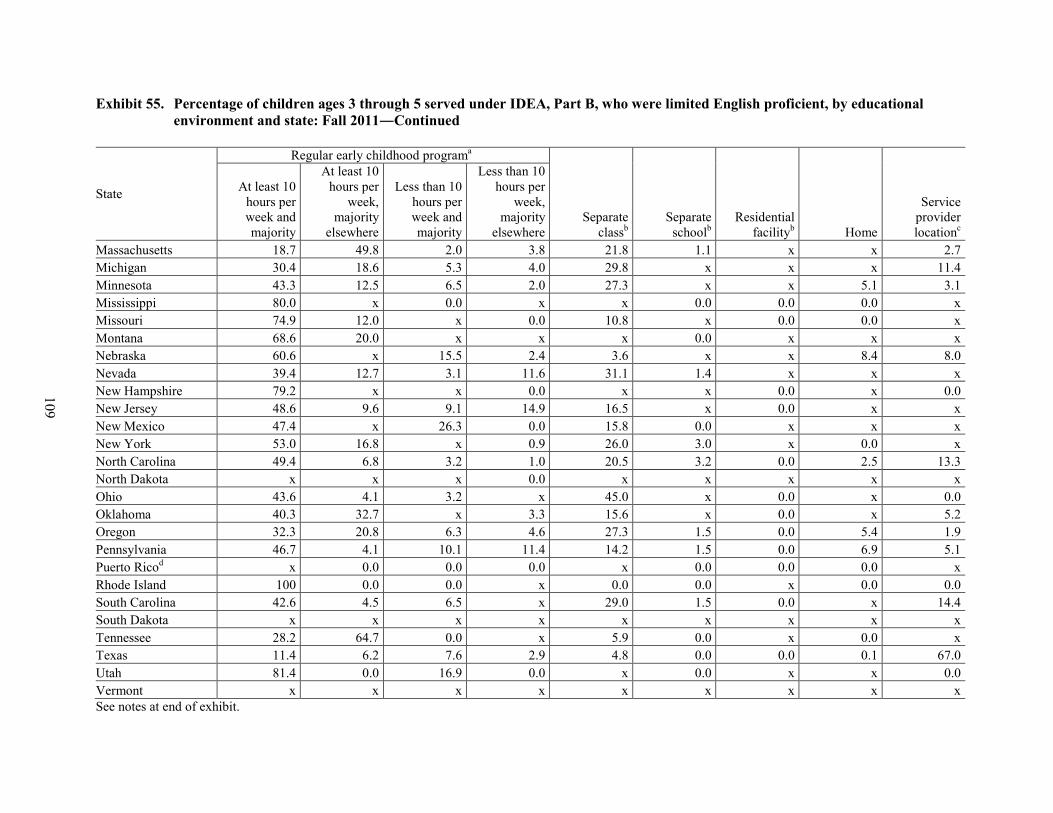
109
Exhibit 55. Percentage of children ages 3 through 5 served under IDEA, Part B, who were limited English proficient, by educational environment and state: Fall 2011―Continued
State
Regular early childhood programa
Separate classb
Separate schoolb
Residential facilityb Home
Service provider locationc
At least 10 hours per week and majority
At least 10 hours per
week, majority
elsewhere
Less than 10 hours per week and majority
Less than 10 hours per
week, majority
elsewhere Massachusetts 18.7 49.8 2.0 3.8 21.8 1.1 x x 2.7 Michigan 30.4 18.6 5.3 4.0 29.8 x x x 11.4 Minnesota 43.3 12.5 6.5 2.0 27.3 x x 5.1 3.1 Mississippi 80.0 x 0.0 x x 0.0 0.0 0.0 x Missouri 74.9 12.0 x 0.0 10.8 x 0.0 0.0 x Montana 68.6 20.0 x x x 0.0 x x x Nebraska 60.6 x 15.5 2.4 3.6 x x 8.4 8.0 Nevada 39.4 12.7 3.1 11.6 31.1 1.4 x x x New Hampshire 79.2 x x 0.0 x x 0.0 x 0.0 New Jersey 48.6 9.6 9.1 14.9 16.5 x 0.0 x x New Mexico 47.4 x 26.3 0.0 15.8 0.0 x x x New York 53.0 16.8 x 0.9 26.0 3.0 x 0.0 x North Carolina 49.4 6.8 3.2 1.0 20.5 3.2 0.0 2.5 13.3 North Dakota x x x 0.0 x x x x x Ohio 43.6 4.1 3.2 x 45.0 x 0.0 x 0.0 Oklahoma 40.3 32.7 x 3.3 15.6 x 0.0 x 5.2 Oregon 32.3 20.8 6.3 4.6 27.3 1.5 0.0 5.4 1.9 Pennsylvania 46.7 4.1 10.1 11.4 14.2 1.5 0.0 6.9 5.1 Puerto Ricod x 0.0 0.0 0.0 x 0.0 0.0 0.0 x Rhode Island 100 0.0 0.0 x 0.0 0.0 x 0.0 0.0 South Carolina 42.6 4.5 6.5 x 29.0 1.5 0.0 x 14.4 South Dakota x x x x x x x x x Tennessee 28.2 64.7 0.0 x 5.9 0.0 x 0.0 x Texas 11.4 6.2 7.6 2.9 4.8 0.0 0.0 0.1 67.0 Utah 81.4 0.0 16.9 0.0 x 0.0 x x 0.0 Vermont x x x x x x x x x See notes at end of exhibit.

110
Exhibit 55. Percentage of children ages 3 through 5 served under IDEA, Part B, who were limited English proficient, by educational environment and state: Fall 2011―Continued
State
Regular early childhood programa
Separate classb
Separate schoolb
Residential facilityb Home
Service provider locationc
At least 10 hours per week and majority
At least 10 hours per
week, majority
elsewhere
Less than 10 hours per week and majority
Less than 10 hours per
week, majority
elsewhere Virginia 36.1 15.4 3.4 32.8 8.8 0.0 x x x Washington 31.6 38.8 4.2 3.3 20.0 1.2 x x x West Virginia 68.4 26.3 0.0 0.0 x x x 0.0 0.0 Wisconsin 31.1 30.4 x 2.8 20.3 x x 1.5 12.3 Wyoming 54.3 x 8.6 x 22.9 0.0 0.0 x x x Percentage cannot be calculated because data were suppressed to limit disclosure. — Percentage cannot be calculated because data were not available. aRegular early childhood program includes a majority (i.e., at least 50 percent) of children without disabilities (i.e., children without individualized education programs). Regular early childhood programs include, but are not limited to, Head Start, kindergarten, preschool classes offered to an eligible pre-kindergarten population by the public school system, private kindergartens or preschools, and group child development center or child care. bSeparate class, separate school, and residential facility are categories of special education programs that include less than 50 percent children without disabilities. cService provider location or some other location not in any other category refers to a situation in which a child receives all special education and related services from a service provider and does not attend a regular early childhood program or special education program in a separate class, separate school, or residential facility. This does not include children who receive special education and related services in the home. An example is a situation in which a child receives only speech instruction, and it is provided in a clinician’s office. dLimited Spanish proficiency is the analogous measure for PR. NOTE: Percentage for each state was calculated by dividing the number of children ages 3 through 5 served under IDEA, Part B, by the state who were limited English proficient and reported in the educational environment by the total number of children ages 3 through 5 served under IDEA, Part B, by the state who were limited English proficient, then multiplying the result by 100. Percentage for “All states” was calculated for all states with available data by dividing the number of children ages 3 through 5 served under IDEA, Part B, by all states who were limited English proficient and reported in the educational environment by the total number of children ages 3 through 5 served under IDEA, Part B, by all states who were limited English proficient, then multiplying the result by 100. Percentage for “All states” includes suppressed data. SOURCE: U.S. Department of Education, Office of Special Education Programs, Data Analysis System (DANS), OMB #1820-0517: “Part B, Individuals with Disabilities Education Act, Implementation of FAPE Requirements,” 2011. Data were accessed fall 2012. For actual data used, go to http://www.ed.gov/about/reports/annual/osep.
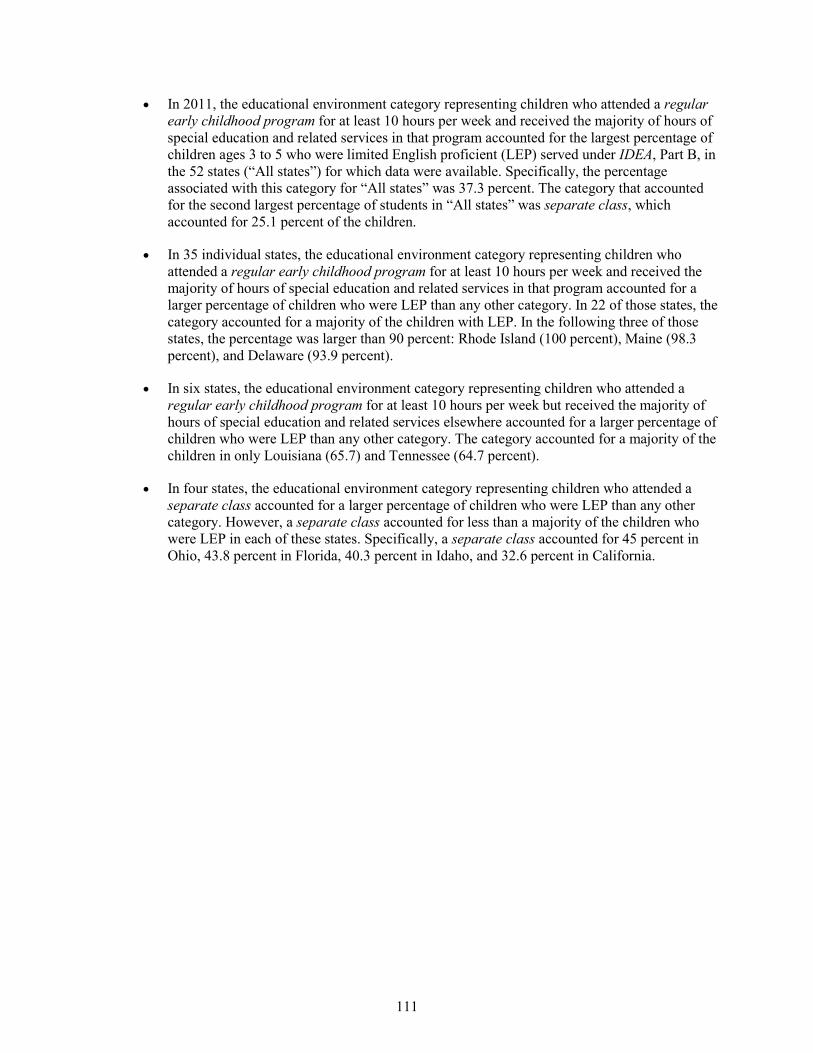
• In 2011, the educational environment category representing children who attended a regular early childhood program for at least 10 hours per week and received the majority of hours of special education and related services in that program accounted for the largest percentage of children ages 3 to 5 who were limited English proficient (LEP) served under IDEA, Part B, in the 52 states (“All states”) for which data were available. Specifically, the percentage associated with this category for “All states” was 37.3 percent. The category that accounted for the second largest percentage of students in “All states” was separate class, which accounted for 25.1 percent of the children.
• In 35 individual states, the educational environment category representing children who attended a regular early childhood program for at least 10 hours per week and received the majority of hours of special education and related services in that program accounted for a larger percentage of children who were LEP than any other category. In 22 of those states, the category accounted for a majority of the children with LEP. In the following three of those states, the percentage was larger than 90 percent: Rhode Island (100 percent), Maine (98.3 percent), and Delaware (93.9 percent).
• In six states, the educational environment category representing children who attended a regular early childhood program for at least 10 hours per week but received the majority of hours of special education and related services elsewhere accounted for a larger percentage of children who were LEP than any other category. The category accounted for a majority of the children in only Louisiana (65.7) and Tennessee (64.7 percent).
• In four states, the educational environment category representing children who attended a separate class accounted for a larger percentage of children who were LEP than any other category. However, a separate class accounted for less than a majority of the children who were LEP in each of these states. Specifically, a separate class accounted for 45 percent in Ohio, 43.8 percent in Florida, 40.3 percent in Idaho, and 32.6 percent in California.
111
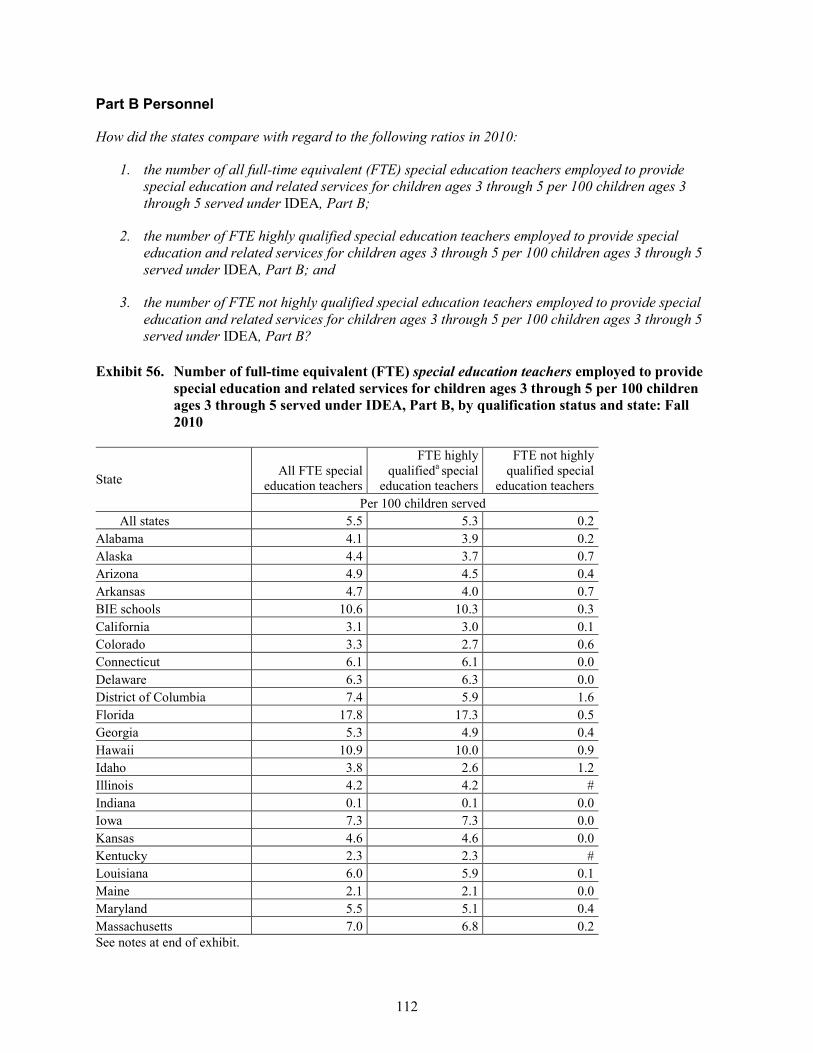
Part B Personnel
How did the states compare with regard to the following ratios in 2010:
1. the number of all full-time equivalent (FTE) special education teachers employed to provide special education and related services for children ages 3 through 5 per 100 children ages 3 through 5 served under IDEA, Part B;
2. the number of FTE highly qualified special education teachers employed to provide special education and related services for children ages 3 through 5 per 100 children ages 3 through 5 served under IDEA, Part B; and
3. the number of FTE not highly qualified special education teachers employed to provide special education and related services for children ages 3 through 5 per 100 children ages 3 through 5 served under IDEA, Part B?
Exhibit 56. Number of full-time equivalent (FTE) special education teachers employed to provide special education and related services for children ages 3 through 5 per 100 children ages 3 through 5 served under IDEA, Part B, by qualification status and state: Fall 2010
State All FTE special
education teachers
FTE highly qualifieda special
education teachers
FTE not highly qualified special
education teachers Per 100 children served
All states 5.5 5.3 0.2 Alabama 4.1 3.9 0.2 Alaska 4.4 3.7 0.7 Arizona 4.9 4.5 0.4 Arkansas 4.7 4.0 0.7 BIE schools 10.6 10.3 0.3 California 3.1 3.0 0.1 Colorado 3.3 2.7 0.6 Connecticut 6.1 6.1 0.0 Delaware 6.3 6.3 0.0 District of Columbia 7.4 5.9 1.6 Florida 17.8 17.3 0.5 Georgia 5.3 4.9 0.4 Hawaii 10.9 10.0 0.9 Idaho 3.8 2.6 1.2 Illinois 4.2 4.2 # Indiana 0.1 0.1 0.0 Iowa 7.3 7.3 0.0 Kansas 4.6 4.6 0.0 Kentucky 2.3 2.3 # Louisiana 6.0 5.9 0.1 Maine 2.1 2.1 0.0 Maryland 5.5 5.1 0.4 Massachusetts 7.0 6.8 0.2 See notes at end of exhibit.
112

Exhibit 56. Number of full-time equivalent (FTE) special education teachers employed to provide special education and related services for children ages 3 through 5 per 100 children ages 3 through 5 served under IDEA, Part B, by qualification status and state: Fall 2010―Continued
State All FTE special
education teachers
FTE highly qualifieda special
education teachers
FTE not highly qualified special
education teachers Per 100 children served
Michigan 3.4 3.4 # Minnesota 4.8 4.6 0.1 Mississippi 1.4 1.3 0.1 Missouri 6.0 6.0 # Montana 3.1 3.0 0.1 Nebraska 3.8 3.5 0.3 Nevada 6.3 4.9 1.4 New Hampshire 9.7 9.7 0.0 New Jersey 6.9 6.8 0.1 New Mexico 6.2 6.2 0.0 New York 7.1 6.9 0.3 North Carolina 8.4 7.0 1.4 North Dakota 4.8 4.8 0.0 Ohio 7.7 7.4 0.3 Oklahoma 5.4 5.3 # Oregon 1.5 1.3 0.2 Pennsylvania 3.9 3.9 # Puerto Rico 1.7 1.6 0.2 Rhode Island 4.8 4.7 0.1 South Carolina 5.6 5.5 0.1 South Dakota 4.6 4.5 # Tennessee 4.2 3.9 0.3 Texas 6.2 6.2 # Utah 3.0 2.8 0.2 Vermont 6.7 6.4 0.2 Virginia 5.2 5.2 # Washington 4.2 4.1 # West Virginia 7.0 5.4 1.7 Wisconsin 3.9 3.9 0.1 Wyoming — — — — Ratio cannot be calculated because data were not available. # Ratio was non-zero, but smaller than 5 per 10,000. aSpecial education teachers reported as highly qualified met the state standard for highly qualified based on the criteria identified in 20 U.S.C. section 1401(10). For highly qualified special education teachers, the term “highly qualified” has the same meaning given the term in section 9101 of the Elementary and Secondary Education Act of 1965, as amended (ESEA), except that such term also includes the requirements described in section 602(10)(B) of IDEA, and the option for teachers to meet the requirements of section 9101 of ESEA by meeting the requirements of section 602(10)(C) or (D) of IDEA [20 U.S.C. section 1401(10)]. In states where teachers who work with children ages 3 through 5 were not included in the state’s definition of highly qualified, teachers were considered highly qualified if they were (a) personnel who held appropriate state certification or licensure for the position held or (b) personnel who held positions for which no state certification or licensure requirements existed.
113

• In 2010, there were 5.5 FTE special education teachers (including those who were highly qualified and not highly qualified) employed to provide special education and related services for children ages 3 through 5 served under IDEA, Part B, per 100 children ages 3 through 5 served under IDEA, Part B, in the 52 states (“All states”) for which data were available. Ratios of 8 or more FTE special education teachers per 100 children were observed in the following five states: Florida (17.8 FTEs per 100 children), Hawaii (10.9 FTEs per 100 children), BIE schools (10.6 FTEs per 100 children), New Hampshire (9.7 FTEs per 100 children), and North Carolina (8.4 FTEs per 100 children). In contrast, the following four states had ratios of less than 2 FTEs per 100 children: Puerto Rico (1.7 FTEs per 100 children), Oregon (1.5 FTEs per 100 children), Mississippi (1.4 FTEs per 100 children), and Indiana (0.1 FTE per 100 children).
• In 2010, there were 5.3 FTE highly qualified special education teachers employed in “All states” to provide special education and related services for children ages 3 through 5 per 100 children ages 3 through 5 served under IDEA, Part B. A ratio of 8 or more FTE highly qualified special education teachers per 100 children was observed for four states. Those states were Florida (17.3 FTEs per 100 children), BIE schools (10.3 FTEs per 100 children), Hawaii (10.0 FTEs per 100 children), and New Hampshire (9.7 FTEs per 100 children). Yet, a ratio smaller than 2 FTE highly qualified special education teachers per 100 children was found for the following four states that reported some FTE special education teachers: Puerto Rico (1.6 FTEs per 100 children), Oregon (1.3 FTEs per 100 children), Mississippi (1.3 FTEs per 100 children), and Indiana (0.1 FTE per 100 children).
• In 2010, there was 0.2 FTE not highly qualified special education teachers employed in “All states” to provide special education and related services for children ages 3 through 5 per 100 children ages 3 through 5 served under IDEA, Part B. The ratio was smaller than 1 FTE per 100 children for all but the following five states: West Virginia (1.7 FTEs per 100 children), the District of Columbia (1.6 FTEs per 100 children), Nevada (1.4 FTEs per 100 children), North Carolina (1.4 FTEs per 100 children), and Idaho (1.2 FTEs per 100 children).
NOTE: Ratio for each state was calculated by dividing the number of all FTE special education teachers, FTE highly qualified special education teachers, or FTE not highly qualified special education teachers employed to provide special education and related services for children ages 3 through 5 by the state by the total number of children ages 3 through 5 served under IDEA, Part B, by the state, then multiplying the result by 100. Ratio for “All states” was calculated for all states with available data by dividing the number of all FTE special education teachers, FTE highly qualified special education teachers, or FTE not highly qualified special education teachers employed to provide special education and related services for children ages 3 through 5 by all states by the total number of children ages 3 through 5 served under IDEA, Part B, by all states, then multiplying the result by 100. SOURCE: U.S. Department of Education, Office of Special Education Programs, Data Analysis System (DANS), OMB #1820-0518: “Personnel (in Full-Time Equivalency of Assignment) Employed to Provide Special Education and Related Services for Children with Disabilities,” 2010. Data were accessed summer 2012. Data Analysis System (DANS), OMB #1820-0043: “Report of Children with Disabilities Receiving Special Education Under Part B of the Individuals with Disabilities Education Act, as Amended,” 2010. Data were accessed spring 2012. For actual data used, go to http://www.ed.gov/about/reports/annual/osep.
114

Students Ages 6 Through 21 Served Under IDEA, Part B
Part B Child Count
How did the states compare with regard to the percentage of the resident population ages 6 through 21 served under IDEA, Part B, in 2011, and how did the percentages change between 2004 and 2011?
Exhibit 57. Percentage of the population ages 6 through 21 served under IDEA, Part B, by year and state: Fall 2004 and fall 2011
State 2004 2011 All states 9.1 8.4
Alabama 8.4 7.0 Alaska 9.4 9.5 Arizona 8.2 7.7 Arkansas 9.2 8.0 California 7.3 7.1 Colorado 7.1 6.8 Connecticut 8.4 7.9 Delaware 9.1 8.8 District of Columbia 11.2 10.2 Florida 10.3 8.6 Georgia 8.6 7.2 Hawaii 7.5 6.3 Idaho 7.3 6.2 Illinois 10.0 9.0 Indiana 10.8 9.9 Iowa 10.0 9.0 Kansas 8.7 8.5 Kentucky 9.5 8.8 Louisiana 8.4 7.0 Maine 11.7 11.0 Maryland 8.1 7.3 Massachusetts 10.6 11.0 Michigan 9.3 8.6 Minnesota 8.8 9.4 Mississippi 8.7 7.9 Missouri 9.8 8.4 Montana 8.3 7.0 Nebraska 10.0 9.6 Nevada 8.3 7.2 New Hampshire 9.9 9.5 New Jersey 12.2 11.2 New Mexico 9.9 8.9 New York 9.3 9.6 North Carolina 9.2 8.1 See notes at end of exhibit.
115

Exhibit 57. Percentage of the population ages 6 through 21 served under IDEA, Part B, by year and state: Fall 2004 and fall 2011―Continued
State 2004 2011 North Dakota 8.5 7.8 Ohio 9.3 9.4 Oklahoma 10.7 10.7 Oregon 8.9 9.1 Pennsylvania 9.5 9.9 Puerto Rico 8.3 13.7 Rhode Island 11.8 9.7 South Carolina 10.5 8.9 South Dakota 8.3 8.5 Tennessee 8.6 8.1 Texas 8.7 6.5 Utah 8.0 8.3 Vermont 8.7 9.2 Virginia 9.5 8.5 Washington 8.0 8.0 West Virginia 12.2 10.7 Wisconsin 8.9 8.8 Wyoming 9.5 10.0 NOTE: Percentage for each state was calculated by dividing the number of children ages 6 through 21 served under IDEA, Part B, by the state in the year by the estimated U.S. resident population ages 6 through 21 in the state for that year, then multiplying the result by 100. Percentage for “All states” was calculated by dividing the number of children ages 6 through 21 served under IDEA, Part B, by all states in the year by the estimated U.S. resident population ages 6 through 21 in all states for that year, then multiplying the result by 100. Percentage for “All states” includes data for children served by BIE schools. SOURCE: U.S. Department of Education, Office of Special Education Programs, Data Analysis System (DANS), OMB #1820-0043: “Report of Children with Disabilities Receiving Special Education Under Part B of the Individuals with Disabilities Education Act, as Amended,” 2004 and 2011. U.S. Department of Commerce, U.S. Census Bureau. “Intercensal Estimates of the Resident Population by Single Year of Age and Sex for States and the United States: April 1, 2000 to July 1, 2011,” 2004 and 2011. Children served through BIE schools are included in the population estimates of the individual states in which they reside. Data for 2004 were accessed spring 2012. Data for 2011 were accessed fall 2012. For actual data used, go to http://www.ed.gov/about/reports/annual/osep.
• In 2011, 8.4 percent of the resident population ages 6 through 21 in “All states” were served under IDEA, Part B. The percentages observed for the 52 individual states ranged from 6.2 percent to 13.7 percent. Percentages of 10 or more were observed in the following seven states: Puerto Rico (13.7 percent), New Jersey (11.2 percent), Maine (11.0 percent), Massachusetts (11.0 percent), Oklahoma (10.7 percent), West Virginia (10.7 percent), and the District of Columbia (10.2 percent). In the following four states, less than 7 percent of the resident population was served: Colorado (6.8 percent), Texas (6.5 percent), Hawaii (6.3 percent), and Idaho (6.2 percent).
• In 2004, 9.1 percent of the resident population ages 6 through 21 in “All states” were served under IDEA, Part B.
• In 12 of the 52 individual states, the percentage of the resident population served under IDEA, Part B, increased between 2004 and 2011. However, the increase represented a percent change of more than 10 percent in only Puerto Rico (63.5 percent).
116

• In 38 of the 52 individual states, the percentage of the population served decreased between 2004 and 2011. In 16 states, the decrease represented a percent change of more than 10 percent, but the decrease represented a change larger than 20 percent in only Texas (-24.8 percent).
117

How did the states compare with regard to the percentage of the resident population ages 6 through 21 within each racial/ethnic group who were served under IDEA, Part B, in 2011?
Exhibit 58. Percentage of the population ages 6 through age 21 served under IDEA, Part B, for each racial/ethnic group, by state: Fall 2011
State American Indian or
Alaska Native Asian
Black or African
American Hispanic/
Latino
Native Hawaiian or
Other Pacific
Islander White
Two or more races
All states 13.4 4.1 11.2 8.0 13.1 8.1 6.3 Alabama 8.6 3.2 9.1 3.8 3.4 6.4 2.1 Alaska 15.7 5.6 12.0 8.0 13.2 8.2 7.7 Arizona 10.1 4.2 11.6 7.6 7.0 7.5 3.5 Arkansas 7.8 4.0 10.5 6.6 8.2 7.8 5.0 California 14.4 3.8 12.1 7.4 8.4 7.0 5.2 Colorado 12.2 3.9 10.7 7.8 8.3 6.1 6.5 Connecticut 15.0 3.9 11.2 9.6 10.7 7.2 4.3 Delaware x 3.7 13.8 8.9 x 7.2 3.4 District of Columbia x 1.4 14.8 8.5 x 1.7 1.5 Florida 13.5 4.2 10.9 8.4 9.0 8.0 9.1 Georgia 7.8 3.4 8.3 6.5 6.7 6.8 8.4 Hawaii 21.6 5.2 8.9 3.0 24.2 6.1 1.5 Idaho 11.2 4.5 10.0 6.3 8.8 6.2 4.5 Illinois 25.1 4.1 11.6 8.2 36.3 8.9 10.0 Indiana 17.9 3.7 12.7 7.6 10.7 9.6 16.2 Iowa 17.2 4.0 18.9 10.9 13.5 8.4 9.5 Kansas 12.9 3.9 12.3 7.9 12.3 7.7 19.2 Kentucky 8.1 4.0 11.7 6.2 4.8 8.7 6.4 Louisiana 7.7 2.9 9.1 3.6 7.0 6.1 2.6 Maine 18.8 6.0 13.6 9.3 28.4 11.2 4.6 Maryland 9.8 3.5 9.8 7.8 13.1 6.1 5.7 Massachusetts 16.7 4.8 14.0 15.1 25.2 10.3 9.7 Michigan 14.3 3.8 11.2 7.7 21.4 8.4 5.5 Minnesota 21.3 7.0 17.0 10.9 15.4 8.7 6.4 Mississippi 3.3 3.6 9.0 4.0 3.4 7.5 2.4 Missouri 11.1 4.8 11.5 5.8 5.9 8.3 4.3 Montana 12.4 4.9 9.2 6.1 25.1 6.6 3.6 Nebraska 19.6 5.8 14.7 10.7 11.8 8.9 11.1 Nevada 16.1 3.0 11.5 6.7 9.0 7.2 6.5 New Hampshire 11.4 3.7 15.1 7.7 24.1 9.9 0.7 New Jersey 8.8 5.2 14.6 10.7 41.6 11.7 3.1 See notes at end of exhibit.
118

Exhibit 58. Percentage of the population ages 6 through age 21 served under IDEA, Part B, for each racial/ethnic group, by state: Fall 2011―Continued
State American Indian or
Alaska Native Asian
Black or African
American Hispanic/
Latino
Native Hawaiian or
Other Pacific
Islander White
Two or more races
New Mexico 10.2 5.0 11.2 9.2 5.8 8.3 5.0 New York 17.7 4.6 13.4 11.6 22.2 8.5 2.6 North Carolina 10.9 3.3 10.9 7.3 7.5 7.1 9.5 North Dakota 11.4 3.6 11.8 7.9 23.5 7.6 2.7 Ohio 9.7 3.7 12.5 7.1 7.6 9.0 11.8 Oklahoma 17.3 4.7 14.6 8.1 10.0 10.6 4.1 Oregon 16.6 5.0 15.8 9.8 9.1 8.9 6.5 Pennsylvania 12.8 4.2 13.7 10.0 10.9 9.7 3.3 Rhode Island 20.5 4.0 13.8 11.6 16.9 9.0 7.2 South Carolina 8.4 4.1 11.8 6.3 6.9 7.6 8.0 South Dakota 11.9 6.1 13.7 8.6 10.8 8.0 4.3 Tennessee 7.4 4.0 10.4 6.0 6.8 8.0 2.1 Texas 10.6 2.9 9.1 6.6 7.9 5.8 5.7 Utah 14.6 4.5 13.1 9.0 8.3 8.3 3.7 Vermont 5.5 2.7 11.9 3.1 26.5 9.7 0.8 Virginia 11.7 4.6 11.5 9.7 11.9 7.5 7.9 Washington 13.1 4.5 12.7 9.4 7.0 7.7 7.3 West Virginia 7.1 4.4 12.7 5.5 6.8 11.0 3.9 Wisconsin 17.7 6.2 16.3 9.4 13.4 7.9 6.0 Wyoming 13.3 4.8 11.4 10.1 12.5 10.0 6.2 x Percentage cannot be calculated because data were suppressed to limit disclosure. NOTE: Percentage for each state was calculated by dividing the number of students ages 6 through 21 served under IDEA, Part B, by the state who were reported in the racial/ethnic group by the estimated U.S. resident population ages 6 through 21 of the racial/ethnic group in the state, then multiplying the result by 100. Percentage for “All states” was calculated for all states with available data by dividing the number of students ages 6 through 21 served under IDEA, Part B, by all states who were reported in the racial/ethnic group by the estimated U.S. resident population ages 6 through 21 in the racial/ethnic group in all states, then multiplying the result by 100. Percentage for “All states” includes data for BIE schools and suppressed data. SOURCE: U.S. Department of Education, Office of Special Education Programs, Data Analysis System (DANS), OMB #1820-0043: “Report of Children with Disabilities Receiving Special Education Under Part B of the Individuals with Disabilities Education Act, as Amended,” 2011. Data for PR were excluded. U.S. Department of Commerce, U.S. Census Bureau. “Intercensal Estimates of the Resident Population by Single Year of Age and Sex for States and the United States: April 1, 2000 to July 1, 2011,” 2011. Data for PR were not available. Children served through BIE schools are included in the population estimates of the individual states in which they reside. Data were accessed fall 2012. For actual data used, go to http://www.ed.gov/about/reports/annual/osep.
• Larger percentages of the resident population ages 6 through 21 who were American Indian or Alaska Native and who were Native Hawaiian or Other Pacific Islander than of the resident populations of the other racial/ethnic groups were served under IDEA, Part B, in the 51 states (“All states”) for which data were available. Specifically, 13.4 percent of the resident population who were American Indian or Alaska Native and 13.1 percent of the resident population who were Native Hawaiian or Other Pacific Islanders were served under Part B. In contrast, only 4.1 percent of the resident population who were Asian in “All states” were served under IDEA, Part B.
119

• IDEA, Part B, served 13.4 percent of the resident population who were American Indian or Alaska Native in “All states.” The percentages ranged from 3.3 to 25.1 percent in the 49 individual states for which non-suppressed data were available. In the following four states, the percentage was larger than 20 percent: Illinois (25.1 percent), Hawaii (21.6 percent), Minnesota (21.3 percent), and Rhode Island (20.5 percent). In contrast, the percentage was less than 6 percent in Vermont (5.5 percent) and Mississippi (3.3 percent).
• IDEA, Part B, served 4.1 percent of the resident population ages 6 through 21 who were Asian in “All states.” The percentages ranged from 1.4 to 7 percent in the 51 individual states. In the following three states, the percentage was 6 percent or more: Minnesota (7.0 percent), Wisconsin (6.2 percent), and South Dakota (6.1 percent). In contrast, the percentage was less than 3 percent in Louisiana (2.9 percent), Texas (2.9 percent), Vermont (2.7 percent), and the District of Columbia (1.4 percent).
• IDEA, Part B, served 11.2 percent of the resident population ages 6 through 21 who were Black or African American in “All states.” The percentages ranged from 8.3 to 18.9 percent in the 51 individual states. In the following five states, the percentage was 15 percent or more: Iowa (18.9 percent), Minnesota (17.0 percent), Wisconsin (16.3 percent), Oregon (15.8 percent), and New Hampshire (15.1 percent). In contrast, the percentage was 9 percent or less in the following three states: Mississippi (9.0 percent), Hawaii (8.9 percent), and Georgia (8.3 percent).
• IDEA, Part B, served 8 percent of the resident population ages 6 through 21 who were Hispanic/Latino in “All states.” The percentages ranged from 3 to 15.1 percent in the 51 individual states. In the following three states, the percentage was 11 percent or more: Massachusetts (15.1 percent), New York (11.6 percent), and Rhode Island (11.6 percent). In contrast, the percentage was less than 4 percent in four states: Alabama (3.8 percent), Louisiana (3.6 percent), Vermont (3.1 percent), and Hawaii (3.0 percent).
• IDEA, Part B, served 13.1 percent of the resident population ages 6 through 21 who were Native Hawaiian or Other Pacific Islander in “All states.” The percentages ranged from 3.4 to 41.6 percent in the 49 states for which non-suppressed data were available. The percentage was 30 percent or more in New Jersey (41.6 percent) and Illinois (36.3 percent). In contrast, the percentage was less than 4 percent in Mississippi (3.4 percent) and Alabama (3.4 percent).
• IDEA, Part B, served 8.1 percent of the resident population ages 6 through 21 who were White in “All states.” The percentages ranged from 1.7 to 11.7 percent in the 51 individual states. The percentage was 10 percent or more in the following five states: New Jersey (11.7 percent), Maine (11.2 percent), West Virginia (11.0 percent), Oklahoma (10.6 percent), and Massachusetts (10.3 percent). In contrast, the percentage was less than 6 percent in Texas (5.8 percent), and the District of Columbia (1.7 percent).
• IDEA, Part B, served 6.3 percent of the resident population ages 6 through 21 who were associated with multiple races in “All states.” The percentages ranged from 0.7 to 19.2 percent in the 51 individual states. In the following five states, the percentage was 10 percent or more: Kansas (19.2 percent), Indiana (16.2 percent), Ohio (11.8 percent), Nebraska (11.1 percent), and Illinois (10.0 percent). In contrast, the percentage was less than 1 percent in Vermont (0.8 percent), and New Hampshire (0.7 percent).
120

How did the states compare with regard to the percentage of students ages 6 through 21 served under IDEA, Part B, who were reported under the category of autism in 2011, and how did the percentages change between 2004 and 2011?
Exhibit 59. Percentage of students ages 6 through 21 served under IDEA, Part B, reported under the category of autism, by year and state: Fall 2004 and fall 2011
State 2004 percent
2011 percent
Change between 2004 and 2011a
Percent change between 2004
and 2011b All states 2.7 7.0 4.3 158.5
Alabama 1.9 6.1 4.2 226.6 Alaska 2.2 5.3 3.1 140.4 Arizona 2.5 7.0 4.5 183.0 Arkansas 2.1 5.7 3.6 169.4 BIE schools 0.3 — — — California 3.7 9.6 5.9 160.3 Colorado 1.5 5.4 3.9 264.2 Connecticut 3.7 10.1 6.4 175.4 Delaware 2.6 5.6 3.0 113.0 District of Columbia 1.5 4.4 2.9 184.2 Florida 1.9 6.0 4.1 218.4 Georgia 2.7 7.1 4.5 168.1 Hawaii 3.5 6.6 3.1 89.4 Idaho 2.8 8.5 5.7 204.1 Illinois 2.4 6.3 3.9 161.5 Indiana 3.6 7.9 4.3 121.0 Iowa 1.8 1.1 -0.7 -38.8 Kansas 2.0 4.6 2.5 123.4 Kentucky 1.8 4.8 3.0 166.6 Louisiana 2.1 4.8 2.7 130.2 Maine 3.0 8.4 5.4 179.3 Maryland 4.1 9.3 5.3 129.4 Massachusetts 3.1 7.3 4.2 136.7 Michigan 3.4 7.5 4.1 122.8 Minnesota 6.1 12.8 6.7 109.8 Mississippi 1.2 4.7 3.5 288.4 Missouri 2.5 6.9 4.5 182.3 Montana 1.5 2.8 1.4 94.4 Nebraska 1.7 5.4 3.7 217.1 Nevada 2.7 8.3 5.6 210.7 New Hampshire 2.4 6.5 4.1 169.9 New Jersey 2.5 6.5 4.0 156.4 New Mexico 0.9 3.8 2.9 318.0 New York 2.8 5.8 3.0 107.7 North Carolina 2.7 7.0 4.2 153.4 North Dakota 1.9 5.8 3.9 208.4 Ohio 2.6 6.9 4.3 163.1 See notes at end of exhibit.
121
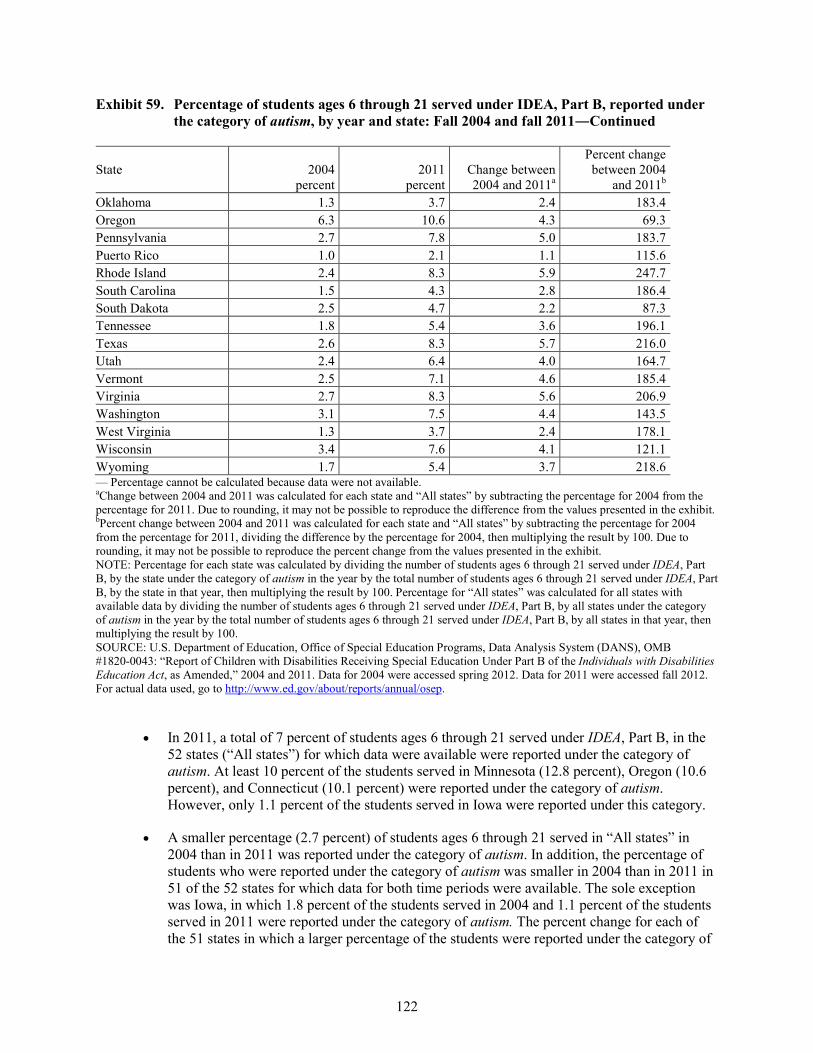
Exhibit 59. Percentage of students ages 6 through 21 served under IDEA, Part B, reported under the category of autism, by year and state: Fall 2004 and fall 2011―Continued
State 2004 percent
2011 percent
Change between 2004 and 2011a
Percent change between 2004
and 2011b Oklahoma 1.3 3.7 2.4 183.4 Oregon 6.3 10.6 4.3 69.3 Pennsylvania 2.7 7.8 5.0 183.7 Puerto Rico 1.0 2.1 1.1 115.6 Rhode Island 2.4 8.3 5.9 247.7 South Carolina 1.5 4.3 2.8 186.4 South Dakota 2.5 4.7 2.2 87.3 Tennessee 1.8 5.4 3.6 196.1 Texas 2.6 8.3 5.7 216.0 Utah 2.4 6.4 4.0 164.7 Vermont 2.5 7.1 4.6 185.4 Virginia 2.7 8.3 5.6 206.9 Washington 3.1 7.5 4.4 143.5 West Virginia 1.3 3.7 2.4 178.1 Wisconsin 3.4 7.6 4.1 121.1 Wyoming 1.7 5.4 3.7 218.6 — Percentage cannot be calculated because data were not available. aChange between 2004 and 2011 was calculated for each state and “All states” by subtracting the percentage for 2004 from the percentage for 2011. Due to rounding, it may not be possible to reproduce the difference from the values presented in the exhibit. bPercent change between 2004 and 2011 was calculated for each state and “All states” by subtracting the percentage for 2004 from the percentage for 2011, dividing the difference by the percentage for 2004, then multiplying the result by 100. Due to rounding, it may not be possible to reproduce the percent change from the values presented in the exhibit. NOTE: Percentage for each state was calculated by dividing the number of students ages 6 through 21 served under IDEA, Part B, by the state under the category of autism in the year by the total number of students ages 6 through 21 served under IDEA, Part B, by the state in that year, then multiplying the result by 100. Percentage for “All states” was calculated for all states with available data by dividing the number of students ages 6 through 21 served under IDEA, Part B, by all states under the category of autism in the year by the total number of students ages 6 through 21 served under IDEA, Part B, by all states in that year, then multiplying the result by 100. SOURCE: U.S. Department of Education, Office of Special Education Programs, Data Analysis System (DANS), OMB #1820-0043: “Report of Children with Disabilities Receiving Special Education Under Part B of the Individuals with Disabilities Education Act, as Amended,” 2004 and 2011. Data for 2004 were accessed spring 2012. Data for 2011 were accessed fall 2012. For actual data used, go to http://www.ed.gov/about/reports/annual/osep.
• In 2011, a total of 7 percent of students ages 6 through 21 served under IDEA, Part B, in the 52 states (“All states”) for which data were available were reported under the category of autism. At least 10 percent of the students served in Minnesota (12.8 percent), Oregon (10.6 percent), and Connecticut (10.1 percent) were reported under the category of autism. However, only 1.1 percent of the students served in Iowa were reported under this category.
• A smaller percentage (2.7 percent) of students ages 6 through 21 served in “All states” in 2004 than in 2011 was reported under the category of autism. In addition, the percentage of students who were reported under the category of autism was smaller in 2004 than in 2011 in 51 of the 52 states for which data for both time periods were available. The sole exception was Iowa, in which 1.8 percent of the students served in 2004 and 1.1 percent of the students served in 2011 were reported under the category of autism. The percent change for each of the 51 states in which a larger percentage of the students were reported under the category of
122

autism in 2011 than in 2004 exceeded 69 percent. Moreover, percentage increases of more than 200 percent were found in 13 states.
123

How did the states compare with regard to the percentage of students ages 6 through 21 served under IDEA, Part B, who were reported under the category of other health impairments in 2011, and how did the percentages change between 2004 and 2011?
Exhibit 60. Percentage of students ages 6 through 21 served under IDEA, Part B, reported under the category of other health impairments, by year and state: Fall 2004 and fall 2011
State 2004 percent
2011 percent
Change between 2004 and 2011a
Percent change between 2004
and 2011b All states 8.4 12.7 4.3 51.6
Alabama 7.0 11.1 4.1 57.8 Alaska 5.7 14.0 8.3 144.5 Arizona 4.1 7.8 3.7 89.2 Arkansas 13.6 16.8 3.3 24.2 BIE schools 3.7 — — — California 5.3 9.5 4.3 81.1 Colorado — — — — Connecticut 15.8 19.9 4.1 25.6 Delaware — 12.8 12.8 — District of Columbia 3.0 10.0 7.1 239.4 Florida 4.8 8.0 3.2 67.8 Georgia 12.9 15.9 3.0 23.0 Hawaii 11.6 15.4 3.7 32.1 Idaho 7.5 14.9 7.4 97.9 Illinois 6.5 10.7 4.2 63.8 Indiana 5.1 9.9 4.9 95.6 Iowa 0.9 0.1 -0.7 -84.4 Kansas 12.1 12.5 0.4 3.3 Kentucky 13.9 17.1 3.2 23.0 Louisiana 11.0 13.4 2.4 21.6 Maine 13.6 20.3 6.7 49.0 Maryland 11.9 17.6 5.7 47.8 Massachusetts 4.7 10.1 5.5 117.6 Michigan 5.8 10.3 4.5 77.2 Minnesota 11.2 15.3 4.1 36.6 Mississippi 5.5 13.6 8.1 148.5 Missouri 10.2 17.6 7.4 73.0 Montana 9.1 12.2 3.1 33.7 Nebraska 10.5 13.9 3.4 32.6 Nevada 6.2 8.9 2.7 42.9 New Hampshire 16.0 18.7 2.7 17.1 New Jersey 8.8 17.1 8.3 95.1 New Mexico 6.7 8.3 1.6 24.5 New York 10.5 15.0 4.5 42.8 North Carolina 13.5 18.6 5.1 37.3 North Dakota 9.1 14.7 5.6 60.9 Ohio 6.8 13.5 6.7 97.6 See notes at end of exhibit.
124

Exhibit 60. Percentage of students ages 6 through 21 served under IDEA, Part B, reported under the category of other health impairments, by year and state: Fall 2004 and fall 2011― Continued
State 2004 percent
2011 percent
Change between 2004 and 2011a
Percent change between 2004
and 2011b Oklahoma 7.4 13.7 6.3 84.9 Oregon 10.1 14.4 4.3 42.3 Pennsylvania 3.5 10.2 6.7 192.0 Puerto Rico 4.5 9.6 5.0 110.8 Rhode Island 14.5 16.1 1.7 11.6 South Carolina 6.7 11.7 5.0 74.4 South Dakota 8.2 11.8 3.6 43.3 Tennessee 10.1 12.2 2.1 20.8 Texas 11.2 13.1 2.0 17.6 Utah 5.0 8.1 3.1 61.4 Vermont 14.5 16.3 1.8 12.6 Virginia 15.3 20.2 4.8 31.7 Washington 18.0 20.0 2.0 11.0 West Virginia 9.0 13.4 4.4 49.3 Wisconsin 10.2 16.9 6.8 66.6 Wyoming 11.9 15.5 3.6 30.3 — Percentage cannot be calculated because data were not available. aChange between 2004 and 2011 was calculated for each state and “All states” by subtracting the percentage for 2004 from the percentage for 2011. Due to rounding, it may not be possible to reproduce the difference from the values presented in the exhibit. bPercent change between 2004 and 2011 was calculated for each state and “All states” by subtracting the percentage for 2004 from the percentage for 2011, dividing the difference by the percentage for 2004, then multiplying the result by 100. Due to rounding, it may not be possible to reproduce the percent change from the values presented in the exhibit. NOTE: Percentage for each state was calculated by dividing the number of students ages 6 through 21 served under IDEA, Part B, by the state under the category of other health impairments in the year by the total number of students ages 6 through 21 served under IDEA, Part B, by the state in that year, then multiplying the result by 100. Percentage for “All states” was calculated for all states with available data by dividing the number of students ages 6 through 21 served under IDEA, Part B, by all states under the category of other health impairments in the year by the total number of students ages 6 through 21 served under IDEA, Part B, by all states in that year, then multiplying the result by 100. SOURCE: U.S. Department of Education, Office of Special Education Programs, Data Analysis System (DANS), OMB #1820-0043: “Report of Children with Disabilities Receiving Special Education Under Part B of the Individuals with Disabilities Education Act, as Amended,” 2004 and 2011. Data for 2004 were accessed spring 2012. Data for 2011 were accessed fall 2012. For actual data used, go to http://www.ed.gov/about/reports/annual/osep.
• In 2011, 12.7 percent of the students ages 6 through 21 served under IDEA, Part B, in the 51 states (“All states”) for which data were available were reported under the category of other health impairments. However, no more than 8 percent of the students served in the following three states were reported under the category of other health impairments: Florida (8.0 percent), Arizona (7.8 percent), and Iowa (0.1 percent). In contrast, more than 18 percent of the students served in the following six states were reported under the category of other health impairments: Maine (20.3 percent), Virginia (20.2 percent), Washington (20.0 percent), Connecticut (19.9 percent), New Hampshire (18.7 percent), and North Carolina (18.6 percent).
125

• In 2004, 8.4 percent of students ages 6 through 21 served under IDEA, Part B, in the 51 states (“All states”) for which data were available were reported under the category of other health impairments.
• In each of the 50 states for which data were available for both years, except Iowa, the percentage of students reported under the category of other health impairments was smaller in 2004 than in 2011. In 2004, 0.9 percent of the students ages 6 through 21 served under IDEA, Part B, in Iowa were reported under the category of other health impairments. The comparable value for 2011 in Iowa was 0.1 percent.
• The percent changes observed for the states for which an increase was found between 2004 and 2011 varied greatly. For example, the percentage of children reported under the category of other health impairments increased by more than 100 percent between 2004 and 2011 in the following six states: the District of Columbia (239.4 percent), Pennsylvania (192.0 percent), Mississippi (148.5 percent), Alaska (144.5 percent), Massachusetts (117.6 percent), and Puerto Rico (110.8 percent). In contrast, a percent change increase of less than 20 percent was observed in the following six states: Texas (17.6 percent), New Hampshire (17.1 percent), Vermont (12.6 percent), Rhode Island (11.6 percent), Washington (11.0 percent), and Kansas (3.3 percent).
126
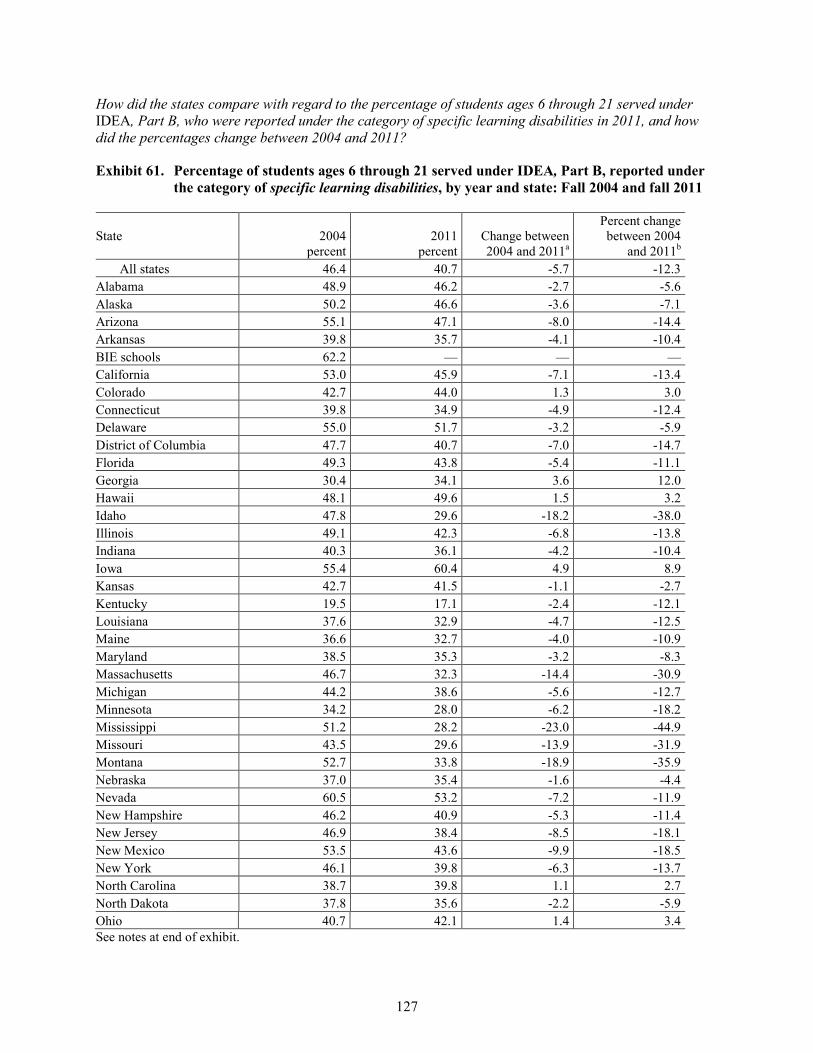
How did the states compare with regard to the percentage of students ages 6 through 21 served under IDEA, Part B, who were reported under the category of specific learning disabilities in 2011, and how did the percentages change between 2004 and 2011?
Exhibit 61. Percentage of students ages 6 through 21 served under IDEA, Part B, reported under the category of specific learning disabilities, by year and state: Fall 2004 and fall 2011
State 2004 percent
2011 percent
Change between 2004 and 2011a
Percent change between 2004
and 2011b All states 46.4 40.7 -5.7 -12.3
Alabama 48.9 46.2 -2.7 -5.6 Alaska 50.2 46.6 -3.6 -7.1 Arizona 55.1 47.1 -8.0 -14.4 Arkansas 39.8 35.7 -4.1 -10.4 BIE schools 62.2 — — — California 53.0 45.9 -7.1 -13.4 Colorado 42.7 44.0 1.3 3.0 Connecticut 39.8 34.9 -4.9 -12.4 Delaware 55.0 51.7 -3.2 -5.9 District of Columbia 47.7 40.7 -7.0 -14.7 Florida 49.3 43.8 -5.4 -11.1 Georgia 30.4 34.1 3.6 12.0 Hawaii 48.1 49.6 1.5 3.2 Idaho 47.8 29.6 -18.2 -38.0 Illinois 49.1 42.3 -6.8 -13.8 Indiana 40.3 36.1 -4.2 -10.4 Iowa 55.4 60.4 4.9 8.9 Kansas 42.7 41.5 -1.1 -2.7 Kentucky 19.5 17.1 -2.4 -12.1 Louisiana 37.6 32.9 -4.7 -12.5 Maine 36.6 32.7 -4.0 -10.9 Maryland 38.5 35.3 -3.2 -8.3 Massachusetts 46.7 32.3 -14.4 -30.9 Michigan 44.2 38.6 -5.6 -12.7 Minnesota 34.2 28.0 -6.2 -18.2 Mississippi 51.2 28.2 -23.0 -44.9 Missouri 43.5 29.6 -13.9 -31.9 Montana 52.7 33.8 -18.9 -35.9 Nebraska 37.0 35.4 -1.6 -4.4 Nevada 60.5 53.2 -7.2 -11.9 New Hampshire 46.2 40.9 -5.3 -11.4 New Jersey 46.9 38.4 -8.5 -18.1 New Mexico 53.5 43.6 -9.9 -18.5 New York 46.1 39.8 -6.3 -13.7 North Carolina 38.7 39.8 1.1 2.7 North Dakota 37.8 35.6 -2.2 -5.9 Ohio 40.7 42.1 1.4 3.4 See notes at end of exhibit.
127

Exhibit 61. Percentage of students ages 6 through 21 served under IDEA, Part B, reported under the category of specific learning disabilities, by year and state: Fall 2004 and fall 2011― Continued
State 2004 percent
2011 percent
Change between 2004 and 2011a
Percent change between 2004
and 2011b Oklahoma 53.7 44.8 -8.9 -16.6 Oregon 44.9 37.7 -7.2 -16.0 Pennsylvania 55.4 47.9 -7.5 -13.6 Puerto Rico 57.9 53.2 -4.7 -8.1 Rhode Island 46.2 39.4 -6.8 -14.7 South Carolina 47.8 47.3 -0.5 -1.1 South Dakota 45.8 40.9 -5.0 -10.8 Tennessee 43.5 40.6 -2.9 -6.8 Texas 53.3 43.2 -10.1 -19.0 Utah 54.1 48.7 -5.4 -10.0 Vermont 34.4 32.9 -1.6 -4.5 Virginia 42.8 38.4 -4.4 -10.2 Washington 43.0 39.2 -3.8 -8.9 West Virginia 37.6 30.3 -7.3 -19.4 Wisconsin 41.4 32.2 -9.2 -22.1 Wyoming 43.7 36.5 -7.1 -16.3 — Percentage cannot be calculated because data were not available. aChange between 2004 and 2011 was calculated for each state and “All states” by subtracting the percentage for 2004 from the percentage for 2011. Due to rounding, it may not be possible to reproduce the difference from the values presented in the exhibit. bPercent change between 2004 and 2011 was calculated for each state and “All states” by subtracting the percentage for 2004 from the percentage for 2011, dividing the difference by the percentage for 2004, then multiplying the result by 100. Due to rounding, it may not be possible to reproduce the percent change from the values presented in the exhibit. NOTE: Percentage for each state was calculated by dividing the number of students ages 6 through 21 served under IDEA, Part B, by the state under the category of specific learning disabilities in the year by the total number of students ages 6 through 21 served under IDEA, Part B, by the state in that year, then multiplying the result by 100. Percentage for “All states” was calculated for all states with available data by dividing the number of students ages 6 through 21 served under IDEA, Part B, by all states under the category of specific learning disabilities in the year by the total number of students ages 6 through 21 served under IDEA, Part B, by all states in that year, then multiplying the result by 100. SOURCE: U.S. Department of Education, Office of Special Education Programs, Data Analysis System (DANS), OMB #1820-0043: “Report of Children with Disabilities Receiving Special Education Under Part B of the Individuals with Disabilities Education Act, as Amended,” 2004 and 2011. Data for 2004 were accessed spring 2012. Data for 2011 were accessed fall 2012. For actual data used, go to http://www.ed.gov/about/reports/annual/osep.
• In 2011, a total of 40.7 percent of students ages 6 through 21 served under IDEA, Part B, in the 52 states (“All states”) for which data were available were reported under the category of specific learning disabilities. The percentages of students reported under the category of specific learning disabilities by the 52 individual states ranged from 17.1 percent to 60.4 percent. The percentages for the following four states were larger than 50 percent: Iowa (60.4 percent), Nevada (53.2 percent), Puerto Rico (53.2 percent), and Delaware (51.7 percent). In contrast, the percentage for the following five states was less than 30 percent: Missouri (29.6 percent), Idaho (29.6 percent), Mississippi (28.2 percent), Minnesota (28.0 percent), and Kentucky (17.1 percent).
128

• A larger percentage (46.4 percent) of the students ages 6 through 21 served under IDEA, Part B, in “All states” was reported under the category of specific learning disabilities in 2004 than 2011. The percentage of students was larger in 2004 than in 2011 in 46 of the 52 states for which data were available for both time periods. For the six states in which the percentage was larger in 2011 than in 2004, the difference was less than 5 percentage points and represented a percentage increase of no more than 12 percent. The differences were 4.9 percent for Iowa, 3.6 percent for Georgia, 1.5 percent for Hawaii, 1.4 percent for Ohio, 1.3 percent for Colorado, and 1.1 percent for North Carolina. In contrast, double-digit decreases were found for Mississippi (-23.0 percent), Montana (-18.9 percent), Idaho (-18.2 percent), Massachusetts (-14.4 percent), Missouri (-13.9 percent), and Texas (-10.1 percent). Moreover, the decrease in each of these states except Texas represented a percent change of more than 30 percent.
129

Part B Educational Environments
How did the states compare with regard to the distribution of students ages 6 through 21 served under IDEA, Part B, by educational environment in 2011?
Exhibit 62. Percentage of students ages 6 through 21 served under IDEA, Part B, by educational environment and state: Fall 2011
State
Inside the regular classa
Separate schoolc
Residential facilityc
Homebound/ hospitald
Correctional facilitye
Parentally placed in
private schoolf
80% or moreb of
the day
40% to 79% of the day
Less than 40% of the day
All states 61.1 19.8 14.0 3.0 0.3 0.4 0.3 1.1 Alabama 83.5 6.8 6.4 1.3 1.1 0.3 0.2 0.5 Alaska 60.0 25.7 11.3 1.8 0.4 0.2 0.4 0.1 Arizona 60.4 21.5 14.7 2.4 0.1 0.2 0.4 0.2 Arkansas 53.3 30.7 12.5 1.1 1.0 0.5 0.3 0.6 BIE schools — — — — — — — — California 52.3 20.6 22.1 3.7 0.2 0.3 0.3 0.5 Colorado 72.1 16.9 7.4 2.1 0.7 0.2 0.4 0.2 Connecticut 69.5 16.2 5.6 5.7 1.3 0.3 0.5 0.9 Delaware 63.6 14.5 15.6 5.5 0.1 0.5 # 0.1 District of Columbia 46.3 18.9 13.4 18.9 1.5 x 0.8 x Florida 66.4 11.5 16.3 2.8 0.2 0.8 1.2 0.8 Georgia 63.6 18.9 14.7 1.6 0.4 0.2 0.3 0.2 Hawaii 30.8 45.4 22.3 0.7 0.2 0.3 0.2 0.1 Idaho 60.7 26.1 11.3 1.0 0.2 0.1 0.5 0.1 Illinois 52.4 25.6 14.4 5.4 0.4 0.2 0.1 1.5 Indiana 69.3 15.3 12.0 1.1 0.4 0.7 0.3 0.9 Iowa 64.2 24.1 8.8 1.1 0.3 0.2 0.4 1.0 Kansas 66.0 22.4 7.3 1.9 0.4 0.2 0.5 1.4 Kentucky 71.4 16.9 8.9 0.7 0.3 0.9 0.2 0.7 Louisiana 61.2 20.6 13.5 0.3 0.1 0.9 0.3 3.0 Maine 55.9 29.9 10.6 2.7 0.4 0.2 0.1 0.2 Maryland 67.1 10.8 13.7 6.6 0.2 0.3 0.4 1.0 Massachusetts 57.8 19.7 14.9 6.0 0.7 0.1 0.1 0.7 Michigan 62.7 17.8 11.9 5.1 0.2 0.2 0.6 1.4 Minnesota 61.5 23.9 10.3 3.9 0.1 0.2 — — Mississippi 66.3 16.7 13.5 0.7 0.8 0.7 0.1 1.2 Missouri 58.9 25.6 9.4 2.9 # 0.6 0.8 1.8 Montana 49.0 35.4 13.7 0.5 0.7 0.2 0.1 0.5 Nebraska 74.5 13.8 6.0 1.6 0.3 0.2 0.1 3.5 Nevada 64.9 19.5 13.6 1.3 # 0.3 0.3 0.1 New Hampshire 73.7 15.2 8.3 1.6 0.7 0.4 x x New Jersey 46.6 26.7 16.1 7.0 0.2 0.3 0.2 2.9 New Mexico 52.4 25.1 20.6 0.5 0.3 0.3 0.3 0.6 New York 56.9 11.6 22.0 5.5 0.6 0.3 0.2 2.8 North Carolina 65.7 18.0 13.9 1.2 0.2 0.6 0.1 0.2 See notes at end of exhibit.
130

Exhibit 62. Percentage of students ages 6 through 21 served under IDEA, Part B, by educational environment and state: Fall 2011―Continued
State
Inside the regular classa
Separate schoolc
Residential facilityc
Homebound/ hospitald
Correctional facilitye
Parentally placed in
private schoolf
80% or moreb of
the day
40% to 79% of the day
Less than 40% of the day
North Dakota 76.3 16.2 4.0 0.5 0.9 x x 1.9 Ohio 58.7 23.0 11.5 3.3 0.2 0.6 0.1 2.7 Oklahoma 62.5 25.9 9.9 0.3 0.4 0.7 0.1 0.2 Oregon 71.8 14.9 10.7 1.0 0.1 0.3 0.3 0.9 Pennsylvania 62.2 24.0 9.2 3.8 0.4 0.2 0.2 # Puerto Rico 77.6 6.9 7.6 1.8 0.0 1.4 0.1 4.5 Rhode Island 71.8 8.9 11.6 5.2 0.6 0.1 0.3 1.7 South Carolina 57.8 20.7 19.0 0.7 0.4 0.6 0.3 0.4 South Dakota 67.6 22.5 5.2 1.2 1.6 0.1 0.2 1.4 Tennessee 63.4 21.5 12.3 0.8 0.3 0.7 0.1 0.8 Texas 66.7 18.6 13.1 0.5 0.2 0.5 0.1 0.2 Utah 55.3 27.2 14.0 2.7 0.2 0.2 0.4 # Vermont 73.7 12.6 6.9 4.8 1.0 0.2 0.1 0.8 Virginia 61.8 21.3 12.5 2.6 0.4 0.6 0.2 0.5 Washington 52.3 33.0 13.2 0.6 0.2 0.1 0.2 0.4 West Virginia 66.2 22.8 8.3 0.1 0.5 1.1 0.3 0.8 Wisconsin 59.4 27.4 10.0 0.8 0.2 0.2 0.4 1.6 Wyoming 60.6 29.6 7.1 0.5 1.4 x x 0.5 x Percentage cannot be calculated because data were suppressed to limit disclosure. — Percentage cannot be calculated because data were not available. # Percentage was non-zero, but < 0.05 or less than 5/100 of 1 percent. aPercentage of time spent inside the regular class is defined as the number of hours the student spends each day inside the regular classroom, divided by the total number of hours in the school day (including lunch, recess, and study periods), multiplied by 100. bStudents who received special education and related services outside the regular classroom for less than 21 percent of the school day were classified in the inside the regular class 80% or more of the day category. cSeparate school and residential facility are categories that include children with disabilities who receive special education and related services, at public expense, for greater than 50 percent of the school day in public or private separate day schools or residential facilities. dHomebound/hospital is a category that includes children with disabilities who receive special education and related services in hospital programs or homebound programs. eCorrectional facilities is a category that includes children with disabilities who receive special education and related services in short-term detention facilities or correctional facilities. fParentally placed in private schools is a category that includes children with disabilities who have been enrolled by their parents or guardians in regular parochial or other private schools and whose basic education is paid through private resources and who receive special education and related services at public expense from a local education agency or intermediate educational unit under a service plan. NOTE: Percentage for each state was calculated by dividing the number of students ages 6 through 21 served under IDEA, Part B, by the state who were reported in the educational environment by the total number of students ages 6 through 21 served under IDEA, Part B, by the state, then multiplying the result by 100. Percentage for “All states” was calculated for all states with available data by dividing the number of students ages 6 through 21 served under IDEA, Part B, by all states who were reported in the educational environment by the total number of students ages 6 through 21 served under IDEA, Part B, by all states, then multiplying the result by 100. The percentage for “All states” includes suppressed data. SOURCE: U.S. Department of Education, Office of Special Education Programs, Data Analysis System (DANS), OMB #1820-0517: “Part B, Individuals with Disabilities Education Act, Implementation of FAPE Requirements,” 2011. Data were accessed fall 2012. For actual data used, go to http://www.ed.gov/about/reports/annual/osep.
131

• In 2011, a total of 61.1 percent of students ages 6 through 21 served under IDEA, Part B, in the 52 states (“All states”) for which data were available were educated inside the regular class 80% or more of the day.
• In 51 of the 52 individual states, a larger percentage of students were accounted for by the category of inside the regular class 80% or more of the day than any other educational environment category. Moreover, in 48 of the 52 states for which data were available, a majority of such students were educated inside the regular class 80% or more of the day. In three of those states, this category accounted for more than 75 percent of such students. The three states were Alabama (83.5 percent), Puerto Rico (77.6 percent), and North Dakota (76.3 percent). The only state that deviated from this pattern was Hawaii. In Hawaii, inside the regular class no more than 79% of the day and no less than 40% of the day was the most prevalent category, accounting for 45.4 percent of such students.
132
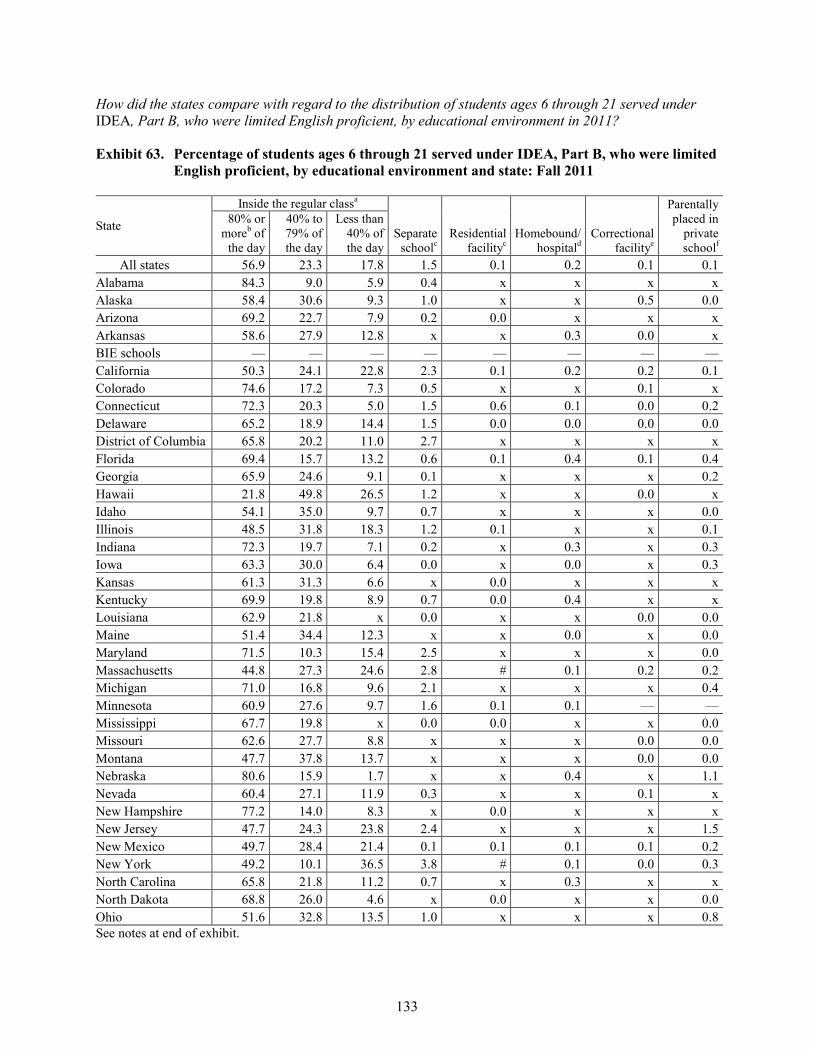
How did the states compare with regard to the distribution of students ages 6 through 21 served under IDEA, Part B, who were limited English proficient, by educational environment in 2011?
Exhibit 63. Percentage of students ages 6 through 21 served under IDEA, Part B, who were limited English proficient, by educational environment and state: Fall 2011
State
Inside the regular classa
Separate schoolc
Residential facilityc
Homebound/ hospitald
Correctional facilitye
Parentally placed in
private schoolf
80% or moreb of
the day
40% to 79% of the day
Less than 40% of the day
All states 56.9 23.3 17.8 1.5 0.1 0.2 0.1 0.1 Alabama 84.3 9.0 5.9 0.4 x x x x Alaska 58.4 30.6 9.3 1.0 x x 0.5 0.0 Arizona 69.2 22.7 7.9 0.2 0.0 x x x Arkansas 58.6 27.9 12.8 x x 0.3 0.0 x BIE schools — — — — — — — — California 50.3 24.1 22.8 2.3 0.1 0.2 0.2 0.1 Colorado 74.6 17.2 7.3 0.5 x x 0.1 x Connecticut 72.3 20.3 5.0 1.5 0.6 0.1 0.0 0.2 Delaware 65.2 18.9 14.4 1.5 0.0 0.0 0.0 0.0 District of Columbia 65.8 20.2 11.0 2.7 x x x x Florida 69.4 15.7 13.2 0.6 0.1 0.4 0.1 0.4 Georgia 65.9 24.6 9.1 0.1 x x x 0.2 Hawaii 21.8 49.8 26.5 1.2 x x 0.0 x Idaho 54.1 35.0 9.7 0.7 x x x 0.0 Illinois 48.5 31.8 18.3 1.2 0.1 x x 0.1 Indiana 72.3 19.7 7.1 0.2 x 0.3 x 0.3 Iowa 63.3 30.0 6.4 0.0 x 0.0 x 0.3 Kansas 61.3 31.3 6.6 x 0.0 x x x Kentucky 69.9 19.8 8.9 0.7 0.0 0.4 x x Louisiana 62.9 21.8 x 0.0 x x 0.0 0.0 Maine 51.4 34.4 12.3 x x 0.0 x 0.0 Maryland 71.5 10.3 15.4 2.5 x x x 0.0 Massachusetts 44.8 27.3 24.6 2.8 # 0.1 0.2 0.2 Michigan 71.0 16.8 9.6 2.1 x x x 0.4 Minnesota 60.9 27.6 9.7 1.6 0.1 0.1 — — Mississippi 67.7 19.8 x 0.0 0.0 x x 0.0 Missouri 62.6 27.7 8.8 x x x 0.0 0.0 Montana 47.7 37.8 13.7 x x x 0.0 0.0 Nebraska 80.6 15.9 1.7 x x 0.4 x 1.1 Nevada 60.4 27.1 11.9 0.3 x x 0.1 x New Hampshire 77.2 14.0 8.3 x 0.0 x x x New Jersey 47.7 24.3 23.8 2.4 x x x 1.5 New Mexico 49.7 28.4 21.4 0.1 0.1 0.1 0.1 0.2 New York 49.2 10.1 36.5 3.8 # 0.1 0.0 0.3 North Carolina 65.8 21.8 11.2 0.7 x 0.3 x x North Dakota 68.8 26.0 4.6 x 0.0 x x 0.0 Ohio 51.6 32.8 13.5 1.0 x x x 0.8 See notes at end of exhibit.
133

Exhibit 63. Percentage of students ages 6 through 21 served under IDEA, Part B, who were limited English proficient, by educational environment and state: Fall 2011―Continued
State
Inside the regular classa
Separate schoolc
Residential facilityc
Homebound/ hospitald
Correctional facilitye
Parentally placed in
private schoolf
80% or moreb of
the day
40% to 79% of the day
Less than 40% of the day
Oklahoma 53.3 34.9 11.4 0.2 0.0 x 0.0 x Oregon 76.0 17.1 6.5 0.2 x x x 0.1 Pennsylvania 54.6 31.4 12.1 1.5 0.2 0.2 0.1 0.0 Puerto Rico 81.5 8.9 8.0 1.1 0.0 x 0.0 x Rhode Island 82.4 7.0 10.0 x x 0.0 0.0 0.0 South Carolina 57.5 23.1 18.0 0.8 0.3 x x x South Dakota 75.4 21.7 1.8 x x 0.0 0.0 x Tennessee 63.0 24.2 11.9 0.4 0.0 0.3 x x Texas 68.0 21.5 9.9 0.1 x 0.4 # x Utah 45.4 40.0 12.9 1.5 x x 0.1 x Vermont 72.2 15.8 6.3 5.7 0.0 0.0 0.0 0.0 Virginia 51.4 29.7 17.6 1.1 0.1 0.1 0.0 0.1 Washington 50.3 41.6 7.9 x 0.0 x x 0.1 West Virginia 69.6 24.7 4.6 0.0 0.0 x 0.0 x Wisconsin 60.9 29.9 7.6 0.3 0.3 0.1 0.2 0.6 Wyoming 59.2 33.3 6.2 x 0.0 x x 0.0 x Percentage cannot be calculated because data were suppressed to limit disclosure. — Percentage cannot be calculated because data were not available. # Percentage was non-zero, but < 0.05 or less than 5/100 of 1 percent. aPercentage of time spent inside the regular class is defined as the number of hours the student spends each day inside the regular classroom, divided by the total number of hours in the school day (including lunch, recess, and study periods), multiplied by 100. bStudents who received special education and related services outside the regular classroom for less than 21 percent of the school day were classified in the inside the regular class 80% or more of the day category. cSeparate school and residential facility are categories that include children with disabilities who receive special education and related services, at public expense, for greater than 50 percent of the school day in public or private separate day schools or residential facilities. dHomebound/hospital is a category that includes children with disabilities who receive special education and related services in hospital programs or homebound programs. eCorrectional facilities is a category that includes children with disabilities who receive special education and related services in short-term detention facilities or correctional facilities. fParentally placed in private schools is a category that includes children with disabilities who have been enrolled by their parents or guardians in regular parochial or other private schools and whose basic education is paid through private resources and who receive special education and related services at public expense from a local education agency or intermediate educational unit under a service plan. NOTE: Percentage for each state was calculated by dividing the number of students ages 6 through 21 served under IDEA, Part B, by the state who were limited English proficient and reported in the educational environment by the total number of students ages 6 through 21 served under IDEA, Part B, by the state who were limited English proficient, then multiplying the result by 100. Percentage for “All states” was calculated for all states with available data by dividing the number of students ages 6 through 21 served under IDEA, Part B, by all states who were limited English proficient and reported in the educational environment by the total number of students ages 6 through 21 served under IDEA, Part B, by all states who were limited English proficient, then multiplying the result by 100. Percentage for “All states” includes suppressed data. In the case of PR, language proficiency is determined with regard to Spanish. SOURCE: U.S. Department of Education, Office of Special Education Programs, Data Analysis System (DANS), OMB #1820-0517: “Part B, Individuals with Disabilities Education Act, Implementation of FAPE Requirements,” 2011. Data were accessed fall 2012. For actual data used, go to http://www.ed.gov/about/reports/annual/osep.
134
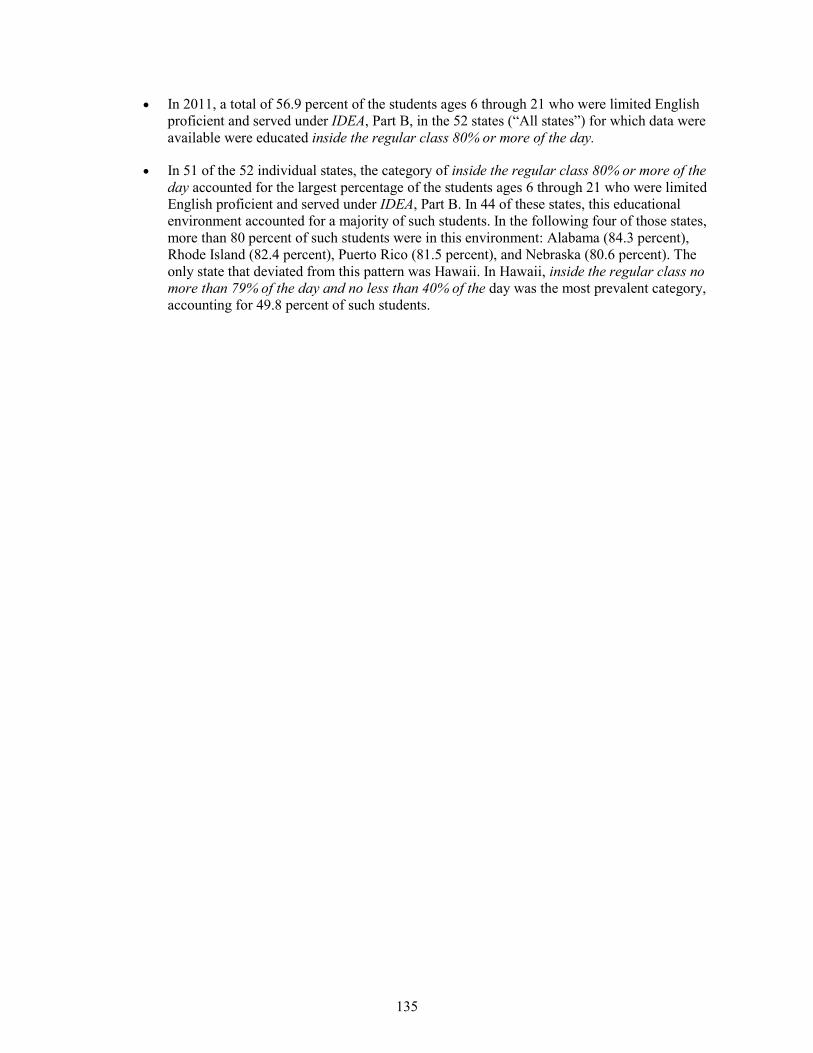
• In 2011, a total of 56.9 percent of the students ages 6 through 21 who were limited English proficient and served under IDEA, Part B, in the 52 states (“All states”) for which data were available were educated inside the regular class 80% or more of the day.
• In 51 of the 52 individual states, the category of inside the regular class 80% or more of the day accounted for the largest percentage of the students ages 6 through 21 who were limited English proficient and served under IDEA, Part B. In 44 of these states, this educational environment accounted for a majority of such students. In the following four of those states, more than 80 percent of such students were in this environment: Alabama (84.3 percent), Rhode Island (82.4 percent), Puerto Rico (81.5 percent), and Nebraska (80.6 percent). The only state that deviated from this pattern was Hawaii. In Hawaii, inside the regular class no more than 79% of the day and no less than 40% of the day was the most prevalent category, accounting for 49.8 percent of such students.
135

How did the states compare with regard to the distribution of students ages 6 through 21 served under IDEA, Part B, reported under the category of emotional disturbance, by educational environment in 2011?
Exhibit 64. Percentage of students ages 6 through 21 served under IDEA, Part B, reported under the category of emotional disturbance, by educational environment and state: Fall 2011
State
Inside the regular classa
Separate schoolc
Residential facilityc
Homebound/ hospitald
Correctional facilitye
Parentally placed in
private schoolf
80% or moreb of
the day
40% to 79% of the day
Less than 40% of the day
All states 43.1 18.0 20.6 13.2 1.9 1.1 1.8 0.2 Alabama 69.6 7.1 6.2 6.2 9.1 1.4 x x Alaska 39.5 24.5 16.7 12.4 2.5 x 3.9 x Arizona 39.1 16.0 24.3 17.2 0.8 x 2.0 x Arkansas 32.1 31.7 17.5 7.9 6.3 2.6 x x BIE schools — — — — — — — — California 24.6 15.8 30.2 22.3 4.2 0.8 2.0 0.1 Colorado 53.3 16.4 12.2 9.7 4.4 x 3.4 x Connecticut 40.8 12.9 16.3 19.4 6.8 1.2 2.4 0.2 Delaware 43.5 12.0 21.7 20.9 x 1.4 x 0.0 District of Columbia 25.3 12.9 21.9 30.6 6.0 0.0 3.2 0.0 Florida 38.9 13.3 27.6 11.8 0.2 0.4 7.4 0.4 Georgia 53.3 17.5 14.8 10.6 1.8 x 1.6 x Hawaii 28.5 36.5 28.8 3.0 1.3 0.5 1.5 0.0 Idaho 48.4 24.2 14.7 7.8 x x 4.0 0.0 Illinois 29.6 20.9 17.6 28.0 2.6 0.4 0.7 0.2 Indiana 50.3 16.1 22.0 4.3 2.4 2.8 1.6 0.7 Iowa 64.2 24.1 8.8 1.1 0.3 0.1 0.3 1.1 Kansas 47.0 22.0 12.6 13.0 1.5 0.3 3.2 0.4 Kentucky 50.2 19.4 19.3 3.4 2.4 3.3 x x Louisiana 47.9 22.8 21.2 x 0.8 2.8 3.8 x Maine 43.0 25.6 18.0 11.0 1.6 0.5 x x Maryland 37.8 11.7 21.4 25.5 0.2 0.6 2.7 0.1 Massachusetts 35.3 11.9 23.0 26.7 1.7 0.4 0.9 0.1 Michigan 48.4 17.8 16.4 10.2 1.7 0.4 4.8 0.3 Minnesota 54.2 21.1 13.0 11.4 # 0.3 — — Mississippi 52.5 21.6 15.7 4.3 2.8 2.9 x x Missouri 43.2 26.8 13.2 10.2 x 2.7 3.4 x Montana 36.9 29.7 22.5 2.2 7.0 0.9 0.7 0.0 Nebraska 67.8 10.5 10.1 8.7 1.7 0.3 0.3 0.6 Nevada 51.6 18.9 19.9 7.2 x x 1.7 0.0 New Hampshire 60.8 15.1 13.4 7.2 3.2 x x 0.0 New Jersey 32.2 20.7 22.0 20.6 1.1 1.6 1.5 0.3 New Mexico 35.5 20.3 38.1 0.9 3.2 x 1.4 x New York 27.0 9.9 37.4 18.7 3.5 2.0 1.0 0.4 North Carolina 50.5 20.1 21.3 3.7 x 3.3 0.7 x North Dakota 73.1 15.3 3.7 1.7 4.5 x x 0.0 See notes at end of exhibit.
136

Exhibit 64. Percentage of students ages 6 through 21 served under IDEA, Part B, reported under the category of emotional disturbance, by educational environment and state: Fall 2011― Continued
State
Inside the regular classa
Separate schoolc
Residential facilityc
Homebound/ hospitald
Correctional facilitye
Parentally placed in
private schoolf
40% to 79% of the day
Less than 40% of the day
Ohio 36.4 20.3 21.7 17.3 1.3 2.2 0.6 0.3 Oklahoma 46.8 26.5 19.3 x 2.2 3.2 1.0 x Oregon 55.6 15.2 21.1 5.5 0.0 0.8 1.8 0.2 Pennsylvania 45.5 21.2 14.6 15.0 2.1 0.5 1.1 # Puerto Rico 75.6 7.8 11.2 1.2 0.0 1.4 0.4 2.4 Rhode Island 43.7 6.6 21.4 22.9 3.7 x 1.4 x South Carolina 31.7 22.5 35.0 4.0 2.4 2.5 x x South Dakota 56.5 26.8 7.8 3.5 3.7 x x x Tennessee 42.0 21.4 24.8 7.5 1.3 2.1 0.4 0.4 Texas 61.9 19.0 14.9 2.3 0.1 1.1 0.8 # Utah 38.5 22.5 31.3 3.3 0.5 1.4 2.5 0.0 Vermont 58.0 9.6 11.1 16.9 3.4 x 0.6 x Virginia 44.2 19.0 13.5 17.2 2.8 2.0 1.3 0.1 Washington 38.6 30.4 23.4 4.8 1.0 x 1.5 x West Virginia 49.2 28.1 13.2 x x 4.6 2.5 0.0 Wisconsin 56.1 24.7 14.1 2.2 0.7 0.7 1.5 0.1 Wyoming 46.0 28.6 10.7 2.6 10.6 0.7 x x x Percentage cannot be calculated because data were suppressed to limit disclosure. — Percentage cannot be calculated because data were not available. # Percentage was non-zero, but < 0.05 or less than 5/100 of 1 percent. aPercentage of time spent inside the regular class is defined as the number of hours the student spends each day inside the regular classroom, divided by the total number of hours in the school day (including lunch, recess, and study periods), multiplied by 100. bStudents who received special education and related services outside the regular classroom for less than 21 percent of the school day were classified in the inside the regular class 80% or more of the day category. cSeparate school and residential facility are categories that include children with disabilities who receive special education and related services, at public expense, for greater than 50 percent of the school day in public or private separate day schools or residential facilities. dHomebound/hospital is a category that includes children with disabilities who receive special education and related services in hospital programs or homebound programs. eCorrectional facilities is a category that includes children with disabilities who receive special education and related services in short-term detention facilities or correctional facilities. fParentally placed in private school is a category that includes children with disabilities who have been enrolled by their parents or guardians in regular parochial or other private schools and whose basic education is paid through private resources and who receive special education and related services at public expense from a local education agency or intermediate educational unit under a service plan. NOTE Percentage for each state was calculated by dividing the number of students ages 6 through 21 served under IDEA, Part B, by the state under the category of emotional disturbance who were reported in the educational environment by the total number of students ages 6 through 21 served under IDEA, Part B, by the state under the category of emotional disturbance, then multiplying the result by 100. Percentage for “All states” was calculated for all states with available data by dividing the number of students ages 6 through 21 served under IDEA, Part B, by all states under the category of emotional disturbance who were reported in the educational environment by the total number of students ages 6 through 21 served under IDEA, Part B, by all states under the category of emotional disturbance, then multiplying the result by 100. The percentage for “All states” includes suppressed data. SOURCE: U.S. Department of Education, Office of Special Education Programs, Data Analysis System (DANS), OMB #1820-0517: “Part B, Individuals with Disabilities Education Act, Implementation of FAPE Requirements,” 2011. Data were accessed fall 2012. For actual data used, go to http://www.ed.gov/about/reports/annual/osep.
137
80% or moreb of
the day

• In 2011, inside the regular class for 80% or more of the day accounted for a larger percentage (43.1 percent) of the students ages 6 through 21 served under IDEA, Part B, reported under the category of emotional disturbance in the 52 states (“All states”) for which data were available than any other category of educational environment. Moreover, this environment accounted for the largest percentage of students in 46 of the 52 states. The percentage exceeded 50 percent in 19 states, including the following two states, in which the percentage exceeded 70 percent: Puerto Rico (75.6 percent) and North Dakota (73.1 percent).
• In Hawaii, the category of inside the regular class no more than 79% of the day and no less than 40% of the day accounted for the largest percentage (36.5 percent) of students ages 6 through 21 served under IDEA, Part B, reported under the category of emotional disturbance.
• In four states, the category of inside the regular class less than 40% of the day accounted for the largest percentage of students ages 6 through 21 served under IDEA, Part B, reported under the category of emotional disturbance. The four states were New Mexico (38.1 percent), New York (37.4 percent), South Carolina (35.0 percent), and California (30.2 percent).
• In the District of Columbia, the category of a separate school accounted for the largest percentage (30.6 percent) of the students ages 6 through 21 served under IDEA, Part B, reported under the category of emotional disturbance.
138
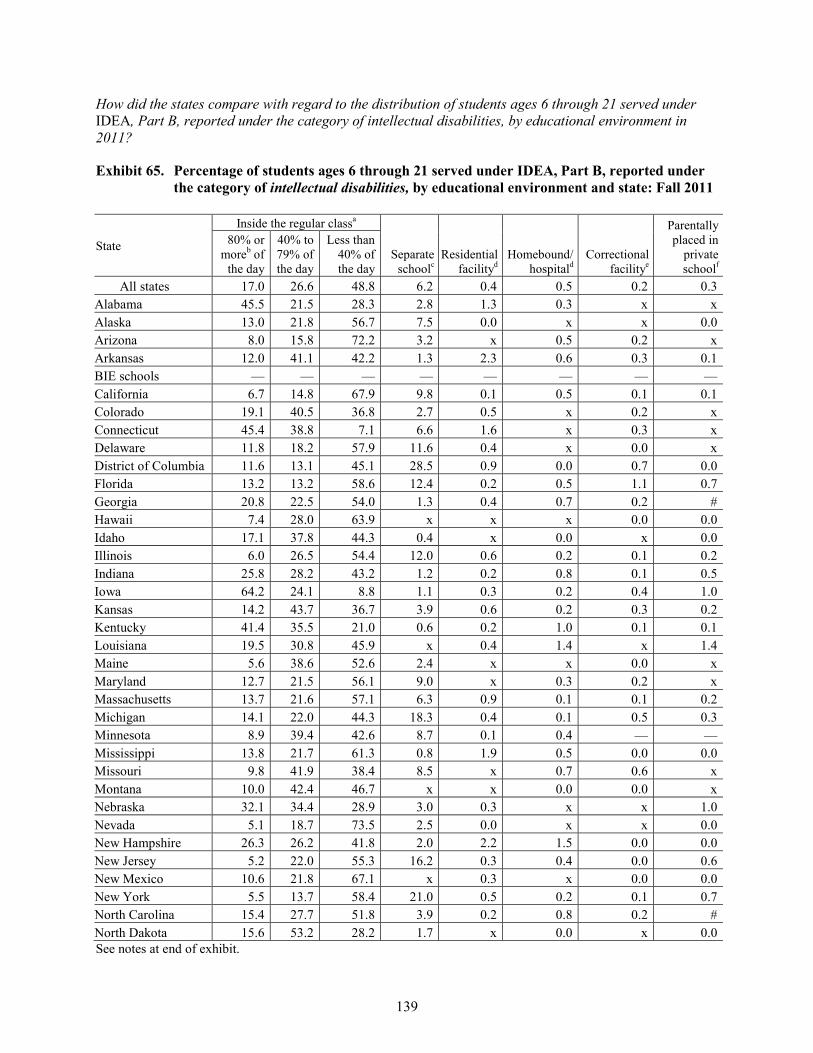
How did the states compare with regard to the distribution of students ages 6 through 21 served under IDEA, Part B, reported under the category of intellectual disabilities, by educational environment in 2011?
Exhibit 65. Percentage of students ages 6 through 21 served under IDEA, Part B, reported under the category of intellectual disabilities, by educational environment and state: Fall 2011
State
Inside the regular classa
Separate schoolc
Residential facilityd
Homebound/ hospitald
Correctional facilitye
Parentally placed in
private schoolf
80% or moreb of
the day
40% to 79% of the day
Less than 40% of the day
All states 17.0 26.6 48.8 6.2 0.4 0.5 0.2 0.3 Alabama 45.5 21.5 28.3 2.8 1.3 0.3 x x Alaska 13.0 21.8 56.7 7.5 0.0 x x 0.0 Arizona 8.0 15.8 72.2 3.2 x 0.5 0.2 x Arkansas 12.0 41.1 42.2 1.3 2.3 0.6 0.3 0.1 BIE schools — — — — — — — — California 6.7 14.8 67.9 9.8 0.1 0.5 0.1 0.1 Colorado 19.1 40.5 36.8 2.7 0.5 x 0.2 x Connecticut 45.4 38.8 7.1 6.6 1.6 x 0.3 x Delaware 11.8 18.2 57.9 11.6 0.4 x 0.0 x District of Columbia 11.6 13.1 45.1 28.5 0.9 0.0 0.7 0.0 Florida 13.2 13.2 58.6 12.4 0.2 0.5 1.1 0.7 Georgia 20.8 22.5 54.0 1.3 0.4 0.7 0.2 # Hawaii 7.4 28.0 63.9 x x x 0.0 0.0 Idaho 17.1 37.8 44.3 0.4 x 0.0 x 0.0 Illinois 6.0 26.5 54.4 12.0 0.6 0.2 0.1 0.2 Indiana 25.8 28.2 43.2 1.2 0.2 0.8 0.1 0.5 Iowa 64.2 24.1 8.8 1.1 0.3 0.2 0.4 1.0 Kansas 14.2 43.7 36.7 3.9 0.6 0.2 0.3 0.2 Kentucky 41.4 35.5 21.0 0.6 0.2 1.0 0.1 0.1 Louisiana 19.5 30.8 45.9 x 0.4 1.4 x 1.4 Maine 5.6 38.6 52.6 2.4 x x 0.0 x Maryland 12.7 21.5 56.1 9.0 x 0.3 0.2 x Massachusetts 13.7 21.6 57.1 6.3 0.9 0.1 0.1 0.2 Michigan 14.1 22.0 44.3 18.3 0.4 0.1 0.5 0.3 Minnesota 8.9 39.4 42.6 8.7 0.1 0.4 — — Mississippi 13.8 21.7 61.3 0.8 1.9 0.5 0.0 0.0 Missouri 9.8 41.9 38.4 8.5 x 0.7 0.6 x Montana 10.0 42.4 46.7 x x 0.0 0.0 x Nebraska 32.1 34.4 28.9 3.0 0.3 x x 1.0 Nevada 5.1 18.7 73.5 2.5 0.0 x x 0.0 New Hampshire 26.3 26.2 41.8 2.0 2.2 1.5 0.0 0.0 New Jersey 5.2 22.0 55.3 16.2 0.3 0.4 0.0 0.6 New Mexico 10.6 21.8 67.1 x 0.3 x 0.0 0.0 New York 5.5 13.7 58.4 21.0 0.5 0.2 0.1 0.7 North Carolina 15.4 27.7 51.8 3.9 0.2 0.8 0.2 # North Dakota 15.6 53.2 28.2 1.7 x 0.0 x 0.0 See notes at end of exhibit.
139

Exhibit 65. Percentage of students ages 6 through 21 served under IDEA, Part B, reported under the category of intellectual disabilities, by educational environment and state: Fall 2011―Continued
State
Inside the regular classa
Separate schoolc
Residential facilityd
Homebound/ hospitald
Correctional facilitye
Parentally placed in
private schoolf
80% or moreb of
the day
40% to 79% of the day
Less than 40% of the day
Ohio 30.8 43.9 23.1 1.2 0.1 0.5 0.1 0.5 Oklahoma 13.9 41.1 43.4 x 0.3 0.9 0.2 x Oregon 13.7 29.1 54.0 2.2 0.0 0.5 0.2 0.3 Pennsylvania 13.7 34.2 42.7 8.4 0.6 0.4 x x Puerto Rico 40.8 5.4 39.3 12.3 0.0 1.0 0.2 1.1 Rhode Island 22.8 21.5 48.7 5.7 x 0.0 0.0 x South Carolina 6.9 16.2 71.2 3.3 0.7 1.4 x x South Dakota 15.6 56.2 20.8 3.5 3.6 x 0.0 x Tennessee 13.7 22.8 60.2 1.5 0.5 0.8 0.3 0.2 Texas 9.5 26.5 61.8 1.5 0.1 0.5 # # Utah 8.8 21.7 58.9 9.8 x 0.3 0.4 x Vermont 37.2 31.0 23.3 7.6 x 0.0 0.0 x Virginia 14.1 29.4 52.2 2.6 0.4 0.9 0.1 0.2 Washington 4.5 32.5 61.9 0.7 x 0.1 x 0.3 West Virginia 23.5 45.7 28.3 0.0 0.5 1.7 0.3 0.0 Wisconsin 10.9 38.7 47.0 2.4 0.2 0.4 0.3 0.1 Wyoming 8.2 37.3 49.8 x 2.5 x 0.0 0.0 x Percentage cannot be calculated because data were suppressed to limit disclosure. — Percentage cannot be calculated because data were not available. # Percentage was non-zero, but < 0.05 or less than 5/100 of 1 percent. aPercentage of time spent inside the regular class is defined as the number of hours the student spends each day inside the regular classroom, divided by the total number of hours in the school day (including lunch, recess, and study periods), multiplied by 100. bStudents who received special education and related services outside the regular classroom for less than 21 percent of the school day were classified in the inside the regular class 80% or more of the day category. cSeparate school and residential facility are categories that include children with disabilities who receive special education and related services, at public expense, for greater than 50 percent of the school day in public or private separate day schools or residential facilities. dHomebound/hospital is a category that includes children with disabilities who receive special education and related services in hospital programs or homebound programs. eCorrectional facilities is a category that includes children with disabilities who receive special education and related services in short-term detention facilities or correctional facilities. fParentally placed in private schools is a category that includes children with disabilities who have been enrolled by their parents or guardians in regular parochial or other private schools and whose basic education is paid through private resources and who receive special education and related services at public expense from a local education agency or intermediate educational unit under a service plan. NOTE: Percentage for each state was calculated by dividing the number of students ages 6 through 21 served under IDEA, Part B, by the state under the category of intellectual disabilities who were reported in the educational environment by the total number of students ages 6 through 21 served under IDEA, Part B, by the state under the category of intellectual disabilities, then multiplying the result by 100. Percentage for “All states” was calculated for all states with available data by dividing the number of students ages 6 through 21 served under IDEA, Part B, by all states under the category of intellectual disabilities who were reported in the educational environment by the total number of students ages 6 through 21 served under IDEA, Part B, by all states under the category of intellectual disabilities, then multiplying the result by 100. Percentage for “All states” includes suppressed data. SOURCE: U.S. Department of Education, Office of Special Education Programs, Data Analysis System (DANS), OMB #1820-0517: “Part B, Individuals with Disabilities Education Act, Implementation of FAPE Requirements,” 2011. Data were accessed fall 2012. For actual data used, go to http://www.ed.gov/about/reports/annual/osep.
140

• In 2011, a larger percentage (48.8 percent) of the students ages 6 through 21 served under IDEA, Part B, who were reported under the category of intellectual disabilities in the 52 states (“All states”) for which data were available was educated inside the regular class less than 40% of the day than in any other category of educational environment. Moreover, this environment accounted for the largest percentage of students in 38 of the 52 states. The percentage exceeded 50 percent in 24 states, including the following three states in which the percentage exceeded 70 percent: Nevada (73.5 percent), Arizona (72.2 percent), and South Carolina (71.2 percent).
• The educational environment category of inside the regular class no more than 79% of the day and no less than 40% of the day accounted for the largest percentage of students ages 6 through 21 served under IDEA, Part B, reported under the category of intellectual disabilities in the following eight states: South Dakota (56.2 percent), North Dakota (53.2 percent), West Virginia (45.7 percent), Ohio (43.9 percent), Kansas (43.7 percent), Missouri (41.9 percent), Colorado (40.5 percent), and Nebraska (34.4 percent).
• In six states, the category of inside the regular class 80% or more of the day accounted for the largest percentage of students ages 6 through 21 served under IDEA, Part B, reported under the category of intellectual disabilities. The six states were: Iowa (64.2 percent), Alabama (45.5 percent), Connecticut (45.4 percent), Kentucky (41.4 percent), Puerto Rico (40.8 percent), and Vermont (37.2 percent).
141
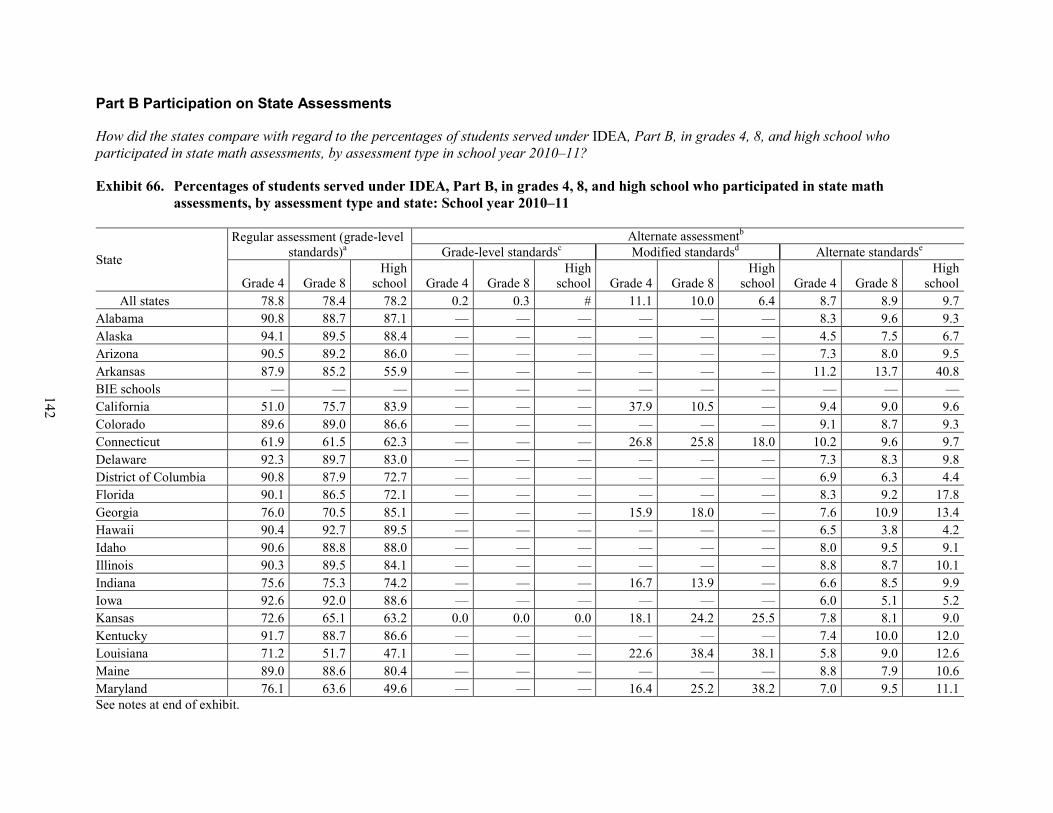
142
Part B Participation on State Assessments
How did the states compare with regard to the percentages of students served under IDEA, Part B, in grades 4, 8, and high school who participated in state math assessments, by assessment type in school year 2010–11?
Exhibit 66. Percentages of students served under IDEA, Part B, in grades 4, 8, and high school who participated in state math assessments, by assessment type and state: School year 2010–11
State
Regular assessment (grade-level standards)a
Alternate assessmentb Grade-level standardsc Modified standardsd Alternate standardse
Grade 4 Grade 8 High
school Grade 4 Grade 8 High
school Grade 4 Grade 8 High
school Grade 4 Grade 8 High
school All states 78.8 78.4 78.2 0.2 0.3 # 11.1 10.0 6.4 8.7 8.9 9.7
Alabama 90.8 88.7 87.1 — — — — — — 8.3 9.6 9.3 Alaska 94.1 89.5 88.4 — — — — — — 4.5 7.5 6.7 Arizona 90.5 89.2 86.0 — — — — — — 7.3 8.0 9.5 Arkansas 87.9 85.2 55.9 — — — — — — 11.2 13.7 40.8 BIE schools — — — — — — — — — — — — California 51.0 75.7 83.9 — — — 37.9 10.5 — 9.4 9.0 9.6 Colorado 89.6 89.0 86.6 — — — — — — 9.1 8.7 9.3 Connecticut 61.9 61.5 62.3 — — — 26.8 25.8 18.0 10.2 9.6 9.7 Delaware 92.3 89.7 83.0 — — — — — — 7.3 8.3 9.8 District of Columbia 90.8 87.9 72.7 — — — — — — 6.9 6.3 4.4 Florida 90.1 86.5 72.1 — — — — — — 8.3 9.2 17.8 Georgia 76.0 70.5 85.1 — — — 15.9 18.0 — 7.6 10.9 13.4 Hawaii 90.4 92.7 89.5 — — — — — — 6.5 3.8 4.2 Idaho 90.6 88.8 88.0 — — — — — — 8.0 9.5 9.1 Illinois 90.3 89.5 84.1 — — — — — — 8.8 8.7 10.1 Indiana 75.6 75.3 74.2 — — — 16.7 13.9 — 6.6 8.5 9.9 Iowa 92.6 92.0 88.6 — — — — — — 6.0 5.1 5.2 Kansas 72.6 65.1 63.2 0.0 0.0 0.0 18.1 24.2 25.5 7.8 8.1 9.0 Kentucky 91.7 88.7 86.6 — — — — — — 7.4 10.0 12.0 Louisiana 71.2 51.7 47.1 — — — 22.6 38.4 38.1 5.8 9.0 12.6 Maine 89.0 88.6 80.4 — — — — — — 8.8 7.9 10.6 Maryland 76.1 63.6 49.6 — — — 16.4 25.2 38.2 7.0 9.5 11.1 See notes at end of exhibit.

143
Exhibit 66. Percentages of students served under IDEA, Part B, in grades 4, 8, and high school who participated in state math assessments, by assessment type and state: School year 2010–11―Continued
State
Regular assessment (grade-level standards)a
Alternate assessmentb Grade-level standardsc Modified standardsd Alternate standardse
Grade 4 Grade 8 High
school Grade 4 Grade 8 High
school Grade 4 Grade 8 High
school Grade 4 Grade 8 High
school Massachusetts 88.8 88.7 87.9 0.3 0.3 0.1 — — — 10.1 9.0 7.3 Michigan 81.8 80.1 72.8 — — — — — — 17.0 18.0 19.1 Minnesota 88.8 72.6 70.7 — — — — 13.8 12.9 9.5 10.7 10.9 Mississippi 87.5 84.6 96.0 — — — — — — 10.8 11.7 — Missouri 90.4 90.0 87.1 — — — — — — 9.4 9.4 8.6 Montana 89.7 86.1 83.6 — — — — — — 7.1 8.2 10.8 Nebraska 92.2 89.8 89.4 — — — — — — 7.6 9.5 9.3 Nevada 90.7 91.2 88.7 — — — — — — 8.5 7.9 7.8 New Hampshire 90.8 92.2 88.5 — — — — — — 8.5 5.8 5.3 New Jersey 92.0 92.0 90.5 — — — — — — 6.8 6.2 7.4 New Mexico 91.9 91.2 89.9 — — — — — — 7.0 7.5 7.5 New York 90.0 88.6 86.1 — — — — — — 8.1 7.3 7.1 North Carolina 71.5 68.6 80.9 — — — 21.4 23.2 — 6.7 7.2 6.2 North Dakota 74.3 68.4 67.9 — — — 13.9 18.6 17.1 9.4 10.7 10.6 Ohio 87.3 87.0 86.6 — — — — — — 11.8 11.3 9.9 Oklahoma 51.2 37.5 24.5 — — — 40.6 55.1 63.2 7.4 6.6 8.6 Oregon 86.6 88.3 82.0 — — — — — — 12.5 10.1 9.3 Pennsylvania 79.2 71.0 67.4 — — — 10.6 18.2 20.0 9.5 9.3 9.5 Puerto Rico 95.6 94.4 91.3 — — — — — — 3.7 3.8 5.1 Rhode Island 90.5 93.6 87.4 — — — — — — 7.8 3.7 5.3 South Carolina 92.3 94.8 92.2 — — — — — — 7.1 4.3 5.2 South Dakota 91.6 90.4 86.0 — — — — — — 8.0 9.2 12.7 Tennessee 42.1 37.7 77.9 — — — 49.1 51.8 — 8.0 9.6 8.5 Texas 52.4 47.1 50.0 — — — 36.8 43.6 40.0 10.3 8.8 7.9 Utah 92.9 86.5 84.1 — — — — — — 6.8 12.3 14.0 Vermont 89.9 93.7 90.0 — — — — — — 8.5 3.7 4.0 Virginia 83.1 77.8 95.0 7.7 13.1 — — — — 8.9 8.1 3.4 See notes at end of exhibit.

144
Exhibit 66. Percentages of students served under IDEA, Part B, in grades 4, 8, and high school who participated in state math assessments, by assessment type and state: School year 2010–11―Continued
State
Regular assessment (grade-level standards)a
Alternate assessmentb Grade-level standardsc Modified standardsd Alternate standardse
Grade 4 Grade 8 High
school Grade 4 Grade 8 High
school Grade 4 Grade 8 High
school Grade 4 Grade 8 High
school Washington 91.2 89.9 70.4 — — — — — — 6.2 5.1 6.1 West Virginia 88.8 86.7 81.6 — — — — — — 8.7 10.1 11.5 Wisconsin 90.9 90.0 89.0 — — — — — — 8.6 8.9 8.3 Wyoming 92.6 89.9 90.4 — — — — — — 7.3 9.2 9.3 — Percentage cannot be calculated because data were not available. # Percentage was non-zero, but < 0.05 or less than 5/100 of 1 percent. aRegular assessment based on grade-level academic achievement standards is an assessment that is designed to measure the student’s knowledge and skills in a particular subject matter based on academic achievement content for the grade in which the student is enrolled. bAlternate assessment is an assessment that is designed to measure the performance of students who are unable to participate in regular assessments even with accommodations. The student’s individualized education program (IEP) team makes the determination of whether a student is able to take the regular assessment. cAlternate assessment based on grade-level academic achievement standards is an alternate assessment that is designed to measure the academic achievement of students with disabilities based on the same grade-level achievement standards measured by the state’s regular assessment. dAlternate assessment based on modified academic achievement standards is an alternate assessment that is designed to measure the academic achievement of students with disabilities who access the general grade-level curriculum, but whose disabilities have precluded them from achieving grade-level proficiency and who (as determined by the IEP team) are not expected to achieve grade-level proficiency within the year covered by the IEP. eAlternate assessment based on alternate academic achievement standards is an alternate assessment that is designed to measure the academic achievement of students with the most significant cognitive disabilities. This assessment may yield results that measure the achievement standards that the state has defined under 34 CFR section 200.1(d). NOTE: Percentage for each state was calculated by dividing the number of students served under IDEA, Part B, by the state who were in the grade level and participated in the specific content area assessment and received a valid score and achievement level by the total number of students served under IDEA, Part B, by the state who were in the grade level during or near the content area testing date, then multiplying the result by 100. Percentage for “All states” was calculated by dividing the number of students served under IDEA, Part B, by all states who were in the grade level and participated in the specific content area assessment and received a valid score and achievement level by the total number of students served under IDEA, Part B, by all states who were in the grade level during or near the content area testing date, then multiplying the result by 100. SOURCE: U.S. Department of Education, Office of Special Education Programs, Data Analysis System (DANS), OMB #1820-0659: “Report of the Participation and Performance of Students with Disabilities on State Assessments,” 2010–11. Data were accessed fall 2012. For actual data used, go to http://www.ed.gov/about/reports/annual/osep.

• Math assessment data for 2010–11 were available for 52 states. Each of these states reported administering a regular assessment based on grade-level academic achievement standards to some students in grade 4, grade 8, and high school, as well as an alternate assessment based on alternate academic achievement standards to some students in grades 4 and 8. All states except Mississippi reported administering an alternate assessment based on alternate academic achievement standards to some students in high school. In contrast, few states reported assessing any student with each of the other types of alternate assessment tests. Specifically, three states reported assessing some students in grade 4 and grade 8 with an alternate assessment based on grade-level academic achievement standards, and two states reported assessing some students in high school with this type of test. An alternate assessment based on modified academic achievement standards was administered to some students in grade 4 by 13 states, in grade 8 by 14 states, and in high school by nine states.
• Of the four types of state math assessment tests, a regular assessment based on grade-level academic achievement standards was taken by larger percentages of the students with disabilities in the 52 states (“All states”) for which data were available in grade 4 (78.8 percent), grade 8 (78.4 percent), and high school (78.2 percent).
• Compared to the other types of assessment tests, a regular assessment based on grade-level academic achievement standards was also taken by a larger percentage of students with disabilities in grade 4 in 51 of the 52 individual states, in grade 8 in 50 of the individual states, and in high school in 51 of the 52 individual states. An alternate assessment based on modified academic achievement standards was the most prevalent type of assessment test taken by students with disabilities in grade 4 in Tennessee (49.1 percent), in grade 8 in Oklahoma (55.1 percent) and Tennessee (51.8 percent), and in high school in Oklahoma (63.2 percent).
145
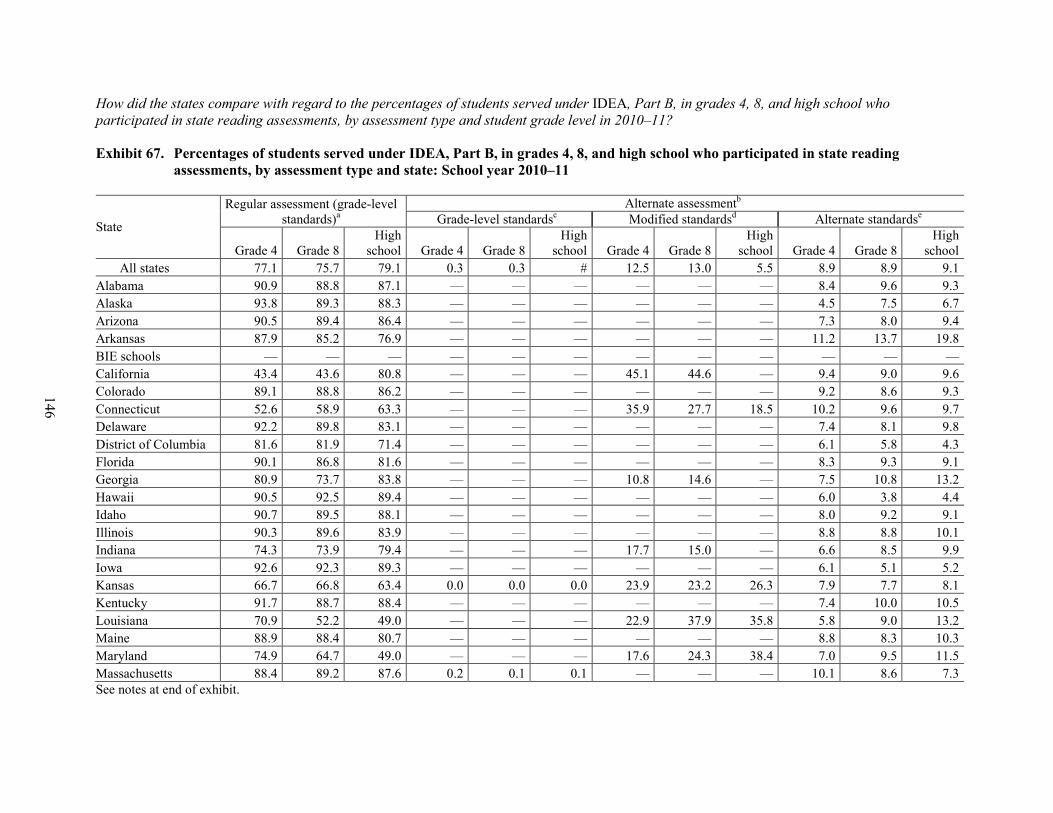
146
How did the states compare with regard to the percentages of students served under IDEA, Part B, in grades 4, 8, and high school who participated in state reading assessments, by assessment type and student grade level in 2010–11?
Exhibit 67. Percentages of students served under IDEA, Part B, in grades 4, 8, and high school who participated in state reading assessments, by assessment type and state: School year 2010–11
State
Regular assessment (grade-level standards)a
Alternate assessmentb Grade-level standardsc Modified standardsd Alternate standardse
Grade 4 Grade 8 High
school Grade 4 Grade 8 High
school Grade 4 Grade 8 High
school Grade 4 Grade 8 High
school All states 77.1 75.7 79.1 0.3 0.3 # 12.5 13.0 5.5 8.9 8.9 9.1
Alabama 90.9 88.8 87.1 — — — — — — 8.4 9.6 9.3 Alaska 93.8 89.3 88.3 — — — — — — 4.5 7.5 6.7 Arizona 90.5 89.4 86.4 — — — — — — 7.3 8.0 9.4 Arkansas 87.9 85.2 76.9 — — — — — — 11.2 13.7 19.8 BIE schools — — — — — — — — — — — — California 43.4 43.6 80.8 — — — 45.1 44.6 — 9.4 9.0 9.6 Colorado 89.1 88.8 86.2 — — — — — — 9.2 8.6 9.3 Connecticut 52.6 58.9 63.3 — — — 35.9 27.7 18.5 10.2 9.6 9.7 Delaware 92.2 89.8 83.1 — — — — — — 7.4 8.1 9.8 District of Columbia 81.6 81.9 71.4 — — — — — — 6.1 5.8 4.3 Florida 90.1 86.8 81.6 — — — — — — 8.3 9.3 9.1 Georgia 80.9 73.7 83.8 — — — 10.8 14.6 — 7.5 10.8 13.2 Hawaii 90.5 92.5 89.4 — — — — — — 6.0 3.8 4.4 Idaho 90.7 89.5 88.1 — — — — — — 8.0 9.2 9.1 Illinois 90.3 89.6 83.9 — — — — — — 8.8 8.8 10.1 Indiana 74.3 73.9 79.4 — — — 17.7 15.0 — 6.6 8.5 9.9 Iowa 92.6 92.3 89.3 — — — — — — 6.1 5.1 5.2 Kansas 66.7 66.8 63.4 0.0 0.0 0.0 23.9 23.2 26.3 7.9 7.7 8.1 Kentucky 91.7 88.7 88.4 — — — — — — 7.4 10.0 10.5 Louisiana 70.9 52.2 49.0 — — — 22.9 37.9 35.8 5.8 9.0 13.2 Maine 88.9 88.4 80.7 — — — — — — 8.8 8.3 10.3 Maryland 74.9 64.7 49.0 — — — 17.6 24.3 38.4 7.0 9.5 11.5 Massachusetts 88.4 89.2 87.6 0.2 0.1 0.1 — — — 10.1 8.6 7.3 See notes at end of exhibit.

147
Exhibit 67. Percentages of students served under IDEA, Part B, in grades 4, 8, and high school who participated in state reading assessments, by assessment type and state: School year 2010–11―Continued
State
Regular assessment (grade-level standards)a
Alternate assessmentb Grade-level standardsc Modified standardsd Alternate standardse
Grade 4 Grade 8 High
school Grade 4 Grade 8 High
school Grade 4 Grade 8 High
school Grade 4 Grade 8 High
school Michigan 79.9 79.9 73.5 — — — — — — 19.0 18.5 19.1 Minnesota 88.6 72.7 72.9 — — — — 14.0 12.9 10.0 10.5 10.0 Mississippi 87.6 84.3 96.4 — — — — — — 10.8 11.7 — Missouri 90.5 90.1 88.0 — — — — — — 9.4 9.4 8.5 Montana 87.9 88.7 85.1 — — — — — — 7.1 8.2 10.8 Nebraska 92.2 90.0 89.8 — — — — — — 7.6 9.3 9.1 Nevada 90.8 91.2 88.6 — — — — — — 8.6 8.1 7.8 New Hampshire 90.9 92.3 89.4 — — — — — — 8.5 5.8 5.4 New Jersey 91.8 92.3 90.8 — — — — — — 7.1 6.2 7.2 New Mexico 91.9 90.8 90.2 — — — — — — 7.2 7.9 8.0 New York 89.9 88.9 81.5 — — — — — — 8.1 7.2 7.3 North Carolina 66.7 66.5 78.2 — — # 26.2 25.1 — 6.7 7.2 6.0 North Dakota 67.5 65.8 70.6 — — — 20.2 21.1 15.1 9.4 10.4 10.2 Ohio 87.4 87.1 86.6 — — — — — — 11.8 11.3 10.0 Oklahoma 43.8 37.0 27.0 — — — 47.9 55.6 61.7 7.3 6.5 8.2 Oregon 84.3 88.1 85.3 — — — — — — 14.5 10.3 8.9 Pennsylvania 74.6 72.8 68.9 — — — 15.0 16.1 18.3 9.5 9.3 9.5 Puerto Rico 95.3 94.2 91.5 — — — — — — 3.7 3.9 5.1 Rhode Island 90.4 93.7 87.5 — — — — — — 7.8 3.7 5.2 South Carolina 90.2 94.8 92.2 — — — — — — 7.1 4.3 5.2 South Dakota 91.6 90.4 86.0 — — — — — — 8.0 9.2 12.7 Tennessee 42.1 37.8 76.1 — — — 49.2 51.7 — 7.9 9.5 8.9 Texas 50.6 51.8 58.5 — — — 38.4 38.8 31.5 10.2 8.8 7.8 Utah 92.9 89.3 87.7 — — — — — — 6.8 10.1 11.0 Vermont 88.8 94.0 91.2 — — — — — — 10.0 3.9 3.9 Virginia 79.6 80.5 90.1 11.3 11.1 — — — — 8.9 7.7 8.7 Washington 91.3 90.2 80.2 — — — — — — 6.2 5.1 6.1 See notes at end of exhibit.

148
Exhibit 67. Percentages of students served under IDEA, Part B, in grades 4, 8, and high school who participated in state reading assessments, by assessment type and state: School year 2010–11―Continued
State
Regular assessment (grade-level standards)a
Alternate assessmentb Grade-level standardsc Modified standardsd Alternate standardse
Grade 4 Grade 8 High
school Grade 4 Grade 8 High
school Grade 4 Grade 8 High
school Grade 4 Grade 8 High
school West Virginia 88.9 86.8 81.7 — — — — — — 8.6 10.1 11.5 Wisconsin 90.3 89.4 89.2 — — — — — — 8.6 8.9 8.3 Wyoming 92.6 89.7 90.4 — — — — — — 7.3 9.1 9.3 — Percentage cannot be calculated because data were not available. # Percentage was non-zero, but < 0.05 or less than 5/100 of 1 percent. aRegular assessment based on grade-level academic achievement standards is an assessment that is designed to measure the student’s knowledge and skills in a particular subject matter based on academic achievement standards appropriate to the student’s grade level. bAlternate assessment is an assessment that is designed to measure the performance of students who are unable to participate in general large-scale assessments even with accommodations. The student’s individualized education program (IEP) team makes the determination of whether a student is able to take the regular assessment. cAlternate assessment based on grade-level academic achievement standards is an alternate assessment that is designed to measure the academic achievement of students with disabilities based on the same grade-level achievement standards measured by the state’s regular assessment. dAlternate assessment based on modified academic achievement standards is an alternate assessment that is designed to measure the academic achievement of students with disabilities who access the general grade-level curriculum, but whose disabilities have precluded them from achieving grade-level proficiency and who (as determined by the IEP team) are not expected to achieve grade-level proficiency within the year covered by the IEP. eAlternate assessment based on alternate academic achievement standards is an alternate assessment that is designed to measure the academic achievement of students with the most significant cognitive disabilities. This assessment may yield results that measure the achievement standards that the state has defined under 34 CFR section 200.1(d). NOTE: Percentage for each state was calculated by dividing the number of students served under IDEA, Part B, by the state who were in the grade level and participated in the specific content area assessment and received a valid score and achievement level by the total number of students served under IDEA, Part B, by the state who were in the grade level during or near the content area testing date, then multiplying the result by 100. Percentage for “All states” was calculated by dividing the number of students served under IDEA, Part B, by all states who were in the grade level and participated in the specific content area assessment and received a valid score and achievement level by the total number of students served under IDEA, Part B, by all states who were in the grade level during or near the content area testing date, then multiplying the result by 100. The students who participated in the regular reading assessments include students with limited English proficiency served under IDEA, Part B, who at the time of the reading assessments, had been in the United States fewer than 12 months and took the English language proficiency tests in place of the regular reading assessments. In the case of PR, language proficiency is determined with regard to Spanish. SOURCE: U.S. Department of Education, Office of Special Education Programs, Data Analysis System (DANS), OMB #1820-0659: “Report of the Participation and Performance of Students with Disabilities on State Assessments,” 2010–11. Data were accessed fall 2012. For actual data used, go to http://www.ed.gov/about/reports/annual/osep.

• Reading assessment data for 2010–11 were available for 52 states. Each of these states reported administering a regular assessment based on grade-level academic achievement standards to some students in grade 4, grade 8, and high school, as well as an alternate assessment based on alternate academic achievement standards to some students in grades 4 and 8. All states except Mississippi reported administering an alternate assessment based on alternate academic achievement standards to some students in high school. In contrast, few states reported assessing any student with each of the other types of alternate assessment tests. Specifically, three states reported assessing some students in grade 4, grade 8, and high school with an alternate assessment based on grade-level academic achievement standards. An alternate assessment based on modified academic achievement standards was administered to some students in grade 4 by 13 states, in grade 8 by 14 states, and in high school by nine states.
• Of the four types of state reading assessment tests, a regular assessment based on grade-level academic achievement standards was taken by larger percentages of the students with disabilities in the 52 states (“All states”) for which data were available in grade 4 (77.1 percent), grade 8 (75.7 percent), and high school (79.1 percent).
• Compared to the other types of reading assessment tests, a regular assessment based on grade-level academic achievement standards was taken by a larger percentage of students with disabilities in grade 4 in 49 of the 52 individual states, in grade 8 in 49 individual states, and in high school in 51 individual states. An alternate assessment based on modified academic achievement standards was the most prevalent type of assessment test taken by students with disabilities in grade 4 in California (45.1 percent), Oklahoma (47.9 percent), and Tennessee (49.1 percent); in grade 8 in California (44.6 percent), Oklahoma (55.6 percent), and Tennessee (51.7 percent); and in high school in Oklahoma (61.7 percent).
149

150
Part B Exiting
How did the states compare with regard to the percentages of students ages 14 through 21 served under IDEA, Part B, exiting IDEA, Part B, and school by graduating or dropping out in 2010–11, and how did the percentages change between 2007–08 and 2010–11?
Exhibit 68. Percentages of students ages 14 through 21 exiting IDEA, Part B, and school who graduated with a regular high school diploma or dropped out of school, by year and state: 2007–08 and 2010–11
State 2007–08 2010–11 Change between 2007–08
and 2010–11a Percent change between 2007–08 and 2010–11b
Graduatedc Dropped outd Graduatedc Dropped outd Graduatedc Dropped outd Graduatedc Dropped outd All states 59.0 24.6 63.6 20.1 4.5 -4.5 7.7 -18.2
Alabama 30.0 26.2 44.4 16.3 14.4 -9.9 48.1 -37.7 Alaska 47.1 37.9 48.5 34.7 1.4 -3.2 2.9 -8.4 Arizona 70.4 28.6 79.5 19.8 9.1 -8.8 12.9 -30.9 Arkansas 78.9 18.7 82.8 14.9 3.9 -3.8 5.0 -20.5 BIE schools 52.1 39.6 — — — — — — California 50.9 21.5 54.0 17.4 3.1 -4.1 6.1 -19.0 Colorado 62.9 31.6 66.4 29.9 3.5 -1.7 5.5 -5.5 Connecticut 77.8 18.4 80.2 16.5 2.4 -1.9 3.0 -10.2 Delaware 51.7 38.5 69.2 26.0 17.4 -12.5 33.7 -32.6 District of Columbia — — 52.4 38.9 — — — — Florida 45.2 26.5 53.3 20.0 8.1 -6.5 17.9 -24.7 Georgia 37.3 27.8 40.8 28.3 3.5 0.5 9.4 1.7 Hawaii 79.2 4.4 77.8 9.8 -1.4 5.4 -1.8 123.4 Idaho 48.9 26.2 34.6 15.9 -14.3 -10.4 -29.2 -39.6 Illinois 74.0 24.2 78.8 18.3 4.8 -5.9 6.5 -24.2 Indiana 55.3 29.8 75.0 11.5 19.7 -18.3 35.6 -61.5 Iowa 70.9 26.2 77.6 21.2 6.7 -5.0 9.5 -19.2 Kansas 70.2 27.9 78.8 18.5 8.7 -9.4 12.4 -33.6 Kentucky 67.4 23.3 74.1 14.5 6.7 -8.7 10.0 -37.5 Louisiana 26.6 45.9 28.8 37.2 2.2 -8.6 8.3 -18.8 Maine 69.8 25.3 75.7 20.6 5.9 -4.8 8.4 -18.9 Maryland 61.9 26.0 63.8 24.4 1.8 -1.5 3.0 -5.9 See notes at end of exhibit.

151
Exhibit 68. Percentages of students ages 14 through 21 exiting IDEA, Part B, and school who graduated with a regular high school diploma or dropped out of school, by year and state: 2007–08 and 2010–11―Continued
State 2007–08 2010–11 Change between 2007–08
and 2010–11a Percent change between 2007–08 and 2010–11b
Graduatedc Dropped outd Graduatedc Dropped outd Graduatedc Dropped outd Graduatedc Dropped outd Massachusetts 68.7 23.6 68.3 22.6 -0.4 -1.0 -0.5 -4.4 Michigan 69.3 28.1 67.1 26.9 -2.2 -1.2 -3.2 -4.3 Minnesota 78.8 20.7 87.9 10.6 9.1 -10.1 11.5 -48.6 Mississippi 23.0 16.8 27.7 10.8 4.7 -6.0 20.3 -35.9 Missouri 73.0 24.6 79.3 18.6 6.4 -6.0 8.7 -24.3 Montana 69.0 30.2 74.1 25.1 5.1 -5.1 7.4 -16.9 Nebraska 73.6 21.4 79.0 17.8 5.4 -3.6 7.3 -16.8 Nevada 14.6 40.9 23.5 34.3 8.8 -6.5 60.4 -15.9 New Hampshire 65.8 29.2 77.1 12.4 11.2 -16.8 17.1 -57.5 New Jersey 77.5 20.6 82.7 15.4 5.3 -5.3 6.8 -25.6 New Mexico 57.6 14.9 51.4 32.0 -6.2 17.2 -10.8 115.6 New York 50.4 27.3 59.0 20.6 8.6 -6.7 17.0 -24.5 North Carolina 53.7 36.7 64.0 28.7 10.3 -8.0 19.1 -21.7 North Dakota 73.1 22.4 69.1 25.9 -4.0 3.5 -5.5 15.6 Ohio 34.6 12.9 50.5 19.1 15.9 6.2 45.8 48.2 Oklahoma 69.0 30.4 80.5 19.2 11.5 -11.2 16.7 -37.0 Oregon 46.5 27.7 45.8 24.7 -0.8 -2.9 -1.6 -10.5 Pennsylvania 86.6 12.2 87.3 10.9 0.7 -1.3 0.8 -10.4 Puerto Rico 51.8 38.7 46.7 43.4 -5.1 4.7 -9.8 12.1 Rhode Island 71.5 22.9 78.2 16.5 6.7 -6.4 9.4 -27.9 South Carolina 35.7 45.8 39.4 52.3 3.6 6.5 10.2 14.3 South Dakota 66.2 31.2 67.7 22.6 1.5 -8.6 2.3 -27.4 Tennessee 58.0 16.6 75.1 7.5 17.1 -9.0 29.5 -54.4 Texas — — 54.0 16.9 — — — — Utah 64.0 27.5 14.8 76.3 -49.2 48.9 -76.9 177.9 Vermont — — 74.4 22.3 — — — — Virginia 42.3 16.0 51.1 10.0 8.8 -6.0 20.8 -37.2 Washington 66.2 30.8 67.3 28.6 1.1 -2.2 1.7 -7.2 See notes at end of exhibit.

152
Exhibit 68. Percentages of students ages 14 through 21 exiting IDEA, Part B, and school who graduated with a regular high school diploma or dropped out of school, by year and state: 2007–08 and 2010–11―Continued
State 2007–08 2010–11 Change between 2007–08
and 2010–11a Percent change between 2007–08 and 2010–11b
Graduatedc Dropped outd Graduatedc Dropped outd Graduatedc Dropped outd Graduatedc Dropped outd West Virginia 65.0 27.4 68.2 21.4 3.2 -6.0 4.9 -21.9 Wisconsin 74.6 21.7 76.2 19.3 1.6 -2.4 2.2 -10.9 Wyoming 59.2 32.5 64.3 23.6 5.2 -8.9 8.7 -27.4 — Percentage cannot be calculated because data were not available. aChange between 2007–08 and 2010–11 was calculated for each state and “All states” by subtracting the percentage for 2007–08 from the percentage for 2010–11. Due to rounding, it may not be possible to reproduce the difference from the values presented in the exhibit. bPercent change between 2007–08 and 2010–11 was calculated for each state and “All states” by subtracting the percentage for 2007–08 from the percentage for 2010–11, dividing the difference by the percentage for 2007–08, then multiplying the result by 100. Due to rounding, it may not be possible to reproduce the percent change from the values presented in the exhibit. cGraduated with a regular high school diploma refers to students ages 14 through 21 served under IDEA, Part B, who exited an educational program through receipt of a high school diploma identical to that for which students without disabilities were eligible. These were students with disabilities who met the same standards for graduation as those for students without disabilities. dDropped out refers to students ages 14 through 21 served under IDEA, Part B, who were enrolled at the start of the reporting period, were not enrolled at the end of the reporting period, and did not exit special education through any other basis, such as moved, known to be continuing. NOTE: The U.S. Department of Education collects data on seven categories of exiters from special education (i.e., the Part B program in which the student was enrolled at the start of the reporting period). The categories include five categories of exiters from both special education and school (i.e., graduated with a regular high school diploma, received a certificate, dropped out, reached maximum age for services, and died) and two categories of exiters from special education, but not school (i.e., transferred to regular education and moved, known to be continuing in education). The seven categories are mutually exclusive. This exhibit provides percentages for only two categories of exiters from both special education and school (i.e., graduated with a regular high school diploma and dropped out). For data on all seven categories of exiters, see exhibit 69. Percentage for each state was calculated by dividing the number of students ages 14 through 21 served under IDEA, Part B, by the state who were reported in the exit reason category for the year by the total number of students ages 14 through 21 served under IDEA, Part B, by the state who were reported in the five exit-from-both-special education-and-school categories for that year, then multiplying the result by 100. Percentage for “All states” was calculated for all states with available data by dividing the number of students ages 14 through 21 served under IDEA, Part B, by all states who were reported in the exit reason category for the year by the total number of students ages 14 through 21 served under IDEA, Part B, by all states who were reported in the five exit-from-both-special education-and-school categories for that year, then multiplying the result by 100. The percentages of students who exited special education and school by graduating and dropping out included in this report are not comparable to the graduation and dropout rates required under the Elementary and Secondary Education Act of 1965, as amended (ESEA). The factors used to calculate percentages of students who exited special education and school by graduating and dropping out are different from those used to calculate graduation and dropout rates. In particular, states often rely on factors such as the number of students who graduated in four years with a regular high school diploma and the number of students who entered high school four years earlier to determine their graduation and dropout rates under ESEA, as amended. For 2007–08, data are from the reporting period between July 1, 2007 and June 30, 2008. For 2010–11, data are from the reporting period between July 1, 2010, and June 30, 2011. SOURCE: U.S. Department of Education, Office of Special Education Programs, Data Analysis System (DANS), OMB #1820-0521: “Report of Children with Disabilities Exiting Special Education,” 2007–08 and 2010–11. Data for 2007–08 were accessed spring 2012. Data for 2010–11 were accessed fall 2012. For actual data used, go to http://www.ed.gov/about/reports/annual/osep.

• In 2010–11, a total of 63.6 percent of students ages 14 through 21 who exited services under IDEA, Part B, and school in the 52 states (“All states”) for which data were available graduated with a regular high school diploma. In the following four states, less than 30 percent of the students who exited services under IDEA, Part B, and school, graduated with a regular high school diploma: Louisiana (28.8 percent), Mississippi (27.7 percent), Nevada (23.5 percent), and Utah (14.8 percent). In contrast, more than 80 percent of such students graduated with a regular high school diploma in the following six states: Minnesota (87.9 percent), Pennsylvania (87.3 percent), Arkansas (82.8 percent), New Jersey (82.7 percent), Oklahoma (80.5 percent), and Connecticut (80.2 percent).
• In 2007–08, a total of 59 percent of students ages 14 through 21 who exited services under IDEA, Part B, and school in the 50 states (“All states”) for which data were available graduated with a regular high school diploma.
• In 40 of the 49 states for which data were available for 2007–08 and 2010–11, the percentage of students who exited IDEA, Part B, and school who graduated with a regular high school diploma increased. Of those 40 states, the following five were associated with a percent change increase larger than 30 percent: Nevada (60.4 percent), Alabama (48.1 percent), Ohio (45.8 percent), Indiana (35.6 percent), and Delaware (33.7 percent). In contrast, the percent change decrease was larger than 10 percent in only three of the nine states in which the percentage of students who exited IDEA, Part B, and school who graduated with a regular high school diploma decreased. The three states were Utah (-76.9 percent), Idaho (-29.2 percent), and New Mexico (-10.8 percent).
• In 2010–11, a total of 20.1 percent of students ages 14 through 21 who exited services under IDEA, Part B, and school in the 52 states (“All states”) for which data were available dropped out. The percentages for the individual states ranged from 7.5 percent to 76.3 percent. In the following seven states, less than 12 percent dropped out: Indiana (11.5 percent), Pennsylvania (10.9 percent), Mississippi (10.8 percent), Minnesota (10.6 percent), Virginia (10.0 percent), Hawaii (9.8 percent), and Tennessee (7.5 percent). Yet, in the following five states, more than 35 percent dropped out: Utah (76.3 percent), South Carolina (52.3 percent), Puerto Rico (43.4 percent), the District of Columbia (38.9 percent), and Louisiana (37.2 percent).
• In 2007–08, a total of 24.6 percent of students ages 14 through 21 who exited services under IDEA, Part B, and school in the 50 states (“All states”) for which data were available dropped out.
• In 41 of the 49 states for which data were available for 2007–08 and 2010–11, the percentage of students who exited IDEA, Part B, and school who dropped out decreased. Of those 41 states, the following four were associated with a percent change decrease of more than 40 percent: Indiana (-61.5 percent), New Hampshire (-57.5 percent), Tennessee (-54.4 percent), and Minnesota (-48.6 percent). A percent change increase of more than 20 percent was found for the following four of the eight states for which an increase in the percentage of dropouts was found: Utah (177.9 percent), Hawaii (123.4 percent), New Mexico (115.6 percent), and Ohio (48.2 percent).
153

How did the states compare with regard to the percentage of students ages 14 through 21 who exited special education for specific reasons in 2010–11?
Exhibit 69. Percentage of students ages 14 through 21 exiting IDEA, Part B, by exit reason and state: 2010−11
State
Graduated with a
regular diploma
Received a certificate
Dropped out
Reached maximum
age Died
Transferred to regular education
Moved, known to
be continuing
All states 39.6 9.1 12.5 0.8 0.2 9.5 28.2 Alabama 27.2 21.8 10.0 2.0 0.3 6.6 32.1 Alaska 32.4 10.2 23.2 0.7 0.3 11.9 21.3 Arizona 47.2 — 11.7 0.3 0.1 9.1 31.6 Arkansas 38.5 0.7 6.9 0.1 0.2 6.2 47.3 BIE schools — — — — — — — California 29.5 13.6 9.5 1.7 0.3 9.1 36.3 Colorado 36.0 0.8 16.2 1.0 0.2 11.1 34.7 Connecticut 61.0 0.3 12.6 2.2 0.1 12.4 11.6 Delaware 30.8 1.3 11.6 0.4 0.4 8.0 47.4 District of Columbia 37.9 5.4 28.2 0.0 0.9 5.8 21.7 Florida 27.3 13.5 10.2 — 0.2 5.1 43.6 Georgia 26.3 19.6 18.2 — 0.3 7.1 28.4 Hawaii 57.8 6.8 7.2 2.0 0.5 18.7 7.1 Idaho 16.7 22.6 7.7 x x 17.3 34.3 Illinois 49.5 0.5 11.5 1.1 0.2 9.8 27.3 Indiana 62.5 10.4 9.6 0.7 0.2 5.6 11.1 Iowa 53.8 — 14.7 0.7 0.2 19.9 10.7 Kansas 45.9 — 10.8 1.2 0.3 12.3 29.4 Kentucky 49.2 6.5 9.7 0.7 0.3 15.6 18.0 Louisiana 21.2 24.1 27.4 0.5 0.4 16.7 9.7 Maine 49.5 1.5 13.4 0.6 0.3 21.7 13.0 Maryland 40.3 6.7 15.4 0.5 0.3 10.2 26.6 Massachusetts 53.4 4.1 17.6 2.9 0.1 9.4 12.4 Michigan 38.7 3.2 15.5 — 0.2 7.2 35.1 Minnesota 70.7 — 8.6 1.0 0.1 5.7 13.9 Mississippi 21.6 47.2 8.4 0.6 0.2 3.9 18.2 Missouri 51.7 0.2 12.1 0.9 0.2 11.8 22.9 Montana 47.4 — 16.0 0.0 0.5 10.2 25.9 Nebraska 59.2 1.6 13.3 0.5 0.3 22.8 2.3 Nevada 17.0 28.5 24.8 1.7 0.3 5.4 22.3 New Hampshire 51.0 5.8 8.2 1.0 0.2 23.3 10.5 New Jersey 60.2 — 11.2 1.1 0.2 5.1 22.1 New Mexico 34.5 10.8 21.5 x x 6.4 26.4 New York 39.5 12.8 13.8 0.6 0.2 6.7 26.3 North Carolina 35.7 3.6 16.0 0.1 0.3 11.9 32.4 North Dakota 36.5 — 13.7 2.3 0.4 14.8 32.4 Ohio 26.9 15.9 10.2 0.1 0.2 1.8 44.9 See notes at end of exhibit.
154

Exhibit 69. Percentage of students ages 14 through 21 exiting IDEA, Part B, by exit reason and state: 2010−11―Continued
State
Graduated with a
regular diploma
Received a certificate
Dropped out
Reached maximum
age Died
Transferred to regular education
Moved, known to
be continuing
Oklahoma 43.7 — 10.4 x x 5.3 40.4 Oregon 24.0 12.3 13.0 3.0 0.2 13.9 33.8 Pennsylvania 55.8 0.3 7.0 0.7 0.2 6.4 29.7 Puerto Rico 38.9 5.3 36.1 2.6 0.3 8.0 8.9 Rhode Island 40.9 0.5 8.6 2.1 0.2 8.9 38.7 South Carolina 24.2 1.1 32.2 3.8 0.2 6.2 32.3 South Dakota 26.1 — 8.7 3.3 0.4 26.2 35.2 Tennessee 45.9 10.3 4.6 x x 5.4 33.4 Texas 38.1 20.2 11.9 0.1 0.3 14.5 15.0 Utah 5.2 0.0 27.0 2.8 0.4 20.2 44.4 Vermont 45.2 0.0 13.5 x x 21.4 17.9 Virginia 30.6 22.9 6.0 0.1 0.2 26.4 13.8 Washington 40.7 2.0 17.3 0.3 0.2 6.8 32.7 West Virginia 45.6 6.5 14.3 0.2 0.3 6.8 26.3 Wisconsin 57.8 1.8 14.6 1.4 0.2 19.1 5.1 Wyoming 31.4 3.6 11.5 x x 14.9 36.3 x Percentage cannot be calculated because data were suppressed to limit disclosure. — Percentage cannot be calculated because data were not available. NOTE: The U.S. Department of Education collects data on seven categories of exiters from special education (i.e., the Part B program in which the student was enrolled at the start of the reporting period). The categories include five categories of exiters from both special education and school (i.e., graduated with a regular high school diploma, received a certificate, dropped out, reached maximum age for services, and died) and two categories of exiters from special education, but not school (i.e., transferred to regular education and moved, known to be continuing in education). The seven categories are mutually exclusive. Percentage for each state was calculated by dividing the number of students ages 14 through 21 served under IDEA, Part B, by the state who were reported in the exit reason category by the total number of students ages 14 through 21 served under IDEA, Part B, by the state who were reported in all the exiting categories, then multiplying the result by 100. Percentage for “All states” was calculated for all states with available data by dividing the number of students ages 14 through 21 served under IDEA, Part B, by all states who were reported in the exit reason category by the total number of students ages 14 through 21 served under IDEA, Part B, by all states who were reported in all the exiting categories, then multiplying the result by 100. Percentage for “All states” includes suppressed data. Data are from the reporting period between July 1, 2010, and June 30, 2011. SOURCE: U.S. Department of Education, Office of Special Education Programs, Data Analysis System (DANS), OMB #1820-0521: “Report of Children with Disabilities Exiting Special Education,” 2010–11. Data were accessed fall 2012. For actual data used, go to http://www.ed.gov/about/reports/annual/osep.
• In 2010–11, a total of 39.6 percent of students ages 14 through 21 exiting IDEA, Part B, in the 52 states (“All states”) for which data were available graduated with a regular high school diploma. The percentage for this exit reason category was larger than that for each of the other exit reason categories. The prevalence of this category is underscored by the finding that in 36 of the 52 individual states, this category was associated with the largest percentage of students who exited special education. In 12 of those states, this category represented a majority of the students who exited special education. In the following four of those states, the percentage was more than 60 percent: Minnesota (70.7 percent), Indiana (62.5 percent), Connecticut (61.0 percent), and New Jersey (60.2 percent).
155
• The second most prevalent exit reason, accounting for 28.2 percent of students who exited special education in “All states” in 2010–11, was moved, known to be continuing in education. In 13 of the 52 individual states, this category was associated with the largest percentage of students who exited special education. Yet in no state was a majority of students who exited special education associated with this exit reason category.
• Three states presented somewhat distinct distributions of exit reasons for students ages 14 through 21 served under IDEA, Part B, who exited special education in 2010–11. In Mississippi and Nevada, the largest percentage of the students, representing 47.2 percent and 28.5 percent, respectively, was classified as received a certificate. In Louisiana, the largest percentage of the students exiting special education, representing 27.4 percent, was associated with the category of dropped out.
156

Part B Personnel
How did the states compare with regard to the following ratios in 2010:
1. the number of all full-time equivalent (FTE) special education teachers employed to provide special education and related services for students ages 6 through 21 per 100 students served under IDEA, Part B;
2. the number of FTE highly qualified special education teachers employed to provide special education and related services for students ages 6 through 21 per 100 students served under IDEA, Part B; and
3. the number of FTE not highly qualified special education teachers employed to provide special education and related services for students ages 6 through 21 per 100 students served under IDEA, Part B?
Exhibit 70. Number of full-time equivalent (FTE) special education teachers employed to provide special education and related services for students ages 6 through 21 per 100 students served under IDEA, Part B, by qualification status and state: Fall 2010
State All FTE special
education teachers
FTE highly qualifieda special
education teachers
FTE not highly qualified special
education teachers Per 100 students served
All states 6.4 6.0 0.4 Alabama 7.0 6.6 0.3 Alaska 6.7 5.6 1.1 Arizona 5.9 5.5 0.4 Arkansas 7.4 6.8 0.6 BIE schools 7.3 7.1 0.2 California 3.5 3.3 0.2 Colorado 6.6 6.1 0.5 Connecticut 8.9 8.9 # Delaware 3.3 3.0 0.3 District of Columbia 8.5 6.8 1.7 Florida 3.3 2.5 0.7 Georgia 10.3 9.5 0.8 Hawaii 10.7 8.8 1.9 Idaho 3.7 3.3 0.4 Illinois 7.8 7.8 # Indiana 1.3 1.2 0.1 Iowa 8.8 8.8 0.0 Kansas 7.3 5.2 2.1 Kentucky 8.0 7.8 0.2 Louisiana 7.8 7.3 0.4 Maine 7.0 6.5 0.5 Maryland 9.4 8.2 1.1 Massachusetts 5.4 5.2 0.3 Michigan 6.7 6.7 # See notes at end of exhibit.
157
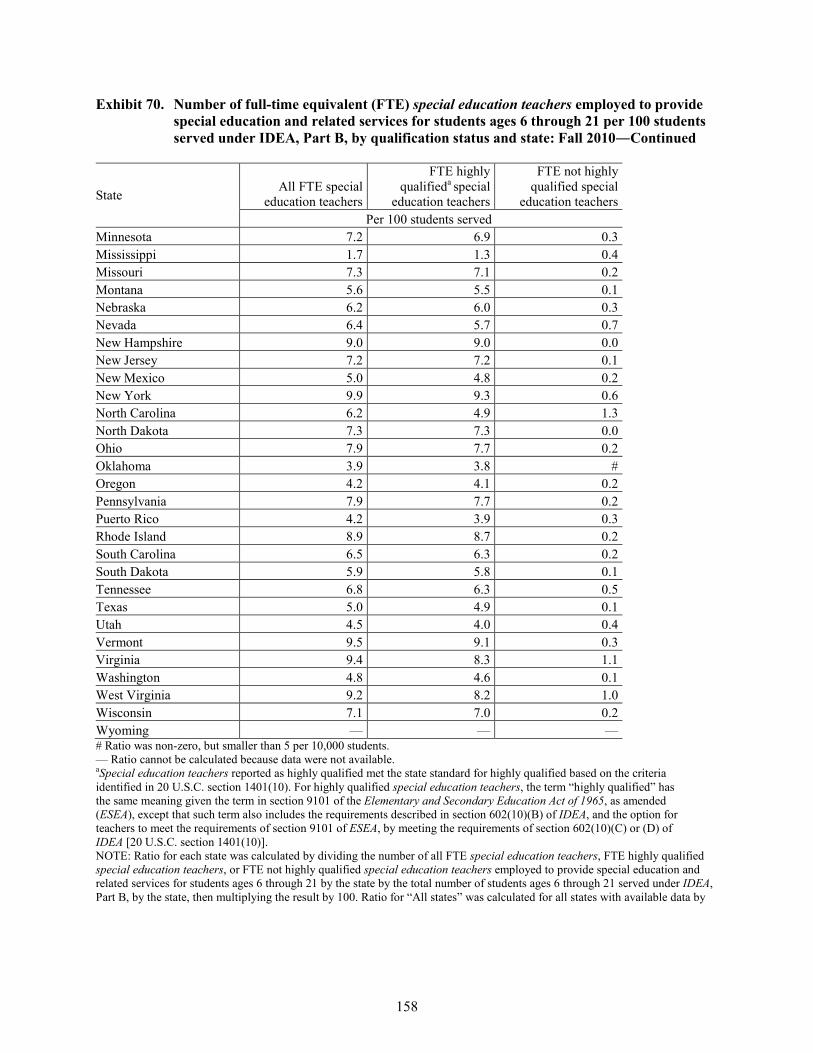
Exhibit 70. Number of full-time equivalent (FTE) special education teachers employed to provide special education and related services for students ages 6 through 21 per 100 students served under IDEA, Part B, by qualification status and state: Fall 2010―Continued
State All FTE special
education teachers
FTE highly qualifieda special
education teachers
FTE not highly qualified special
education teachers Per 100 students served
Minnesota 7.2 6.9 0.3 Mississippi 1.7 1.3 0.4 Missouri 7.3 7.1 0.2 Montana 5.6 5.5 0.1 Nebraska 6.2 6.0 0.3 Nevada 6.4 5.7 0.7 New Hampshire 9.0 9.0 0.0 New Jersey 7.2 7.2 0.1 New Mexico 5.0 4.8 0.2 New York 9.9 9.3 0.6 North Carolina 6.2 4.9 1.3 North Dakota 7.3 7.3 0.0 Ohio 7.9 7.7 0.2 Oklahoma 3.9 3.8 # Oregon 4.2 4.1 0.2 Pennsylvania 7.9 7.7 0.2 Puerto Rico 4.2 3.9 0.3 Rhode Island 8.9 8.7 0.2 South Carolina 6.5 6.3 0.2 South Dakota 5.9 5.8 0.1 Tennessee 6.8 6.3 0.5 Texas 5.0 4.9 0.1 Utah 4.5 4.0 0.4 Vermont 9.5 9.1 0.3 Virginia 9.4 8.3 1.1 Washington 4.8 4.6 0.1 West Virginia 9.2 8.2 1.0 Wisconsin 7.1 7.0 0.2 Wyoming — — — # Ratio was non-zero, but smaller than 5 per 10,000 students. — Ratio cannot be calculated because data were not available. aSpecial education teachers reported as highly qualified met the state standard for highly qualified based on the criteria identified in 20 U.S.C. section 1401(10). For highly qualified special education teachers, the term “highly qualified” has the same meaning given the term in section 9101 of the Elementary and Secondary Education Act of 1965, as amended (ESEA), except that such term also includes the requirements described in section 602(10)(B) of IDEA, and the option for teachers to meet the requirements of section 9101 of ESEA, by meeting the requirements of section 602(10)(C) or (D) of IDEA [20 U.S.C. section 1401(10)]. NOTE: Ratio for each state was calculated by dividing the number of all FTE special education teachers, FTE highly qualified special education teachers, or FTE not highly qualified special education teachers employed to provide special education and related services for students ages 6 through 21 by the state by the total number of students ages 6 through 21 served under IDEA, Part B, by the state, then multiplying the result by 100. Ratio for “All states” was calculated for all states with available data by
158

• In 2010, there were 6.4 FTE special education teachers (including those who were highly qualified and those who were not highly qualified) employed by the 52 states (“All states”) for which data were available to provide special education and related services for students ages 6 through 21 served under IDEA, Part B, per 100 students ages 6 through 21 served under IDEA, Part B.
• A ratio of 10 or more FTE special education teachers per 100 students was found for Hawaii (10.7 FTEs per 100 students) and Georgia (10.3 FTEs per 100 students). In contrast, a ratio smaller than 4 FTE special education teachers per 100 students was found for the following seven states: Oklahoma (3.9 FTEs per 100 students), Idaho (3.7 FTEs per 100 students), California (3.5 FTEs per 100 students), Delaware (3.3 FTEs per 100 students), Florida (3.3 FTEs per 100 students), Mississippi (1.7 FTEs per 100 students), and Indiana (1.3 FTEs per 100 students).
• In 2010, there were 6 FTE highly qualified special education teachers employed by “All states” to provide special education and related services for students ages 6 through 21 per 100 students ages 6 through 21 served under IDEA, Part B. A ratio of 9 or more highly qualified FTE special education teachers per 100 students was found for the following three states: Georgia (9.5 FTEs per 100 students), New York (9.3 FTEs per 100 students), and Vermont (9.1 FTEs per 100 students). In contrast, a ratio smaller than 3 FTE highly qualified special education teachers per 100 students was found for the following three states: Florida (2.5 FTEs per 100 students), Mississippi (1.3 FTEs per 100 students), and Indiana (1.2 FTEs per 100 students).
• In 2010, there was 0.4 FTE not highly qualified special education teacher employed by “All states” to provide special education and related services for students ages 6 through 21 per 100 students ages 6 through 21 served under IDEA, Part B. The ratio was smaller than 1 FTE not highly qualified special education teacher per 100 students for all but the following eight states: Kansas (2.1 FTEs per 100 students), Hawaii (1.9 FTEs per 100 students), the District of Columbia (1.7 FTEs per 100 students), North Carolina (1.3 FTEs per 100 students), Maryland (1.1 FTEs per 100 students), Virginia (1.1 FTEs per 100 students), Alaska (1.1 FTEs per 100 students), and West Virginia (1.0 FTE per 100 students).
dividing the number of all FTE special education teachers, FTE highly qualified special education teachers, or FTE not highly qualified special education teachers employed to provide special education and related services for students ages 6 through 21 by all states by the total number of students ages 6 through 21 served under IDEA, Part B, by all states, then multiplying the result by 100. SOURCE: U.S. Department of Education, Office of Special Education Programs, Data Analysis System (DANS), OMB #1820-0518: “Personnel (in Full-Time Equivalency of Assignment) Employed to Provide Special Education and Related Services for Children with Disabilities,” 2010. Data were accessed summer 2012. Data Analysis System (DANS), OMB #1820-0043: “Report of Children with Disabilities Receiving Special Education Under Part B of the Individuals with Disabilities Education Act, as Amended,” 2010. Data were accessed spring 2012. For actual data used, go to http://www.ed.gov/about/reports/annual/osep.
159

Children and Students Ages 3 Through 21 Served Under IDEA, Part B
Part B Discipline
How did the states compare with regard to the number of children and students ages 3 through 21 served under IDEA, Part B, who were removed unilaterally to an interim alternative educational setting by school personnel for drug, weapons, or serious bodily injury offenses during school year 2010–11?
Exhibit 71. Number of children and students ages 3 through 21 served under IDEA, Part B, removed unilaterally to an interim alternative educational setting by school personnel for drug, weapons, or serious bodily injury offenses per 10,000 children and students ages 3 through 21 served under IDEA, Part B, by state: School year 2010–11
State
Number removed to an interim alternative educational settinga by school personnel per 10,000
children and students servedb All states 14
Alabama 12 Alaska 0 Arizona 4 Arkansas 5 BIE schools — California 3 Colorado 8 Connecticut 3 Delaware 13 District of Columbia 19 Florida 3 Georgia 8 Hawaii x Idaho 38 Illinois 1 Indiana 34 Iowa x Kansas 65 Kentucky 1 Louisiana 21 Maine 2 Maryland 3 Massachusetts 1 Michigan # Minnesota 1 Mississippi 10 Missouri 15 Montana 50 Nebraska 9 Nevada 7 See notes at end of exhibit.
160

Exhibit 71. Number of children and students ages 3 through 21 served under IDEA, Part B, removed unilaterally to an interim alternative educational setting by school personnel for drug, weapons, or serious bodily injury offenses per 10,000 children and students ages 3 through 21 served under IDEA, Part B, by state: School year 2010–11― Continued
State
Number removed to an interim alternative educational settinga by school personnel per 10,000
children and students servedb New Hampshire x New Jersey 1 New Mexico 6 New York 18 North Carolina 9 North Dakota 6 Ohio 2 Oklahoma 8 Oregon 3 Pennsylvania 23 Puerto Rico 14 Rhode Island 2 South Carolina 12 South Dakota 14 Tennessee 48 Texas 58 Utah 1 Vermont 4 Virginia 6 Washington 68 West Virginia 0 Wisconsin 2 Wyoming — x Ratio cannot be calculated because data were suppressed to limit disclosure. — Ratio cannot be calculated because data were not available. # Ratio was non-zero, but smaller than 5 per 100,000 children and students. aAn appropriate setting determined by the child’s/student’s individualized education program (IEP) team in which the child/student is placed for no more than 45 school days. This setting enables the child/student to continue to progress in the general curriculum; to continue to receive the services and modifications, including those described in the child’s/student’s current IEP; and to meet the goals set out in the IEP. Setting includes services and modifications to address the problem behavior and to prevent the behavior from recurring. bInstances in which school personnel (not the IEP team) order the removal of children and students with disabilities from their current educational placement to an appropriate interim alternative educational setting (IAES) for not more than 45 school days. NOTE: Ratio for each state was calculated by dividing the number of children and students ages 3 through 21 served under IDEA, Part B, by the state who were removed to an IAES by school personnel for drug, weapons, or serious bodily injury offenses by the total number of children and students ages 3 through 21 served under IDEA, Part B, by the state, then multiplying the result by 10,000. Ratio for “All states” was calculated for all states with available data by dividing the number of children and students ages 3 through 21 served under IDEA, Part B, by all states who were removed to an IAES by school personnel for drug, weapons, or serious bodily injury offenses by the total number of children and students ages 3 through 21 served under IDEA, Part B, by all states, then multiplying the result by 10,000. Ratio for “All states” includes suppressed data. The numerator is based on data from the entire 2010–11 school year, whereas the denominator is based on point-in-time data from fall 2010.
161

• For every 10,000 children and students ages 3 through 21 served under IDEA, Part B, in 2010 by the 51 states (“All states”) for which data were available, 14 children and students were removed unilaterally to an interim alternative educational setting by school personnel for offenses involving drugs, weapons, or serious bodily injury to others in school year 2010–11.
• The numbers of children and students ages 3 through 21 served under IDEA, Part B, who were removed unilaterally to an interim alternative educational setting by school personnel for drug, weapons, or serious bodily injury offenses during school year 2010–11 per 10,000 children and students ages 3 through 21 served under IDEA, Part B, in 2010 in the 48 states for which non-suppressed data were available, ranged from zero to 68. In Alaska and West Virginia, no children and students were removed to an interim alternative educational setting by school personnel for these offenses, and in Michigan fewer than 5 children and students were removed for every 10,000 children and students who were served. In contrast, more than 50 children and students were removed to an interim alternative educational setting by school personnel for such offenses for every 10,000 children and students who were served in the following three states: Washington (68 per 10,000 children and students), Kansas (65 per 10,000 children and students), and Texas (58 per 10,000 children and students).
SOURCE: U.S. Department of Education, Office of Special Education Programs, Data Analysis System (DANS), OMB #1820-0621: “Report of Children with Disabilities Subject to Disciplinary Removal,” 2010–11. Data were accessed summer 2012. Data Analysis System (DANS), OMB #1820-0043: “Report of Children with Disabilities Receiving Special Education Under Part B of the Individuals with Disabilities Education Act, as Amended,” 2010. Data were accessed spring 2012. For actual data used, go to http://www.ed.gov/about/reports/annual/osep.
162

How did the states compare with regard to the number of children and students ages 3 through 21 served under IDEA, Part B, who were suspended out of school or expelled for more than 10 days during school year 2010–11?
Exhibit 72. Number of children and students ages 3 through 21 served under IDEA, Part B, suspended out of school or expelled for more than 10 days during the school year, per 10,000 children and students ages 3 through 21 served under IDEA, Part B, by state: School year 2010–11
State
Number suspended out-of-school or expelled for more
than 10 days per 10,000 children and students serveda
All states 96 Alabama 70 Alaska 121 Arizona 83 Arkansas 67 BIE schools — California 61 Colorado 91 Connecticut 122 Delaware 189 District of Columbia 156 Florida 150 Georgia 60 Hawaii 184 Idaho 10 Illinois 60 Indiana 130 Iowa 39 Kansas 50 Kentucky 21 Louisiana 63 Maine 8 Maryland 115 Massachusetts 88 Michigan 165 Minnesota 77 Mississippi 150 Missouri 218 Montana 33 Nebraska 148 Nevada 196 New Hampshire 103 New Jersey 31 New Mexico 38 New York 103 North Carolina 232 See notes at end of exhibit.
163
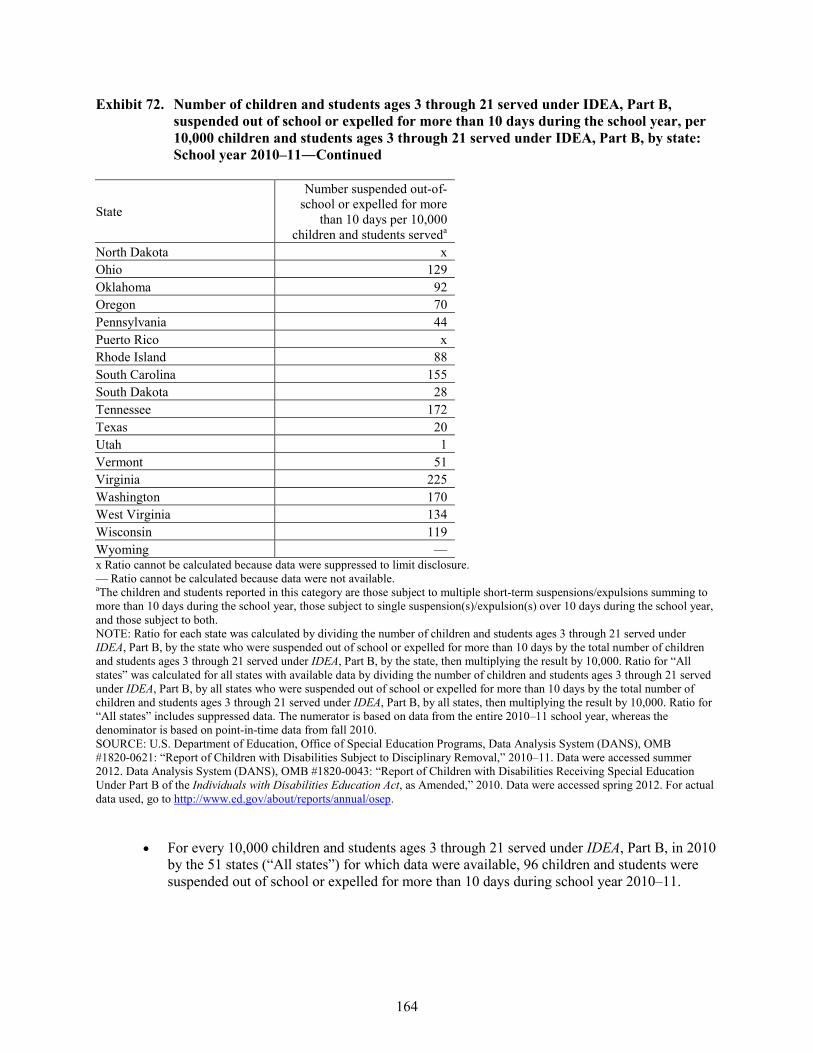
Exhibit 72. Number of children and students ages 3 through 21 served under IDEA, Part B, suspended out of school or expelled for more than 10 days during the school year, per 10,000 children and students ages 3 through 21 served under IDEA, Part B, by state: School year 2010–11―Continued
State
Number suspended out-of-school or expelled for more
than 10 days per 10,000 children and students serveda
North Dakota x Ohio 129 Oklahoma 92 Oregon 70 Pennsylvania 44 Puerto Rico x Rhode Island 88 South Carolina 155 South Dakota 28 Tennessee 172 Texas 20 Utah 1 Vermont 51 Virginia 225 Washington 170 West Virginia 134 Wisconsin 119 Wyoming — x Ratio cannot be calculated because data were suppressed to limit disclosure. — Ratio cannot be calculated because data were not available. aThe children and students reported in this category are those subject to multiple short-term suspensions/expulsions summing to more than 10 days during the school year, those subject to single suspension(s)/expulsion(s) over 10 days during the school year, and those subject to both. NOTE: Ratio for each state was calculated by dividing the number of children and students ages 3 through 21 served under IDEA, Part B, by the state who were suspended out of school or expelled for more than 10 days by the total number of children and students ages 3 through 21 served under IDEA, Part B, by the state, then multiplying the result by 10,000. Ratio for “All states” was calculated for all states with available data by dividing the number of children and students ages 3 through 21 served under IDEA, Part B, by all states who were suspended out of school or expelled for more than 10 days by the total number of children and students ages 3 through 21 served under IDEA, Part B, by all states, then multiplying the result by 10,000. Ratio for “All states” includes suppressed data. The numerator is based on data from the entire 2010–11 school year, whereas the denominator is based on point-in-time data from fall 2010. SOURCE: U.S. Department of Education, Office of Special Education Programs, Data Analysis System (DANS), OMB #1820-0621: “Report of Children with Disabilities Subject to Disciplinary Removal,” 2010–11. Data were accessed summer 2012. Data Analysis System (DANS), OMB #1820-0043: “Report of Children with Disabilities Receiving Special Education Under Part B of the Individuals with Disabilities Education Act, as Amended,” 2010. Data were accessed spring 2012. For actual data used, go to http://www.ed.gov/about/reports/annual/osep.
• For every 10,000 children and students ages 3 through 21 served under IDEA, Part B, in 2010 by the 51 states (“All states”) for which data were available, 96 children and students were suspended out of school or expelled for more than 10 days during school year 2010–11.
164

• The numbers of children and students ages 3 through 21 served under IDEA, Part B, who were suspended out of school or expelled for more than 10 days during school year 2010–11 per 10,000 children and students ages 3 through 21 served under IDEA, Part B, in 2010 in the 49 individual states for which non-suppressed data were available, ranged from 1 to 232. In the following three states, fewer than 11 children and students were suspended or expelled out of school for more than 10 days for every 10,000 children and students served: Idaho (10 per 10,000 children and students), Maine (8 per 10,000 children and students), and Utah (1 per 10,000 children and students). In contrast, more than 200 children and students were suspended out of school or expelled for more than 10 days during school year 2010–11 for every 10,000 children and students served in 2010 in the following three states: North Carolina (232 per 10,000 children and students), Virginia (225 per 10,000 children and students), and Missouri (218 per 10,000 children and students).
165

How did the states compare with regard to the number of children and students ages 3 through 21 served under IDEA, Part B, reported under the category of emotional disturbance, who were suspended out of school or expelled for more than 10 days during school year 2010–11?
Exhibit 73. Number of children and students ages 3 through 21 served under IDEA, Part B, reported under the category of emotional disturbance and suspended out of school or expelled for more than 10 days during the school year, per 10,000 children and students ages 3 through 21 served under IDEA, Part B, reported under the category of emotional disturbance, by state: School year 2010–11
State
Number suspended out-of-school or expelled for more than 10 days per 10,000 children and
students serveda All states 394
Alabama x Alaska 498 Arizona 278 Arkansas x BIE schools — California 283 Colorado 419 Connecticut 524 Delaware x District of Columbia 300 Florida 685 Georgia 196 Hawaii 871 Idaho x Illinois 242 Indiana 543 Iowa 39 Kansas 201 Kentucky 141 Louisiana x Maine x Maryland x Massachusetts 273 Michigan 623 Minnesota 367 Mississippi 713 Missouri 972 Montana x Nebraska 905 Nevada x New Hampshire 379 New Jersey 142 New Mexico x New York 445 See notes at end of exhibit.
166

Exhibit 73. Number of children and students ages 3 through 21 served under IDEA, Part B, reported under the category of emotional disturbance and suspended out of school or expelled for more than 10 days during the school year, per 10,000 children and students ages 3 through 21 served under IDEA, Part B, reported under the category of emotional disturbance, by state: School year 2010–11―Continued
State
Number suspended out-of-school or expelled for more than 10 days per 10,000 children and
students serveda North Carolina x North Dakota 0 Ohio 559 Oklahoma 311 Oregon 289 Pennsylvania 160 Puerto Rico 0 Rhode Island 248 South Carolina x South Dakota x Tennessee x Texas 62 Utah x Vermont 187 Virginia 842 Washington 833 West Virginia 800 Wisconsin 373 Wyoming — x Ratio cannot be calculated because data were suppressed to limit disclosure. — Ratio cannot be calculated because data were not available. aThe children and students reported in this category are those subject to multiple short-term suspensions/expulsions summing to more than 10 days during the school year, those subject to single suspension(s)/expulsion(s) over 10 days during the school year, and those subject to both. NOTE: Ratio for each state was calculated by dividing the number of children and students ages 3 through 21 served under IDEA, Part B, by the state under the category of emotional disturbance who were suspended out of school or expelled for more than 10 days by the total number of children and students ages 3 through 21 served under IDEA, Part B, by the state under the category of emotional disturbance, then multiplying the result by 10,000. Ratio for “All states” was calculated for all states with available data by dividing the number of children and students ages 3 through 21 served under IDEA, Part B, by all states under the category of emotional disturbance who were suspended out of school or expelled for more than 10 days by the total number of children and students ages 3 through 21 served under IDEA, Part B, by all states under the category of emotional disturbance, then multiplying the result by 10,000. Ratio for “All states” includes suppressed data. The numerator is based on data from the entire 2010–11 school year, whereas the denominator is based on point-in-time data from fall 2010. SOURCE: U.S. Department of Education, Office of Special Education Programs, Data Analysis System (DANS), OMB #1820-0621: “Report of Children with Disabilities Subject to Disciplinary Removal,” 2010–11. Data were accessed summer 2012. Data Analysis System (DANS), OMB #1820-0043: “Report of Children with Disabilities Receiving Special Education Under Part B of the Individuals with Disabilities Education Act, as Amended,” 2010. Data were accessed spring 2012. For actual data used, go to http://www.ed.gov/about/reports/annual/osep.
• For every 10,000 children and students ages 3 through 21 served under IDEA, Part B, reported under the category of emotional disturbance in 2010 by the 51 states (“All states”) for which data were available, 394 children and students were suspended out of school or expelled for more than 10 days during school year 2010–11.
167

• The numbers of children and students ages 3 through 21 served under IDEA, Part B, reported under the category of emotional disturbance who were suspended out of school or expelled for more than 10 days during school year 2010–11 per 10,000 children and students ages 3 through 21 served under IDEA, Part B, reported under the category of emotional disturbance in 2010, in the 36 individual states for which non-suppressed data were available, ranged from zero to 972. In North Dakota and Puerto Rico, no children or students reported under the category of emotional disturbance were suspended or expelled for more than 10 days during school year 2010–11. Fewer than 63 out every 10,000 such children and students served in 2010 were suspended or expelled for more than 10 days during school year 2010–11 in Texas (62 per 10,000 children and students) and Iowa (39 per 10,000 children and students). In contrast, 800 or more such children and students were suspended out of school or expelled for more than 10 days during school year 2010–11 for every 10,000 such children and students served in 2010 in the following six states: Missouri (972 per 10,000 children and students), Nebraska (905 per 10,000 children and students), Hawaii (871 per 10,000 children and students), Virginia (842 per 10,000 children and students), Washington (833 per 10,000 children and students), and West Virginia (800 per 10,000 children and students).
168

Part B Dispute Resolution
Unlike the other Part B data collections, which are associated with a specific group of Part B participants defined by the participants’ ages, the Part B dispute resolution data collection is associated with all children and students served under IDEA, Part B. These children and students include individuals ages 3 through 21, as well as older individuals, as states have the option of serving students 22 years of age and older. The Part B legal disputes and resolution data represent all complaints associated with any participant in Part B during the 12 months during which the data were collected. Nevertheless, since children and students ages 3 through 21 served under IDEA, Part B, account for nearly all of the participants in Part B in all states, the count for children and students ages 3 through 21 served as of the state-designated date for the year was deemed a meaningful basis for creating a ratio by which to compare the volume of Part B disputes that occurred in the individual states during the year. For an overview of the Part B dispute resolution process, see the Section I discussion of these same data at the national level.
How did the states compare with regard to the following ratios in 2010–11:
1. the number of written, signed complaints for children and students served under IDEA, Part B, per 10,000 children and students ages 3 through 21 served;
2. the number of due process complaints for children and students served under IDEA, Part B, per 10,000 children and students ages 3 through 21 served; and
3. the number of mediation requests for children and students served under IDEA, Part B, per 10,000 children and students ages 3 through 21 served?
Exhibit 74. Numbers of written, signed complaints; due process complaints; and mediation requests for children and students served under IDEA, Part B, per 10,000 children and students ages 3 through 21 served, by state: 2010–11
State Written, signed
complaintsa Due process complaintsb
Mediation requestsc
Per 10,000 children and students served All states 8 26 13
Alabama 3 15 7 Alaska 4 3 6 Arizona 8 4 5 Arkansas 8 5 2 BIE schools 4 6 6 California 15 41 44 Colorado 2 2 6 Connecticut 28 33 43 Delaware 3 4 6 District of Columbia 19 1,278 21 Florida 3 5 2 See notes at end of exhibit.
169
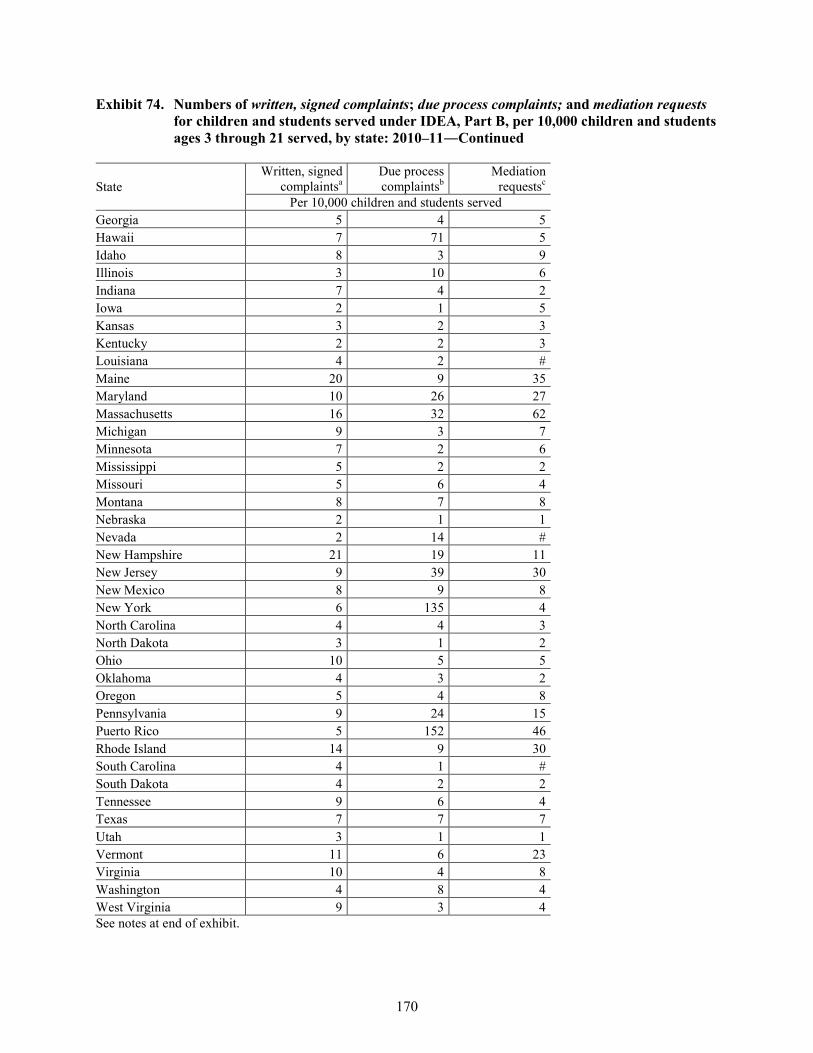
Exhibit 74. Numbers of written, signed complaints; due process complaints; and mediation requests for children and students served under IDEA, Part B, per 10,000 children and students ages 3 through 21 served, by state: 2010–11―Continued
State Written, signed
complaintsa Due process complaintsb
Mediation requestsc
Per 10,000 children and students served Georgia 5 4 5 Hawaii 7 71 5 Idaho 8 3 9 Illinois 3 10 6 Indiana 7 4 2 Iowa 2 1 5 Kansas 3 2 3 Kentucky 2 2 3 Louisiana 4 2 # Maine 20 9 35 Maryland 10 26 27 Massachusetts 16 32 62 Michigan 9 3 7 Minnesota 7 2 6 Mississippi 5 2 2 Missouri 5 6 4 Montana 8 7 8 Nebraska 2 1 1 Nevada 2 14 # New Hampshire 21 19 11 New Jersey 9 39 30 New Mexico 8 9 8 New York 6 135 4 North Carolina 4 4 3 North Dakota 3 1 2 Ohio 10 5 5 Oklahoma 4 3 2 Oregon 5 4 8 Pennsylvania 9 24 15 Puerto Rico 5 152 46 Rhode Island 14 9 30 South Carolina 4 1 # South Dakota 4 2 2 Tennessee 9 6 4 Texas 7 7 7 Utah 3 1 1 Vermont 11 6 23 Virginia 10 4 8 Washington 4 8 4 West Virginia 9 3 4 See notes at end of exhibit.
170

Exhibit 74. Numbers of written, signed complaints; due process complaints; and mediation requests for children and students served under IDEA, Part B, per 10,000 children and students ages 3 through 21 served, by state: 2010–11―Continued
State Written, signed
complaintsa Due process complaintsb
Mediation requestsc
Per 10,000 children and students served Wisconsin 4 2 6 Wyoming — — — — Ratio cannot be calculated because data were not available. # Ratio was non-zero, but smaller than 5 per 100,000 children and students. aA written, signed complaint is a signed document with specific content requirements that is submitted to a state education agency by an individual or organization that alleges a violation of a requirement of Part B of IDEA. The total number of written, signed complaints in 2010–11 was 4,997. bA due process complaint is a filing by any party to initiate a due process hearing on matters related to the identification, evaluation, or educational placement of a child with a disability, or to the provision of free appropriate public education to such child. The total number of hearing requests in 2010–11 was 17,362. cA mediation request is a request by a party to a dispute involving any matter under Part B of IDEA to meet with a qualified and impartial mediator to resolve the dispute. The total number of mediation requests in 2010–11 was 8,684. NOTE: Ratio for each state was calculated by dividing the number of written, signed complaints; due process complaints; or mediation requests reported by the state by the total number of children and students ages 3 through 21 served under IDEA, Part B, by the state, then multiplying the result by 10,000. Ratio for “All states” was calculated for all states with available data by dividing number of written, signed complaints; due process complaints; or mediation requests reported by all states by the total number of children and students ages 3 through 21 served under IDEA, Part B, by all states, then multiplying the result by 10,000. The numerator is based on data from the reporting period between July 1, 2010, and June 30, 2011, whereas the denominator is based on point-in-time data from fall 2010. SOURCE: U.S. Department of Education, Office of Special Education Programs, Data Analysis System (DANS), OMB #1820-0677: “Report of Dispute Resolution Under Part B of the Individuals with Disabilities Education Act,” 2010–11. Data were accessed summer 2012. Data Analysis System (DANS), OMB #1820-0043: “Report of Children with Disabilities Receiving Special Education Under Part B of the Individuals with Disabilities Education Act, as Amended,” 2010. Data were accessed spring 2012. For actual data used, go to http://www.ed.gov/about/reports/annual/osep.
• In 2010–11, there were 8 written, signed complaints per 10,000 children and students ages 3 through 21 served under IDEA, Part B, in the 52 states (“All states”) for which data were available. The ratios in the 52 individual states ranged from 2 per 10,000 children and students in Colorado, Iowa, Kentucky, Nebraska, and Nevada to more than 20 per 10,000 children and students in Connecticut (28 per 10,000 children and students) and New Hampshire (21 per 10,000 children and students).
• In 2010–11, there were 26 due process complaints per 10,000 children and students ages 3 through 21 served under IDEA, Part B, in the 52 states (“All states”) for which data were available. The ratio was larger than 50 due process complaints per 10,000 children and students in only the following four of the 52 states: the District of Columbia (1,278 per 10,000 children and students), Puerto Rico (152 per 10,000 children and students), New York (135 per 10,000 children and students), and Hawaii (71 per 10,000 children and students). In contrast, the ratio was no larger than 1 per 10,000 children and students in Iowa, Nebraska, North Dakota, South Carolina, and Utah.
171

• In 2010–11, there were 13 mediation requests per 10,000 children and students ages 3 through 21 served under IDEA, Part B, in the 52 states (“All states”) for which data were available. A ratio larger than 40 mediation requests per 10,000 children and students was found only for Massachusetts (62 per 10,000 children and students), Puerto Rico (46 per 10,000 children and students), California (44 per 10,000 children and students), and Connecticut (43 per 10,000 children and students). In contrast, the ratio was no larger than 5 per 100,000 children and students in Louisiana, Nevada, and South Carolina.
172

How did the states compare with regard to the following ratios in 2010–11:
1. the number of written, signed complaints with reports issued for children and students served under IDEA, Part B, per 10,000 children and students ages 3 through 21 served;
2. the number of written, signed complaints withdrawn or dismissed for children and students served under IDEA, Part B, per 10,000 children and students ages 3 through 21 served;
3. the number of fully adjudicated due process complaints for children and students served under IDEA, Part B, per 10,000 children and students ages 3 through 21 served; and
4. the number of due process complaints resolved without a hearing for children and students served under IDEA, Part B, per 10,000 children and students ages 3 through 21 served?
Exhibit 75. Number of complaints for children and students served under IDEA, Part B, per 10,000 children and students ages 3 through 21 served, by complaint status and state: 2010–11
State Complaints with reports issueda
Complaints withdrawn or
dismissedb
Fully adjudicated due process complaintsc
Due process complaints resolved
without hearingd Per 10,000 children and students served
All states 5 3 3 19 Alabama 3 1 # 10 Alaska 3 1 2 1 Arizona 6 2 # 3 Arkansas 4 4 1 4 BIE schools 4 0 0 6 California 11 4 2 30 Colorado 1 # # 2 Connecticut 15 12 2 23 Delaware 2 1 0 4 District of Columbia 12 8 229 990 Florida 2 1 # 4 Georgia 3 2 # 3 Hawaii 7 0 14 34 Idaho 5 3 1 1 Illinois 3 1 # 7 Indiana 4 3 1 3 Iowa 2 # 0 1 Kansas 2 1 # 1 Kentucky 1 1 0 1 Louisiana 2 2 # 2 Maine 7 12 1 8 Maryland 8 2 2 21 Massachusetts 12 4 1 21 Michigan 6 3 # 2 Minnesota 4 2 # 1 Mississippi 3 2 # 2 See notes at end of exhibit.
173
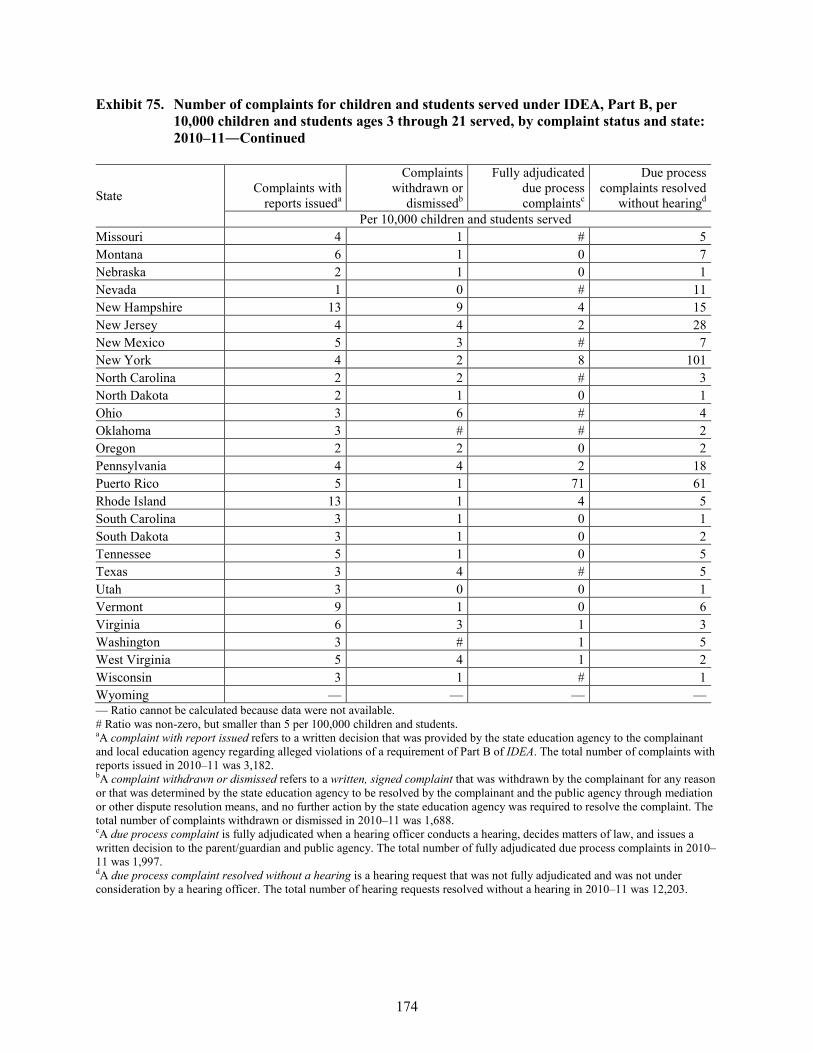
Exhibit 75. Number of complaints for children and students served under IDEA, Part B, per 10,000 children and students ages 3 through 21 served, by complaint status and state: 2010–11―Continued
State Complaints with reports issueda
Complaints withdrawn or
dismissedb
Fully adjudicated due process complaintsc
Due process complaints resolved
without hearingd Per 10,000 children and students served
Missouri 4 1 # 5 Montana 6 1 0 7 Nebraska 2 1 0 1 Nevada 1 0 # 11 New Hampshire 13 9 4 15 New Jersey 4 4 2 28 New Mexico 5 3 # 7 New York 4 2 8 101 North Carolina 2 2 # 3 North Dakota 2 1 0 1 Ohio 3 6 # 4 Oklahoma 3 # # 2 Oregon 2 2 0 2 Pennsylvania 4 4 2 18 Puerto Rico 5 1 71 61 Rhode Island 13 1 4 5 South Carolina 3 1 0 1 South Dakota 3 1 0 2 Tennessee 5 1 0 5 Texas 3 4 # 5 Utah 3 0 0 1 Vermont 9 1 0 6 Virginia 6 3 1 3 Washington 3 # 1 5 West Virginia 5 4 1 2 Wisconsin 3 1 # 1 Wyoming — — — — — Ratio cannot be calculated because data were not available. # Ratio was non-zero, but smaller than 5 per 100,000 children and students. aA complaint with report issued refers to a written decision that was provided by the state education agency to the complainant and local education agency regarding alleged violations of a requirement of Part B of IDEA. The total number of complaints with reports issued in 2010–11 was 3,182. bA complaint withdrawn or dismissed refers to a written, signed complaint that was withdrawn by the complainant for any reason or that was determined by the state education agency to be resolved by the complainant and the public agency through mediation or other dispute resolution means, and no further action by the state education agency was required to resolve the complaint. The total number of complaints withdrawn or dismissed in 2010–11 was 1,688. cA due process complaint is fully adjudicated when a hearing officer conducts a hearing, decides matters of law, and issues a written decision to the parent/guardian and public agency. The total number of fully adjudicated due process complaints in 2010–11 was 1,997. dA due process complaint resolved without a hearing is a hearing request that was not fully adjudicated and was not under consideration by a hearing officer. The total number of hearing requests resolved without a hearing in 2010–11 was 12,203.
174

• In 2010–11, there were 5 written, signed complaints with reports issued per 10,000 children and students ages 3 through 21 served under IDEA, Part B, in the 52 states (“All states”) for which data were available. The ratio was larger than 10 per 10,000 children and students in only the following six states: Connecticut (15 per 10,000 children and students), Rhode Island (13 per 10,000 children and students), New Hampshire (13 per 10,000 children and students), the District of Columbia (12 per 10,000 children and students), Massachusetts (12 per 10,000 children and students), and California (11 per 10,000 children and students). In contrast, the ratio was only 1 per 10,000 children and students in Colorado, Kentucky, and Nevada.
• In 2010–11, there were 3 written, signed complaints withdrawn or dismissed per 10,000 children and students ages 3 through 21 served under IDEA, Part B, in the 52 states (“All states”) for which data were available. The ratio was zero in BIE schools, Hawaii, Nevada, and Utah and larger than 5 per 10,000 in only the following five states: Maine (12 per 10,000 children and students), Connecticut (12 per 10,000 children and students), New Hampshire (9 per 10,000 children and students), the District of Columbia (8 per 10,000 children and students), and Ohio (6 per 10,000 children and students).
• In 2010–11, there were 3 fully adjudicated due process complaints per 10,000 children and students ages 3 through 21 served under IDEA, Part B, in the 52 states (“All states”) for which data were available. The ratio was zero in 13 states and larger than 5 per 10,000 in only the following three states: the District of Columbia (229 per 10,000 children and students), Puerto Rico (71 per 10,000 children and students), and Hawaii (14 per 10,000 children and students).
• In 2010–11, there were 19 due process complaints resolved without a hearing per 10,000 children and students ages 3 through 21 served under IDEA, Part B, in the 52 states (“All states”) for which data were available. The ratio was no more than 1 per 10,000 in 11 states. In contrast, the ratio was larger than 30 per 10,000 in the following four states: the District of Columbia (990 per 10,000 children and students), New York (101 per 10,000 children and students), Puerto Rico (61 per 10,000 children and students), and Hawaii (34 per 10,000 children and students).
NOTE: A written, signed complaint is a signed document with specific content requirements that is submitted to a state education agency by an individual or organization that alleges a violation of a requirement of Part B of IDEA. A hearing request is a filing by any party to initiate a due process hearing on matters related to the identification, evaluation, or educational placement of a child with a disability or to the provision of free appropriate public education to such child. Ratio for each state was calculated by dividing the number of complaints with reports issued, complaints withdrawn or dismissed, fully adjudicated due process complaints, or due process complaints resolved without a hearing reported by the state by the total number of children and students ages 3 through 21 served under IDEA, Part B, by the state, then multiplying the result by 10,000. Ratio for “All states” was calculated for all states with available data by dividing the number of complaints with reports issued, complaints withdrawn or dismissed, fully-adjudicated due process complaints, or due process complaints resolved without hearing reported by all states by the total number of children and students ages 3 through 21 served under IDEA, Part B, by all states, then multiplying the result by 10,000. The numerator is based on data from the reporting period between July 1, 2010, and June 30, 2011, whereas the denominator is based on point-in-time data from fall 2010. SOURCE: U.S. Department of Education, Office of Special Education Programs, Data Analysis System (DANS), OMB #1820-0677: “Report of Dispute Resolution Under Part B of the Individuals with Disabilities Education Act,” 2010–11. Data were accessed summer 2012. Data Analysis System (DANS), OMB #1820-0043: “Report of Children with Disabilities Receiving Special Education Under Part B of the Individuals with Disabilities Education Act, as Amended,” 2010. Data were accessed spring 2012. For actual data used, go to http://www.ed.gov/about/reports/annual/osep.
175


Section III
Findings and Determinations Resulting From Reviews of State Implementation of IDEA


Findings and Determinations Resulting From Reviews of State Implementation of IDEA
Section 616(a)(1)(A) of IDEA requires the secretary of the U.S. Department of Education (Department) to monitor the implementation of IDEA through oversight of general supervision by the states and through the State Performance Plans (SPP) described in section 616(b). To fulfill these requirements, the Office of Special Education Programs (OSEP), on behalf of the secretary, has implemented the Continuous Improvement and Focused Monitoring System (CIFMS), which focuses resources on critical compliance and performance areas in IDEA. Under IDEA sections 616(d) and 642, the Department performs an annual review of each state’s SPP and the associated Annual Performance Report (APR) (collectively, the SPP/APR) and other publicly available information to make an annual determination of the extent to which the state is meeting the requirements and purposes of Parts B and C of IDEA. The SPPs/APRs and the Department’s annual determinations are components of CIFMS.
The SPP and APR
Sections 616(b) and 642 of IDEA require each state to have in place an SPP for evaluating the state’s efforts to implement the requirements and purposes of IDEA and describing how the state will improve its implementation of IDEA. The SPP is made up of quantifiable indicators (20 under Part B and 14 under Part C), established by the secretary under sections 616(a)(3) and 642 of IDEA, which measure either compliance with specific statutory or regulatory provisions of IDEA (compliance indicators) or results and outcomes for children with disabilities and their families (results indicators). SPPs were submitted in December 2005 by each state education agency under Part B and by each state lead agency under Part C. Each SPP includes measurable and rigorous targets and improvement activities for each indicator.
Every February, pursuant to sections 616(b)(2)(C)(ii)(II) and 642 of IDEA, each state must submit an APR that documents its progress or slippage toward meeting the measurable and rigorous targets established for each indicator in the SPP for a specific federal fiscal year (FFY). In February 2012, each state submitted an APR to OSEP for the FFY 2010 reporting period (i.e., July 1, 2010, through June 30, 2011). This section examines and summarizes the states’ performance during FFY 2010 under both Parts B and C of the IDEA.
Please note that throughout this section, the term “states” is used to reference all of the jurisdictions that submitted FFY 2010 SPPs/APRs. The jurisdictions include the 50 states, the District of Columbia (DC), Puerto Rico (PR), and the outlying areas of American Samoa, Guam, the Northern
179
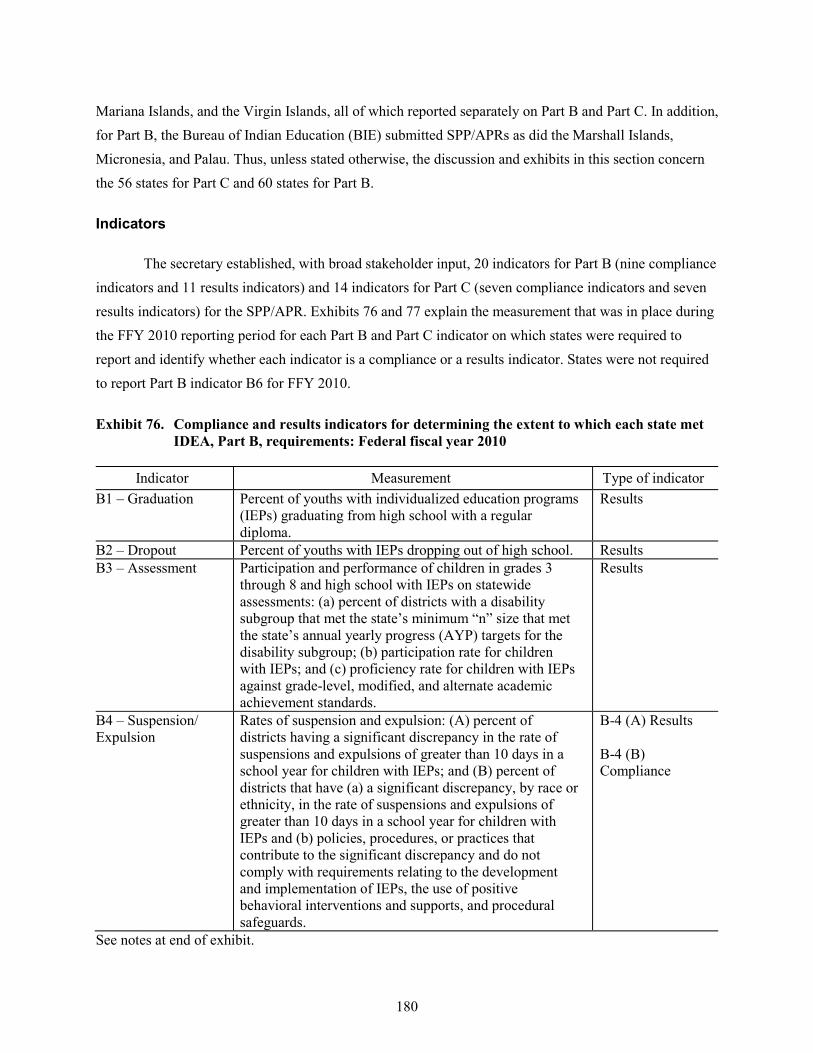
Mariana Islands, and the Virgin Islands, all of which reported separately on Part B and Part C. In addition, for Part B, the Bureau of Indian Education (BIE) submitted SPP/APRs as did the Marshall Islands, Micronesia, and Palau. Thus, unless stated otherwise, the discussion and exhibits in this section concern the 56 states for Part C and 60 states for Part B.
Indicators
The secretary established, with broad stakeholder input, 20 indicators for Part B (nine compliance indicators and 11 results indicators) and 14 indicators for Part C (seven compliance indicators and seven results indicators) for the SPP/APR. Exhibits 76 and 77 explain the measurement that was in place during the FFY 2010 reporting period for each Part B and Part C indicator on which states were required to report and identify whether each indicator is a compliance or a results indicator. States were not required to report Part B indicator B6 for FFY 2010.
Exhibit 76. Compliance and results indicators for determining the extent to which each state met IDEA, Part B, requirements: Federal fiscal year 2010
Indicator Measurement Type of indicator B1 – Graduation Percent of youths with individualized education programs
(IEPs) graduating from high school with a regular diploma.
Results
B2 – Dropout Percent of youths with IEPs dropping out of high school. Results B3 – Assessment Participation and performance of children in grades 3
through 8 and high school with IEPs on statewide assessments: (a) percent of districts with a disability subgroup that met the state’s minimum “n” size that met the state’s annual yearly progress (AYP) targets for the disability subgroup; (b) participation rate for children with IEPs; and (c) proficiency rate for children with IEPs against grade-level, modified, and alternate academic achievement standards.
Results
B4 – Suspension/ Expulsion
Rates of suspension and expulsion: (A) percent of districts having a significant discrepancy in the rate of suspensions and expulsions of greater than 10 days in a school year for children with IEPs; and (B) percent of districts that have (a) a significant discrepancy, by race or ethnicity, in the rate of suspensions and expulsions of greater than 10 days in a school year for children with IEPs and (b) policies, procedures, or practices that contribute to the significant discrepancy and do not comply with requirements relating to the development and implementation of IEPs, the use of positive behavioral interventions and supports, and procedural safeguards.
B-4 (A) Results B-4 (B) Compliance
See notes at end of exhibit.
180

Exhibit 76. Compliance and results indicators for determining the extent to which each state met IDEA, Part B, requirements: Federal fiscal year 2010—Continued
Indicator Measurement Type of indicator B5 – School Age Least Restrictive Environment (LRE)
Percent of children with IEPs aged 6 through 21 served (a) inside the regular class 80 percent or more of the day; (b) inside the regular class less than 40 percent of the day; and (c) in separate schools, residential facilities, or homebound/hospital placements.
Results
B7 – Preschool Outcomes
Percent of preschool children aged 3 through 5 with IEPs who demonstrated improved (a) positive social-emotional skills (including social relationships); (b) acquisition and use of knowledge and skills (including early language/communication and early literacy); and (c) use of appropriate behaviors to meet their needs.
Results
B8 – Parent Involvement
Percent of parents with a child receiving special education services who reported that schools facilitated parent involvement as a means of improving services and results for children with disabilities.
Results
B9 – Disproportionality (Child with a Disability)
Percent of districts with disproportionate representation of racial and ethnic groups in special education and related services that was the result of inappropriate identification.
Compliance
B10 – Disproportionality (Eligibility Category)
Percent of districts with disproportionate representation of racial and ethnic groups in specific disability categories that was the result of inappropriate identification.
Compliance
B11 – Child Find Percent of children who were evaluated within 60 days of receiving parental consent for initial evaluation or, if the state establishes a timeframe within which the evaluation must be conducted, within that timeframe.
Compliance
B12 – Early Childhood Transition
Percent of children referred by Part C prior to age 3 who were found eligible for Part B and who had an IEP developed and implemented by their third birthdays.
Compliance
B13 – Secondary Transition
Percent of youths with IEPs aged 16 and above with an IEP that included appropriate measurable postsecondary goals that were annually updated and based upon an age appropriate transition assessment; transition services, including courses of study, that would reasonably enable the student to meet those postsecondary goals; and annual IEP goals related to the student’s transition services needs. There also must have been evidence that the student was invited to the IEP Team meeting where transition services were to be discussed and evidence that, if appropriate, a representative of any participating agency was invited to the IEP Team meeting with the prior consent of the parent or student who had reached the age of majority.
Compliance
See notes at end of exhibit.
181

Exhibit 76. Compliance and results indicators for determining the extent to which each state met IDEA, Part B, requirements: Federal fiscal year 2010—Continued
Indicator Measurement Type of indicator B14 – Post-school Outcomes
Percent of youths who were no longer in secondary school, had IEPs in effect at the time they left school, and were (a) enrolled in higher education within one year of leaving high school; (b) enrolled in higher education or competitively employed within one year of leaving high school; or (c) enrolled in higher education or in some other postsecondary education or training program, or competitively employed or in some other employment within one year of leaving high school.
Results
B15 – General Supervision
General supervision system (including monitoring, complaints, hearings, etc.) that identified and corrected noncompliance as soon as possible but in no case later than one year from identification.
Compliance
B16 – Complaint Timelines
Percent of signed written complaints with reports issued that were resolved within a 60-day timeline or a timeline extended for exceptional circumstances with respect to a particular complaint, or because the parent (or individual or organization) and the public agency agreed to extend the time to engage in mediation or other alternative means of dispute resolution, if available in the state.
Compliance
B17 – Due Process Timelines
Percent of adjudicated due process hearing requests that were adjudicated within the 45-day timeline or a timeline that was properly extended by the hearing officer at the request of either party or in the case of an expedited hearing, within the required timelines.
Compliance
B18 – Resolution Sessions
Percent of hearing requests that went to resolution sessions that were resolved through resolution session settlement agreements.
Results
B19 – Mediations
Percent of mediations held that resulted in mediation agreements.
Results
B20 – State-Reported Data
State-reported data (618 and State Performance Plan and Annual Performance Report) were timely and accurate.
Compliance
NOTE: The FFY 2010 reporting period was from July 1, 2010, through June 30, 2011. SOURCE: U.S. Department of Education, Office of Special Education Programs, OMB #1820-0624: “Part B State Performance Plan (SPP) and Annual Performance Report (APR): Part B Indicator Measurement Table,” 2011–12. Available at: http://www2.ed.gov/policy/speced/guid/idea/bapr/2012/index.html (accessed Feb. 11, 2013).
182

Exhibit 77. Compliance and results indicators for determining the extent to which each state met IDEA, Part C, requirements: Federal fiscal year 2010
Indicator Measurement Type of indicator C1 – Early Intervention Services in a Timely Manner
Percent of infants and toddlers with individualized family service plans (IFSPs) who received the early intervention services on their IFSPs in a timely manner.
Compliance
C2 – Settings Percent of infants and toddlers with IFSPs who primarily received early intervention services in the home or community-based settings.
Results
C3 – Infant and Toddler Outcomes
Percent of infants and toddlers with IFSPs who demonstrated improved (a) positive social-emotional skills (including social relationships); (b) acquisition and use of knowledge and skills (including early language/communication); and (c) use of appropriate behaviors to meet their needs.
Results
C4 – Family Outcomes Percent of families participating in Part C who reported that early intervention services had helped the family (a) know their rights, (b) effectively communicate their children’s needs, and (c) help their children develop and learn.
Results
C5 – Child Find: Birth to One
Percent of infants and toddlers birth to age 1 with IFSPs compared to national data.
Results
C6 – Child Find: Birth to Three
Percent of infants and toddlers birth to age 3 with IFSPs compared to national data.
Results
C7 – 45-day Timeline Percent of eligible infants and toddlers with IFSPs for whom an evaluation and assessment and an initial IFSP meeting were conducted within Part C’s 45-day timeline.
Compliance
C8 – Early Childhood Transition
The percentage of toddlers with disabilities exiting Part C with timely transition planning for whom the lead education agency (LEA) had (a) developed an IFSP with transition steps and services at least 90 days, and at the discretion of all parties, not more than nine months, prior to the toddler’s third birthday; (b) notified (consistent with any opt-out policy adopted by the state) the state education agency (SEA) and the LEA where the toddler resided at least 90 days prior to the toddler’s third birthday for toddlers potentially eligible for Part B preschool services; and (c) conducted the transition conference held with the approval of the family at least 90 days, and at the discretion of all parties, not more than nine months, prior to the toddler’s third birthday for toddlers potentially eligible for Part B preschool services.
Compliance
C9 – General Supervision
General supervision system (including monitoring, complaints, hearings, etc.) that identified and corrected noncompliance as soon as possible but in no case later than one year from identification.
Compliance
See notes at end of exhibit.
183

Exhibit 77. Compliance and results indicators for determining the extent to which each state met IDEA, Part C, requirements: Federal fiscal year 2010—Continued
Indicator Measurement Type of indicator C10 – Complaint Timelines
Percent of signed written complaints with reports issued that were resolved within a 60-day timeline or a timeline extended for exceptional circumstances with respect to a particular complaint, or because the parent (or individual or organization) and the public agency agreed to extend the time to engage in mediation or other alternative means of dispute resolution, if available in the state.
Compliance
C11 – Due Process Timelines
Percent of fully adjudicated due process hearing requests that were fully adjudicated within the applicable timeline or a timeline that was properly extended by the hearing officer at the request of either party.
Compliance
C12 – Resolution Sessions
Percent of hearing requests that went to resolution sessions that were resolved through resolution session settlement agreements (applicable if Part B due process procedures were adopted).
Results
C13 – Mediations Percent of mediations held that resulted in mediation agreements.
Results
C14 – State-Reported Data
State-reported data (618 and State Performance Plan and Annual Performance Report) were timely and accurate.
Compliance
NOTE: The FFY 2010 reporting period was from July 1, 2010, through June 30, 2011. SOURCE: U.S. Department of Education, Office of Special Education Programs, OMB #1820-0578: “Part C State Performance Plan (SPP) and Annual Performance Report (APR): Part C Indicator Measurement Table,” 2010–11. Available at http://www2.ed.gov/policy/speced/guid/idea/capr/2012/index.html (accessed Feb. 11, 2013).
The Determination Process
Sections 616(d)(2)(A) and 642 of IDEA require the secretary to make an annual determination as to the extent to which each state is meeting the requirements of Parts B and C of IDEA. The secretary determines if a state:
• Meets the requirements and purposes of IDEA,
• Needs assistance in implementing the requirements of IDEA,
• Needs intervention in implementing the requirements of IDEA, or
• Needs substantial intervention in implementing the requirements of IDEA.
Exhibit 78 presents the key components in the determination process.
184

Exhibit 78. Process for determining the extent to which each state met IDEA, Part B and Part C, requirements: Federal fiscal year 2010
aIn December 2005, each state submitted an SPP that covered a period of six years. Section 616(b)(1)(C) requires each state to review its SPP at least once every six years and submit any amendments to the secretary. Each state is also required to post the most current SPP on its state website. Since December 2005, most states have revised their SPP at least once. NOTE: In June 2011, the secretary issued determinations based on data reported in the FFY 2009 APR and other available data. A discussion of those determinations is found in the 34th Annual Report to Congress, 2012. SOURCE: Information taken from U.S. Department of Education, Office of Special Education Programs, “OSEP Memo 12-4 to State Education Agency Directors of Special Education and State Data Managers dated November 28, 2011”. Available at http://www2.ed.gov/policy/speced/guid/idea/bapr/2012/index.html; “OSEP Memo 12-5 to Lead Agency Directors, Part C Coordinators and State Interagency Coordinating Council Chairpersons dated November 28, 2011.” Available at http://www2.ed.gov/policy/speced/guid/idea/capr/2012/index.html (accessed Feb. 11, 2013).
A state’s determination is based on the totality of the state’s data in its SPP/APR and other
publicly available information, including any compliance issues. The factors in a state’s FFY 2010 SPP (original or revised) and APR submissions that affected the Department’s 2012 determination (based in part on the FFY 2010 SPP/APRs) for each state under Parts B and C were: (1) whether the state provided valid and reliable FFY 2010 data that reflected the measurement for each compliance or results indicator and, if not, whether the state provided a plan to collect the missing or deficient data and (2) for each compliance indicator that was not new, whether the state (a) demonstrated compliance or timely corrected
185

noncompliance and (b) in instances where it did not demonstrate compliance, had nonetheless made progress in ensuring compliance over prior performance in that area. In making the determination, the Department also considered whether the state had other IDEA compliance issues that were identified previously through the Department’s monitoring, audit, or other activities, and the state’s progress in resolving those problems.
Enforcement
Sections 616(e) and 642 of IDEA require, under certain circumstances, that the secretary take enforcement action(s) based on a state’s determination under section 616(d)(2)(A). Specifically, the secretary must take action when the Department has determined that a state: (1) needs assistance for two or more consecutive years, (2) needs intervention for three or more consecutive years, or (3) at any time when the secretary determines that a state needs substantial intervention in implementing the requirements of IDEA or that there is a substantial failure to comply with any condition of a state’s eligibility under IDEA.
Determination Status
In June 2012, the secretary issued determination letters on the implementation of IDEA to each state education agency (SEA) for Part B and to each state lead agency for Part C. Exhibit 79 shows the results of the FFY 2010 determinations by state for Part B; Exhibit 80 shows the results for Part C.
186

Exhibit 79. States determined to have met IDEA, Part B, requirements, by determination status: Federal fiscal year 2010
Determination status
Meets requirements Needs assistance
Needs assistance: two or more consecutive years
Needs intervention
Needs intervention: two consecutive years
Needs intervention: three or more consecutive years
Alabama Alaska Arizona Arkansas Colorado Connecticut Delaware Florida Hawaii Kansas Kentucky Maryland Massachusetts Mississippi Missouri Nebraska Nevada New Mexico North Carolina North Dakota Northern Mariana
Islands Ohio Oregon Palau Pennsylvania Republic of the Marshall Islands Rhode Island South Carolina South Dakota Virginia Washington West Virginia Wyoming
Illinois Indiana Iowa Louisiana Minnesota Montana Virgin Islands Wisconsin
American Samoa Federated States
of Micronesia Guam Michigan New Hampshire New Jersey Tennessee Vermont
Bureau of Indian Education
California Georgia Idaho Maine New York Oklahoma Texas Utah
Puerto Rico District of Columbia
NOTE: The FFY 2010 reporting period was from July 1, 2010, through June 30, 2011. Based on the states’ 2012 data submissions, the secretary of education made the FFY 2010 determinations, which were released in June 2012. SOURCE: U.S. Department of Education, Office of Special Education Programs, “Part B State Performance Plan and Annual Performance Report State Determination Letters,” 2012. Available at http://www2.ed.gov/fund/data/report/idea/partbspap/allyears.html (accessed Feb. 11, 2013).
187

Exhibit 80. States determined to have met IDEA, Part C, requirements, by determination status: Federal fiscal year 2010
Determination status
Meets requirements Needs assistance
Needs assistance: two consecutive years
Needs intervention
Needs intervention: two consecutive years
Needs intervention: three or more consecutive years
Alabama Alaska Arkansas Colorado Connecticut Delaware Florida Georgia Hawaii Idaho Indiana Iowa Kentucky Louisiana Maryland Massachusetts Michigan Minnesota Missouri Montana Nebraska New Hampshire New Jersey New Mexico North Carolina Northern Mariana
Islands Oklahoma Oregon Pennsylvania Puerto Rico Rhode Island South Dakota Tennessee Utah Vermont Washington West Virginia Wyoming
American Samoa District of Columbia
Guam Illinois Maine Nevada New York Ohio Virgin Islands Wisconsin
Kansas North Dakota Texas Virginia
Arizona California Mississippi South Carolina
NOTE: The FFY 2010 reporting period was from July 1, 2010, through June 30, 2011. Based on the states’ 2012 data submissions, the secretary of education made the FFY 2010 determinations, which were released in June 2012. SOURCE: U.S. Department of Education, Office of Special Education Programs, “Part C State Performance Plan and Annual Performance Report State Determination Letters,” 2012. Available at http://www2.ed.gov/fund/data/report/idea/partcspap/allyears.html (accessed Feb. 11, 2013).
188
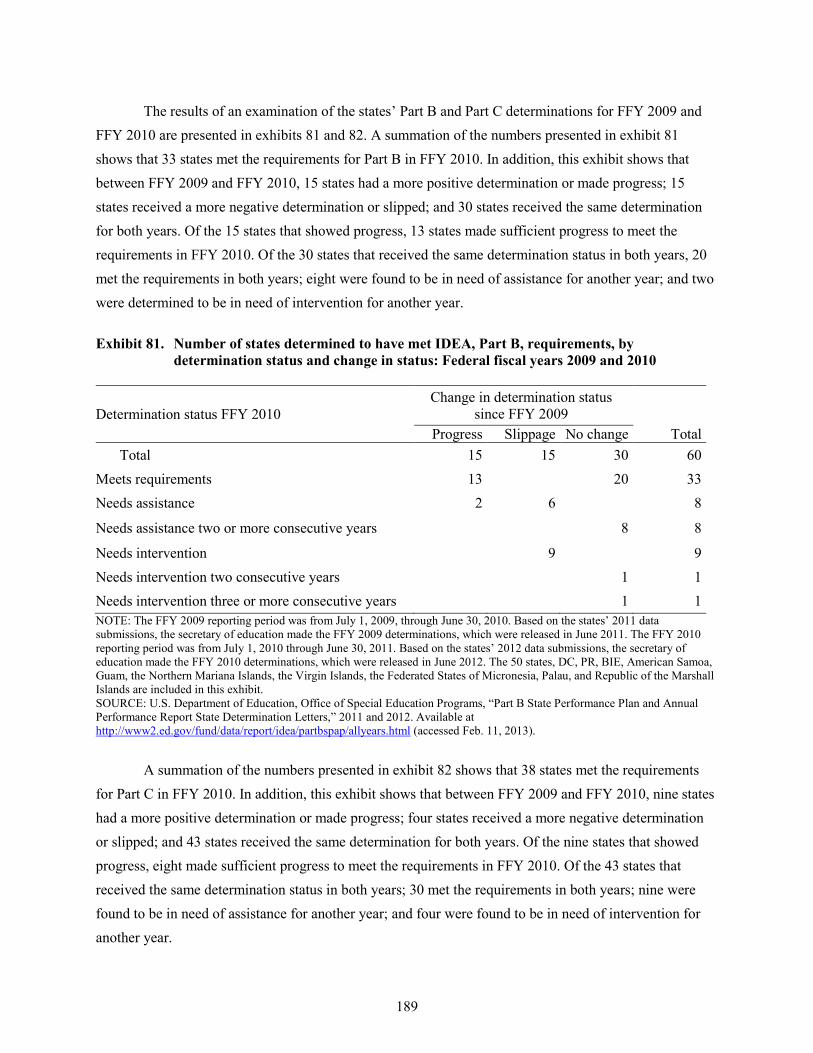
The results of an examination of the states’ Part B and Part C determinations for FFY 2009 and FFY 2010 are presented in exhibits 81 and 82. A summation of the numbers presented in exhibit 81 shows that 33 states met the requirements for Part B in FFY 2010. In addition, this exhibit shows that between FFY 2009 and FFY 2010, 15 states had a more positive determination or made progress; 15 states received a more negative determination or slipped; and 30 states received the same determination for both years. Of the 15 states that showed progress, 13 states made sufficient progress to meet the requirements in FFY 2010. Of the 30 states that received the same determination status in both years, 20 met the requirements in both years; eight were found to be in need of assistance for another year; and two were determined to be in need of intervention for another year.
Exhibit 81. Number of states determined to have met IDEA, Part B, requirements, by determination status and change in status: Federal fiscal years 2009 and 2010
Determination status FFY 2010 Change in determination status
since FFY 2009 Total Progress Slippage No change
Total 15 15 30 60 Meets requirements 13 20 33 Needs assistance 2 6 8
Needs assistance two or more consecutive years 8 8
Needs intervention 9 9 Needs intervention two consecutive years 1 1 Needs intervention three or more consecutive years 1 1 NOTE: The FFY 2009 reporting period was from July 1, 2009, through June 30, 2010. Based on the states’ 2011 data submissions, the secretary of education made the FFY 2009 determinations, which were released in June 2011. The FFY 2010 reporting period was from July 1, 2010 through June 30, 2011. Based on the states’ 2012 data submissions, the secretary of education made the FFY 2010 determinations, which were released in June 2012. The 50 states, DC, PR, BIE, American Samoa, Guam, the Northern Mariana Islands, the Virgin Islands, the Federated States of Micronesia, Palau, and Republic of the Marshall Islands are included in this exhibit. SOURCE: U.S. Department of Education, Office of Special Education Programs, “Part B State Performance Plan and Annual Performance Report State Determination Letters,” 2011 and 2012. Available at http://www2.ed.gov/fund/data/report/idea/partbspap/allyears.html (accessed Feb. 11, 2013).
A summation of the numbers presented in exhibit 82 shows that 38 states met the requirements for Part C in FFY 2010. In addition, this exhibit shows that between FFY 2009 and FFY 2010, nine states had a more positive determination or made progress; four states received a more negative determination or slipped; and 43 states received the same determination for both years. Of the nine states that showed progress, eight made sufficient progress to meet the requirements in FFY 2010. Of the 43 states that received the same determination status in both years; 30 met the requirements in both years; nine were found to be in need of assistance for another year; and four were found to be in need of intervention for another year.
189

Exhibit 82. Number of states determined to have met IDEA, Part C, requirements, by determination status and change in status: Federal fiscal years 2009 and 2010
Determination status FFY 2010 Change in determination status
since FFY 2009 Total Progress Slippage No change
Total 9 4 43 56 Meets requirements 8 30 38 Needs assistance 1 1 Needs assistance two or more consecutive years 9 9 Needs intervention 4 4 Needs intervention two consecutive years 4 4 Needs intervention three or more consecutive years 0 NOTE: The FFY 2009 reporting period was from July 1, 2009, through June 30, 2010. Based on the states’ 2011 data submissions, the secretary of education made the FFY 2009 determinations, which were released in June 2011. The FFY 2010 reporting period was from July 1, 2010 through June 30, 2011. Based on the states’ 2012 data submissions, the secretary of education made the FFY 2010 determinations, which were released in June 2012. The 50 states, DC, PR, American Samoa, Guam, the Northern Mariana Islands, and the Virgin Islands are included in this exhibit. SOURCE: U.S. Department of Education, Office of Special Education Programs, “Part C State Performance Plan and Annual Performance Report State Determination Letters,” 2011 and 2012. Available at http://www2.ed.gov/fund/data/report/idea/partcspap/allyears.html (accessed Feb. 11, 2013).
As a result of the determinations for Part B and Part C issued to states for FFY 2009 and
FFY 2010, the secretary took enforcement actions against those states that were determined to need assistance for two or more consecutive years and the one state determined to need intervention for three or more consecutive years. Subject to the provisions in section 616(e)(1)(A), the secretary advised each of these states of available sources of technical assistance (TA) that would help the state address the areas in which the state needed to improve. See http://therightidea.tadnet.org/technicalassistance for additional information about the type of TA activities that are available and have been used in the past.
Status of Selected Indicators
This section summarizes the results of a 2012 analysis of two Part B compliance indicators and two Part C compliance indicators included in the states’ FFY 2010 APRs. In the APRs, states reported actual performance data from FFY 2010 on the indicators. States also discussed how the FFY 2010 actual performance data compared to FFY 2009 actual performance data on the indicators. The four indicators focus on early childhood transition and general supervision and include Part B Indicators 12 (Early Childhood Transition) and 15 (General Supervision) and Part C Indicators 8 (Early Childhood Transition) and 9 (General Supervision). These indicators, along with other indicators not examined in this section, were used for the 2012 determinations. The two early childhood transition and the two general supervision indicators were chosen for examination in this section because their data and the results of
190
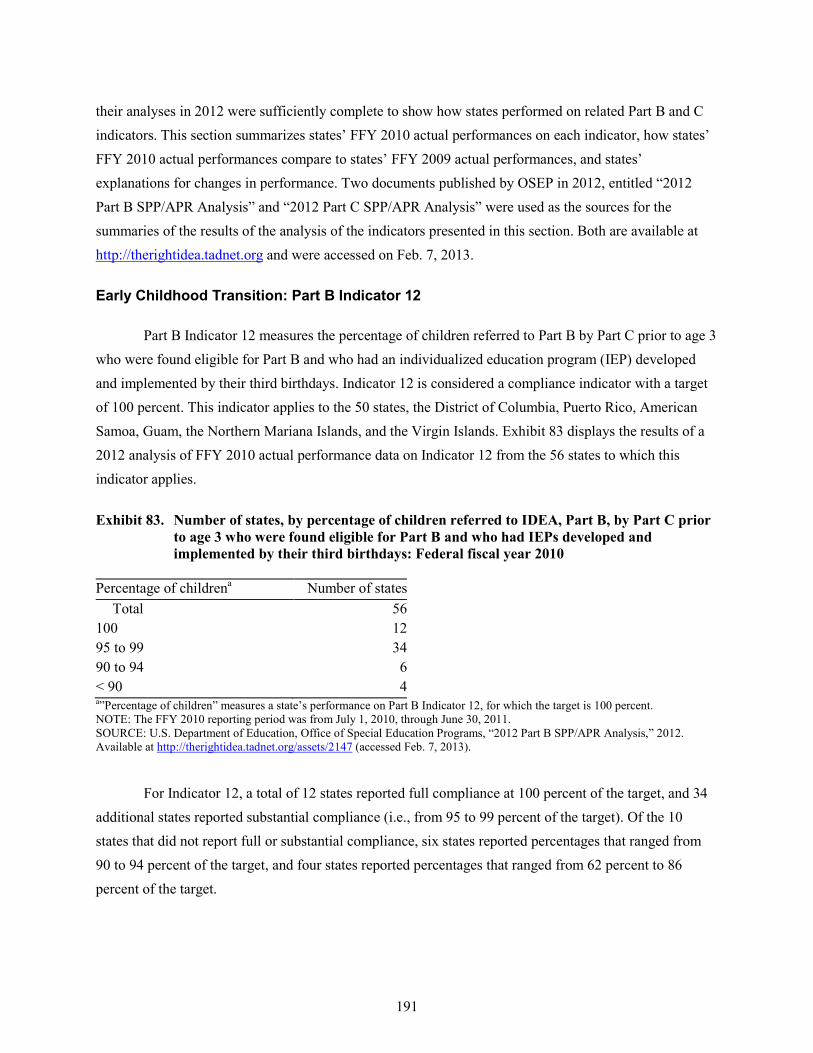
their analyses in 2012 were sufficiently complete to show how states performed on related Part B and C indicators. This section summarizes states’ FFY 2010 actual performances on each indicator, how states’ FFY 2010 actual performances compare to states’ FFY 2009 actual performances, and states’ explanations for changes in performance. Two documents published by OSEP in 2012, entitled “2012 Part B SPP/APR Analysis” and “2012 Part C SPP/APR Analysis” were used as the sources for the summaries of the results of the analysis of the indicators presented in this section. Both are available at http://therightidea.tadnet.org and were accessed on Feb. 7, 2013.
Early Childhood Transition: Part B Indicator 12
Part B Indicator 12 measures the percentage of children referred to Part B by Part C prior to age 3 who were found eligible for Part B and who had an individualized education program (IEP) developed and implemented by their third birthdays. Indicator 12 is considered a compliance indicator with a target of 100 percent. This indicator applies to the 50 states, the District of Columbia, Puerto Rico, American Samoa, Guam, the Northern Mariana Islands, and the Virgin Islands. Exhibit 83 displays the results of a 2012 analysis of FFY 2010 actual performance data on Indicator 12 from the 56 states to which this indicator applies.
Exhibit 83. Number of states, by percentage of children referred to IDEA, Part B, by Part C prior to age 3 who were found eligible for Part B and who had IEPs developed and implemented by their third birthdays: Federal fiscal year 2010
Percentage of childrena Number of states Total 56
100 12 95 to 99 34 90 to 94 6 < 90 4 a”Percentage of children” measures a state’s performance on Part B Indicator 12, for which the target is 100 percent. NOTE: The FFY 2010 reporting period was from July 1, 2010, through June 30, 2011. SOURCE: U.S. Department of Education, Office of Special Education Programs, “2012 Part B SPP/APR Analysis,” 2012. Available at http://therightidea.tadnet.org/assets/2147 (accessed Feb. 7, 2013).
For Indicator 12, a total of 12 states reported full compliance at 100 percent of the target, and 34
additional states reported substantial compliance (i.e., from 95 to 99 percent of the target). Of the 10 states that did not report full or substantial compliance, six states reported percentages that ranged from 90 to 94 percent of the target, and four states reported percentages that ranged from 62 percent to 86 percent of the target.
191

Exhibit 84 presents the results of a 2012 analysis of the descriptions of state-reported changes in performance status based on comparisons of FFY 2010 actual performance data to FFY 2009 actual performance data on Indicator 12 from the 56 states that reported data. As shown in exhibit 84, a total of 31 states showed progress; 14 states showed slippage; and 11 states showed the same performance in FFY 2009 and FFY 2010. The levels of progress made by the 31 states ranged from 0.1 percent to 32 percent, but only four states made progress of 8 percent or more. Eight of the 11 states with unchanged performance maintained 100 percent compliance, and two of the other three states performed above 98 percent. The performance in FFY 2010 of seven of the 14 states showing slippage was less than 1 percent smaller than the percentage in FFY 2009. Moreover, the performance in FFY 2010 for only three of the states showing slippage decreased by more than 3 percent.
Exhibit 84. Number of states, by change in performance status on IDEA, Part B, Indicator 12: Federal fiscal year 2010
Change in statusa Number of states Total 56
Progress 31 Slippage 14 No change 11 a“Change in status” was determined by whether a state’s FFY 2010 actual performance data showed an increase (progress) or decrease (slippage) in the percentage of children referred to IDEA, Part B, by Part C prior to age 3 who were found eligible for Part B and who had IEPs developed and implemented by their third birthdays, compared to the same percentage reported by the state in its FFY 2009 performance data. NOTE: The FFY 2009 reporting period was from July 1, 2009, through June 30, 2010. The FFY 2010 reporting period was from July 1, 2010, through June 30, 2011. SOURCE: U.S. Department of Education, Office of Special Education Programs, “2012 Part B SPP/APR Analysis,” 2012. Available at http://therightidea.tadnet.org/assets/2147 (accessed Feb. 7, 2013).
Most of the states with improved performance cited their engagement in multiple activities as
having contributed to their progress. The activities cited most frequently involved collaboration between Part C and Part B systems, training and TA, clarified policy/guidance, new data enhancements, and monitoring. The collaborations between Part C and Part B included such activities as meetings, facilitated discussions, trainings, as well as the revision of procedures, the development and implementation of Memorandums of Agreement, and the sharing of data. With the sharing of Part B and Part C data, it was possible to collaboratively examine trends, determine joint data verification processes, evaluate data system effectiveness, and develop shared procedures for TA and training. The training and TA activities addressed matters such as policy and professional development needs as well as issues related to data and data systems. Some of the particular data enhancements noted included the development of more complex systems, tracking logs, new data elements, and alerts. The monitoring activities cited concerned processes such as desk audits, which generally involved targeted TA, and corrective action plans.
192

The reasons for slippage that were most often cited by the three states in which performance decreased by more than 3 percent were related to local education agency (LEA) capacity or procedural issues. The particular reasons noted included: (1) personnel issues, including vacancies, shortages, and state-level turnover; (2) scheduling difficulties, including weather-related delays; (3) systematic data reporting issues or having a single entity responsible for data entry; (4) the absence of annual verification; and (5) the failure to receive referral information.
Early Childhood Transition: Part C Indicator 8
Part C Indicator 8, which is composed of three sub-indicators, measures the percentage of all children exiting Part C who received timely transition planning to support their transition to preschool and other appropriate community services by their third birthdays. Timely transition planning is measured by the following three sub-indicators: (a) individualized family service plans (IFSPs) with transition steps and services; (b) notification to the LEA, if the child is potentially eligible for Part B; and (c) transition conference, if the child is potentially eligible for Part B. Indicator 8 is a compliance indicator and its three sub-indicators, 8a, 8b, and 8c, have performance targets of 100 percent. These sub-indicators apply to the 50 states, the District of Columbia, Puerto Rico, American Samoa, Guam, the Northern Mariana Islands, and the Virgin Islands. Exhibit 85 displays the results of a 2012 analysis of FFY 2010 actual performance data on the three sub-indicators from the 56 states for which Indicator 8 applies.
Exhibit 85. Number of states, by percentage of children exiting IDEA, Part C, who received timely transition planning by their third birthdays, by sub-indicators of Part C Indicator 8: Federal fiscal year 2010
Percentage of childrena
Sub-indicator 8a: IFSPs with transition
steps and services 8b: Notification to LEA 8c: Transition
conference Number of states Number of states Number of states
Total 56 56 56 100 23 32 9 95 to 99 22 14 26 90 to 94 6 7 11 <90 5 3 10 a“Percentage of children” measures a state’s performance on a sub-indicator of Part C Indicator 8, for which the target is 100 percent. NOTE: The FFY 2010 reporting period was from July 1, 2010, through June 30, 2011. SOURCE: U.S. Department of Education, Office of Special Education Programs, “2012 Part C SPP/APR Analysis,” 2012. Available at http://therightidea.tadnet.org/assets/2146 (accessed Feb. 7, 2013).
193

As shown in exhibit 85, more states were in full compliance in their notifications to the LEA (8b) than for either of the other two sub-indicators. For 8b, 32 of the 56 states met the target of 100 percent compliance. Of the 24 states that did not attain this target, 14 reported performance at substantial compliance of 95 to 99 percent of the target. IFSPs with transition steps and services (8a) had the second highest level of compliance as 23 states reported full compliance. Of the 33 states that did not achieve 100 percent compliance for 8a, 22 states reported performance at substantial compliance (i.e., 95 to 99 percent of the target). The sub-indicator regarding the transition conference (8c) was associated with the lowest level of compliance, with only nine states reporting full compliance and 26 states reporting substantial compliance.
Exhibit 86 shows the results of a 2012 analysis of descriptions of reported changes in performance status based on comparisons of FFY 2010 actual performance data to FFY 2009 actual performance data on the three sub-indicators from the 54 states with data available for both time periods. The majority of states that were not 100 percent compliant in both FFY 2009 and FFY 2010 made progress on all three sub-indicators. Specifically, progress was made by 24 of the 41 states that were not 100 percent compliant on 8a (IFSP steps and services), 14 of the 28 states that were not 100 percent compliant on 8b (notification to LEA), and 24 of the 47 states that were not 100 percent compliant on 8c (transition conference). More states reported slippage from FFY 2009 for sub-indicator 8c (19 states) than for sub-indicators 8a (15 states) and 8b (14 states).
Across all three sub-indicators, the majority of the states that reported no performance change had achieved 100 percent of the target in FFY 2009 and maintained that performance in FFY 2010. Specifically, the 100 percent target was achieved in both years by 13 of the 15 states that reported no change in performance regarding sub-indicator 8a, 26 of the 26 states that reported no change regarding sub-indicator 8b, and seven of the 12 states that reported no change regarding sub-indicator 8c.
194

Exhibit 86. Number of states, by change in performance status on sub-indicators of IDEA, Part C, Indicator 8: Federal fiscal year 2010
a“Change in status” was determined by whether a state’s FFY 2010 actual performance data showed an increase (progress) or decrease (slippage) in the percentages of children exiting IDEA, Part C, who received timely transition planning by their third birthdays, broken out by sub-indicators (i.e., by percentages of (a) children who had IFSPs with transition steps and services; (b) those for whom notification had been given to the LEA, if the child was potentially eligible for Part B; and (c) those for whom a transition conference had been held, if the child was potentially eligible for Part B), compared to the same percentages reported by the state in its FFY 2009 actual performance data. NOTE: The FFY 2009 reporting period was from July 1, 2009, through June 30, 2010. The FFY 2010 reporting period was from July 1, 2010, through June 30, 2011. SOURCE: U.S. Department of Education, Office of Special Education Programs, “2012 Part C SPP/APR Analysis,” 2012. Available at http://therightidea.tadnet.org/assets/2146 (accessed Feb. 7, 2013).
The 2012 analysis of the states’ explanations for changes in performance included a review of information about each Part C sub-indicator, i.e., 8a, 8b, and 8c, in the states’ FFY 2010 APRs. In total, 30 states provided some explanation for progress across all sub-indicators, but some of these states offered explanations that applied to all sub-indicators collectively. These cross-indicator explanations for progress addressed such factors as improved monitoring processes (e.g., increased file review and verification activities), increased and targeted TA strategies, data system modifications with resulting data entry guidance and training, and the clarification of transition rules and policies. Other states provided explanations for progress for specific sub-indicators. For example, several states attributed their progress regarding sub-indicator 8a to activities related to the content and use of the IFSP form, notably efforts to
195
clarify expectations and improve documentation, revise the actual IFSP form to promote the collection of the required data, and improve the accuracy of staff data entry into new electronic data systems. Twenty-seven states (i.e., six more than in the last reporting period) indicated that they used a statewide IFSP form with a transition section.
As so many states’ performance on sub-indicator 8b was unchanged, there was less discussion about progress for this sub-indicator than the others. Some states did, however describe activities regarding notification policies, prompted by the OSEP Early Childhood Transition FAQS: SPP/APR Indicators C-8 and B-12 (2009). In particular, states attributed their progress to an improved ability to track children due to adding new data elements to their data systems, generating and sharing reports more frequently with programs, implementing data sharing agreements, providing targeted training and TA on notification, and clarifying the definition of potentially eligible children and opt-out policies when applicable.
The provision of clarification and guidance for documenting exceptional family circumstances and for programs convening conferences too close to the 90-day timeline was reported as an explanation for progress regarding sub-indicator 8c. In addition, a few states described efforts to embed transition conference timeline requirements into mandatory training for new service coordinators and efforts to enhance supervision of these requirements.
Twenty-four states addressed slippage on the three sub-indicators. In some cases, states attributed slippage on a particular sub-indicator to one or more factors. In other cases, states attributed slippage on more than one sub-indicator to the same factor. For example, states that relied on cyclical monitoring as a method of data gathering mentioned the issues of basing performance on a small number of programs as contributing to slippage on more than one sub-indicator. In fact, some states reported slippage as caused by non-compliance of a specific program rather than due to widespread systemic issues. In general, the primary causes identified for non-compliance were incomplete documentation, incomplete or inaccurate data entry, scheduling errors, calculating timelines incorrectly, and staff availability.
General Supervision: Part B Indicator 15
The SEA is responsible for ensuring the general supervision of all educational programs for children and students ages 3 through 21 served under IDEA, Part B, including all such programs administered by any other state agency or local agency. Part B Indicator 15 measures whether the state’s general supervision system (including monitoring, complaints, hearings, or other activities) identified and corrected noncompliance as soon as possible but in no case later than one year from identification. This
196

indicator is measured as the percentage of noncompliance findings corrected within one year of identification. To calculate this measurement, the number of findings corrected as soon as possible, but in no case later than one year from identification, are divided by the number of findings of noncompliance and then multiplied by 100. Indicator 15 is a compliance indicator with a target of 100 percent. This indicator applies to the 50 states, the District of Columbia, Puerto Rico, BIE schools, American Samoa, Guam, the Northern Mariana Islands, the Virgin Islands, the Federated States of Micronesia, Palau, and the Republic of the Marshall Islands. Exhibit 87 displays the results of a 2012 analysis of FFY 2010 actual performance data on Indicator 15 for the 60 states for which this indicator applies.
Exhibit 87. Number of states, by percentage of IDEA, Part B, noncompliance findings corrected within one year of identification: Federal fiscal year 2010
Percentage of noncompliance findings correcteda Number of states
Total 60 90 to 100 48 80 to 89 6 70 to 79 2 <70 3 Actual performance data not provided for FFY 2010 1 a“Percentage of noncompliance findings corrected” measures a state’s performance on Part B Indicator 15, for which the target is 100 percent. NOTE: The FFY 2010 reporting period was from July 1, 2010, through June 30, 2011. SOURCE: U.S. Department of Education, Office of Special Education Programs, “2012 Part B SPP/APR Analysis,” 2012. Available at http://therightidea.tadnet.org/assets/2147 (accessed Feb. 7, 2013).
For Indicator 15, there were 48 states that reported achieving 90 percent or more of the target, six
states that reported achieving between 80 and 89 percent of the target, two states that reported achieving between 70 and 79 percent of the target, and three states that reported achieving less than 70 percent. Data were not available for one state.
Exhibit 88 presents the results of a 2012 analysis that compared FFY 2010 actual performance
data to FFY 2009 actual performance data on Indicator 15 from the 59 states for which data were available for both time periods. Overall, 28 states showed improvement; 18 states showed slippage; and 13 states showed no change in performance.
197

Exhibit 88. Number of states, by change in performance status on IDEA, Part B, Indicator 15: Federal fiscal year 2010
Change in statusa Number of states Total 60
Progress 28 Slippage 18 No change 13 Actual performance data not provided for FFY 2009 or FFY 2010, or both 1
a“Change in status” was determined by whether a state’s FFY 2010 actual performance data showed an increase (progress) or decrease (slippage) in the percentage of findings of Part B noncompliance corrected within one year of identification, compared to the same percentage reported by the state in its FFY 2009 actual performance data. NOTE: The FFY 2009 reporting period was from July 1, 2009, through June 30, 2010. The FFY 2010 reporting period was from July 1, 2010, through June 30, 2011. SOURCE: U.S. Department of Education, Office of Special Education Programs, “2012 Part B SPP/APR Analysis,” 2012. Available at http://therightidea.tadnet.org/assets/2147 (accessed Feb. 7, 2013).
The following explanations were among the most commonly cited by the states reporting
progress: (1) providing targeted training to local districts concerning the requirements for demonstrating the correction of noncompliance, (2) providing training and support to local districts to ensure correction by addressing root causes for the noncompliance, (3) implementing the improvement activities outlined in the state APR, (4) conducting regular follow-ups with the local district to determine progress in correcting noncompliance, and (5) creating a more robust general supervision system in order to adhere to the OSEP Memorandum 09-02. The most commonly cited reasons explaining slippage included: (1) noncompliance concerning a particular LEA, (2) individual student noncompliance, and (3) changes in the state’s infrastructure (e.g., consolidation of district and/or regional structures).
General Supervision: Part C Indicator 9
The state lead agency is responsible for ensuring the general supervision of all early intervention service programs for infants and toddlers birth through age 2 served under IDEA, Part C. Part C Indicator 9 measures whether the state lead agency’s general supervision system (including monitoring, complaints, hearings, or other activities) identified and corrected noncompliance as soon as possible but in no case later than one year from identification. This indicator is measured as the percentage of noncompliance findings corrected within one year of identification. To calculate this measurement, the number of findings corrected as soon as possible, but in no case later than one year from identification, is divided by the number of findings of noncompliance and then multiplied by 100. The target for this compliance indicator is 100 percent. This indicator applies to the 50 states, the District of Columbia, Puerto Rico, American Samoa, Guam, the Northern Mariana Islands, and the Virgin Islands. Exhibit 89 displays the
198

results of a 2012 analysis of FFY 2010 actual performance data on Indicator 9 from the 56 states for which this indicator applies.
Exhibit 89. Number of states, by percentage of IDEA, Part C, noncompliance findings corrected within one year of identification: Federal fiscal year 2010
Percentage of noncompliance findings correcteda Number of states
Total 56 100 34 95 to 99 5 90 to 94 4 70 to 89 5 < 70 1 Valid and reliable actual performance data not available for FFY 2010 7 a“Percentage of noncompliance findings corrected” measures a state’s performance on Part C Indicator 9, for which the target is 100 percent. NOTE: The FFY 2010 reporting period was from July 1, 2010, through June 30, 2011. SOURCE: U.S. Department of Education, Office of Special Education Programs, “2012 Part C SPP/APR Analysis,” 2012. Available at http://therightidea.tadnet.org/assets/2146 (last accessed Feb. 7, 2013).
For Indicator 9, there were 34 states that reported full compliance with the 100-percent target. In
addition, five states reported percentages that met the standard for substantial compliance (i.e., from 95 to 99 percent of the target); four states reported percentages that ranged from 90 to 94 percent of target; five states reported percentages that ranged from 70 to 89 percent of the target; and one state reported below 70 percent of the target. Valid and reliable performance data were not available for seven states.
Exhibit 90 shows the results of a 2012 analysis of the descriptions of state-reported changes in
performance status based on comparisons of FFY 2010 actual performance data to FFY 2009 actual performance data on Indicator 9 from the 47 states for which valid and reliable data for both time periods were available. The exhibit reveals 12 states reported progress, while 10 states reported slippage, and 25 states reported the same performance in FFY 2009 and FFY 2010.
199

Exhibit 90. Number of states, by change in performance status on IDEA, Part C, Indicator 9: Federal fiscal year 2010
Change in statusa Number of states Total 56
Progress 12 Slippage 10 No change 25 Valid and reliable actual performance data not available for FFY 2009 or FFY 2010, or both 9 a“Change in status” is determined by whether a state’s FFY 2010 actual performance data showed an increase (progress) or decrease (slippage) in the percentage of findings of Part C noncompliance corrected within one year of identification, compared to the same percentage reported by the state in its FFY 2009 actual performance data. NOTE: The FFY 2009 reporting period was from July 1, 2009, through June 30, 2010. The FFY 2010 reporting period was from July 1, 2010, through June 30, 2011. SOURCE: U.S. Department of Education, Office of Special Education Programs, “2012 Part C SPP/APR Analysis,” 2012 Available at http://therightidea.tadnet.org/assets/2146 (accessed Feb. 7, 2013).
The narratives about progress and slippage on Part C Indicator 9 provided by the states in their
APRs were quite varied and often did not include the terms “progress” or “slippage.” Nevertheless, 14 of the 22 states that reported either progress or slippage did provide some discussion that could be characterized as a description of progress or slippage. In general, the descriptions identified the following factors as having had a positive effect on performance (1) implementation of revisions and improvements to the state’s general supervision system; (2) increased capacity for correction and TA due to increased state staff or training of state and regional staff; (3) TA from OSEP and regional and national TA providers; (4) state leadership focus on program improvement and general supervision; (5) providing ongoing TA activities to early intervention programs about general supervision and correction of noncompliance requirements; (6) developing and posting training modules to ensure ongoing access and annual trainings on correction of noncompliance; (7) creating a database to track status toward correction, including sharing the information with regional and local programs; (8) instituting a focused onsite monitoring process approach based on local program need; (9) revising the corrective action plan process to include monthly required progress reports; and (10) establishing protocols to conduct onsite visits to review child records and systems in order to ensure verification of correction.
The descriptions identified the following factors as having had an adverse effect on performance:
(1) challenges in particular local programs, including insufficient budgets, staff turnover, large caseloads, high poverty rates, and increased numbers of families whose primary language is not English; (2) an enhanced impact of each finding that was not corrected on the overall percentage of findings corrected because fewer findings were issued in total; (3) the fact that the previous Part C coordinator did not issue formal letters of findings; and (4) a change in the state correction procedures that required 100 percent to be achieved for correction, instead of the previous threshold.
200
Section IV
Summary of Research Conducted Under Part E of the Education Sciences Reform Act of 2002


Summary of Research Conducted Under Part E of the Education Sciences Reform Act of 2002
In December 2004, Congress reauthorized the Individuals with Disabilities Education Act (IDEA) and, in doing so, amended the Education Sciences Reform Act of 2002, 20 U.S.C. 9501, et seq., by adding a new Part E. The new Part E established the National Center for Special Education Research (NCSER) as part of the Institute of Education Sciences (IES). Prior to the reauthorization of IDEA, the U.S. Department of Education’s Office of Special Education Programs (OSEP) was responsible for carrying out research related to special education. NCSER began operation on July 1, 2005. As specified in section 175(b) of the Education Sciences Reform Act of 2002, NCSER’s mission is to
• Sponsor research to expand knowledge and understanding of the needs of infants, toddlers, and children with disabilities in order to improve the developmental, educational, and transitional results of such individuals;
• Sponsor research to improve services provided under, and support the implementation of, IDEA; and
• Evaluate the implementation and effectiveness of IDEA in coordination with the National Center for Education Evaluation and Regional Assistance.
In federal fiscal year (FFY) 2012 (i.e., Oct. 1, 2011, through Sept. 30, 2012), NCSER conducted three grant competitions: Special Education Research Grants program, Special Education Research and Development Center program, and Postdoctoral Research Training Program in Special Education. NCSER received 391 applications and awarded 49 new research and research training grants across the three grant programs. In addition, NCSER awarded four contracts through its Small Business Innovation Research in Special Education program competition.
Descriptions of projects funded by NCSER in FFY 2012 under Part E of the Education Sciences
Reform Act of 2002 follow. The descriptions summarize the proposed purposes of the projects based on
information taken from the research grants and contracts database on the IES website. In FFY 2012,
NCSER added two new long-term programs of research (topics) under its Special Education Research
Grant program: Families of Children With Disabilities and Technology for Special Education. NCSER
awarded grants for its Special Education Research Grant program under the following 10 topics: Autism
Spectrum Disorders; Cognition and Student Learning in Special Education; Early Intervention and Early
Learning in Special Education; Mathematics and Science Education; Professional Development for
Teachers and Related Services Providers; Reading, Writing, and Language Development; Social and
Behavioral Outcomes to Support Learning; Special Education Policy, Finance, and Systems; Technology
203

for Special Education; and Transition Outcomes for Secondary Students With Disabilities. NCSER made
no awards for the Families of Children With Disabilities topic in FFY 2012. The descriptions of the
grants are organized and presented in terms of these topics. Descriptions of the grants awarded for the
Special Education Research and Development Centers and Postdoctoral Research Training Program in
Special Education and contracts awarded for the Small Business Innovation Research in Special
Education program follow. Additional information on these projects as well as new and continuing
projects can be found at http://ies.ed.gov/funding/grantsearch/ (accessed July 24, 2012).
Autism Spectrum Disorders
Award Number: R324A120330 Institution: Hugo W. Moser Research Institute at Kennedy Krieger, Inc. Principal Investigator: Rebecca Landa Description: Development of Social and Communication Intervention for Preschoolers with Autism. The special educational needs of children with autism spectrum disorders (ASD) are extensive. Educators face practical problems such as targeting the core social and communication deficits of children with ASD in group instructional settings. For example, children with ASD exhibit problems with interpersonal synchrony, which requires socially appropriate initiations and responsivity to others. To address these concerns, there is a need for evidence-based, cost-effective educational and service delivery models to treat these children. The purpose of this research is to develop and document the feasibility and promise of a social and communication curriculum supplement, Early Achievements. The research team will adapt this intervention for preschoolers from an intervention originally targeting toddlers. The ultimate aim is to develop a preschool supplementary intervention targeting core social and communication deficits of ASD that can be integrated with existing academic curricula throughout the school day. It will include guidelines for intervention materials, activities, and instructional strategies based on Pivotal Response Training paired with strategies that promote interpersonal synchrony and engagement. The research team will also examine the feasibility of the intervention, the promise of the intervention for changing instructional practices and child skills, and whether the results are affected by the inclusiveness of the classroom placement or the severity of the child’s impairment. The team will develop the intervention over two years through an iterative process of modifications based on input from educators, speech-language pathologists, parents, researchers, and administrators, as well as data collected through implementation in classrooms. To assess the promise of the intervention during the third year, there will be a comparison of educator practices and child social and communication behavior between classes with and without the intervention. In the final phase, the research team will finalize the intervention manual. Products of the project will include a fully developed intervention to be used as a supplemental curriculum for targeting social and communication skills in children with ASD, peer-reviewed publications, and presentations. Amount: $1,499,815 Period of Performance: 7/1/2012–6/30/2015
Award Number: R324A120054 Institution: Rady Children’s Hospital Health Center Principal Investigator: Aubyn Stahmer Description: Examining the Efficacy of Classroom Pivotal Response Teaching in Classroom Environments. With rates of autism spectrum disorders (ASD) increasing, public schools are straining to provide high-quality, evidence-based programs for these students. To date, most evidence-based practices for students with ASD have been designed for use in one-on-one or highly controlled settings. Little
204

research to date has examined the effectiveness of specific techniques in the context of school systems. The purpose of this project is to conduct a randomized trial of an intervention called Classroom Pivotal Response Teaching (CPRT), an intervention specifically adapted for use in classrooms for children with ASD. The trial will study children in preschool through fifth-grade classrooms to determine whether the program improves students’ communication, object play, academic and social skills, on-task behavior, and progress toward individualized education program (IEP) goals, including an examination of moderators and mediators of outcomes. The study will also examine teacher fidelity of implementation, moderators and mediators of teacher fidelity, and sustainability of program components. The research team will use a randomized design, with 108 classrooms randomized to three groups, to study the efficacy of the CPRT intervention over four years. In the first year, there will be a treatment group (A) and control group (B), as well as a waitlist group (C). Group C assignees will not participate in the first year. In the second year of the study, the former control group (B) will be the treatment group, and the former waitlist group (C) will be a new control group. By the end of the third year, all groups will have received treatment and entered the follow-up phase. Teachers will receive a coaching "booster" each year after their training year. The research team will collect assessment data for groups A and B in the first year and for all three groups in the remaining years. Products of the project will include published reports and presentations on the efficacy of the CPRT intervention for students with autism, teacher success at obtaining and maintaining fidelity over time, and classroom- and student-level moderators of intervention efficacy. Amount: $2,545,268 Period of Performance: 6/1/2012–5/31/2016
Award Number: R324A120012 Institution: SRI International Principal Investigator: Mary Wagner Description: Factors Associated with Positive Outcomes for Children and Youth with Autism: Secondary Analysis of Data from SEELS and NLTS2. The rapid growth in the number and diversity of children and youths served under Part B of the Individuals with Disabilities Education Act under the category of autism represents a significant challenge for educators across the country. There is still much to be learned about the types of school-related interventions (e.g., instructional programs and settings, learning supports, supplemental and related services, and accommodations and modifications) that can be used to improve school and postsecondary school outcomes for students with autism. This research team will use extant data from the Special Education Elementary Longitudinal Study (SEELS) and the National Longitudinal Transition Study-2 (NLTS2) to determine what school-related interventions are associated with academic, social/behavioral, occupational, and independence outcomes for children and youths with autism throughout the school years and into early adulthood. Research activities will take place sequentially within outcome domains. For each domain, the researchers will conduct exploratory, descriptive, and propensity score analyses. The domains will be analyzed in the following order: academic (SEELS and NLTS2), social/behavioral (SEELS and NLTS2), occupational (NLTS2), and independence outcomes (NLTS2). Products of the project will include published articles and presentations on the types of school-related interventions associated with academic, social/behavioral, occupation, and independence outcomes for students with autism. Amount: $699,947 Period of Performance: 3/1/2012–2/28/2014
205
Award Number: R324A120232 Institution: University of Oklahoma Health Sciences Center Principal Investigator: Bonnie McBride Description: Project DATA: A Multisite Evaluation of a School-based Model for Preschoolers with Autism. The prevalence of autism spectrum disorders (ASD) rose dramatically in the 10 years prior to 2012, and children are being identified at earlier ages, putting pressure on school districts to provide effective interventions for these young children. One comprehensive treatment model that aims to address this need for effective early intervention is Project DATA (Developmentally Appropriate Treatment for Autism). This model blends practices from the fields of applied behavior analysis, early childhood education, and early childhood special education. The purpose of this research is to evaluate Project DATA for preschool children using a two-arm randomized controlled trial. The research team will examine the impact of the intervention on child cognition, language, social skills, and behavior. The team will also investigate potential child-level moderators as well as family functioning and satisfaction as potential mediators of intervention effects. Twelve schools will participate, each with at least 10 children with clinical levels of ASD symptoms. The research team will randomly assign classrooms to the experimental or comparison (standard care) condition and will randomize children to classrooms. Outcomes of the intervention will relate to child cognition, language, social skills, and behavior. The investigators will also examine whether various child-level variables (e.g., gender, age, severity of ASD symptoms) moderate the impact of the intervention and whether family functioning and satisfaction with the intervention serve as potential mediators. Products of the project will include evidence of the efficacy of Project DATA for preschool children with ASD, peer-reviewed publications, and presentations. Amount: $2,600,000 Period of Performance: 7/1/2012–6/30/2016
Cognition and Student Learning in Special Education
Award Number: R324A120168 Institution: University of California, Davis Principal Investigator: Peter Mundy Description: Virtual Reality Applications for the Study of Attention and Learning in Children with Autism and ADHD. Children with high-functioning autism (HFA) frequently exhibit achievement difficulties, especially in the areas of reading comprehension and written expression. Social attention impairment, a symptom of autism, may play a critical role in the learning difficulties of these children. Social attention impairment in autism encompasses three related problem domains—joint attention, social orienting, and attention to faces. To engage effectively in social learning within a classroom, children must be motivated and readily able to attend to other people to share and receive meaningful information. The complex social and cognitive contexts of classrooms, in which social attention must be regulated in interaction with multiple social partners, makes social learning even more complicated for school-aged children with autism. This project will apply new virtual reality technology to create visual and auditory settings that emulate complex social environments such as classrooms. Using such technology, researchers will examine the following questions: (1) Will students with autism display significant impairments in the development of social attention skills, and will individual differences in social attention be associated with measures of cognitive processes involved in learning, academic achievement (reading comprehension, written and oral expression, and mathematics), and social outcomes? (2) Will impairment in social attention make a unique contribution to processes that may inhibit learning, academic success, and social success in students with autism? (3) Will the presence of symptoms of attention deficit hyperactivity disorder (ADHD), which is often co-morbid with autism, mediate or moderate the impact of social attention on learning and development in students with autism? (4) Will social attention be malleable, with practice in social attention tasks leading to improved performance on those tasks for students with autism? The research team will investigate social attention in children with autism, and the relation of social attention to learning, academic achievement, and social outcomes, by
206

collecting data directly from students with autism and their parents and teachers. Children and their parents will visit a university-based laboratory for baseline data collection on all standardized child measures, standardized parent measures, and child measures of social attention and learning. Teachers will complete standardized measures through the mail. The research team will contact primary teachers for each elementary school student and two teachers for middle and high school students (one English or social studies teacher, one math or science teacher). The team will collect follow-up data twice over two and a half years. The research team will randomly assign independent sample of students with HFA to a "training" group (practice social attention using virtual reality tasks) or a control group. Products of the study will include published manuscripts and presentations on findings related to social attention in children with autism. The knowledge gained from this project is expected to lay the groundwork for developing classroom-based virtual reality, social-attention intervention methods aimed at improving education, and social outcomes for school-aged students with autism. Amount: $1,548,458 Period of Performance: 3/1/2012–2/28/2016
Early Intervention and Early Learning in Special Education
Award Number: R324A120097 Institution: Board of Regents, University of Nevada, Reno Principal Investigator: Glen Dunlap Description: A Randomized Controlled Trial of Prevent-Teach-Reinforce for Young Children. Students with serious behavioral challenges may experience a host of negative school and life outcomes if their behavior is not addressed early in life. Compared to students within any category of disability, students with emotional disturbance are at greatest risk for school failure and have the poorest academic records and highest dropout rates. To help improve outcomes for these students, the research team is evaluating the efficacy of a promising intervention to provide young children in preschool settings with the readiness skills they need to succeed in elementary school and beyond. The purpose of this project is to determine whether a manualized intervention model called Prevent-Teach-Reinforce for Young Children is more effective than typical practice in reducing preschoolers’ challenging behaviors and increasing their social skills and engagement. Approximately 270 preschoolers who have challenging behaviors will participate in this research. The population will include children identified as having disabilities as well as children deemed at risk for disabilities due to the extent of their challenging behaviors. The Prevent-Teach-Reinforce for Young Children model is a fully developed strategy that had been adapted from one previously used with elementary and middle school students. The model includes a school-based team that sets goals for individual students, establishes a strategy for measuring targeted behaviors daily, develops an intervention plan and monitors student progress. The research team will use a randomized controlled trial to study the efficacy of the model. The team will randomly assign children to the treatment or business-as-usual condition and assess students at multiple time points—before, during, and immediately after the intervention. The team will analyze data to estimate the effects of Prevent-Teach-Reinforce for Young Children on measures of children’s behavior, social skills, and engagement. Products of the project will be published reports on the efficacy of the Prevent-Teach-Reinforce for Young Children intervention for reducing challenging behaviors and improving the social skills and engagement of children with serious behavior challenges. Amount: $2,667,001 Period of Performance: 04/01/2012–03/31/2016
207

Award Number: R324A120033 Institution: University of North Carolina at Chapel Hill Principal Investigator: Michael Willoughby Description: Development of a Computerized Assessment of Executive Function for Preschool-Aged Children. Executive function (EF) is an umbrella term that refers to a wide range of cognitive abilities that together serve as a supervisory system important for planning, reasoning ability, and integration of thought and action. EF plays a central role in children’s development of self-regulation and social and cognitive competence. Evidence suggests that EF deficits may act as a "final common pathway" through which diverse disorders and risk factors affecting young children lead to learning difficulties and early school failure. As such, it is essential that psychometrically sound longitudinal measures of EF be developed to identify EF deficits in diverse groups of children and to determine the efficacy of various attempts at remediating these deficits and promoting school achievement. The aim of this study is to further develop and evaluate a computerized assessment of EF for use with preschool-aged children. The investigators will complete the development of tasks and computerization of the EF assessment; evaluate the test-retest reliability of the new EF computerized assessment; evaluate the psychometric properties of individual EF tasks and the battery overall; and test the validity of the computerized EF battery by relating task performance to other measures of EF, processing speed and intelligence, academic achievement, and teacher-rated behaviors. The main product of the project will be a fully developed and validated computerized assessment to identify EF deficits in preschoolers and determine the efficacy of interventions aimed at remediating EF deficits. Data on the reliability, validity, and feasibility of the computer assessment will also be available. Amount: $1,628,302 Period of Performance: 3/1/2012–2/28/2016
Award Number: R324A120284 Institution: Lehigh University Principal Investigator: George DuPaul Description: Early Intervention for Young Children with ADHD: Developing Strategies to Enhance Parent Engagement. Attention Deficit Hyperactivity Disorder (ADHD) in young children is associated with significant impairment in behavioral, social, and pre-academic functioning—approximately two standard deviations below children without ADHD in all three areas. Additionally, ADHD tends to be chronic, with research suggesting that at least 70 to 80 percent of preschool-aged children with ADHD will continue to exhibit significant ADHD symptoms during elementary school. One promising approach to intervention in the early years is to train parents to help address the issues of young children exhibiting early behavioral symptoms of ADHD. However, two major factors seem to limit the effectiveness of parent education programs: (1) the duration of many of the programs (e.g., 20 sessions) appears to severely limit parent completion, and (2) none of the parent education interventions have specifically targeted the multiple challenges that children with ADHD experience, such as poor parent-child interactions, difficulty with pre-academic skills, and a high injury rate. The primary purpose of this project is to further develop and refine a parent education program to increase parent engagement with early intervention for young children with ADHD. A secondary purpose is to develop an alternative format (web-based) of parent education to increase parent accessibility to and engagement with the intervention. The end goal is for more consistent implementation of effective behavioral strategies for preschoolers. The research team will conduct research activities across three phases. During Phase 1, the team will modify and streamline an existing parent education program, with the goal of increasing and maintaining parent engagement. During Phase 2, the team will develop and refine a web-based format of the parent education program, which also aims to increase and maintain parent engagement. During Phase 3, the team will compare parent engagement, implementation fidelity, and child outcomes between in-person and web-based delivery of parent education. The team will also examine parent and child characteristics associated with differential parent preference for delivery model. Products of the project will include a fully developed, streamlined, and targeted parent education program in two formats (face-
208

to-face and web-based) that will be suited for parents of young children with significant symptoms of ADHD, data on the feasibility and promise of the intervention, and peer-reviewed publications and presentations. Amount: $1,207,209 Period of Performance: 9/1/2012–8/31/2015
Award Number: R324A120153 Institution: University of Nebraska-Lincoln Principal Investigator: Susan Sheridan Description: Efficacy of the Getting Ready Intervention at Supporting Parental Engagement and Positive Outcomes for Preschool Children at Educational Risk. Despite the efforts of early intervention programs to bolster school readiness, some children arrive in kindergarten demonstrating early cognitive, language, or socio-emotional delays that hinder their progress in school. In addition, despite overwhelming evidence of the benefits of planned coordination between home and school, this coordination occurs all too rarely for individual children. This reality, coupled with the unequivocal finding that early relationships matter in a child’s developmental trajectory, points to the importance of intervening with at-risk children and families in ways that support learning. The intervention to be tested in this study, Getting Ready, is designed to improve learning experiences and opportunities for preschool children with cognitive, linguistic, or socio-emotional delays by strengthening relationships, creating partnerships, and promoting continuity in educational experiences across home and school. Researchers will conduct a randomized controlled trial, with random assignment of 75 preschool classrooms to the Getting Ready intervention or control condition. The study will include 300 children from these classrooms. Implementation of the Getting Ready intervention will involve two components aimed at (1) building, reinforcing, and maintaining cognitive, language, and socio-emotional skills in children at educational risk; and (2) creating continuities and strengthening relationships within (parent-child, teacher-child) and between (family-school) settings. The research team will collect outcome data to assess child cognitive, language, and socio-emotional skills; parent engagement; and parent-teacher relationships at the beginning and end of preschool and at the beginning and end of kindergarten. The study will result in evidence on the following: (1) efficacy of the Getting Ready intervention to enhance cognitive, language, and socio-emotional functioning for children identified early as demonstrating risk; (2) impact of the intervention on parent engagement and parent-teacher relationships; (3) whether changes in parent engagement and parent-teacher relationships mediate the effects of the intervention on child outcomes; and (4) whether there are long-term effects of the intervention for children demonstrating early risk as they transition to kindergarten. The research team will report results in conference presentations and published articles. Amount: $3,170,409 Period of Performance: 7/1/2012–6/30/2016
Award Number: R324A120363 Institution: University of Texas Health Science Center at Houston Principal Investigator: Heather Taylor Description: Enhancing Early Learning for Infants with Disabilities: A Responsive Parenting Intervention. Children with physical disabilities associated with spina bifida and cerebral palsy face multiple challenges due to early physical and cognitive difficulties that affect their learning and later academic performance and independence. Parents of these children have the greatest potential for influencing their development due to the number of opportunities they have to interact with their children. However, the field of early intervention often fails to engage parents as active and primary mediators of the developmental services their children receive. Parenting interventions have included teaching responsiveness strategies resulting in improved child development/learning outcomes or motor support strategies resulting in improved motor learning and development, but rarely are the two types of interventions combined. This study will investigate whether an integrated parent responsiveness and motor support intervention that targets the specific motor, attention, and organization deficits among
209

infants with physical disabilities results in greater improvements in core skills (attention, motor learning, contingency learning, and goal-directed play) and outcomes (cognition, language, social and emotional competence, and motor performance) compared to an intervention that focuses on responsiveness only and a control group receiving developmental information. The researchers will conduct a randomized controlled trial that compares three conditions: (1) an intervention that integrates a responsiveness program with research-based motor support behaviors, called Playing and Learning Strategies to Enable Children with Motor Difficulties (PALS-Enable); (2) a responsiveness intervention, Playing and Learning Strategies (PALS) only; and (3) an attention control condition that provides developmental information only. The research team will recruit 180 infants, 12 to 18 months of age, with physical disabilities related to spina bifida and cerebral palsy. Researchers will examine four assessments (pre-intervention, midpoint, post-intervention, and follow-up) of parent responsiveness behaviors and child core skills and developmental outcomes to determine intervention effectiveness. Products of the project will include evidence of the efficacy of the PALS-Enable and PALS interventions targeted toward children with disabilities due to spina bifida and cerebral palsy and published reports and presentations. Amount: $2,649,290 Period of Performance: 9/1/2012–8/31/2016
Award Number: R324A120178 Institution: Vanderbilt University Principal Investigator: Mary Louise Hemmeter Description: Examining the Efficacy of a Classroom-Wide Model for Promoting Social Emotional Development and Addressing Challenging Behavior in Preschool Children with or At-Risk for Disabilities. Researchers have noted that children are entering elementary school without the behavior skills that are necessary for success. Social and behavior challenges that are not resolved during the early childhood years may lead to problems with socialization, school adjustment, and educational success in later grades. Intervention in preschool may help ameliorate the social, emotional, and behavioral challenges that preschoolers can display. The research team will conduct a randomized controlled trial to evaluate whether a comprehensive, classroom-wide preschool intervention system called Teaching Pyramid promotes social skills, reduces challenging behavior, and enhances the school readiness of young children with and without disabilities. The research team will also investigate whether teachers are continuing to use the Teaching Pyramid system in the year after the research support has ended. The research team will randomly assign 80 preschool classrooms to the Teaching Pyramid system or to practices as usual. The Teaching Pyramid system contains universal strategies for supporting the social-emotional development of all children in the classroom and intensified interventions for children who are at risk for problem behavior or who display severe and persistent challenging behavior. While the study will use the Teaching Pyramid system with all students in the preschool classroom, the research team is specifically targeting children with or at risk for emotional or behavior disorders in these classrooms. The team will assess targeted children before, during, and immediately after intervention and other children in the classroom pre- and post-intervention. The team will use multi-level modeling to estimate the effects of Teaching Pyramid on social skills, behavior, and early learning of all students in the classroom, with particular focus on those at risk for behavior concerns. The team will also investigate whether classroom quality or teacher practices improve and whether teachers sustain implementation of the intervention in the year after the research support has ended. Products of the project will include published reports on the efficacy of Teaching Pyramid for improving social competence, behavior, and learning outcomes for preschoolers with and without disabilities. Amount: $3,499,978 Period of Performance: 03/01/2012–02/29/2016
210
Award Number: R324A120291 Institution: Trustees of Indiana University Principal Investigator: Hannah Schertz Description: Joint Attention Mediated Learning Intervention for Toddlers with Autism Spectrum Disorders and Their Families. The prevalence of autism spectrum disorders (ASD) has grown dramatically, with advances in early identification resulting in an influx of toddlers to the early intervention system. Although early intervention providers are required to implement evidence-based practices for this population, few models are available that target social communication, the core difficulty in ASD, at the preverbal stage when neurological development is most malleable. This project will directly address this need through an efficacy study of Joint Attention Mediated Learning (JAML), an intervention practice for toddlers with ASD that directly targets foundational preverbal social communication competencies from within the parent-child relationship at a critical juncture (by 30 months of age). Specifically, this study will determine the efficacy of JAML on the early preverbal and verbal social communication development of toddlers with ASD and the self-efficacy of their caregivers. It will assess factors that mediate and moderate intervention effects, and it will address the feasibility and acceptability of JAML. Researchers will conduct a randomized controlled trial that compares the JAML intervention to a business-as-usual condition. The research team will recruit 126 toddlers, aged 30 months or younger, with ASD. The team will conduct assessments prior to the intervention (pre-test), post-intervention (post-test), and six months after the post-test to measure the sustainability of any intervention effects. Products of the project will include evidence of the efficacy of the JAML intervention on the social communication of children with autism and the self-efficacy of their caregivers, along with published reports and presentations. Amount: $3,499,713 Period of Performance: 7/1/2012–6/30/2016
Award Number: R324A120174 Institution: Board of Trustees of the University of Illinois Principal Investigator: Brent McBride Description: Men’s Parenting Behaviors in Families of Children with Disabilities: Findings from the ECLS-B. Although a rapidly growing body of research has documented the impact of father involvement with typically developing children, little is known about how men approach parenting children with disabilities and how their involvement affects child, mother, and family well-being that support child cognitive and socio-emotional development and school readiness. The purpose of the project is to examine the data available in the Early Childhood Longitudinal Study—Birth Cohort (ECLS-B) to investigate the roles fathers play in families of children with disabilities. The project will analyze the ECLS-B to examine the structure, antecedents, and consequences of fathers’ involvement in families of children with disabilities. The research team will compare the underlying structures of paternal involvement of fathers of children with and without disabilities. Specifically, the researchers will address: (1) how the presence, timing, and severity of a child’s disability relate to the structure and levels of father involvement; (2) how the presence, timing, and severity of a child’s disability influence the trajectory of father involvement from 9 months to 4 years of age; (3) the antecedents (e.g., family processes, characteristics of the father and/or mother, characteristics of the child, maternal involvement, contextual sources of stress and support) of father involvement and whether these antecedents differ by the presence, timing, and severity of a child’s disability; and (4) the direct and indirect effects of father involvement on family process and maternal and child well-being in families of children with disabilities. Products from the study will include publications and presentations on research activities and findings that may serve as a basis for the development of educational interventions that promote father involvement and improve developmental outcomes for infants, toddlers, and preschoolers with disabilities. Findings will also offer
211

direct service providers information they can use to support families and, in particular, fathers of infants, toddlers, and preschoolers with disabilities. Amount: $357,513 Period of Performance: 7/1/2012–6/30/2014
Award Number: R324A120180 Institution: Regents of the University of California, Los Angeles Principal Investigator: Blair Paley Description: Promoting School Readiness in Preschool-Age Children with Fetal Alcohol Spectrum Disorders. Children with a history of prenatal alcohol exposure or Fetal Alcohol Spectrum Disorders exhibit early signs of developmental delays that are manifested in a host of neurocognitive, behavioral, and social problems throughout life, including major obstacles to success in school. These children show deficits in language comprehension, reading, spelling, and math; are at increased risk for learning disabilities and problematic classroom behaviors; and are likely to require special education services. The purpose of the project is to develop an intervention, Strategies to Enhance Early Developmental Success for School Readiness, that can be used with preschools to promote school readiness and positive school outcomes for children with Fetal Alcohol Spectrum Disorders. The proposed intervention will provide center-based, child-focused instruction intended to improve self-regulation, socio-emotional competence, and early literacy and numeracy skills. Additionally, this intervention will provide programs to equip parents with strategies for promoting school readiness skills at home and for collaborating with school personnel. Approximately 40 children ages 3 to 5 will participate in this research. The children will meet criteria for Fetal Alcohol Spectrum Disorders, Partial Fetal Alcohol Spectrum Disorders, or Alcohol-Related Neurodevelopmental Disorder. During the first phase of development, multiple stakeholders will provide input on the intervention components and an initial version of the intervention. During Phase 2, the research team will implement Strategies to Enhance Early Developmental Success for School Readiness in a pilot study with families. The team will modify the intervention based on findings from Phase 2 and implement the revised intervention in Phase 3. Another pilot study will determine whether children’s school readiness skills showed improvement after receiving the intervention. The research team will analyze data to determine whether Strategies to Enhance Early Developmental Success for School Readiness improves children’s self-regulation, socio-emotional competence, and early literacy and numeracy skills. The team will also analyze data to determine whether parents show increases in parental efficacy and knowledge about Fetal Alcohol Spectrum Disorders as well as decreases in parental stress. Products of the project will be a fully developed intervention, Strategies to Enhance Early Developmental Success for School Readiness, designed to improve the self-regulation, socio-emotional, and early literacy and numeracy skills of young children with Fetal Alcohol Spectrum Disorders and published reports describing its promise for improving outcomes. Amount: $1,497,115 Period of Performance: 3/01/2012–2/28/2015
Award Number: R324A120059 Institution: University of North Carolina at Chapel Hill Principal Investigator: Virginia Buysse Description: Recognition and Response: Addressing Early Learning Difficulties in Math through an RTI Model for Pre-K. Historically, little attention has been paid to teaching math prior to kindergarten entry. The National Research Council’s Committee on Early Childhood Mathematics concluded that while virtually all young children have the capability to learn and acquire core competencies in math, most do not realize their full potential. The Committee attributed this to children’s limited opportunities to learn math in either early childhood education programs or through every day experiences at home. This lack of instructional opportunities could be particularly problematic for children most at risk for math failure. These children start school behind their peers and may be unable to catch up without extensive, high-quality early math instruction. The purpose of this project is to adapt an instructional system, called
212

Recognition and Response, for preschool mathematics instruction. The model is intended to improve the quality of math practices for all children and provide additional supports for some children to ensure that every child is ready for kindergarten. Approximately 50 preschool classrooms will participate in the study. All classroom children will participate, but the researchers will focus on children most at risk for math failure. The Recognition and Response model has shown promise for improving language and literacy outcomes for preschool children. Researchers will modify the basic framework of the model—including screening and frequent monitoring of children’s progress, use of quality classroom instruction, and intensive interventions and problem solving across collaborative partners—with preschool math content. Development and revision of the intervention and assessment and professional development materials will occur in years 1 and 2. A pilot study investigating the promise of the system for improving math outcomes and for changing instructional practices will occur in year 3. Using a quasi-experimental design, the research team will match classrooms on classroom and teacher variables. Students in the comparison condition will receive math instruction as usual. Researchers will use a series of data analytic strategies, including multi-level modeling, to determine whether the Recognition and Response-Math system shows promise for improving mathematics outcomes. The researchers will also investigate whether differences in growth exist for intervention and comparison children most at risk for math failure or need for special education services. Products of the project will be a fully developed preschool system, called Recognition and Response-Math, to teach math to preschool children and published reports describing the intervention’s promise for improving outcomes. Amount: $1,500,000 Period of Performance: 3/01/2012–2/28/2015
Award Number: R324A120046 Institution: Pennsylvania State University Principal Investigator: Paul Morgan Description: Risk Factors and Services for Vocabulary Delays in Early Childhood: Population-based Estimates. Little is known about early precursors of academic and behavioral school readiness for children, particularly those with or at risk for disabilities. Evidence indicates that vocabulary knowledge constitutes a potentially malleable factor that, if increased, may improve children’s reading, mathematics, and behavioral readiness for kindergarten. Yet these relations have not been convincingly established. It is also critical to better understand the onset of vocabulary delays during at-risk children’s infant, toddler, and preschool years, and how these delays are affected by the receipt of early intervention services. The primary aim of this study is to determine whether and to what extent vocabulary knowledge, as well as parenting and child care quality and early intervention services, constitute potentially malleable and educationally relevant factors that may increase at-risk children’s reading, mathematical, and behavioral readiness for schooling. This study will also seek to identify moderators of the relation between earlier vocabulary knowledge and children’s school readiness. The researchers will analyze the Early Childhood Longitudinal Study-Birth Cohort (ECLS-B) to determine: (1) factors that most strongly predict children’s vocabulary knowledge at 24 months of age; (2) which children are most likely to receive early intervention or early childhood special education when they are 24–48 and 48–60 months of age; (3) which children are most likely to display vocabulary delays at 48 months of age; (4) factors that strongly predict children’s general cognitive and behavioral functioning at 24 months, as well as their pre-academic and behavioral functioning at 48 months of age; and (5) which children are most likely to display lower academic and/or behavioral readiness at 60 months of age. Products from the study will include publications and presentations on research activities and findings that may serve as a basis for developing interventions for infants, toddlers, and preschoolers at risk for disabilities. Amount: $699,658 Period of Performance: 3/1/2012–2/28/2014
213

Award Number: R324A120365 Institution: University of Kansas Center for Research, Inc. Principal Investigator: Jay Buzhardt Description: The Effects of Online Decision Making Support for Home Visitors Using an RTI Approach to Promote the Language Development of At-risk Infants and Toddlers. Children who lack key early language and literacy experiences prior to kindergarten face significant challenges learning to read. Because of impoverished early language experiences, many children are not adequately prepared to benefit from the reading instruction they receive when they reach school. Home visitation is a viable model for improving the home language experiences that are known to promote children’s growth in language and early communication. However, home visitors face challenges in promoting these outcomes, including how to identify children who are on a path toward language delay and how to provide the needed supports to parents/caregivers for changing that trajectory. The long-term goal of this research is to reduce the number of children who are not ready for school because of delays and disabilities in language and early communication skills that have antecedents prior to preschool. The aim of the project is to test the efficacy of a web-based intervention decision support system for home visitors, MOD: Making Online Decisions. This intervention identifies children at risk for early language delay in a Response to Intervention (RTI) approach and assists home visitors in the design, delivery, and maintenance of a parent-implemented intervention for promoting their child’s early language development. The researchers will conduct a waitlist randomized controlled trial to investigate the effects of the web-based MOD support system on home visitors’ intervention decision making and children’s communication outcomes. The researchers will randomly assign home visitors serving infants and toddlers at risk for language delay to one of two conditions. Condition A will consist of didactic training on data-based decision making, access to evidence-based language intervention, and use of the Early Communication Indicator (ECI) for progress monitoring. Condition B will include Condition A plus MOD decision-making support. The research team will recruit 80 home visitors and 160 children ages 6–34 months who are at risk for language delays. The team will assess children’s early communication skills before, during, and after the intervention to document intervention effectiveness. Products of the project will include evidence of the efficacy of MOD as a decision support system for implementing the RTI approach for early communication interventions with infants and toddlers in a home-visiting context, published reports, and presentations. Amount: $2,998,772 Period of Performance: 7/1/2012–6/30/2016
Mathematics and Science Education
Award Number: R324A120304 Institution: University of Oregon Principal Investigator: Ben Clarke Description: A Randomized Control Trial of a Tier 2 Kindergarten Mathematics Intervention. Students in the United States have demonstrated low levels of mathematics performance compared to national standards and the performance of students from other countries. Signs of potential low performance and risk for mathematics disabilities can appear early in students’ schooling. Without intervention in early elementary school, these difficulties are likely to persist over time and become more challenging to remediate. One approach to improving mathematics achievement is to deliver effective instructional programs to students at risk for mathematics disabilities as they enter kindergarten. Few experimental studies exist for evaluating the efficacy of mathematics programs used in kindergarten classrooms for students at risk for mathematics disabilities or future poor performance in mathematics. The purpose of the project is to test the efficacy of a fully developed mathematics intervention for kindergarteners, called ROOTS, aimed at improving the mathematics skills of students with or at risk for mathematics disabilities. The project will evaluate two versions of the ROOTS intervention to investigate the relationship between group size and student outcomes. The first version is considered to be a high-
214
intensity version with two students in each intervention group; the second version is considered to be a low-intensity version with five students in each intervention group. Researchers will evaluate the efficacy of ROOTS for improving mathematics outcomes for students with or at risk for mathematics disabilities. ROOTS is designed to be a supplemental mathematics intervention or a Tier 2 intervention in a Response to Intervention (RtI) model. Approximately 120 classes will be involved in the research. Within each class, researchers will identify 10 children with or at risk for mathematics disabilities through pre-intervention screening and randomly assigned them to a no-treatment control group, a high-intensity ROOTS group, or a low-intensity ROOTS group. Researchers will analyze data in a multi-level framework to provide evidence of the efficacy of the ROOTS intervention for improving student outcomes in mathematics. Outcomes of the research will include evidence of the ROOTS intervention for improving kindergarteners’ mathematics achievement, peer-reviewed publications, and presentations. Amount: $3,338,552 Period of Performance: 7/01/2012–6/30/2016
Award Number: R324A120364 Institution: University of Texas, Austin Principal Investigator: Diane Bryant Description: Project AIM: Algebra-readiness Intervention Modules for At-Risk Students. Success in algebra courses has been linked to greater success at the secondary and postsecondary levels and higher wage jobs. Algebra competence, however, is a particular concern for students with or at risk for mathematics disabilities. These students are participating in general education mathematics courses in growing numbers and facing curriculum standards and graduation requirements that demand mastery of algebra. These students continue to demonstrate poor mathematics achievement that is persistent and pervasive and lack the foundational mathematics skills critical to succeeding in algebra courses. The purpose of this project is to develop two sets of instructional modules, Algebra-readiness Intervention Modules, focusing on mathematics concepts and skills that are important for success in algebra. Researchers will develop one set of modules for use in grade 6 and one for grade 7. Both sets of modules will focus on rational numbers, ratio and proportional relationships, expressions and equations, and graphing. Researchers will tailor each module to grade-level content and standards. The modules are intended to be used as supplemental interventions in a tiered service delivery model for students with or at risk for mathematics disabilities. The researchers will conduct a series of studies to develop and assess the promise of the algebra modules. The first two years of the project will involve small learning trials and feasibility studies to assess student and teacher satisfaction and responsiveness to the modules and to refine the modules. The researchers will conduct pilot studies in each grade during the final year of the project. The studies will examine the potential promise of the individual modules and the complete set of modules for improving students’ mathematics outcomes. Products of the project will include a fully developed set of Algebra-readiness Intervention Modules, peer-reviewed publications, and presentations. Amount: $1,436,410 Period of Performance: 7/01/2012–6/30/2015
Award Number: R324A120115 Institution: University of Oregon Principal Investigator: Scott Baker Description: Promoting Algebra Readiness: Developing a Strategic Intervention on Rational Number Concepts (Project PAR). Algebra competence is of particular concern for secondary students with disabilities who are participating in general education mathematics courses in growing numbers and facing curriculum standards and graduation requirements that demand mastery of algebra. The purpose of the project is to develop the curriculum Promoting Algebra Readiness for sixth-grade students with or at risk for learning disabilities in mathematics. Researchers will design Promoting Algebra Readiness to include instructional features appropriate for this population, including optimal sequencing of lessons, pre-teaching prerequisite knowledge, and providing opportunities for practice. There are two major aims
215
of the project: (a) develop a 100-lesson algebra readiness intervention focusing on conceptual understanding and procedural fluency with rational numbers and equivalent representations for students at risk for math learning difficulties and disabilities and (b) assess the feasibility and the promise of intervention effectiveness. The project team will develop the 100-lesson algebra readiness intervention program through multiple “design experiments” that are iterative cycles of development, observation, analysis, and refinement. Two experts in instructional design and mathematics instruction will conduct an extensive content analysis to determine scope and sequence of the lessons, build instructional templates, and complete lesson sets for the implementation phase. The project team will then conduct small-scale implementation studies with teacher-researchers (teachers who are heavily involved in the research) to explore feasibility and potential efficacy. The team will conduct two feasibility studies with six sixth-grade teachers (with a revision phase in between) to determine teacher satisfaction with the intervention, delivery of lesson content, and student responsiveness. In the final year, the project team will conduct a pilot study in which all 100 lessons will be implemented by 12 teachers to determine if the intervention is operating as intended. Data collection in the treatment condition and matched comparison condition will include surveys and focus groups, direct observations, and proximal and distal outcome measures of student learning. The project will conclude with a final revision phase. Products of the project will include a fully developed Project Algebra Readiness intervention, a classroom observation system addressing fidelity of implementation, published reports, and presentations. Amount: $1,499,966 Period of Performance: 6/01/2012–5/31/2015
Professional Development for Teachers and Related Services Providers
Award Number: R324A120272 Institution: Ohio University Principal Investigator: Julie Owens Description: Development Strategies to Increase Teacher Integrity in a Daily Report Card Intervention for Children with or at-risk for ADHD. Research has shown that teacher-implemented interventions for students with Attention Deficit Hyperactivity Disorder (ADHD) have positive effects. However, given the many demands that teachers face, the extent to which teachers implement these interventions as recommended (i.e., with integrity) is variable and often declines in the absence of ongoing consultation with another professional. Limited use of these interventions is a significant problem and can compromise student outcomes. The solution is to understand the factors that influence teachers’ use of these interventions and to develop a consultation program that offers practice supports that adequately address teachers’ implementation needs. The goal of the study is to develop a multi-component consultation intervention that addresses the factors that facilitate high integrity (e.g., knowledge, skills, beliefs) to a daily report card (DRC) intervention, as well as tools for measuring these facilitators and intervention integrity (both adherence and competence). The study will use an iterative curriculum development process aimed at improving the feasibility and potential impact of the multi-component consultation intervention. During the pilot study in the final year of the project, researchers will recruit 60 teachers and 60 students with or at risk for ADHD in grades K-5 and randomly assign them to either the multi-component consultation condition or a consultation-as-usual condition. The researchers will collect student outcome data, conduct observations, and conduct interviews with teachers to evaluate the results of implementation. The researchers will revise the intervention through an iterative process of implementation, data collection, data analysis, and protocol enhancement. Products of the study will include a fully developed consultation program designed to facilitate high integrity to classroom interventions for students with or at risk for ADHD, tools for measuring intervention integrity, peer-reviewed publications, and presentations. Amount: $1,500,000 Period of Performance: 7/1/2012–6/30/2015
216

Award Number: R324A120277 Institution: University of Oregon Principal Investigator: Deanne Unruh Description: State Toolkit for Examining Post-School Success (STEPSS) Professional Development (PD) Project. State and national data show that youths with disabilities are less likely to attend postsecondary education or be employed than their peers without disabilities. As part of their federal reporting requirements, state education agencies (SEAs) collect transition-related student data that can be used to improve youth outcomes by targeting areas of need and identifying appropriate evidence-based practices. However, there is no standard practice for using these data. The purpose of this study is to develop and test a professional development intervention, STEPSS PD Project, which trains district data teams to use data-based decision making to develop, implement, and evaluate action plans that use evidence-based practices and predictors of post-school success to improve students’ secondary transition skills. Researchers will select approximately 20 school districts from each of the four partner states. In year 1 of the study, researchers will develop the PD modules and measures through use of a Design Team consisting of the research team, SEA and local education agency (LEA) personnel from each state, and an expert panel. During year 2, researchers will test and refine the STEPSS PD modules with four school districts. Finally, the pilot study will include 16 school districts selected into treatment or comparison groups. The researchers will collect teacher outcome data, review documents, and conduct interviews with teachers/district administrators to evaluate the results of implementation. The intervention will be revised through an iterative process of implementation, data collection, and data analysis. Products of the project will include a fully developed district-level PD intervention that trains districts’ data teams in using data-based decision making to select evidence-based practices and predictors of post-school success using an action research model, peer-reviewed publications, and presentations. Amount: $1,500,000 Period of Performance: 9/1/2012–8/31/2015
Reading, Writing, and Language Development
Award Number: R324A120173 Institution: Regents of the University of California Principal Investigator: Rollanda O’Connor Description: BRIDGES: Teaching Reading Through U.S. History. Finding time to provide intensive reading instruction for students with disabilities and poor readers is more difficult in secondary schools than in elementary schools. Reading instruction in middle school is often eliminated in favor of tutoring support for passing courses. Educators can be faced with weighing the importance of content acquisition over reading skills for improving academic outcomes for these struggling students. This project will develop an intervention to address this dilemma. The intervention will focus on teaching focused reading skills well and applying them directly to reading in the content area of U.S. History. Approximately 150 eighth-grade struggling readers will participate in this research. During years 1 and 2, researchers will test lesson components in three five-week cycles. The cycles will focus on developing students’ word analysis skills, vocabulary skills, use of graphic organizers, and strategies for improving skills for summarizing text and finding the main idea. The cycles will also include 25 minutes of reading history texts at and below grade level as well as 5 minutes of discussion. Researchers will revise the lesson components based on observations made by the research team and feedback from teachers implementing the lessons. In the third year, researchers will randomly assign classes to provide the intervention or provide instruction-as-usual to investigate whether the intervention has promise for improving both reading and history outcomes. The research team will analyze data to determine student growth on a variety of reading measures, including measures of word analysis skills, fluency, vocabulary, and comprehension and to compare outcomes for students who received the intervention and those who received typical instruction provided by the school. Products of the project will include a fully developed intervention to teach
217
reading and U.S. history content to students with reading disabilities and poor readers as well as published reports describing its promise for improving outcomes. Amount: $1,375,333 Period of Performance: 6/01/2012–5/31/2015
Award Number: R324A120085 Institution: University of Tennessee Principal Investigator: Kimberly Wolbers Description: Development of Strategic and Interactive Writing Instruction (SIWI) for Deaf and Hard of Hearing Students. Students who are deaf or hard of hearing have demonstrated little progress in literacy over the years. It is common for students who are deaf or hard of hearing to graduate high school writing and reading at an elementary level. Deaf or hard of hearing students may exhibit substantial difficulties with sentence-level writing skills, and their writing can have fewer words, more incomplete sentences, frequently omitted function words, and less complex structures compared to the writing of peers who are not deaf. In addition, these students may lack discourse-level skills to develop coherence in writing, incorporate text structure elements, and write in a planned and organized manner. The purpose of this project is to adapt an intervention that has shown promise for improving writing outcomes for deaf students in middle school for use with deaf students in grades 3 to 5. The intervention, Strategic and Interactive Writing Instruction, will address age-level writing objectives and be responsive to students with diverse language needs or additional disabilities. Students will be taught a series of strategies that follow processes of expert writers and model self-regulation procedures. Students will also work together with their teachers to co-construct text. Over time, teacher support will phase out so that students can become independent writers. During years 1 and 2, lesson components will be implemented and revised, and the researchers will create professional development videos and materials that demonstrate implementation of the intervention. The researchers will randomly assign classrooms to experimental or comparison groups in year 3 to assess the promise of the intervention. Products of the project will include a fully developed intervention to teach writing to students who are deaf or hard of hearing as well as published reports describing its promise for improving outcomes. Amount: $1,156,576 Period of Performance: 8/01/2012–7/30/2015
Award Number: R324A120123 Institution: Lehigh University Principal Investigator: Mary Beth Calhoon Description: Reading Achievement Multi-component Program (RAMP-UP). Many adolescents with reading disabilities read four to six years below grade level, score poorly on reading assessments, and show severe deficits in word recognition, reading fluency, and comprehension. Questions exist regarding the most effective way to provide remedial reading instruction for adolescents. Some researchers advocate for an instructional emphasis on phonological decoding, while others promote an emphasis on comprehension. This research team is conducting a randomized controlled trial designed to address these questions and explore the most effective and efficient means to develop reading skills of middle school students with reading disabilities. The team will examine the efficacy of two versions of a fully developed and empirically supported peer-mediated, multi-component remedial reading program that is designed specifically for adolescents with reading disabilities. Both versions address deficits in phonological decoding, spelling, fluency, and comprehension skills. However, they differ in the amount of allotted instructional time devoted to phonological decoding or comprehension. One intervention will devote more time to phonological decoding instruction while the other will devote more time to comprehension instruction. Approximately 720 sixth-graders with reading disabilities from 72 middle school classrooms in Pennsylvania will participate in this research. The team will determine the extent to which each version of the program leads to gains in reading outcomes for sixth-graders compared to each other and to a business-as-usual condition. The team will also examine the extent to which any observed differences
218

persist in seventh and eighth grades. Products of the project will be published reports on the efficacy of the two versions of the intervention for improving phonological decoding, spelling, fluency, and comprehension outcomes of middle school students with reading disabilities. Amount: $3,485,216 Period of Performance: 3/1/2012–2/29/2016
Award Number: R324A120103 Institution: Ohio State University Principal Investigator: Gwendolyn Cartledge Description: Reducing Special Education/Reading Risk for Urban Learners through an Oral Reading Fluency Intervention. According to the 2009 National Assessment of Educational Progress fourth-grade reading results, a large gap exists between reading performance of urban students with disabilities and their national counterparts. In many urban settings, the large teacher-student ratios increase the likelihood that students with the poorest reading skills will not get the needed instruction to become proficient readers. The research team is proposing to develop a computer-based intervention specifically designed for students with disabilities in urban areas. The intervention will provide needed individualized instruction, delivered through voice-activated computer software and designed for guiding students through reading passages, modeling, and correcting oral reading as needed. The intervention is designed to increase the students’ oral reading fluency, and it will include culturally relevant passages that reflect the interests and backgrounds of students from urban settings. Years 1 and 2 will be devoted to product development, with the staff creating and integrating the culturally responsive paragraphs and software. The software will recognize and synthesize speech, and it will be designed to provide an instructional sequence that prompts readers through a story, administer pre- and post-lesson assessments, and provide prompts about the lessons. The research team will refine the intervention and conduct a pilot study during year 3. The team will use a multiple baseline design to determine whether the intervention improves students’ oral reading fluency and overall reading skills. The team will use visual analysis to determine a functional relationship between the intervention and improved fluency and reading outcomes. Products of the project will include a fully developed intervention to teach oral reading fluency to first- and second-graders who live in urban settings and have or are at risk for reading disabilities and published reports describing its promise for improving outcomes. Amount: $1,394,851 Period of Performance: 7/01/2012–6/30/2015
Social and Behavioral Outcomes to Support Learning
Award Number: R324A120405 Institution: Johns Hopkins University Principal Investigator: Golda Ginsburg Description: A Modular CBT for Reducing Anxiety and Improving Educational Outcomes. Anxiety disorders are the most common childhood psychiatric conditions and are known to severely impair children’s academic, social, and behavioral functioning in school. Approximately 11-15 percent of youths receiving special education services (generally under the category of emotional disturbance) and 10-20 percent of youths at risk for special education have excessive anxiety requiring treatment. Despite the growing efficacy of cognitive-behavioral treatment for anxiety, the intervention is not widely used in schools. The primary purpose of this research is to evaluate the efficacy of a modular cognitive-behavioral intervention (M-CBT), compared to usual care (UC), on reducing excessive anxiety and improving student academic, social, and behavioral performance in school. The researchers will conduct a randomized efficacy trial of M-CBT in urban schools, delivered by school-based clinicians. The study uses a 2 (intervention: M-CBT versus UC) x 4 (assessment period: pre-treatment, 12 weeks post- treatment, three-month follow up, and natural termination) randomized controlled design with 368 anxious youths, 7–17 years of age, and 46 school-based clinicians. Primary outcomes will include child,
219
parent, and teacher ratings of anxiety and measures of academic performance. The research team will closely monitor treatment integrity (i.e., adherence, competence, and differentiation) via audiotaped therapy sessions. Using exploratory analyses, the team will examine predictors, moderators, and mediators of intervention response. In addition, the research team will examine the cost-effectiveness of the intervention. Products of the project will include evidence of the efficacy of M-CBT for youths ages 7–17 with or at risk for disabilities, peer-reviewed publications, and presentations. Amount: $3,255,147 Period of Performance: 7/1/2012–6/30/2016
Award Number: R324A120344 Institution: University of Kansas Center for Research, Inc. Principal Investigator: Howard Wills Description: A Multi-Site Efficacy Trial of the Class-wide Function-related Intervention Teams “CW-FIT”: A Research to Practice Agency for Students With and At Risk for EBD. Research suggests that 3-6 percent of school-age children have emotional and behavioral disorders (EBD), yet these students are typically not identified until they have exhibited serious problems, including school failure, over multiple school years. There is a need for evidence-based interventions that prevent and ameliorate severe problem behavior exhibited by school-age children. Behavioral interventions based on an understanding of “why” a student displays problem behavior (i.e., the function or cause) have shown promising results for addressing a wide range of problem behaviors. One such intervention with evidence of efficacy is the CW-FIT, which is designed to teach appropriate behavior skills (e.g., how to appropriately gain the teacher’s attention) and reinforce the use of those skills through a game format. The intervention package also includes individual intervention procedures for students who do not successfully respond to the class-wide intervention. CW-FIT has prior evidence of efficacy to improve class-wide on-task behavior and decrease disruptive behaviors of students with or at risk for EBD. This study intends to replicate prior findings with a larger, more diverse population across three geographical areas. In addition, the implementation will better represent typical conditions of routine practice with school staff providing the majority of the supervision, compared to the first efficacy trial which included coaches supported with grant funds. The study will examine the impact of the intervention on outcomes measured at the teacher, class, and individual student levels for students diagnosed with or at risk for EBD in general and special education settings. The researchers will conduct a multi-site randomized efficacy trial of the CW-FIT intervention in three states, with school staff providing the majority of the supervision to closely resemble typical conditions of routine practice. The researchers will monitor fidelity of implementation. The team will also measure outcomes at the class level (increases in on-task behaviors and teacher praise) and student level (increases in on-task behavior and decreases in disruptions) for students at risk for EBD and students who received Tier 2 interventions (i.e., self-management, help cards) in addition to the CW-FIT intervention. The team will also measure peer performance for typical peers for a sample at each site. Products of the project will include evidence of the efficacy of CW-FIT for elementary school students, including students with or at risk for EBD, peer-reviewed publications, and presentations. Amount: $2,916,059 Period of Performance: 7/1/2012–6/30/2016
Award Number: R324A120169 Institution: Florida International University Principal Investigator: William Pelham Description: A Summer Preparatory Program for Middle and High School Students with ADHD. Adolescents with Attention Deficit Hyperactivity Disorder (ADHD) are at high risk for academic failure and school dropout. Middle and high school students with ADHD experience substantially more academic impairment than their peers, with an estimated one-third of students with ADHD ultimately dropping out of high school. Core symptoms of ADHD include disorganization and inattention, which make learning and retaining academic information difficult. Research has shown that students with
220
ADHD have difficulty transitioning to less structured academic environments (e.g., the transition from elementary school to middle school and the transition from middle to high school). The middle and high school environments require increased student self-reliance, where students are required to keep track of their own schedules and school materials, turn in assignments with minimal prompts, remember page numbers and worksheets that are given across the day by multiple teachers, and plan for long-term projects. These environments are challenging for adolescents with ADHD. To address these challenges, summer intervention programs in which at-risk students are identified and recruited into summer programs that offer academic instruction, social support, and school orientation activities have been implemented with success for children. However, relatively few such programs are available for adolescents. The Summer Preparatory Program (SPP) teaches academic skills and skills to improve psychosocial functioning. The SPP has demonstrated feasibility of implementation as well as promise for improving student outcomes, but the efficacy of the intervention has not yet been tested. The research team will recruit and randomly assign incoming sixth- and ninth-graders to either the intervention condition or typical school services. Students assigned to the SPP intervention will participate in an eight-week intensive summer program consisting of a series of rotating modules in the areas of academic skills and psychosocial functioning. Parents will receive weekly group parent training sessions. Researchers will use multiple measures to assess student behavioral and academic outcomes. Researchers will also examine factors that moderate or mediate the impact of the intervention on student outcomes. Products of the project will include evidence of the efficacy of the SPP intervention, published reports, and presentations. Amount: $3,478,637 Period of Performance: 3/1/2012–02/28/2016
Award Number: R324A120331 Institution: Pennsylvania State University Principal Investigator: Paul Morgan Description: ADHD: Population-Based Estimates of Diagnosis, Treatments, and School Outcomes. Attention Deficit Hyperactivity Disorder (ADHD) is the most commonly diagnosed mental health disorder in school-aged children. Students with ADHD often engage in off-task and disruptive behaviors that reduce classroom engagement and, consequently, student learning. Students with ADHD are more likely to drop out of school, obtain a lower level diploma, display low academic achievement, and fail to obtain a postsecondary education. Identifying malleable and educationally relevant factors that decrease the impact of ADHD over time—particularly on student learning—is important. The purpose of this study is to use data from the Early Childhood Longitudinal Study-Kindergarten Cohort (ECLS-K) to examine the following research questions: (1) What are the age- and grade-specific patterns of ADHD diagnosis among U.S. students in grades 1-8? (2) Which population subgroups of students are more and less likely to receive a diagnosis and to experience different patterns of ADHD over time? (3) Among students diagnosed with ADHD, which are more and less likely to receive treatment for this condition? (4) Is medication, special education and related services, grade retention, therapy, or combinations of these treatments effective in increasing behavioral, socio-emotional, and academic functioning of students diagnosed with ADHD, and which treatments are most effective for which students? ECLS-K researchers assessed a nationally representative sample of students entering kindergarten in the United States in fall of 1998 in fall and spring kindergarten; fall and spring first grade; and each spring third, fifth, and eighth grade. The researchers of this project plan four sets of analyses on this dataset. First, the team will calculate ADHD diagnosis prevalence in grades 1, 3, 5, and 8; determine who is more and less likely to receive a diagnosis of ADHD; and determine who experiences different patterns of diagnosis of ADHD over time (e.g., those receiving early or late diagnosis). Second, the researchers will analyze the relations among student, family, school, and neighborhood characteristics and rates of ADHD diagnosis. Third, the team will create variables indicating whether students received various interventions for ADHD (i.e., special education or related services, grade retention, medication, therapy) in grades 1, 3, 5, and 8 to determine which students are more and less likely to receive services and which students are more and
221
less likely to receive particular combinations of these treatments. Fourth, the research team will examine the relationship between the receipt of treatment(s) and behavioral, socio-emotional, and academic functioning in fifth and eighth grade. Products of the study will include publications and presentations on research activities and findings that may serve as a basis for developing interventions for elementary students with ADHD. Amount: $694,704 Period of Performance: 7/1/2012–6/30/2014
Award Number: R324A120136 Institution: Florida International University Principal Investigator: Paulo Graziano Description: Development of a Kindergarten Transitional Program for Preschool Students Identified as Being at High Risk for Behavioral Disorders. Research has highlighted the strong association between school readiness and successful school outcomes for children who are at risk for behavioral disorders. Children’s early externalizing behavior problems, including aggression, defiance, inattention, hyperactivity, and impulsivity, have significant implications for children’s school readiness and subsequent transitions into the early school years. In addition, children’s self-regulation skills (ability to control behavior, attention, and emotions for the purpose of learning) on entrance to kindergarten are strongly related to later school success across academic and social domains. Research has shown that a significant portion of preschoolers do not possess adequate self-regulation skills necessary for a successful transition to kindergarten. Intervening prior to the start of kindergarten is particularly important given that these behavioral problems are moderately stable and predictive of later academic deficits and more serious kinds of externalizing and internalizing disorders in later childhood and adolescence. The research team will develop and evaluate the promise of a Kindergarten Transitional Program (KTP) beginning in the summer before the start of kindergarten. The program will be aimed at facilitating the transition of preschoolers with at-risk behavior problems into the kindergarten setting. The research team will conduct the project in three phases. Phase 1 will consist of treatment development activities that will include initial manual and materials development plus consumer focus groups. Phase 2 will involve the initial testing of the intervention components of the KTP to ascertain their feasibility. Phase 3 will entail a pilot study to test the promise of the program for students’ self-regulation skills, students’ pre-academic skills, and their parents’ school involvement and parenting skills. Products of the project will include a fully developed version of the KTP intervention, data on the feasibility of the use of the intervention with preschool students, and evidence of the potential impact of the intervention on student school readiness skills (including self-regulation skills and pre-academic skills) and their parents’ school involvement and parenting skills. There will also be published reports and presentations on the project. Amount: $1,497,831 Period of Performance: 7/1/2012–6/30/2015
Award Number: R324A120358 Institution: University of California, San Francisco Principal Investigator: Linda Pfiffner Description: Efficacy of the Collaborative Life Skills Program. Attention Deficit Hyperactivity Disorder (ADHD) is a serious condition defined by inattention and/or impulsivity and hyperactivity, and it is associated with significant academic and social impairment. It is estimated that 3 to 7 percent of students in the elementary grades meet criteria for a diagnosis of ADHD, but there is a lack of effective, potent, and sustainable school-based interventions to mitigate ADHD and to support optimal learning and social outcomes. To address this need, the research team developed the Collaborative Life Skills program (CLS) through funding from the Institute of Education Sciences. CLS is a collaborative school-home behavioral intervention for ADHD consisting of an integrated delivery of child social and life skills training, parent training, and teacher consultation. CLS has demonstrated feasibility of implementation in elementary schools as well as promise for preventing and ameliorating problem behaviors in children with or at risk
222
for ADHD, but the efficacy of the intervention has not yet been tested. The purpose of this study is to conduct a randomized efficacy trial to evaluate the effects of CLS on behavioral and academic outcomes for students with symptoms of ADHD. The research team will evaluate CLS. The 12-week CLS program consists of teacher consultation (including use of daily report cards), parent training, and child social and life skills training. Approximately 168 elementary school students in grades 2-5 exhibiting ADHD-related problems and approximately 24 district mental health professionals (Learning Support Professionals or LSPs, one per school) will participate. The research team will randomly assign schools/LSPs to either the CLS program or typical school services. The team will use multiple measures to assess student behavioral and academic outcomes. Researchers will also examine factors that may moderate or mediate the impact of the intervention on student outcomes. Products of the project will include evidence of the efficacy of CLS with elementary school students with or at risk for ADHD, peer-reviewed publications, and presentations. Amount: $3,386,497 Period of Performance: 7/1/2012–6/30/2016
Award Number: R324A120027 Institution: University of Missouri Principal Investigator: Janine Stichter Description: Evaluating the Efficacy of the School-based Social Competence Intervention for Adolescents (SCI-A) with High Functioning Autism. Youths with high-functioning autism spectrum disorders (ASD) exhibit social skills deficits that inhibit their ability to navigate complex social environments. For example, students with ASD are often unable to pick up nonverbal social cues and social prompts and tend to display socially unacceptable behavior. Students are described as socially awkward, self-centered, or emotionally blunted. This interferes not only with their ability to succeed in school but also with their successful transition to adulthood (e.g., employment). Research on existing social skills programs has been somewhat mixed but, in general, concludes that interventions delivered in more natural contexts and environments are associated with stronger maintenance and generalization of social skills. The research team developed the Social Competence Intervention for Adolescents (SCI-A), a cognitive-behavior intervention approach that targets skills designed to promote self-monitoring and self-evaluation (e.g., recognizing feelings and emotions of self and others). The intervention is also designed to provide effective scaffolded instruction, building on each skill, with maintenance of learned skills reinforced throughout by the use of repetition, integration, and feedback as new skills are added. SCI-A has demonstrated feasibility of implementation as well as promise for improving student outcomes, but the efficacy of the intervention has not yet been tested. The SCI-A intervention comprises five units, each consisting of six 45-minute lessons, delivered via small groups of four to six students per group. The units include: facial expressions, sharing ideas, turn-taking, recognizing feelings/emotions, and problem solving. The lessons also include opportunities for students to practice skills in structured and naturalistic activities. The research team will recruit and randomly assign middle schools in a suburban setting to either the intervention condition or typical school services. The team will use multiple measures to assess student behavioral and academic outcomes. Researchers will also examine factors that moderate or mediate the impact of the intervention on student outcomes. Products of the project will include evidence of the efficacy of the SCI-A intervention, published reports, and presentations. Amount: $2,896,933 Period of Performance: 3/1/2012–2/28/2016
223

Award Number: R324A120278 Institution: University of Oregon Principal Investigator: Kent McIntosh Description: Identifying Factors Predicting Implementation and Sustainability of School-wide Positive Behavioral Interventions and Supports. Although many effective interventions are adopted in today’s schools, they are rarely sustained beyond a year or two once external support (e.g., grant funding, university-based training) is removed. The existing literature on sustainability of practices in schools is primarily anecdotal and not based on empirical research. Accordingly, school personnel are left without guidance on how to implement sustainable practices. Because so little attention has been devoted to the rigorous study of implementation and sustainability, new empirical research is needed to understand the best ways to promote implementation and sustainability of effective interventions. The purpose of this study is to identify malleable factors that enhance or inhibit the implementation and sustainability of school-wide social-emotional and behavior support practices. The research will focus on School-wide Positive Behavioral Interventions and Supports (PBIS) because PBIS has been widely adopted in the United States, many schools have sustained its use, and PBIS relies on validated fidelity of implementation measures that can be used to document sustained implementation. In partnership with five existing state PBIS implementation networks, the research team proposes a line of research using primary and secondary data analysis to predict implementation and sustainability of school-wide behavior support practices. The project will occur in three phases. Phase I will involve validating a model of sustainable implementation of school-wide interventions as it applies to PBIS by testing the factor structure of a measure of contextual variables related to implementation and sustainability. The researchers will use the data in a longitudinal analysis in Phase III. Phase II will include secondary data analysis of PBIS fidelity of implementation data. Analyses will identify critical school demographic variables and school team actions that predict initial and sustained implementation. Phase III will use a longitudinal design to examine predictors of implementation and sustainability for schools at three key points of implementation (initial implementation, 3 years of implementation, and 5 years of implementation). Products of the study will include publications and presentations on research activities and findings that may serve as a basis for developing interventions for schools to implement and sustain effective interventions. Amount: $1,425,209 Period of Performance: 7/1/2012–6/30/2016
Institution: South Carolina Research Foundation Principal Investigator: Kate Flory Description: Mediators of Social Impairment among Children with ADHD. Children with Attention Deficit Hyperactivity Disorder (ADHD) typically exhibit behaviors such as inattention, hyperactivity, and impulsivity. However, children with ADHD also typically suffer from social problems. These problems are so pervasive and persistent that some have argued that social impairment should be considered a cardinal feature of ADHD. Further, there is substantial evidence that social impairment can compromise academic success, although the specific nature of this relation is not well understood. Significant efforts have been directed toward developing and testing social skills treatment programs. However, with very few exceptions, these programs do not improve outcomes for students. One explanation for this limited success is that these interventions have been developed without a sufficient understanding of the underlying mechanisms that account for the social impairment experienced by children with ADHD. Although not specific to children with ADHD, research has established a model of mediators of social functioning that includes social cognition, social performance, and self-control deficits. These three mediators correspond to many of the hypothesized deficits of children with ADHD that may contribute to their social impairment. However, no research has evaluated a full mediation model that examines the relation between ADHD symptoms and social impairment. Therefore, in this project, researchers will study the role of these potential mediators (social cognition, social performance, and self-control deficits) in the social and academic functioning of children with ADHD. Researchers will collect data to determine
224
the role of social cognition, social performance, and self-control deficits on the social and academic functioning of children 8-10 years old with varying degrees of ADHD symptomology. Children will participate in individual and group data collection sessions. Each child and his/her parent will attend a 2-3 hour individual session during which researchers will administer diagnostic, social cognition, and self-control measures. In addition, each child will participate in a 3-hour Saturday social group session with nine other children during which researchers will collect social performance and sociometric status measures. Researchers will use structural equation modeling to examine the factors that account for the relation between ADHD and social functioning and how the hypothesized mediators and social functioning may affect the academic functioning of children with ADHD. Products of the project will include data clarifying the relation between social problems and academic functioning for students with ADHD. In addition, results from this study will inform the intervention development process to maximize impact on the mediators that are most strongly associated with social impairment among children with ADHD. Amount: $1,530,974 Period of Performance: 3/1/2012–2/28/2015
Award Number: R324A120041 Institution: University of Oregon Principal Investigator: Robert Horner Description: Team-Initiated Problem Solving for Improved Student Outcomes. Schoolwide Positive Behavior Support (SWPBS) is a frequently used systems-level intervention that involves school teams to actively engage in assessment, decision-making, and implementation of behavior supports. Problem solving is an ongoing activity school teams use during which they identify problems and develop solutions. Improvement in the academic and behavioral outcomes of schools’ students will require both appropriate data management systems and practical procedures for using data in daily problem solving. The Direct Observation Recording and Analysis tool is a direct observation measure of a school team’s problem-solving processes. Team-Initiated Problem Solving (TIPS) is a training and coaching model for teaching school teams to use behavioral and academic progress-monitoring data to define and solve problems. TIPS has demonstrated feasibility of implementation by school teams as well as promise for improving student outcomes, but the efficacy of the intervention has not yet been tested. The purpose of this efficacy grant is to determine the extent to which TIPS procedures change how school teams identify problems and build solutions, the extent to which the faculty in a school implements those solutions, and the resulting impact on student academic and behavioral outcomes. In Phase I of the research, SWPBS elementary school teams will participate in activities to validate and improve the Plan Implementation Measure, which is a measure for assessing the level with which school faculty implement team solutions. During Phase II of the research, researchers will recruit and randomly assign elementary school teams to either the immediate TIPS intervention condition or wait-list control condition. The researchers will use multiple measures to assess student behavioral and academic outcomes. Researchers will also examine factors that mediate and moderate the effects of TIPS on student outcomes. Phase III of the research will involve revising TIPS training materials for use by state and district trainers. Products of the project will include evidence of the efficacy of the TIPS intervention, published reports, and presentations. Amount: $2,523,998 Period of Performance: 3/1/2012–2/29/2016
225
Special Education Policy, Finance, and Systems
Award Number: R324A120110 Institution: American Institutes for Research Principal Investigator: Louis Danielson Description: Enhancing Accessibility for Students with Disabilities in Large-Scale Reading Assessments. Students with reading and language disabilities make up the largest group of students with disabilities. The majority of these students will participate in their state assessment with or without accommodations. Very little is known about the effects of these accommodations on standardized test scores, yet states continue to allow different accommodations for their state assessment. The purpose of this study is to identify a set of valid accommodations that educators could provide to students with word-reading disabilities as a means of demonstrating their skills on standardized reading comprehension assessments. Teachers will identify students who will be assessed for eligibility with a standardized reading assessment. The study will consist of two phases. Phase I will include 360 students with and without reading disabilities who will complete the Ohio Assessment Test (OAT) without accommodations and with pacing assistance. Pacing assistance consists of guiding the student’s timing through the reading passage and answering the questions. In phase II, 500 students with and without reading disabilities will complete the OAT under four different conditions. The four different conditions include: (1) no pacing assistance; (2) question stems and answer options read aloud plus pacing assistance; (3) question stems, answer options, and proper nouns read aloud plus pacing assistance; and (4) full passage read aloud plus pacing assistance. Products of the study will include practitioner-oriented documents intended to be used by state testing personnel, peer-reviewed publications, and presentations. Amount: $1,198,919 Period of Performance: 9/01/2012–8/31/2015
Award Number: R324A120081 Institution: University of Illinois Principal Investigator: James Shriner Description: Implementing the Common Core State Standards for Students with Disabilities: Research and Development of Web-based Supports for IEP Team Decision. Students with disabilities who receive special education services through the Individuals with Disabilities Education Act have an individualized education program (IEP). Schools are turning toward the new Common Core Standards and using the standards as the basis for developing IEPs and providing instruction for students with disabilities. In this project, the research team will further develop a tutorial program, IEPQ-Core, to assist IEP teams in writing measurable annual goals linked to these new standards. The research team will develop and refine the IEPQ-Core to be used by IEP teams in writing quality IEPs. The study will include construction and testing of four intervention components: (1) integration of the Common Core Standards, (2) content modules for social/emotional/behavioral goals and related services needs, (3) content modules for formative assessment by teachers of high priority IEP annual goals, and (4) online training videos and user guidance for the IEPQ-Core Tutorial website. Products of the study will include a fully developed IEPQ-Core, IEPQ-Core Tutorial, training modules and manuals, publications, and presentations. Amount: $1,478,443 Period of Performance: 7/01/2012–6/30/2015
Award Number: R324A120212 Institution: University of Wisconsin, Madison Principal Investigator: Thomas Kratochwill Description: Systems-level Analysis of Evidence-based Intervention Implementation by Problem-Solving Teams. Research indicates that schools rarely implement evidence-based practices for students exhibiting behavioral problems or disorders. In many cases, implementation of evidence-based practices may require a system-level change to improve their adoption and use as well as improve support and commitment
226

from all school personnel. The purpose of this project is to develop and evaluate an intervention protocol that adopts the principles of applied behavior analysis and applies them to an organization or system. The intervention protocol will help school problem-solving teams improve evidence-based practice selection and implementation and, ultimately, address the needs of students with behavior problems or disorders. Approximately 14 problem-solving teams and students with behavior problems/disorders in kindergarten through fifth grade will participate in the research project. The development of the intervention protocol will occur in three phases: (1) developing and revising protocol materials and assessments, (2) gathering information on reasons for low levels of implementation of evidence-based practices, and (3) determining the promise of the protocol for improving adoption and implementation of evidence-based practices and student behavior outcomes using single-case research design. Products of the project will include a fully developed intervention protocol designed to increase problem-solving teams’ adoption and implementation of evidence-based practices targeted to students with disruptive behavior problems and disorders, peer-reviewed publications, and presentations. Amount: $1,282,607 Period of Performance: 8/1/2012–7/31/2015
Award Number: R324A120224 Institution: Educational Testing Service Principal Investigator: Heather Buzick Description: Validating the Use of Growth Measures from Statewide Standards-Based Summative Assessments for Students with Disabilities. There has been a national push to use growth modeling with scores from statewide standards-based summative assessments to evaluate schools, teachers, and student subgroups. However, for students with disabilities, there has been little research exploring the use of growth modeling for this subpopulation to determine if interpretations about schools, teachers, and the academic progress of the subgroup are valid. The purpose of this study is to provide validity evidence for the use of test scores from students with disabilities on statewide standards-based summative assessments for the purposes of growth modeling and other growth-based models for accountability. Researchers will obtain five states’ datasets with students’ results on the statewide standards-based assessment for three years. The number of students with disabilities in each grade between grades 3 and 8 will range from approximately 1,500 to 18,000 across states. Researchers will compare the results of different growth-based models for accountability by grade, content, and number of years of test results and will explore the role of testing accommodations in measuring growth. Products of the project will include recommendations on growth modeling and longitudinal data collection for students with disabilities taking statewide summative assessments, peer-reviewed publications, and presentations. Amount: $300,089 Period of Performance: 7/1/2012–6/30/2014
Technology for Special Education
Award Number: R324A120006 Institution: University of Arizona Principal Investigator: Carole Beal Description: AnimalWatch-VI Suite: A Comprehensive Program to Increase Access to Mathematics for Students with Visual Impairments. The impact of visual impairment is widely recognized to be particularly significant for mathematics learning as vision provides important access to information that supports the development of conceptual understanding in mathematics. Students with visual impairments consistently lack access to the mathematics curriculum and, therefore, show substantially lower achievement in mathematics and reduced participation in science, technology, engineering, and mathematics fields. Helping students with visual impairments master core algebra readiness mathematics skills, such as basic computation, fractions, and pre-algebra, will position them to succeed in high school and beyond. The goal of this project is to develop Animal Suite-VI, a set of 14 web-delivered, accessible
227

instructional modules covering computation, fractions, and variables and expressions for students with visual impairments in middle school and high school. Each module will include word problems and instructional scaffolding accessible via self-voicing software, accompanied by braille and tactile graphics. During the first year of the project, the research team will modify the existing Animal Suite to form the prototype of the intervention targeted for students with visual impairments. The team will conduct usability testing across multiple sites with data collected from students during this phase guiding revisions to the program. During the second year, the research team will implement the intervention in classrooms with teachers and students across multiple sites to assess feasibility and usability. Data collected during this phase will inform the second round of revisions to the intervention. The final year of the study will involve a multiple baseline single-case design study to assess the promise of the program for improving student outcomes in mathematics. Products of the project will include the Animal Suite-VI web modules and publications and presentations on study progress. Amount: $1,204,061 Period of Performance: 3/01/2012–2/28/2015
Award Number: R324A120071 Institution: University of Oregon Principal Investigator: Hank Fien Description: Development of a Game-based Integrated Learning and Assessment System to Target Whole Number Concepts (Project NumberShire). Students who perform poorly in mathematics in the early elementary grades are likely to continue to perform poorly in mathematics in later grades. A successful start in mathematics is critical to later mathematics achievement. The purpose of this project is to develop NumberShire-K, a browser-based, educational video game in which first-grade students learn and apply the mathematical concepts and skills of whole numbers. NumberShire-K will include research-based instructional components that are beneficial to students with or at risk for math disabilities (MD). There are two major aims of the project: (a) to develop a fully operational education intervention targeting whole number concepts, which uses gaming technology for students with or at risk for MD for use in a tiered service delivery model and (b) to assess the feasibility and the promise of intervention effectiveness. The project team will develop the NumberShire-K intervention through multiple “design experiments,” which are iterative cycles of development, observation, analysis, and refinement. The development team will develop a tabletop prototype first, collect feasibility and usability data from four teachers on the prototype, revise the prototype, and then develop the NumberShire-K prototype. The team will test the prototype for feasibility and usability with six teachers before being revising it to produce the full-featured NumberShire-K intervention and implement and revise the full-featured program in preparation for a pilot study with 12 teachers in the final year of the project. Data collection in the treatment condition and matched comparison condition will include surveys and focus groups, direct observations, and proximal and distal outcome measures of student learning. The project concludes with a final revision phase. Products of the project will include a fully developed NumberShire-K intervention, published reports, and presentations. Amount: $1,499,535 Period of Performance: 7/01/2012–6/30/2015
Transition Outcomes for Secondary Students With Disabilities
Award Number: R324A120087 Institution: University of Oregon Principal Investigator: Bonnie Doren Description: Examining Malleable Factors Associated with School and Post-School Outcomes of Economically Disadvantaged Youth with Disabilities: A Secondary Analysis of Data from the National Longitudinal Transition Study (NLTS2). Living in poverty during childhood can be predictive of lower school performance and increased likelihood of dropping out of school. Students with disabilities are
228

twice as likely to be living in poverty as students without disabilities. However, little empirical research has explored the relationship between poverty and school/post-school outcomes focusing on students with disabilities. The research team will use extant data from the NLTS2 to investigate whether there are malleable individual, family, and school-based characteristics that act as risk or protective factors, mediating or moderating the effects of poverty on school performance and life outcomes of students with disabilities. The research activities will accomplish three aims. First, the research team will investigate the relative salience and cumulative effects of poverty-related risk factors on key school and post-school outcomes among adolescents with disabilities. Second, the team will identify malleable individual, family, and school-based risk factors that mediate the relationship between poverty and key outcomes. Finally, the team will identify malleable individual, family, and school-based protective factors that moderate the outcomes associated with exposure to poverty. Products of the project will include published reports and presentations on the results of all analyses. Amount: $688,422 Period of Performance: 7/01/2012–6/30/2014
Award Number: R324A120188 Institution: SRI International Principal Investigator: Lynn Newman Description: Factors Associated with High School and Post-High School Outcomes for Deaf and Hard-of-Hearing Students (Secondary Analysis of NLTS2 Data). Identifying promising programs, policies, and interventions that can improve outcomes for deaf and hard-of-hearing students during and after high school remains a challenge for researchers and practitioners. Practitioners, policymakers, and researchers would benefit from an improved understanding of the kinds of instructional programs and settings, learning supports, supplemental and related services, and accommodations that can improve the high school and post-high school outcomes of deaf and hard-of-hearing students. The purpose of this project is to use a national longitudinal dataset of students with disabilities to identify school-based interventions that are associated with academic, social/behavioral, vocational, and functional outcomes experienced by deaf or hard-of-hearing students during and after high school. The researchers will conduct secondary analyses of the National Longitudinal Transition Study-2 (NLTS2) dataset to explore relationships between school-based interventions (e.g., inclusion, course taking, modifications and accommodations, tutoring, technology aids) and outcomes (e.g., achievement, graduation, postsecondary enrollment, employment) for students who are deaf or hard of hearing. Products of the project will include preliminary evidence of relationships between school interventions and high school and post-school outcomes of deaf and hard-of-hearing students, peer-reviewed publications, and presentations. Amount: $692,810 Period of Performance: 7/1/2012–6/30/2014
Award Number: R324A120260 Institution: University of Nebraska-Lincoln Principal Investigator: Alexandra Torkelson-Trout Description: On the Way Home: Promoting Transition Outcomes in Youth with EBD or LD—An Efficacy and Replication Study. For the nearly half-million children and youths served in out-of-home care, reintegrating into the home and school settings following out-of-home placements presents many challenges. These challenges are even greater for the estimated 30 to 85 percent who are also diagnosed with a disability. Coupled with the risks common to this population (e.g., poverty, psychological distress, limited parent involvement and educational support), it is no surprise that the problems faced by these youths during the transition are considerable and too often result in school dropout, academic failure, and reentry into out-of-home care. This project will investigate the efficacy of On the Way Home, an aftercare program for youths with emotional and behavioral disorders (EBD) or learning disabilities (LD) who transition into the home, school, and community settings following a stay in out-of-home care. This project has three primary aims. First, the research team will test the effects of On the Way Home on parent
229

self-efficacy and empowerment and on the school success of transitioning students with EBD or LD. Second, the team will test the effects of On the Way Home on school and placement stability and the academic and behavioral functioning of students with EBD or LD. The team will examine possible mediators of these effects, including intervention-induced changes in parent self-efficacy and empowerment, student school success, and therapeutic alliance. Third, the team will assess the impact of participant characteristics and implementation of the On the Way Home intervention on the proximal (i.e., post-test) and distal (i.e., 9-month follow-up) outcomes of students with EBD or LD and their parents or caregivers. Participants will include 210 middle and high school adolescents with EBD or LD transitioning from out-of-home care placements and reintegrating into the local home and community school settings. The On the Way Home intervention is a fully developed 12-month aftercare program designed to improve the transition outcomes of youths with EBD or LD through the targeting of the settings, supports, and people most influential to the reintegration process. The research team will randomly assign participants to traditional transition supports or the On the Way Home services and analyze data to estimate the effects of On the Way Home on measures of academic functioning, school behaviors, family functioning, model adherence, and therapeutic alliance. Products of the project will include evidence of the efficacy of the On the Way Home intervention for students transitioning from out-of-home care placement back into the community, peer-reviewed publications, and presentations. Amount: $3,487,223 Period of Performance: 7/1/2012–6/30/2016
Special Education Research and Development Centers
Award Number: R324C120006 Institution: University of North Carolina at Chapel Hill Principal Investigator: Samuel Odom Description: Center on Secondary Education for Students with Autism Spectrum Disorders (CSESA). According to the Centers for Disease Control and Prevention, approximately 1 in 88 children has an autism spectrum disorder (ASD). Autism is a pervasive disorder affecting multiple developmental outcomes (e.g., behavior, communication, cognitive skills). The heterogeneity of abilities poses a significant challenge for schools in determining how best to meet the needs of each child within the least restrictive environment. The research to date suggests that despite some mitigation in the severity of some symptoms associated with ASD as children grow older, significant limitations persist that can affect a range of outcomes. The Center’s primary research will involve developing a comprehensive school- and community-based treatment model for high school students with ASD, and evaluating the efficacy of the intervention. The purpose of the intervention is to improve cognitive, communicative, academic, social, behavioral, functional, or transition outcomes of secondary students with ASD. In years 1 and 2, the research team will develop an intervention with five components: (1) evidence-based practice implementation and quality improvement [the National Professional Development Center on Autism Spectrum Disorders (NPDC) Model, which is the core component of the intervention); (2) academic performance; (3) social competence and peer relations; (4) adaptive behavior; and (5) transition and family. Researchers will begin the iterative development process by conducting focus groups with relevant stakeholders (e.g., special and general education teachers, administrators, related services providers, school counselors, family members, individuals with ASD, and typically developing high school students). The focus groups will provide feedback for the work groups developing the components. Following this process, researchers will pilot the four content components—academics, social competence, adaptive behavior and transition, and families—in high schools as single components. These pilot studies will obtain data on feasibility and fidelity of implementation, which will be used to revise and manualize the intervention components. In the second year of the project, each of the six research sites will pilot test a combination of three model components. Each combination will include the core NPDC model plus two content components, and every combination of three components will be tested. The Center will recruit a large sample of high schools across three states to participate in the
230

efficacy study in years 3–5, leading to a total of at least 60 schools that meet the inclusion criteria, with at least 12 students with ASD participating at each high school. Researchers will use a multiple cohort design with each cohort participating for two years. Using a randomized cluster design, researchers will pair and randomly assign schools within each state to treatment or control (business as usual). At each treatment site, all components of the intervention will be implemented in graduated steps over two years. The study will examine the cumulative efficacy as the intervention is implemented as well as the overall efficacy of the complete intervention on a variety of child outcomes relevant to the different component topics. The study will also examine potential child- and school-level moderators and changes in program quality as a mediator. For the first cohort, there will be follow up to explore whether treatment effects are maintained after the intervention officially ends and to explore transition outcomes for those students who have transitioned out of high school. Amount: $9,994,452 Period of Performance: 7/01/2012–6/30/2017
Award Number: R324C120001 Institution: Georgia State University Research Foundation, Inc. Principal Investigator: Amy Lederberg Description: Special Education Research and Development Center on Reading Instruction for Deaf and Hard of Hearing Students. Poor literacy skills have been characteristic of the deaf population for decades. National data suggest that median literacy rates of deaf high school graduates have remained consistently around the fourth grade level since the beginning of the 20th century. About one in five deaf students who graduate from high school have reading skills at or below the second grade level; about one in three deaf students who graduate from high school have reading skills between the second and fourth grade level. Compared to deaf students, hard-of-hearing students (i.e., those with mild to moderate hearing loss) fare better overall, but even mild hearing losses can create significant challenges for developing reading skills. Proficiency in reading is critical for furthering one’s education and achieving success in the workplace. Improving reading outcomes for students who are deaf or hard of hearing (DHH) requires substantial additional research, particularly research to identify, develop, and test instructional approaches, curricula, and other innovative education interventions designed to enhance the reading skills of students who are DHH. The focus of the Center is a program of research to explore underlying factors related to literacy for young DHH students in kindergarten through Grade 2 and to develop innovative approaches to improving reading instruction for these students. The ultimate objective of the Center is to improve literacy skills for students in early elementary school to maximize the potential long-term impact of an early literacy skills intervention on literacy development and overall school performance. The Center’s primary research will involve three sets of studies across Years 1-5: an identification study, iterative design studies, and a promise study. At least 120 students in each grade (K–2) with moderate to profound hearing loss will participate in the study during Years 1-2. Researchers will collect data on a number of child factors, including background, phonological awareness, literacy, and language skills, as well as classroom practices, teacher background, and family characteristics. The team will analyze the data to: (1) understand the language and literacy abilities in DHH students; (2) describe classroom instruction that students receive in a variety of elementary school settings; and (3) investigate language and literacy skills over the school year as a function of child, classroom, and school characteristics as well as interactions between child and instructional characteristics. During Years 2-4, the research team will develop a three-component intervention that can be adapted to students with moderate to profound hearing loss. The first component will teach early reading skills, the second will teach English syntax, and the third will teach advanced language and cognitive skills. The research team will use an iterative design process to develop each component separately and will evaluate the promise of the individual components in Year 4 using pre-and post-test group designs and single case experimental designs. For the promise study, a small cluster randomized controlled trial with teachers implementing the integrated intervention will occur in Year 5. Researchers will assign 14 classrooms at each grade (K–2) to a treatment or control group and
231

will assess students on a variety of distal and proximal measures to determine whether the intervention shows promise for improving language and literacy outcomes. Amount: $10,000,000 Period of Performance: 7/01/2012–6/30/2017
Postdoctoral Research Training Program in Special Education
Award Number: R324B120004 Institution: University of Kansas Center for Research, Inc. Principal Investigator: Charles Greenwood Description: Post-Doctoral Research Training Program in Special Education: Response to Intervention (RTI) in Early Childhood. The program will provide training experiences for research focused on the Response to Intervention (RTI) approach to early intervention and early childhood special education, with implications for improving school readiness. The overall aim of the program is to provide trainees with opportunities to learn first-hand about advances in the RTI prevention approach and interrelated research and methodological foci. The proposed number of fellows is four, with two years of training each. The program is housed at the Juniper Gardens Children’s Project at the University of Kansas, with training opportunities available through the multi-site Center for Response to Intervention in Early Childhood (CRTIEC). The program will provide comprehensive training in research on early childhood RtI with a focus on two overarching areas: the knowledge and content domain and the measurement and research methods domain. The knowledge and content domain includes the RTI prevention/intervention framework; advances in early childhood RtI models; language, social-emotional, and early literacy competency domains; instructional interventions, curricula, and multiple tiers of support; and research communication (e.g., publications, presentations). The measurement and research methods domain includes universal screening and progress monitoring measurement requirements of RtI, rigorous experimental study designs, and univariate and latent growth modeling techniques. Guided by an Individual Academic Fellowship Plan, fellows will be mentored by core faculty, audit relevant courses and summer institutes, and participate directly in research projects. Research opportunities will include but will not be limited to: (a) development, validation, and other research activities within the CRTIEC; (b) validation of a universal screening and progress monitoring measure of infant and toddler growth in communication skills; (c) development of a preschool RTI model for language and early literacy; (d) study of a web-based parenting intervention for mothers of infants at risk for maltreatment; (e) development of an intervention for improving social-emotional outcomes for infants in child care; and (f) evaluation of evidence-based, naturalistic language-promoting strategies for infants and young children with disabilities. Amount: $687,000 Period of Performance: 3/1/2012–2/29/2016
Award Number: R324B120002 Institution: University of Florida Principal Investigator: Patricia Snyder Description: Postdoctoral Research Training Fellowships in Early Intervention and Early Learning in Special Education at the University of Florida. This program will prepare fellows to design, implement, and evaluate research focused on improving developmental outcomes and school readiness of infants, toddlers, and young children with or at risk for disabilities. The proposed number of fellows is four, with two years of training each. The overarching goal of this award is to advance the professional development of interdisciplinary research scientists to conduct rigorous and relevant early intervention research and contribute to the advancement of knowledge, theory, and methodology in the field of special education. The program will support the acquisition and mastery of the knowledge and skills necessary to conduct early childhood special education research. The program will emphasize a situated learning and cognitive apprenticeship approach in which there is an experienced mentorship team for each fellow. Fellows will
232
participate in carefully planned activities informed by their individualized fellowship training plans, including the design, implementation, and evaluation of focused programs of research; bi-weekly research meetings; research colloquia and interdisciplinary seminars; manuscript preparation for publication; presentation at scientific meetings; and grant writing. Programs of research available to the fellows will include (but will not be limited to): (a) professional development interventions to support implementation of evidence-based practices in inclusive early learning settings; (b) early interventions to support young children’s social-emotional development and prevent challenging behavior; (c) learning of young children with significant disabilities, including autism; (d) development and validation of early intervention assessment measures; and (e) applications of advanced research designs, methods, and applied measurement relevant to early intervention. Amount: $642,840 Period of Performance: 5/15/2012–5/14/2015
Small Business Innovation Research in Special Education
Award Number: ED-IES-12-C-0043 Institution: HandHold Adaptive, LLC Principal Investigator: Robert Tedesco Description: App for Speech Development for Students with ASD. Autism Spectrum Disorders (ASDs) are severe neurodevelopmental disabilities characterized by deficits in social and communication skills and the presence of restrictive, repetitive behaviors. For the 80 percent of individuals with ASDs who speak, prosody—the rhythm, stress, and intonation of speech—is among the most noticeable and chronic impairments. Prosodic speech deficits impede social interaction and limit participation in vocational, recreational, and learning activities. The project team is developing a prototype of SpeechPrompts, a multi-faceted speech therapy application (app) for phones and tablets to engage students with ASD in a variety of customizable therapy exercises to address strengths and challenges. The app will capture student speech, provide response in real-time, reward target behaviors, and track performance. The app will be designed for both home and in-school use. Pilot research in Phase I will seek to demonstrate that the software prototype functions as planned; the product can be used by service providers; and students are engaged by the prototype. Amount: $150,000 Period of Performance: 6/20/12–12/20/12 Award Number: ED-IES-12-C-0045 Institution: Thought Cycle, Inc. Principal Investigator: Marshall Gause Description: Numbershire II: Math Games for 2nd Graders with or at-Risk for LD. This project team is developing a prototype of Numbershire II, a web-based suite of mini math games for second graders with or at-risk for disabilities. The games will be set in the context of a fantasy-themed village and will adapt the level of difficulty based on individual student needs. Additionally, the project will support students in learning numbers and operations in base 10, operations, and algebraic thinking. Pilot research in Phase I will seek to demonstrate that the software prototype functions as planned and that the prototype can be used by and is engaging to students with or at risk for disabilities. Amount: $150,000 Period of Performance: 6/20/12–12/20/12
233

Award Number: ED-IES-12-C-0047 Institution: Attention Control Systems, Inc. Principal Investigator: Richard Levinson Description: PEAT Communication Scheduler for Autism. This project team is developing a prototype of the Planning Execution Assistant and Trainer (PEAT), an application (app) for mobile phones and tablets to provide cues and support to non-verbal students with ASD in special education settings. As part of this intervention, students will carry and use iPhones at all times, both in and out of school. PEAT will support students in achieving greater independence and self-reliance. Pilot research in Phase I will seek to demonstrate that the software prototype functions as planned; the product can be used by service providers; and students are engaged by the prototype. Amount: $150,000 Period of Performance: 6/20/12–12/20/12
Award Number: ED-IES-12-C-0046 Institution: Teachley, Inc. Principal Investigator: Herbert Ginsburg Description: Think Facts Math Game for Single Digit Operational Fluency. This project team is developing a prototype of the Think Facts math game application (app) for touch screen tablets to support grade-school students with major learning difficulties in practicing and learning number facts, strategies, and number sense. The games will be adaptive in nature and will provide feedback to teachers to inform practice. Pilot research in Phase I will seek to demonstrate that the software prototype functions as planned, and the product is engaging and can be used by students with major learning difficulties. Amount: $150,000 Period of Performance: 6/20/12–12/20/12
234

Section V
Summary of Studies and Evaluations Under Section 664 of IDEA


Summary of Studies and Evaluations Under Section 664 of IDEA
In the December 2004 reauthorization of the Individuals with Disabilities Education Act (IDEA), Congress required the secretary to delegate to the director of the Institute of Education Sciences (IES) responsibility to carry out studies and evaluations under sections 664(a), (b), and (c) of IDEA. This section of the annual report describes studies authorized by sections 664(a) and 664(c) of the law; the next section (i.e., Section VI) describes studies that contribute to the national assessment of IDEA required by section 664(b).
As specified in section 664(a), IES, either directly or through grants, contracts, or cooperative agreements awarded to eligible entities on a competitive basis, assesses the progress in the implementation of IDEA, including the effectiveness of state and local efforts to provide (1) a free appropriate public education to children with disabilities and (2) early intervention services to infants and toddlers with disabilities and infants and toddlers who would be at risk of having substantial developmental delays if early intervention services were not provided to them. Under section 664(a), IES supports rigorous studies and evaluations that (1) analyze the impact of state and local efforts to improve educational and transitional services for children with disabilities; (2) analyze state and local needs for professional development, parent training, and other appropriate activities to reduce the need for disciplinary actions involving children with disabilities; (3) assess educational and transitional services and results for children with disabilities from minority backgrounds; (4) measure educational and transitional services and results for children with disabilities, including longitudinal studies; and (5) identify and report on the placement of children with disabilities by disability category.
As specified in section 664(c) of IDEA, IES is required to carry out a national study or studies related to students with disabilities who take alternate assessments. In particular, IES is responsible for carrying out a national study or studies that examine: (1) the criteria that states use to determine eligibility for alternate assessments and the number and types of children who take those assessments and are held accountable to alternate achievement standards; (2) the validity and reliability of alternate assessment instruments and procedures; (3) the alignment of alternate assessments and alternate achievement standards to state academic content standards in reading, mathematics, and science; and (4) the use and effectiveness of alternate assessments in appropriately measuring student progress and outcomes specific to individualized instructional need.
The National Center for Special Education Research (NCSER) and the National Center for Education Evaluation and Regional Assistance (NCEE), which are part of IES, are responsible for and collaborate on studies and evaluations conducted under sections 664(a), (b), and (c) of IDEA. The
237

following studies, authorized by section 664(a) of IDEA and supported by IES, were ongoing during federal fiscal year (FFY) 2012 (i.e., Oct. 1, 2011, through Sept. 30, 2012):
Contract Number: ED-04-CO-0059/0023 Contractor: Westat Project Director: Karen Tourangeau Description: Early Childhood Longitudinal Study, Kindergarten Class of 2010-11 (ECLS-K:2011), Phase I. The ECLS-K:2011 is the third in a series of longitudinal studies to examine children’s early learning and development, transitions into kindergarten and beyond, and progress through school. It currently includes three phases. The overall plan is to follow approximately 18,000 children, selected when in kindergarten, through the 2015-16 school year, when most of them are expected to be in fifth grade. Specifically, data are to be collected in fall 2010 and spring 2011 about mostly children in kindergarten; fall 2011 and spring 2012, about mostly children in first grade; fall 2012 and spring 2013, about mostly children in second grade; spring 2014, about mostly children in third grade; spring 2015, about mostly children in fourth grade; and spring 2016, about mostly children in fifth grade. This particular contract covered the data collections planned for fall 2010, spring 2011, and fall 2011. The following types of data collections were expected to be performed: one-on-one direct child assessments (measuring knowledge and skills in reading, mathematics, and science as well as executive function), computer-assisted parent interviews, physical measures, and surveys of general classroom teachers and school administrators. In addition, the plans for this contract called for surveys of special education teachers of children receiving special education services, surveys of child care providers of children in after-school care, and an assessment of Spanish-speaking children’s basic reading skills in Spanish. The report from this study is expected to be available at http://ies.ed.gov/ncee (accessed Mar. 10, 2014). Amount: $30,434,468 Period of Performance: 4/18/2008–4/17/2013
Contract Number: ED-IES-10-C-0048 Contractor: Westat Project Director: Karen Tourangeau Description: Early Childhood Longitudinal Study, Kindergarten Class of 2010-11 (ECLS-K:2011), Phase II. The ECLS-K:2011 is the third in a series of longitudinal studies to examine children’s early learning and development, transitions into kindergarten and beyond, and progress through school. It currently includes three phases. The overall plan is to follow approximately 18,000 children, selected when in kindergarten, through the 2015-16 school year, when most of them are expected to be in fifth grade. Specifically, data are to be collected in fall 2010 and spring 2011 about mostly children in kindergarten; fall 2011 and spring 2012, about mostly children in first grade; fall 2012 and spring 2013, about mostly children in second grade; spring 2014, about mostly children in third grade; spring 2015, about mostly children in fourth grade; and spring 2016, about mostly children in fifth grade. This particular contract covered data collections in spring 2012, fall 2012, and spring 2013. The following types of data collections were expected to be performed: one-on-one direct child assessments (measuring knowledge and skills in reading, mathematics, and science as well as executive function), computer-assisted parent interviews, physical measure, and surveys of general classroom teachers and school administrators. In addition, the plans for this contract called for surveys of special education teachers of children receiving special education services and an evaluation of children’s hearing. The report from this study is expected to be available at http://ies.ed.gov/ncee (accessed Mar. 10, 2014). Amount: $30,525,233 Period of Performance: 8/20/2010–8/19/2015
238

Contract Number: ED-IES-10-C-0073 Contractor: Mathematica Policy Research, Institute on Community Integration (ICI), Decision Information Resources (DIR) Project Director: John Burghardt Description: National Longitudinal Transition Study 2012 (Study of Transition Outcomes for Youth with Disabilities, Phase I). This study is the third in a series examining the characteristics, school experiences, and postsecondary outcomes of a nationally representative sample of youths with disabilities. The NLTS 2012 focuses on a group of about 10,000 students ages 13 to 21 (in December 2011), including a small sample of students without disabilities to allow, for the first time, for direct comparisons of students with and without individualized education programs. Data collection will include surveys of youths, parents/guardians, school administrators and teachers, as well as administrative records on youths and their schools. The study team will gather information at baseline (2012 and 2013) to describe the transition experiences of youths and outcomes as they prepare to leave school. A report reviewing evidence on improving post-high school outcomes for youth with disabilities was released in August 2013 and is available at http://ies.ed.gov/ncee/pubs/20134011/index.asp (accessed Mar. 3, 2014). More information on NLTS 2012 is available at http://ies.ed.gov/ncee/nlts/index.asp (accessed Mar. 3, 2014). Amount: $24,093,405 Period of Performance: 9/27/2010–9/26/2015
Contract Number: ED-CFO-10-A-0133/0002 Contractor: SRI International, Westat, RMCE Project Director: Jose Blackorby Description: Study of Early Intervention and Special Education Services and Personnel. This study is supporting the analysis of extant data to examine early intervention and special education service delivery and the personnel providing services. The study will examine early intervention service delivery across states, special education and related services received by children and youths over time and across states, and changes over time in the distribution of personnel providing special education services. Among the extant data sources the study team will use are cross-sectional data from the section 618 data states submit to the U.S. Department of Education and from the Schools and Staffing Survey. The report from this study will be available at http://ies.ed.gov/ncee (last http://ies.ed.gov/ncee (accessed Mar. 10, 2014). Amount: $1,149,233 Period of Performance: 9/17/2010–9/16/2015
Contract Number: ED-IES-12-C-0037 Contractor: Westat Project Director: Karen Tourangeau Description: Early Childhood Longitudinal Study, Kindergarten Class of 2010-11 (ECLS-K:2011), Phase III. The ECLS-K:2011 is the third in a series of longitudinal studies to examine children’s early learning and development, transitions into kindergarten and beyond and progress through school. It currently includes three phases. The overall plan is to follow approximately 18,000 children, selected when in kindergarten, through the 2015-16 school year, when most of them are expected to be in fifth grade. Specifically, data are to be collected in fall 2010 and spring 2011 about mostly children in kindergarten; fall 2011 and spring 2012, about mostly children in first grade; fall 2012 and spring 2013, about mostly children in second grade; spring 2014, about mostly children in third grade; spring 2015, about mostly children in fourth grade; and spring 2016, about mostly children in fifth grade. This particular contract is expected to cover the data collections in spring 2014 and spring 2015. Data collections are to include one-on-one direct child assessments (measuring knowledge and skills in reading, mathematics, and science, as well as executive function); computer-assisted parent interviews; physical measures; and surveys of general classroom teachers and school administrators. In addition, this contract is expected to include surveys of special education teachers of children receiving special education services and a child questionnaire collecting information on children’s socio-emotional
239

functioning. The report from this study is expected to be available at http://ies.ed.gov/ncee (accessed Mar. 10, 2014). Amount: $26,658,196 Period of Performance: 8/29/2012–8/28/2017
240

Section VI
Extent and Progress of the Assessment of National Activities

Extent and Progress of the Assessment of National Activities
As specified in section 664(b) of the Individuals with Disabilities Education Act (IDEA), as reauthorized in 2004, the secretary has the responsibility to carry out a “national assessment” of activities carried out with federal funds under IDEA. The secretary has delegated to the Institute of Education Sciences (IES), [in accordance with section 664(a) of IDEA] the responsibility for carrying out this national assessment [as required by section 664(b)] of the implementation and effectiveness of IDEA and of the federal, state, and local programs and services supported under the law. IES is carrying out this national assessment to determine the effectiveness of IDEA in achieving the law’s purpose and to collect information on how to implement IDEA more effectively. Information generated through this national assessment is intended to help federal policymakers and state and local administrators implement the law more effectively and help federal policymakers shape future legislation regarding infants, toddlers, preschoolers, children, and youths with disabilities. The National Center for Education Evaluation and Regional Assistance (NCEE), which is part of IES, is responsible for the national assessment of IDEA, in coordination with the National Center for Special Education Research (NCSER) at IES. NCEE supported the following studies related to the national assessment during federal fiscal year (FFY) 2012 (i.e., Oct. 1, 2011, through Sept. 30, 2012).
Contract Number: ED-04-CO-0015/0009 Contractor: Abt Associates, Westat, and Windwalker Corporation Project Director: Alan Werner Description: IDEA National Assessment Implementation Study (NAIS). This study was designed to provide a representative, national picture of state and local implementation of early intervention and special education policies and practices supported under IDEA, with a focus on implementation of the new provisions added to IDEA in 2004. Topics for the study included the provision of services for young children with disabilities, coordinated early intervening services (CEIS) and Response to Intervention (RtI), developmental and academic standards for children with disabilities, qualified personnel, promoting parent participation, and dispute resolution. Data collection during 2009 included surveys of state administrators of programs for infants and toddlers with disabilities, preschool-age children with disabilities, and school-age children receiving special education services, as well as a survey of a nationally representative sample of school district special education administrators. The study found that state Part C lead agencies support the transition of toddlers with disabilities to Part B preschool-age special education programs, but that Part C state lead agencies have not expanded to serve children until kindergarten. At age 3, toddlers receiving Part C services transition to Part B services (if eligible), typically involving a change in state lead agency and often a change in support staff, service settings, and services. The study also found that most school districts (85 percent) do not use IDEA, Part B, funds to provide CEIS. IDEA permits, and in some cases requires, school districts to use some of their Part B funds to provide CEIS, which are services for students not yet identified as needing special education. Finally, the study found that most school districts implement RtI, use RtI data when determining eligibility for specific learning disabilities (SLD), and support RtI with district general funds. RtI, defined as a range of practices for monitoring student academic and behavioral progress and providing targeted interventions, was added to IDEA in 2004 as a way to inform the determination of SLD and implement CEIS. The final report from this study was released in July 2011 and is available at http://ies.ed.gov/ncee/pubs/20114026/pdf/20114027.pdf (accessed July 19, 2012).
243

Contract Number: ED-04-CO-0059/0022 Contractor: Westat, Council for Exceptional Children, and Compass Consulting Project Director: Thomas Fiore Description: Evaluation of the IDEA Personnel Development Program. This evaluation included two descriptive studies, each focusing on different funding recipients for the IDEA Subpart 2 Part D, Personnel Development Program. The first study was of the national centers that are funded under this grant program, and that are designed to provide a variety of national capacity-building and scientifically based products and services to a range of audiences, including researchers, trainers, and education services providers. Panels of experts rated the quality and relevance/usefulness of documented materials and technical assistance provided by the national centers. The second study was of higher education institutions’ special education personnel preparation programs funded through this grant program. In addition to examining a number of funded program outcomes (e.g., number of students enrolled in courses and number of students who exited courses of study without completing them), the second component included expert panel ratings of the quality and relevance/usefulness of additions or significant modifications to courses of study during the period of each grant. To determine what became of nonfunded programs, the second study also included a survey of applicants from FY 2006 and FY 2007 who were not funded in those years. The final report from this evaluation is available at http://ies.ed.gov/ncee/pubs/20144007/ (accessed Mar. 3, 2014). Amount: $2,804,871 Period of Performance: 9/19/2007–9/30/2013
Contract Number: ED-04-CO-0025/0013 Contractor: American Institutes for Research and NORC at the University of Chicago Principal Investigator: Mengli Song Description: Study of School Accountability for Students With Disabilities. This study is describing the extent to which schools are accountable for the students with disabilities (SWD) subgroup under the Elementary and Secondary Education Act, how adequate yearly progress and school improvement status of schools vary with school accountability status, and how regular and special education practices for students with disabilities vary with school accountability for the SWD subgroup. Data sources for the evaluation include extant data from the U.S. Department of Education’s EDFacts database as well as 2011 surveys of principals and special education designees from elementary and middle schools in 12 states. The evaluation is addressing three research questions: (1) To what extent are schools accountable for the performance of the SWD subgroup, and how does this accountability vary across schools and over time? (2) To what extent have schools accountable for the SWD subgroup been identified as needing improvement? (3) How does school accountability for the SWD subgroup relate to regular and special education practices for SWD? An interim report, relying on analysis of EDFacts data from 2005–06 to 2008–09 school years from up to 40 states, was released in May 2012 and is available at http://ies.ed.gov/ncee/pubs/20124056/ (accessed Mar. 1, 2013). An update on the interim report, using data through the 2009–10 school year from up to 44 states, was released in October 2013 and is available at http://ies.ed.gov/ncee/pubs/20134017/ (accessed Mar. 3, 2014). A third report, relying on analysis of data from EDFacts and 2011 surveys of school staff in 12 states, is expected to be released in 2014. Reports from this study will be announced at http://ies.ed.gov/ncee/ (accessed Mar. 3, 2014). Amount: $3,626,218 Period of Performance: 2/28/2008–2/27/2015
244

Contract Number: ED-04-CO-0111/0003 Contractor: MDRC, SRI International, Instructional Research Group, and Survey Research Management Principal Investigator: Fred Doolittle Description: Evaluation of Response to Intervention Practices for Elementary School Reading. This evaluation is investigating the effects on grade 1-3 reading achievement of providing intensive interventions to children who have been identified as at risk for reading difficulties. This study is also investigating the range of Response to Intervention (RtI) practices for early reading being used by a representative sample of schools in 13 states and how schools experienced with RtI vary the intensity of reading instruction to children based on student benchmark reading performance. The evaluation is relying on a combination of regression discontinuity methods and descriptive comparisons. Site recruitment and data collection occurred in 2011 and 2012.The report from this study will be announced at http://ies.ed.gov/ncee/ (accessed Mar. 3, 2014). Amount: $14,204,339 Period of Performance: 3/26/2008–3/25/2015
Contract Number: ED-04-CO-0059/0032 Contractor: Westat and Empatha Project Director: Tamara Daley Description: National Evaluation of the IDEA Technical Assistance and Dissemination Program. As specified in IDEA Part D, the Technical Assistance and Dissemination (TA&D) Program is to provide technical assistance, support model demonstration projects, disseminate useful information, and implement activities that are supported by scientifically based research to meet the needs of children with disabilities. The National Evaluation of the IDEA TA&D Program is designed to describe the products and services provided by the TA&D Program grantees, state and local needs for technical assistance, and the role that the TA&D Program plays in meeting those needs and supporting implementation of IDEA 2004. Research questions focus on three topic areas: (1) Description of needs for and uses of TA&D services: What are the areas in which states and local providers report needing and/or receiving technical assistance to support IDEA implementation across all education-levels? Which services are seen as most helpful in contributing to the improvement of key student outcomes, and what are the perceived barriers to local level implementation? (2) Description of TA&D grantee services: What are the TA&D Network objectives and provider areas of practice? How do TA&D grantees identify their clients, assess their needs, and develop and maintain their relationship with clients? (3) Relationship between technical assistance and implementation of practices and policy: To what extent does assistance from TA&D grantees relate to implementation of special education policies and practices that support the implementation of IDEA? Data collection, which began in 2011, included administering surveys to TA&D Program grantees, all state IDEA Part B and Part C administrators, and a sample of state-level special education program staff. An interim report based on these data was released in October 2013 (http://ies.ed.gov/ncee/pubs/20144000/). The final report from the study will be announced at http://ies.ed.gov/ncee/ (accessed Mar. 10, 2014). Amount: $2,995,294 Period of Performance: 9/25/2009–9/24/2014
245

Appendix A
Infants, Toddlers, Children, and Students Served Under IDEA, by Age Group and State

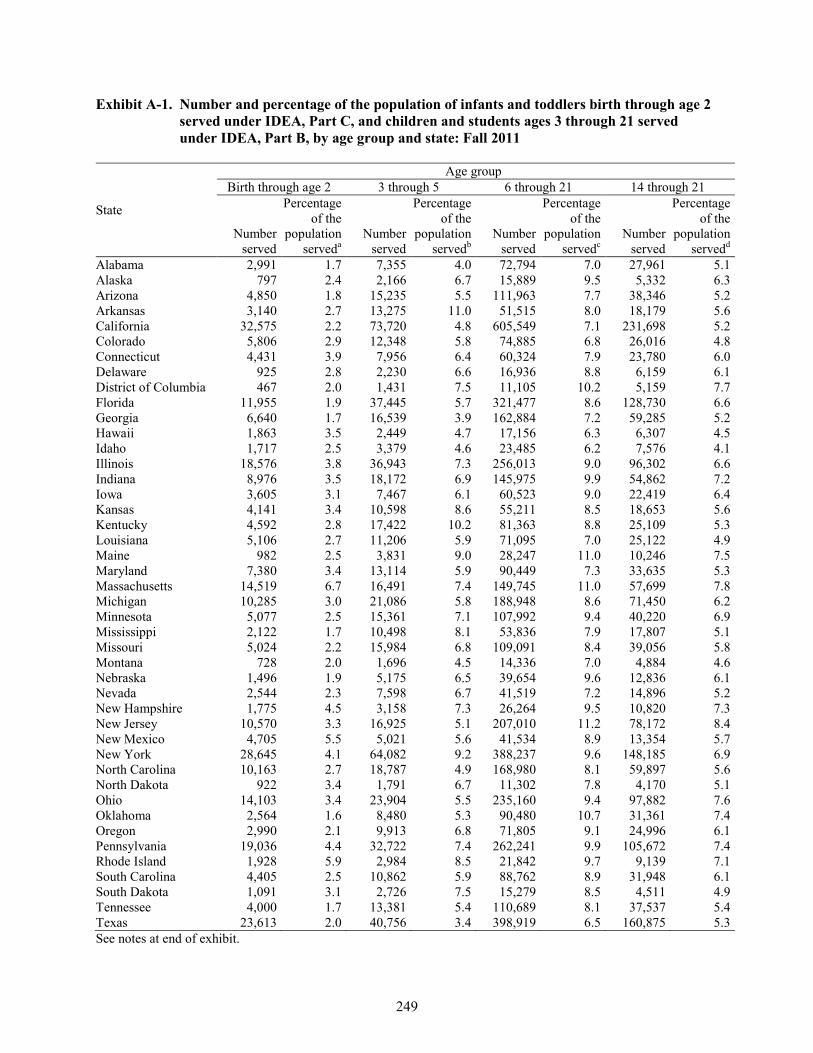
Exhibit A-1. Number and percentage of the population of infants and toddlers birth through age 2 served under IDEA, Part C, and children and students ages 3 through 21 served under IDEA, Part B, by age group and state: Fall 2011
State
Age group Birth through age 2 3 through 5 6 through 21 14 through 21
Number served
Percentage of the
population serveda
Number served
Percentage of the
population servedb
Number served
Percentage of the
population servedc
Number served
Percentage of the
population servedd
Alabama 2,991 1.7 7,355 4.0 72,794 7.0 27,961 5.1 Alaska 797 2.4 2,166 6.7 15,889 9.5 5,332 6.3 Arizona 4,850 1.8 15,235 5.5 111,963 7.7 38,346 5.2 Arkansas 3,140 2.7 13,275 11.0 51,515 8.0 18,179 5.6 California 32,575 2.2 73,720 4.8 605,549 7.1 231,698 5.2 Colorado 5,806 2.9 12,348 5.8 74,885 6.8 26,016 4.8 Connecticut 4,431 3.9 7,956 6.4 60,324 7.9 23,780 6.0 Delaware 925 2.8 2,230 6.6 16,936 8.8 6,159 6.1 District of Columbia 467 2.0 1,431 7.5 11,105 10.2 5,159 7.7 Florida 11,955 1.9 37,445 5.7 321,477 8.6 128,730 6.6 Georgia 6,640 1.7 16,539 3.9 162,884 7.2 59,285 5.2 Hawaii 1,863 3.5 2,449 4.7 17,156 6.3 6,307 4.5 Idaho 1,717 2.5 3,379 4.6 23,485 6.2 7,576 4.1 Illinois 18,576 3.8 36,943 7.3 256,013 9.0 96,302 6.6 Indiana 8,976 3.5 18,172 6.9 145,975 9.9 54,862 7.2 Iowa 3,605 3.1 7,467 6.1 60,523 9.0 22,419 6.4 Kansas 4,141 3.4 10,598 8.6 55,211 8.5 18,653 5.6 Kentucky 4,592 2.8 17,422 10.2 81,363 8.8 25,109 5.3 Louisiana 5,106 2.7 11,206 5.9 71,095 7.0 25,122 4.9 Maine 982 2.5 3,831 9.0 28,247 11.0 10,246 7.5 Maryland 7,380 3.4 13,114 5.9 90,449 7.3 33,635 5.3 Massachusetts 14,519 6.7 16,491 7.4 149,745 11.0 57,699 7.8 Michigan 10,285 3.0 21,086 5.8 188,948 8.6 71,450 6.2 Minnesota 5,077 2.5 15,361 7.1 107,992 9.4 40,220 6.9 Mississippi 2,122 1.7 10,498 8.1 53,836 7.9 17,807 5.1 Missouri 5,024 2.2 15,984 6.8 109,091 8.4 39,056 5.8 Montana 728 2.0 1,696 4.5 14,336 7.0 4,884 4.6 Nebraska 1,496 1.9 5,175 6.5 39,654 9.6 12,836 6.1 Nevada 2,544 2.3 7,598 6.7 41,519 7.2 14,896 5.2 New Hampshire 1,775 4.5 3,158 7.3 26,264 9.5 10,820 7.3 New Jersey 10,570 3.3 16,925 5.1 207,010 11.2 78,172 8.4 New Mexico 4,705 5.5 5,021 5.6 41,534 8.9 13,354 5.7 New York 28,645 4.1 64,082 9.2 388,237 9.6 148,185 6.9 North Carolina 10,163 2.7 18,787 4.9 168,980 8.1 59,897 5.6 North Dakota 922 3.4 1,791 6.7 11,302 7.8 4,170 5.1 Ohio 14,103 3.4 23,904 5.5 235,160 9.4 97,882 7.6 Oklahoma 2,564 1.6 8,480 5.3 90,480 10.7 31,361 7.4 Oregon 2,990 2.1 9,913 6.8 71,805 9.1 24,996 6.1 Pennsylvania 19,036 4.4 32,722 7.4 262,241 9.9 105,672 7.4 Rhode Island 1,928 5.9 2,984 8.5 21,842 9.7 9,139 7.1 South Carolina 4,405 2.5 10,862 5.9 88,762 8.9 31,948 6.1 South Dakota 1,091 3.1 2,726 7.5 15,279 8.5 4,511 4.9 Tennessee 4,000 1.7 13,381 5.4 110,689 8.1 37,537 5.4 Texas 23,613 2.0 40,756 3.4 398,919 6.5 160,875 5.3 See notes at end of exhibit.
249

Exhibit A-1. Number and percentage of the population of infants and toddlers birth through age 2 served under IDEA, Part C, and children and students ages 3 through 21 served under IDEA, Part B, by age group and state: Fall 2011―Continued
State
Age group Birth through age 2 3 through 5 6 through 21 14 through 21
Number served
Percentage of the
population serveda
Number served
Percentage of the
population servedb
Number served
Percentage of the
population servedc
Number served
Percentage of the
population servedd
Utah 3,392 2.2 8,856 5.6 62,377 8.3 19,225 5.4 Vermont 785 4.4 1,752 8.9 12,081 9.2 4,672 6.3 Virginia 8,384 2.8 16,677 5.4 144,521 8.5 55,128 6.2 Washington 5,567 2.1 14,588 5.5 114,758 8.0 39,077 5.3 West Virginia 2,499 4.1 5,488 8.7 38,771 10.7 13,208 6.9 Wisconsin 6,011 2.9 16,106 7.4 107,719 8.8 40,176 6.3 Wyoming 1,178 5.1 3,429 14.1 11,990 10.0 3,769 6.1 50 states and District
of Columbia 331,636 2.8 730,558 5.9 5,670,680 8.4 2,123,498 6.1 BIE schoolse † † — † — † — † American Samoa 37 — 161f — 771 — 295 — Guam 163 — 179f — 1,834 — 763 — Northern Mariana
Islands 40 — 104f — 827 — 313 — Puerto Rico 4,883 3.8 14,791 11.0 114,523 13.7 39,981 9.0 Virgin Islands 136 — 161f — 1,249 — 617 — U.S. and Outlying
Areas 336,895 — 745,954 — 5,789,884 — 2,165,467 — — Not available. † Not applicable. aPercentage was calculated by dividing the number of infants and toddlers birth through age 2 served under IDEA, Part C, by the estimated resident population birth through age 2, then multiplying the result by 100. bPercentage was calculated by dividing the number of children ages 3 through 5 served under IDEA, Part B, by the estimated resident population ages 3 through 5, then multiplying the result by 100. cPercentage was calculated by dividing the number of students ages 6 through 21 served under IDEA, Part B, by the estimated resident population ages 6 through 21, then multiplying the result by 100. dPercentage was calculated by dividing the number of students ages 14 through 21 served under IDEA, Part B, by the estimated resident population ages 14 through 21, then multiplying the result by 100. eThe Bureau of Indian Education (BIE) receives IDEA, Part C, funds under IDEA section 643(b) and reports separately every two years under IDEA section 643(b)(5) to the U.S. Department of Education on the number of children contacted and served by tribal entities that receive Part C funds. The BIE receives IDEA, Part B, funds under IDEA section 611(h)(1)(A) to serve only children ages 5 through 21 enrolled in elementary and secondary schools for American Indian children operated or funded by the BIE. Children and students served through the BIE schools are included in the population estimates of the individual states in which they reside. fThe four outlying areas do not receive funds under IDEA, Part B, section 619. However, the outlying areas may report children ages 3 through 5 who receive services funded under IDEA, Part B, section 611(b)(1)(A). SOURCE: U.S. Department of Education, Office of Special Education Programs, Data Analysis System (DANS), OMB #1820-0557: “Report of Children Receiving Early Intervention Services in Accordance with Part C,” 2011. Data Analysis System (DANS), OMB #1820-0043: “Report of Children with Disabilities Receiving Special Education Under Part B of the Individuals with Disabilities Education Act, as Amended,” 2010. U.S. Department of Commerce, U.S. Census Bureau. “Intercensal Estimates of the Resident Population by Single Year of Age and Sex for States and the United States: April 1, 2000 to July 1, 2011,” 2011. Data were accessed fall 2012. For actual data used, go to http://www.ed.gov/about/reports/annual/osep.
250
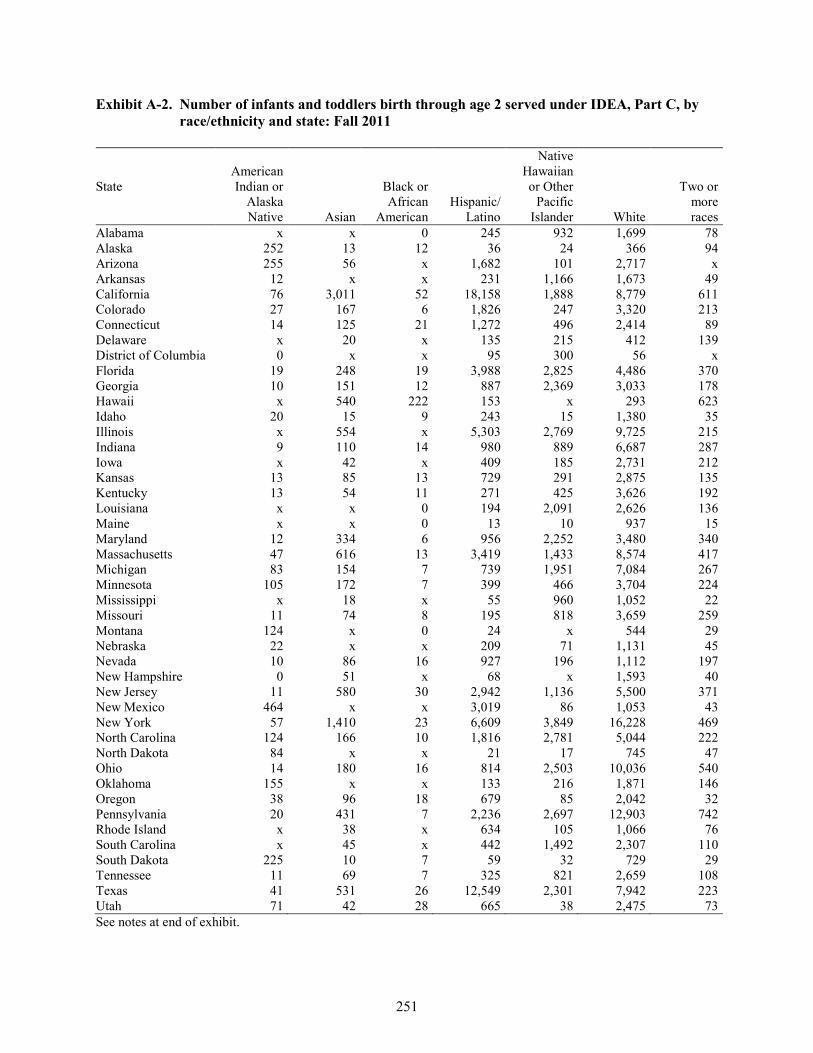
Exhibit A-2. Number of infants and toddlers birth through age 2 served under IDEA, Part C, by race/ethnicity and state: Fall 2011
State American Indian or
Alaska Native Asian
Black or African
American Hispanic/
Latino
Native Hawaiian or Other
Pacific Islander White
Two or more races
Alabama x x 0 245 932 1,699 78 Alaska 252 13 12 36 24 366 94 Arizona 255 56 x 1,682 101 2,717 x Arkansas 12 x x 231 1,166 1,673 49 California 76 3,011 52 18,158 1,888 8,779 611 Colorado 27 167 6 1,826 247 3,320 213 Connecticut 14 125 21 1,272 496 2,414 89 Delaware x 20 x 135 215 412 139 District of Columbia 0 x x 95 300 56 x Florida 19 248 19 3,988 2,825 4,486 370 Georgia 10 151 12 887 2,369 3,033 178 Hawaii x 540 222 153 x 293 623 Idaho 20 15 9 243 15 1,380 35 Illinois x 554 x 5,303 2,769 9,725 215 Indiana 9 110 14 980 889 6,687 287 Iowa x 42 x 409 185 2,731 212 Kansas 13 85 13 729 291 2,875 135 Kentucky 13 54 11 271 425 3,626 192 Louisiana x x 0 194 2,091 2,626 136 Maine x x 0 13 10 937 15 Maryland 12 334 6 956 2,252 3,480 340 Massachusetts 47 616 13 3,419 1,433 8,574 417 Michigan 83 154 7 739 1,951 7,084 267 Minnesota 105 172 7 399 466 3,704 224 Mississippi x 18 x 55 960 1,052 22 Missouri 11 74 8 195 818 3,659 259 Montana 124 x 0 24 x 544 29 Nebraska 22 x x 209 71 1,131 45 Nevada 10 86 16 927 196 1,112 197 New Hampshire 0 51 x 68 x 1,593 40 New Jersey 11 580 30 2,942 1,136 5,500 371 New Mexico 464 x x 3,019 86 1,053 43 New York 57 1,410 23 6,609 3,849 16,228 469 North Carolina 124 166 10 1,816 2,781 5,044 222 North Dakota 84 x x 21 17 745 47 Ohio 14 180 16 814 2,503 10,036 540 Oklahoma 155 x x 133 216 1,871 146 Oregon 38 96 18 679 85 2,042 32 Pennsylvania 20 431 7 2,236 2,697 12,903 742 Rhode Island x 38 x 634 105 1,066 76 South Carolina x 45 x 442 1,492 2,307 110 South Dakota 225 10 7 59 32 729 29 Tennessee 11 69 7 325 821 2,659 108 Texas 41 531 26 12,549 2,301 7,942 223 Utah 71 42 28 665 38 2,475 73 See notes at end of exhibit.
251

Exhibit A-2. Number of infants and toddlers birth through age 2 served under IDEA, Part C, by race/ethnicity and state: Fall 2011―Continued
State American Indian or
Alaska Native Asian
Black or African
American Hispanic/
Latino
Native Hawaiian or Other
Pacific Islander White
Two or more races
Vermont 0 7 0 9 12 717 40 Virginia 8 327 10 883 1,707 4,863 586 Washington 99 274 50 1,441 203 3,113 387 West Virginia x 17 x 27 97 2,304 51 Wisconsin 57 109 6 927 655 4,009 248 Wyoming 41 x x 153 19 932 21 American Samoa 0 x 34 0 0 0 x Guam 0 x 116 0 0 x 23 Northern Mariana Islands 0 11 17 0 0 0 12 Puerto Rico 0 0 0 4,883 0 0 0 Virgin Islands 0 0 0 22 103 x x x Data suppressed to limit disclosure. SOURCE: U.S. Department of Education, Office of Special Education Programs, Data Analysis System (DANS), OMB #1820-0557: “Report of Children Receiving Early Intervention Services in Accordance with Part C,” 2011. Data were accessed fall 2012. For actual data used, go to http://www.ed.gov/about/reports/annual/osep.
252
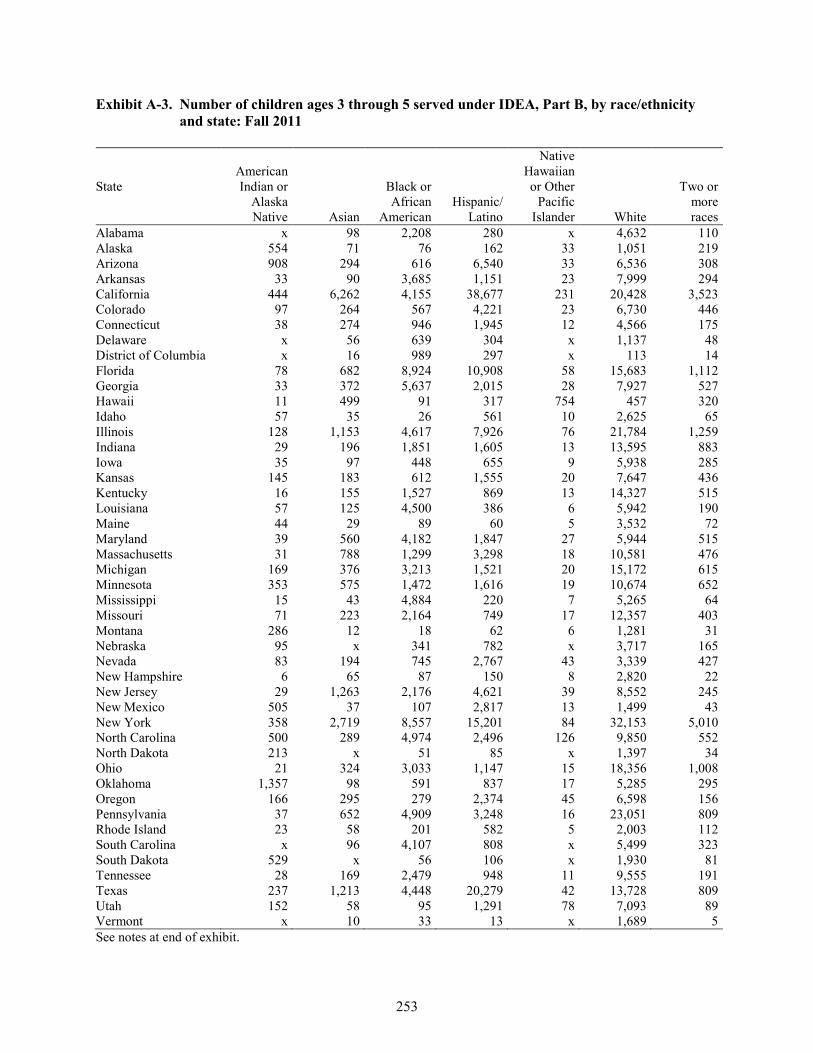
Exhibit A-3. Number of children ages 3 through 5 served under IDEA, Part B, by race/ethnicity and state: Fall 2011
State American Indian or
Alaska Native Asian
Black or African
American Hispanic/
Latino
Native Hawaiian or Other
Pacific Islander White
Two or more races
Alabama x 98 2,208 280 x 4,632 110 Alaska 554 71 76 162 33 1,051 219 Arizona 908 294 616 6,540 33 6,536 308 Arkansas 33 90 3,685 1,151 23 7,999 294 California 444 6,262 4,155 38,677 231 20,428 3,523 Colorado 97 264 567 4,221 23 6,730 446 Connecticut 38 274 946 1,945 12 4,566 175 Delaware x 56 639 304 x 1,137 48 District of Columbia x 16 989 297 x 113 14 Florida 78 682 8,924 10,908 58 15,683 1,112 Georgia 33 372 5,637 2,015 28 7,927 527 Hawaii 11 499 91 317 754 457 320 Idaho 57 35 26 561 10 2,625 65 Illinois 128 1,153 4,617 7,926 76 21,784 1,259 Indiana 29 196 1,851 1,605 13 13,595 883 Iowa 35 97 448 655 9 5,938 285 Kansas 145 183 612 1,555 20 7,647 436 Kentucky 16 155 1,527 869 13 14,327 515 Louisiana 57 125 4,500 386 6 5,942 190 Maine 44 29 89 60 5 3,532 72 Maryland 39 560 4,182 1,847 27 5,944 515 Massachusetts 31 788 1,299 3,298 18 10,581 476 Michigan 169 376 3,213 1,521 20 15,172 615 Minnesota 353 575 1,472 1,616 19 10,674 652 Mississippi 15 43 4,884 220 7 5,265 64 Missouri 71 223 2,164 749 17 12,357 403 Montana 286 12 18 62 6 1,281 31 Nebraska 95 x 341 782 x 3,717 165 Nevada 83 194 745 2,767 43 3,339 427 New Hampshire 6 65 87 150 8 2,820 22 New Jersey 29 1,263 2,176 4,621 39 8,552 245 New Mexico 505 37 107 2,817 13 1,499 43 New York 358 2,719 8,557 15,201 84 32,153 5,010 North Carolina 500 289 4,974 2,496 126 9,850 552 North Dakota 213 x 51 85 x 1,397 34 Ohio 21 324 3,033 1,147 15 18,356 1,008 Oklahoma 1,357 98 591 837 17 5,285 295 Oregon 166 295 279 2,374 45 6,598 156 Pennsylvania 37 652 4,909 3,248 16 23,051 809 Rhode Island 23 58 201 582 5 2,003 112 South Carolina x 96 4,107 808 x 5,499 323 South Dakota 529 x 56 106 x 1,930 81 Tennessee 28 169 2,479 948 11 9,555 191 Texas 237 1,213 4,448 20,279 42 13,728 809 Utah 152 58 95 1,291 78 7,093 89 Vermont x 10 33 13 x 1,689 5 See notes at end of exhibit.
253

Exhibit A-3. Number of children ages 3 through 5 served under IDEA, Part B, by race/ethnicity and state: Fall 2011―Continued
State American Indian or
Alaska Native Asian
Black or African
American Hispanic/
Latino
Native Hawaiian or Other
Pacific Islander White
Two or more races
Virginia 38 785 3,709 2,276 23 9,174 672 Washington 289 711 650 3,400 78 8,466 994 West Virginia x 19 190 82 x 5,081 110 Wisconsin 230 312 1,751 2,061 21 11,352 379 Wyoming 60 x 47 389 x 2,863 45 BIE schoolsa — — — — — — — American Samoa 0 0 0 0 161 0 0 Guam 0 x 0 x 128 x x Northern Mariana Islands 0 40 0 0 44 x x Puerto Rico x x 20 14,703 0 64 0 Virgin Islands 0 x 122 x 0 x 0 x Data suppressed to limit disclosure. — Not available. aAlthough Bureau of Indian Education (BIE) schools do not receive funds under IDEA, Part B, section 619, BIE schools may report five-year-old children who are enrolled in elementary schools for American Indian children operated or funded by the BIE and served with IDEA, Part B, section 611(h)(1)(A) funds. SOURCE: U.S. Department of Education, Office of Special Education Programs, Data Analysis System (DANS), OMB #1820-0043: “Report of Children with Disabilities Receiving Special Education Under Part B of the Individuals with Disabilities Education Act, as Amended,” 2011. Data were accessed fall 2012. For actual data used, go to http://www.ed.gov/about/reports/annual/osep.
254

Exhibit A-4. Number of students ages 6 through 21 served under IDEA, Part B, by race/ethnicity and state: Fall 2011
State American Indian or
Alaska Native Asian
Black or African
American Hispanic/
Latino
Native Hawaiian or Other
Pacific Islander White
Two or more races
Alabama 519 383 29,297 2,058 17 40,088 432 Alaska 4,624 511 742 1,051 327 7,290 1,344 Arizona 7,520 1,488 7,547 46,699 194 47,007 1,508 Arkansas 403 334 12,652 4,109 145 33,064 808 California 5,228 35,115 61,696 313,249 2,729 170,686 16,846 Colorado 954 1,171 5,066 25,006 129 40,114 2,445 Connecticut 260 1,169 9,774 13,684 32 34,464 941 Delaware x 222 6,710 2,000 x 7,667 246 District of Columbia x 42 9,616 949 x 447 43 Florida 1,351 3,906 83,582 84,640 238 138,965 8,795 Georgia 385 2,474 64,515 16,676 106 74,070 4,658 Hawaii 133 3,840 505 1,116 7,911 2,477 1,174 Idaho 521 191 352 3,864 59 18,032 466 Illinois 1,076 4,835 55,794 51,003 283 136,120 6,902 Indiana 587 971 20,287 9,675 57 107,616 6,782 Iowa 434 574 5,336 5,759 72 46,570 1,778 Kansas 797 628 5,378 7,995 63 35,303 5,047 Kentucky 142 461 10,259 2,468 30 66,394 1,609 Louisiana 572 439 34,916 1,683 28 32,957 500 Maine 373 232 778 550 25 25,991 298 Maryland 295 2,303 39,266 9,701 69 36,156 2,659 Massachusetts 465 3,787 15,014 29,043 154 97,598 3,684 Michigan 1,987 2,241 40,955 11,243 124 128,275 4,123 Minnesota 3,326 4,360 13,733 8,946 87 74,763 2,777 Mississippi 127 224 26,679 909 9 25,632 256 Missouri 615 1,072 20,993 3,945 101 80,672 1,693 Montana 2,174 80 169 614 45 10,986 268 Nebraska 896 470 3,418 6,098 42 27,415 1,315 Nevada 853 1,061 5,873 14,893 345 16,695 1,799 New Hampshire 74 247 667 950 20 24,262 44 New Jersey 265 7,746 40,109 43,542 246 113,786 1,316 New Mexico 4,891 259 1,010 24,399 17 10,467 491 New York 2,525 13,191 89,438 102,610 408 177,512 2,553 North Carolina 2,974 1,630 55,973 18,205 104 84,319 5,775 North Dakota 1,256 62 328 396 24 9,127 109 Ohio 414 1,581 45,139 7,999 69 170,142 9,816 Oklahoma 15,512 714 10,839 8,947 113 51,696 2,659 Oregon 1,769 1,543 2,711 14,990 341 47,879 2,572 Pennsylvania 489 3,371 47,739 23,071 76 185,222 2,273 Rhode Island 237 319 2,137 4,915 26 13,659 549 South Carolina 324 539 38,240 4,223 41 43,426 1,969 South Dakota 2,692 124 439 668 10 11,092 254 Tennessee 252 847 28,918 5,212 52 74,709 699 Texas 2,059 5,995 68,304 190,343 402 125,454 6,362 Utah 1,212 593 1,200 10,863 670 47,045 794 Vermont 23 65 273 103 9 11,581 27 See notes at end of exhibit.
255

Exhibit A-4. Number of students ages 6 through 21 served under IDEA, Part B, by race/ethnicity and state: Fall 2011―Continued
State American Indian or
Alaska Native Asian
Black or African
American Hispanic/
Latino
Native Hawaiian or Other
Pacific Islander White
Two or more races
Virginia 531 4,245 42,801 16,925 151 74,389 5,479 Washington 2,953 4,405 7,351 23,548 775 68,891 6,835 West Virginia 43 119 1,932 383 6 35,918 370 Wisconsin 2,269 2,450 17,005 10,483 55 73,462 1,995 Wyoming 463 45 173 1,527 14 9,580 188 BIE schoolsa — — — — — — — American Samoa 0 x 0 0 x 0 0 Guam x 257 x x 1,527 18 22 Northern Mariana Islands 0 157 0 0 513 5 152 Puerto Rico 57 53 46 114,283 0 84 0 Virgin Islands x x x x x 31 8 x Data suppressed to limit disclosure. — Not available. aBureau of Indian Education schools. SOURCE: U.S. Department of Education, Office of Special Education Programs, Data Analysis System (DANS), OMB #1820-0043: “Report of Children with Disabilities Receiving Special Education Under Part B of the Individuals with Disabilities Education Act, as Amended,” 2011. Data were accessed fall 2012. For actual data used, go to http://www.ed.gov/about/reports/annual/osep.
256

Appendix B
Developmental Delay Data for Children Ages 3 Through 5 and Students Ages 6 Through 9 Served Under IDEA, Part B


Developmental Delay Data for Children Ages 3 Through 5 and Students Ages 6 Through 9 Served Under IDEA, Part B
IDEA allows states flexibility in the use of the developmental delay category. Per statute, use of the category is optional. Only children ages 3 through 9 may be reported in the developmental delay disability category and then only in states with the diagnostic instruments and procedures to measure delays in physical, cognitive, communication, social or emotional, or adaptive development. States must have defined and established eligibility criteria for developmental delay in order to report children in this category. Although federal law does not require that states and local education agencies categorize children according to developmental delay, if this category is required by state law, states are expected to report these children in the developmental delay category.
Appendix B presents information related to children ages 3 through 5 and students ages 6 through 9 reported in the developmental delay category. In particular, it provides information on the numbers of states that reported data on children and students served under IDEA, Part B, under the category of developmental delay; data on the percentages of resident populations of children and students served under IDEA, Part B, who were reported under the category of developmental delay; and information on states with different practices in reporting children and students with developmental delay.
259

Exhibit B-1. Number of states reporting children ages 3 through 5 served under IDEA, Part B, under the category of developmental delay and percentage of the population ages 3 through 5 served under IDEA, Part B, reported under the category of developmental delay, by year: Fall 2002 through fall 2011
Year Number of statesa Percentage of resident
population servedb 2002 47 2.67 2003 47 2.82 2004 48 2.94 2005 49 2.92 2006 49 2.78 2007 49 2.86 2008 49 2.73 2009 50 2.78 2010 49 2.84 2011 49 2.89 aThese are states that reported a non-zero count for children ages 3 through 5 under the category of developmental delay and had estimated resident population data available. For the purpose of this exhibit, number of states may include any of the 50 states, District of Columbia (DC), Bureau of Indian Education (BIE) schools, and Puerto Rico (PR). bPercentage was calculated by dividing the number of children ages 3 through 5 served under IDEA, Part B, reported under the category of developmental delay by the estimated resident population ages 3 through 5 in the states that reported children under the category of developmental delay for that year, then multiplying the result by 100. NOTE: States’ use of the developmental delay category is optional for children ages 3 through 9 and is not applicable to children older than 9 years of age. For information on states with differences in developmental delay reporting practices, see exhibit B-3. Although BIE schools do not receive funds under IDEA, Part B, section 619, BIE schools may report five-year-old children who are enrolled in elementary schools for American Indian children operated or funded by BIE and who receive services funded under IDEA, Part B, section 611(h)(1)(A). SOURCE: U.S. Department of Education, Office of Special Education Programs, Data Analysis System (DANS), OMB #1820-0043: “Report of Children with Disabilities Receiving Special Education Under Part B of the Individuals with Disabilities Education Act, as Amended,” 2002–101. These data are for the states, DC, BIE schools, and PR that reported children under the category of developmental delay. For 2007 and 2008, data for Vermont were not available. For 2010, data for Wyoming were not available. For 2011, data for BIE schools were not available. U.S. Department of Commerce, U.S. Census Bureau. “Intercensal Estimates of the Resident Population by Single Year of Age and Sex for States and the United States: April 1, 2000 to July 1, 2011,” 2002–11. These data are for the states, DC, and PR that reported children under the category of developmental delay. For 2007 and 2008, data for Vermont were excluded. For 2010, data for Wyoming were excluded. Children served through BIE schools are included in the population estimates of the individual states in which they reside. Data were accessed fall 2012. For actual data used, go to http://www.ed.gov/about/reports/annual/osep.
260

Exhibit B-2. Number of states reporting students ages 6 through 9 served under IDEA, Part B, under the category of developmental delay and percentage of the population ages 6 through 9 served under IDEA, Part B, reported under the category of developmental delay, by year: Fall 2002 through fall 2011
Year Number of statesa Percentage of resident
population servedb 2002 30 0.85 2003 29 1.01 2004 29 1.15 2005 31 1.17 2006 33 1.17 2007 35 1.11 2008 34 1.26 2009 37 1.25 2010 35 1.33 2011 35 1.41 aThese are states that reported a non-zero count for students ages 6 through 9 under the category of developmental delay and had estimated resident population data available. For the purpose of this exhibit, number of states may include any of the 50 states, District of Columbia (DC), Bureau of Indian Education (BIE) schools, and Puerto Rico (PR). bPercentage was calculated by dividing the number of students ages 6 through 9 served under IDEA, Part B, reported under the category of developmental delay by the estimated resident population ages 6 through 9 in the states that reported students under the category of developmental delay for that year, then multiplying the result by 100. NOTE: States’ use of the developmental delay category is optional for children ages 3 through 9 and is not applicable to children older than 9 years of age. For information on states with differences in developmental delay reporting practices, see exhibit B-3. SOURCE: U.S. Department of Education, Office of Special Education Programs, Data Analysis System (DANS), OMB #1820-0043: “Report of Children with Disabilities Receiving Special Education Under Part B of the Individuals with Disabilities Education Act, as Amended,” 2002–11. These data are for the states, DC, BIE schools, and PR that reported children under the category of developmental delay. For 2007 and 2008, data for Vermont were not available. For 2010, data for Wyoming were not available. For 2010, data for BIE schools were not available. In 2010 and 2011, PR reported zero students ages 6 through 9 under the category of developmental delay. U.S. Department of Commerce, U.S. Census Bureau. “Intercensal Estimates of the Resident Population by Single Year of Age and Sex for States and the United States: April 1, 2000 to July 1, 2011,” 2002–11. These data are for the states, DC, and PR that reported children under the category of developmental delay. For 2007 and 2008, data for Vermont were excluded. For 2010 data for PR and Wyoming were excluded. For 2011, data for PR were excluded. Students served through BIE schools are included in the population estimates of the individual states in which they reside. Data were accessed fall 2012. For actual data used, go to http://www.ed.gov/about/reports/annual/osep.
261

Exhibit B-3. States with different practices in reporting children served under IDEA, Part B, under the category of developmental delay, by reporting practice and state: Fall 2011
State Does not use
developmental delay category
Uses developmental delay category for children ages
3 through 9
Uses developmental delay category for children ages
3 through 5 only Alabama X Alaska X Arizona X Arkansas X BIE schools X California X Colorado X Connecticut X Delaware X District of Columbia X Florida X Georgia X Hawaii X Idaho X Illinois X Indiana X Iowa X Kansas X Kentucky X Louisiana X Maine X Maryland X Massachusetts X Michigan X Minnesota X Mississippi X Missouri X Montana X Nebraska X Nevada X New Hampshire X New Jersey X New Mexico X New York X North Carolina X North Dakota X Ohio X Oklahoma X Oregon X Pennsylvania X Puerto Rico X Rhode Island X See notes at end of exhibit.
262
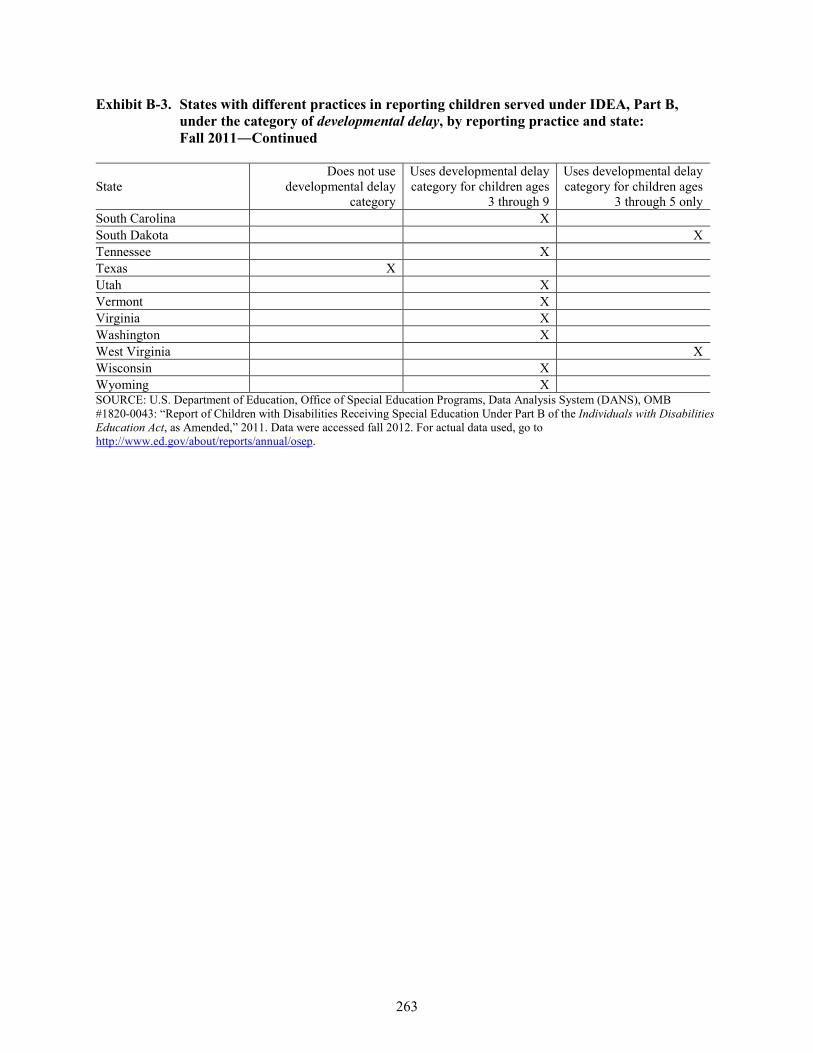
Exhibit B-3. States with different practices in reporting children served under IDEA, Part B, under the category of developmental delay, by reporting practice and state: Fall 2011―Continued
State Does not use
developmental delay category
Uses developmental delay category for children ages
3 through 9
Uses developmental delay category for children ages
3 through 5 only South Carolina X South Dakota X Tennessee X Texas X Utah X Vermont X Virginia X Washington X West Virginia X Wisconsin X Wyoming X SOURCE: U.S. Department of Education, Office of Special Education Programs, Data Analysis System (DANS), OMB #1820-0043: “Report of Children with Disabilities Receiving Special Education Under Part B of the Individuals with Disabilities Education Act, as Amended,” 2011. Data were accessed fall 2012. For actual data used, go to http://www.ed.gov/about/reports/annual/osep.
263

Appendix C
Differences in State Reporting of IDEA, Part B, Disabilities


Differences in State Reporting of IDEA, Part B, Disabilities
Exhibit C-1 summarizes how some states reported children and students ages 3 through 21 served under IDEA, Part B, with other health impairments and multiple disabilities in different disability categories for child count and educational environments data collections in 2011 and for exiting and discipline data collections in 2010–11. In particular, one state reported children and students with other health impairments in the orthopedic impairments category, while seven states reported children and students with multiple disabilities in the primary disability category listed on their individualized education programs (IEPs).
Exhibit C-1. States that reported children and students with other health impairments and multiple disabilities in different disability categories for IDEA, Part B, child count and educational environments data collections: Fall 2011; and exiting and discipline data collections: 2010–11
Statea IDEA disability categories
Other health impairments Multiple disabilities Colorado O Delaware P Florida P Georgia P North Dakota P Oregon P West Virginia P Wisconsin P O = Children and students with other health impairments reported in the orthopedic impairments category. P = Children and students with multiple disabilities reported in the primary disability category identified on their IEP. aStates report data according to state law. States do not uniformly categorize children and students with disabilities according to IDEA disability categories as defined for purposes of child count, educational environments, exiting, and discipline data collections. NOTE: For 2010–11, states’ exiting data are from the reporting period between July 1, 2010 and June 30, 2011, while states’ discipline data are from the entire 2010–11 school year. SOURCE: U.S. Department of Education, Office of Special Education Programs, Data Analysis System (DANS), OMB #1820-0043: “Report of Children with Disabilities Receiving Special Education Under Part B of the Individuals with Disabilities Education Act, as Amended,” 2011. Data were accessed fall 2012; Data Analysis System (DANS), OMB #1820-0517: “Part B, Individuals with Disabilities Education Act, Implementation of FAPE Requirements,” 2011. Data were accessed fall 2012; Data Analysis System (DANS), OMB #1820-0521: “Report of Children with Disabilities Exiting Special Education,” 2010–11. Data were accessed fall 2012; Data Analysis System (DANS), OMB #1820-0621: “Report of Children with Disabilities Subject to Disciplinary Removal,” 2010–11. Data were accessed summer 2012. For actual Part B data used, go to http://www.ed.gov/about/reports/annual/osep.
267


The Department of Education’s mission is to promote student achievement and preparation for global competitiveness by fostering educational excellence and ensuring equal access.
www.ed.gov


