Page 1
360ProbDASH: Improving QoE of 360 Video Streaming UsingTile-based HTTP Adaptive Streaming
Lan Xie1, Zhimin Xu1, Yixuan Ban1,3, Xinggong Zhang1,2,∗, Zongming Guo1,21Institute of Computer Science & Technology, Peking University, Beijing, China
2Cooperative Medianet Innovation Center, Shanghai, China3Beijing University of Posts and Telecommunications, Beijing, China
xielan,xuzhimin,zhangxg,[email protected] ,[email protected]
ABSTRACT
Recently, there has been a signiicant interest towards 360-degree
panorama video. However, such videos usually require extremely
high bitrate which hinders their widely spread over the Internet.
Tile-based viewport adaptive streaming is a promising way to de-
liver 360-degree video due to its on-request portion downloading.
But it is not trivial for it to achieve good Quality of Experience (QoE)
because Internet request-reply delay is usually much higher than
motion-to-photon latency. In this paper, we leverage a probabilistic
approach to pre-fetch tiles countering viewport prediction error,
and design a QoE-driven viewport adaptation system, 360Prob-
DASH. It treats user’s head movement as probability events, and
constructs a probabilistic model to depict the distribution of view-
port prediction error. A QoE-driven optimization framework is
proposed to minimize total expected distortion of pre-fetched tiles.
Besides, to smooth border efects of mixed-rate tiles, the spatial qual-
ity variance is also minimized. With the requirement of short-term
viewport prediction under a small bufer, it applies a target-bufer-
based rate adaptation algorithm to ensure continuous playback.
We implement 360ProbDASH prototype and carry out extensive
experiments on a simulation test-bed and real-world Internet with
real user’s head movement traces. The experimental results demon-
strate that 360ProbDASH achieves at almost 39% gains on viewport
PSNR, and 46% reduction on spatial quality variance against the
existed viewport adaptation methods.
CCS CONCEPTS
· Information systems→Multimedia streaming; ·Human-
centered computing → Virtual reality;
KEYWORDS
360-degree video, tile-based adaptive streaming, rate and view-
port adaptation, DASH, QoE-driven Optimization
* Dr. Xinggong Zhang is the corresponding author of this paper.
Permission to make digital or hard copies of all or part of this work for personal orclassroom use is granted without fee provided that copies are not made or distributedfor proit or commercial advantage and that copies bear this notice and the full citationon the irst page. Copyrights for components of this work owned by others than ACMmust be honored. Abstracting with credit is permitted. To copy otherwise, or republish,to post on servers or to redistribute to lists, requires prior speciic permission and/or afee. Request permissions from [email protected] .
MM ’17, October 23ś27, 2017, Mountain View, CA, USA
© 2017 Association for Computing Machinery.ACM ISBN 978-1-4503-4906-2/17/10. . . $15.00https://doi.org/10.1145/3123266.3123291
HTTP Server
360 video
Source
Cropping to tiles Segmentation
and encoding
Client
User’s orientation
encoder
Internet
Render
Throughput
Rate
Adaptation
Viewport
Adaptation
Figure 1: System Overview of Tile-based HTTP Adaptive
Streaming for 360 Video.
1 INTRODUCTION
With the increasing demand on better user experience in inter-
active applications, virtual reality (VR) techniques have become
increasingly important nowadays. One of the most attractive ap-
plications is 360-degree panorama video (360 video). By wearing
head mounted displays (HMDs), such as Oculus Rift [3], users are
able to obtain immersive experience, feeling free to control their
orientation during video playback. To provide a good experience,
the resolution of 360 video should be 6K or even higher. However,
streaming 360 video at such resolution is not a trivial task, especially
through the Internet. Besides, only a portion of the video is used at a
time. Therefore, transmitting whole 360 video content and treating
it as ordinary video, such as the strategy of YouTube [6], results in
inevitable waste of bandwidth and computational resources. Using
Dynamic Adaptive Streaming over HTTP (DASH) [24], viewport
adaptive streaming is regarded as a promising way to deliver 360
video through the Internet. It is performed in such way that high
quality is preserved within the Field of View (FOV), i.e. viewport,
while others are delivered in low quality or even discarded.
There are mainly two categories of viewport adaptive streaming:
asymmetric panorama and tile-based. The asymmetric panorama
method [23], such as Truncated Pyramid Projection (TSP) [15]
and Facebook’s ofset cubemap [16], transforms a 360 video into
viewport-dependent multi-resolution panorama, which decreases
the overall resolution without decreasing the quality of the view-
port. This method is prevalent since it still provides 360-degree
image. But the other side of the coin is that it would waste band-
width resources because user’s viewport is limited in FOV.
Session: Fast Forward 2 MM’17, October 23–27, 2017, Mountain View, CA, USA
315
Page 2
Tile-based method is an emerging method which is more promis-
ing for viewport adaptive streaming [9ś13, 19ś21, 28]. As shown
in Fig. 1, it crops 360 video frames into multiple tiles (or blocks)
in space; then partitions and encodes the tiles into multi-bitrate
segments. The client only pre-fetches the tiles within the predicted
viewport. In tile-based HTTP adaptive streaming, the client has to
do two adaptations: rate adaptation to adapt time-varying band-
width, and viewport adaptation to cope with user’s head movement.
Although the tile-based streaming is more lexible, it is not trivial
to provide high QoE streaming service. The challenges mainly arise
from three aspects:
(1) Tiles pre-fetching error : Since the motion-to-photon latency
requirement for VR is less than 20ms [26], which is much
smaller than Internet request-reply delay. Therefore, it is
necessary to pre-fetch tiles by viewport prediction. How-
ever, it is diicult to accurately predict user’s orientation
especially for long-term prediction (> 3s) [19]. If the video
tiles that cover the new viewport is not streamed, blank
block will be rendered in screen which leads to QoE drop;
(2) Rebufering/stall under small playback bufer : Due to short-
term constraint of viewport prediction, tile-based method
should keep a small playback bufer (< 3s). How to avoid
playback rebufering/stall with small playback bufer is
challenging for streaming over harsh Internet;
(3) Border efects of mixed-bitrate tiles: Due to the spatial parti-
tion of video, the mixed-bitrate tiles could result in visible
border and quality inconsistence in combined-tiles render-
ing.
To address these challenges, in this work, we present a probabilis-
tic tile-based adaptive streaming system, namely 360ProbDASH,
that leverages probabilistic model of viewport prediction and ex-
pected quality optimization framework to maximize the quality
of viewport adaptive streaming. Speciically, for small-bufer rate
adaptation, we use a target-bufer-based rate control algorithm to
maintain playback bufer around a small target size, aiming at
avoiding rebufering. To cope with the prediction error of user’s
orientation, we propose a probabilistic model of viewport to calculate
the viewing probability of tiles. Then, we formulate a QoE-driven
optimization problem: minimizing expected quality distortion and
spatial variability of quality under the constraint of total transmis-
sion bitrate. By solving the problem, we can obtain the optimal tiles
to stream.
While details are presented in the paper, some highlights of our
contributions include the followings:
• By using a probabilistic model of viewport prediction,
360ProbDASH apparently reduces the side efects caused
by wrong head movement prediction.
• The target-bufer-based rate control algorithm in 360Prob-
DASH signiicantly reduces video playback stall for 360
video streaming with small playback bufer.
• We mathematically formulate the rate and viewport adap-
tation into an QoE-driven optimization problem. By mini-
mizing the quality distortion and spacial quality variance,
clients achieve the best QoE for 360 video streaming.
• We implement a 360ProbDASH prototype and carry out
extensive experiments on a simulation test-bed and real-
world Internet with various real user’s head movement
traces. The results demonstrate that 360ProbDASH achieves
at almost 39% gains on viewport PSNR, and 46% reduction
on spatial quality variance against the existed viewport
adaptation methods.
The rest of paper is organized as follows. Section II surveys
related works on 360 video and tile-based streaming. In Section III,
we presents the 360ProbDASH in details. Section IV described the
system implementation. Performance evaluation and comparison
is presented in Section V. Finally, Section VI concludes the paper
and outlines future directions.
2 BACKGROUND AND RELATED WORK
Panorama or 360-degree video is constructed by stitching images
from camera rigs. To play a 360-degree video, the video client,
running on an HMD or a mobile phone, requires a graphic engine
to render the video. As shown in Fig. 1, part of the panoramic
video is reprojected onto the screen according to user’s orientation
and the HMD’s FOV. Most application currently takes 360 video
as ordinary content, and delivery them with full picture, such as
widely used Equirectangular Projection (ERP) [22] and CubeMap
Projection (CMP) [18], etc. However, transmission full view of 360
video in such format requires high bandwidth. Hence, viewport
adaptive streaming is proposed to save transmission bandwidth
which can be classiied into two categories: asymmetric panorama-
based streaming and tile-based streaming.
For asymmetric panorama-based streaming, a 360 video is trans-
formed and encoded into several versions towards diferent per-
spectives. The asymmetric panorama contains 360-degree content
with diferent resolution. Truncated Pyramid Projection (TSP) [15]
and Facebook’s ofset cubemap [16] are the typical formats to repre-
sent asymmetric panorama, decreasing the overall bitrate without
decreasing the quality of the viewport. During the video playback,
the client requests one of the video versions according to user’s
orientation. The advantage of asymmetric panorama-based stream-
ing is that even if the client wrongly predicts the user’s orientation,
content can still be rendered in user’s viewport with low quality.
However, such scheme results in inlexible and bandwidth waste in
most cases.
In tile-based streaming, it has proven efective in domains such as
online video lectures [17] and sport [11]. In terms of 360 video, Zare
et al. [28] propose an HEVC-compliant tiles streaming approach
utilizing the motion-constrained tile sets (MCTS) for delivery 360
video. They propose that the tiles currently viewed by the user are
streamed in high resolution while the rest of the tiles are streamed
in low resolution. However, transmission whole image results in
waste of bandwidth. In [14], the authors propose a viewport adap-
tation scheme that the tiles are selected based on user’s viewport
without prediction. To better predict user’s orientation in the near
future, Feng et al. [19] propose to use bandwidth-based rate adap-
tation [8] and apply Linear Regression model to predict the user’s
orientation, and then stream only the visible portion. However, the
accuracy drops to 70% when predicting the user’s orientation in
the future 2 seconds. As a result, blank block could be rendered
Session: Fast Forward 2 MM’17, October 23–27, 2017, Mountain View, CA, USA
316
Page 3
Raw ERP Video Chunk
Encode with
different bitrates1
N
Reorganized
...
...
...
...
Tile Number
Bitrate Level
1 N
1
M
Crop into tiles
Figure 2: System Diagram of 360ProbDASH
in the user’s screen if the client requests video tiles according to
the wrong prediction result. Besides, in tile-based streaming, poor
adaptation algorithm will result in apparent border and content
quality inconsistent. In [25], the authors evaluate the perceptual
efect of mixed-resolution tiles in tile-based video with low and
medium motion. However, 60% of the participants express that they
don’t accept the quality degradation when the qualities of tiles are
within great diference. Recently, MPEG has already standardized
a new feature called Spatial Relationship Description (SRD) [7] to
support tile-based streaming of DASH. By carefully design rate
adaptation and viewport adaptation, we can leverage the tile-based
HTTP adaptive streaming to provide high user’s QoE of 360 video.
3 SYSTEM MODEL AND DESIGN
In this section, we present our probabilistic tile-based adaptive
streaming system 360ProbDASH, that leverages probabilistic model
of viewport prediction and expected quality optimization frame-
work to maximize the quality of viewport adaptive streaming.
In tile-based HTTP adaptive streaming, a raw panoramic video
in ERP format is temporally divided into several video chunks with
same duration. As illustrated in Fig. 2, then for each chunk, it is
spatially cropped into N tiles which are indexed in raster-scan
order. Besides, each tile is encoded into segments with M kinds
of bitrate levels versions. Consequently, there are M × N optional
segments stored at the server which are ready for streaming. The
main purpose of the proposed viewport adaptation algorithm is to
determinewhich segments to be pre-fetched. Next, we formulate the
problem under a QoE-driven optimization framework and present
a probabilistic viewport adaptation model and a target-bufer-based
rate adaptation algorithm.
3.1 Problem Formulation
As shown in Fig. 2, there areM × N optional segments, where
i ∈ 1...N denotes tile sequence number and j ∈ 1...M denotes bi-trate level. We deine ri, j and di, j are the bitrate and corresponding
distortion of segment(i, j ). Let pi be the normalized viewing proba-
bility of i-th tile, such that∑Ni=1 pi = 1. In this problem, we want
to ind the set of streaming segments, X = xi, j , while xi, j = 1
denote the segment of i-th tile at j-th bitrate level is selected for
streaming and xi, j = 0 otherwise.
To maximize the quality of viewport adaptive streaming, we de-
ine two QoE functions: 1) expected distortionΦ(X ): it denotes the
quality distortion of viewport under the consideration of viewing
probability of tiles. 2) spatial quality varianceΨ (X ): it represents
the quality smoothness in a viewport.
Our objective is to minimize the weighted distortion of these two
QoE functions where η is the weight for spatial quality variance.
Therefore, our optimization problem can be formulated as:
minX
Φ(X ) + η ·Ψ (X )
s.t.
N∑
i=1
M∑
j=1
xi, j · ri, j ≤ R,
M∑
j=1
xi, j ≤ 1, xi, j ∈ 0, 1, ∀i .
(1)
The irst constraint in the optimization problem restricts the to-
tal bitrate of selected segments. To avoid playback stall, we set a
transmission bitrate budget R which is calculated from our target-
bufer-based rate control algorithm. Then, the second constraint
gives the restriction on xi, j . Obviously, it only needs to select at
most one bitrate level of each tile.
By solving the optimization problem (1), the 360ProbDASH can
select the segments to provide high user’s QoE.
3.2 Expected Viewport Distortion and Variance
In this subsection, we present the calculation of expected view-
port distortion and spatial quality variance in the optimization
problem. We should take the sphere-to-plane mapping and viewing
probability of tiles into consideration.
3.2.1 Spherical Distortion of segment. In 360 video, it usually
uses S-PSNR [27] to evaluate the quality which is calculated via
Mean Squared Error (MSE) of points on sphere. In our work, di, jindicates the MSE corresponding to segment(i, j ).
(a) plane (b) sphere
Figure 3: Spherical Mapping of Tiles
Session: Fast Forward 2 MM’17, October 23–27, 2017, Mountain View, CA, USA
317
Page 4
-60 -40 -20 0 20 40 600
5
10
15
20
25
°
Prediction Error Gaussian distribution in Yaw
-60 -40 -20 0 20 40 60
Fre
qu
en
cy
Prediction Error (degree)
25
20
15
10
5
0
(a) Yaw
-60 -40 -20 0 20 40 60
Fre
qu
en
cy
Prediction Error (degree)
40
35
30
25
20
15
10
5
0-60 -40 -20 0 20 40 600
5
10
15
20
25
30
35
40
°
Prediction Error Gaussian distribution in Pitch
(b) Pitch
-40 -30 -20 -10 0 10 20 30 40
Fre
qu
en
cy
Prediction Error (degree)
45
40
35
30
25
20
15
10
5
0-40 -30 -20 -10 0 10 20 30 400
5
10
15
20
25
30
35
40
45
°
Prediction Error Gaussian distribution in Roll
(c) Roll
Figure 4: The distribution of prediction error.
The overall spherical distortion of a segment is the sum of dis-
tortion over all pixels the segment covers. Therefore, it is required
to calculate a tile’s corresponding spherical area. This is because, as
shown in Fig.3, even if tiles have same area in plane, their corre-
sponding area on sphere are not the same.
We deine the plane coordinates of i-tile as h ∈ [hi ,hi + ∆h] andw ∈ [wi ,wi + ∆w] where ∆h and ∆w are the height and width of a
tile. According to the projection function of ERP [4], its correspond-
ing spherical coordinates is φ ∈ [φi ,φi + ∆φ] and θ ∈ [θi ,θi + ∆θ ].The polar angle φi (latitude), azimuthal angle θi (longitude) and
their variations are calculated as:
φi =π
2− hi ·
π
H, ∆φ = ∆h · π
H,
θi = wi ·2π
W, ∆θ = ∆w · 2π
W,
(2)
where H andW are the height and width of the 360 video in ERP
format. Then, the spherical area of i-th tile is calculated as:
si =
"Ωi
RdφR cosφdθ
= ∆θR2[sin(φi + ∆φ) − sinφi ],(3)
where R is the radius of the sphere, such that R =W /2π . Hence,the overall spherical distortion of segment(i, j ) is calculated as:
Di, j = di, j · si . (4)
3.2.2 Expected Viewport Distortion and uality Variance. Let pidenotes the viewing probability of i-th tile. The Expected Viewport
Distortion and Spatial Quality Variance should be:
Φ(X ) =
∑Ni=1
∑Mj=1 Di, j · xi, j · pi
∑Ni=1
∑Mj=1 xi, j · si
,
Ψ (X ) =
∑Ni=1
∑Mj=1 xi, j · pi · (Di, j − si ·Φ(X ))2
∑Ni=1
∑Mj=1 xi, j · si
.
(5)
3.3 Probabilistic Model of Viewport
In 360ProbDASH, we need to pre-fetch segments by predict-
ing viewport. However, the prediction may be inaccurate which
will lead to viewport deviation. Hence, in viewport adaptation, we
propose a probabilistic model to predict viewport.
3.3.1 Linear Regression Prediction of Orientation. We denote the
user’s orientation (Euler angle), as yaw (α ), pitch (β) and roll (γ ) and
leverage Linear Regression (LR) model to do prediction. We denote
t0 as the current time of system. By using the historical samples
in window (t0 − 1, t0], we apply Least Square Method (LSM) to
calculate the trends of head movements. We denote the slope over
yaw, pitch and roll asmα ,mβ andmγ . Therefore, the estimated
value of yaw, pitch and roll at time of t0 + δ can be predicted using
Linear Regression model as:
α (t0 + δ ) =mαδ + α (t0),
β (t0 + δ ) =mβδ + β (t0),
γ (t0 + δ ) =mγ δ + γ (t0).
(6)
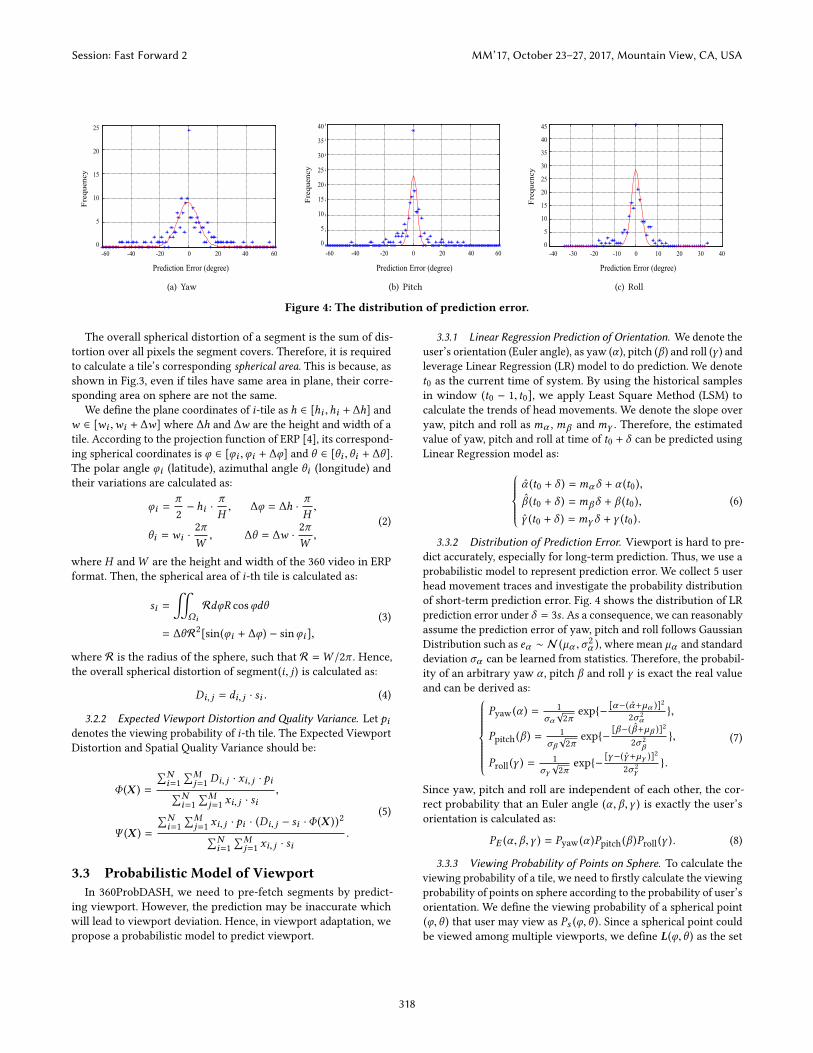
3.3.2 Distribution of Prediction Error. Viewport is hard to pre-
dict accurately, especially for long-term prediction. Thus, we use a
probabilistic model to represent prediction error. We collect 5 user
head movement traces and investigate the probability distribution
of short-term prediction error. Fig. 4 shows the distribution of LR
prediction error under δ = 3s . As a consequence, we can reasonably
assume the prediction error of yaw, pitch and roll follows Gaussian
Distribution such as eα ∼ N (µα ,σ2α ), where mean µα and standard
deviation σα can be learned from statistics. Therefore, the probabil-
ity of an arbitrary yaw α , pitch β and roll γ is exact the real value
and can be derived as:
Pyaw (α ) =1
σα√2π
exp− [α−(α+µα )]22σ 2
α,
Ppitch (β ) =1
σβ√2π
exp− [β−(β+µβ )]2
2σ 2β
,
Proll (γ ) =1
σγ√2π
exp− [γ−(γ+µγ )]22σ 2
γ.
(7)
Since yaw, pitch and roll are independent of each other, the cor-
rect probability that an Euler angle (α , β ,γ ) is exactly the user’s
orientation is calculated as:
PE (α , β,γ ) = Pyaw (α )Ppitch (β )Proll (γ ). (8)
3.3.3 Viewing Probability of Points on Sphere. To calculate the
viewing probability of a tile, we need to irstly calculate the viewing
probability of points on sphere according to the probability of user’s
orientation. We deine the viewing probability of a spherical point
(φ,θ ) that user may view as Ps (φ,θ ). Since a spherical point could
be viewed among multiple viewports, we deine L(φ,θ ) as the set
Session: Fast Forward 2 MM’17, October 23–27, 2017, Mountain View, CA, USA
318
Page 5
Figure 5: Dynamics of small playback bufer.
of user’s orientations from which point (φ,θ ) can be seen. Thus,
the viewing probability of a spherical point Ps (φ,θ ) equals to the
average probability of orientations in L(φ,θ ) as:
Ps (φ,θ ) =1
|L(φ,θ ) |∑
(α,β,γ )∈L(φ,θ )PE (α , β ,γ ), (9)
3.3.4 Viewing Probability of Tiles. At last, the viewing proba-
bility of a speciic tile, i.e. pi , can be calculated by averaging the
probability of spherical points contained in the tile. LetUi denote
the set of spherical points corresponding to i-th tile. Thus, the
viewing probability of i-th tile is:
pi =1
|Ui |∑
(φ,θ )∈Ui
Ps (φ,θ ). (10)
3.4 Target-Bufer-based Rate Control
Since long-term head movement prediction results in high pre-
diction error, it is not able to employ a large playback bufer to
smooth bandwidth variation. Aiming at providing continuous play-
back under a small bufer, we propose a target-bufer-based rate
control algorithm.
Fig. 5 shows the dynamics of small playback bufer in the client.
The bufer occupancy is generally tracked in seconds of video. We
group a set of segments with same timestamps as one chunk stored
in the bufer. At adaptation step k , we deine bk as the bufer occu-
pancy when the k-th set of segments are downloaded completely.
We denote the total bitrate as Rk and the average bandwidth as Ck .
Therefore, the bufer occupancy when inishing downloading the
segments is calculated as:
bk = bk−1 −Rk ·TCk
+T . (11)
If wewant to prevent rebufering, the bufermust be controlled to
avoid running out of chunks. Due to the small bufer constraint, we
set a target bufer level Btarget to ensure continuous playback. We
prefer to let the bufer occupancy stay at Btarget, that is bk = Btarget.
Combined with Eq. (11), the total bitrate of selected segment should
satisfy:
Rk =CkT· (bk−1 − Btarget +T ), (12)
where Ck is network bandwidth which can be estimated from his-
toric segments downloading. We set a lower bound Rmin to R. Then,
we can modify Eq. (12) into Eq. (13):
Rk = maxCkT· (bk−1 − Btarget +T ),Rmin. (13)
The bitrate calculated from Eq. (13) is used as the total bitrate budget
constraint in our optimization problem (1).
4 IMPLEMENTATION
To evaluate the performance of 360ProbDASH, we have imple-
mented a prototype. We present the implementation details in this
section. The system architecture is shown in Fig. 6 which contains
several key components.
4.1 Server Implementation
As shown in Fig. 6, in the server side, a 360 video should be
processed and stored at a HTTP server. It contains the following
key components:
(1) Video Cropper: It spatially crops the video frames into a
desired number of tiles. This module also can be integrated
to video encoder by modifying encoder.
(2) Encoder: This module partitions and encodes each tile into
multiple bitrate segments.
(3) MPD Generator: MPD is an XML document containing
information about media segments. To support tile-based
streaming, we add SRD to describe the spatial relationship
of segments. Speciically, in Representation element, we
add longitude and latitude attribute corresponding to the
representation. Besides, we add quality distortion attribute
and size attribute of each segment in order to support our
proposed 360ProbDASH to do adaptation.
(4) Apache HTTP Server: The HTTP server stores media seg-
ments and corresponding MPD. It provides 360ProbDASH
service to the clients.
4.2 Client Implementation
We implement the video player based on the open source project
dash.js [1], which is a DASH-compliant video player in JavaSript.
To support our 360ProbDASH, we integrate additional modules into
the adaptation algorithm of dash.js, namely:
(1) QoE-driven Optimizer: This module determines the op-
timal segments to download which are involved in the
HTTP GET requests. It takes the output of Target-bufer-
based Rate Controller module, Viewport Probabilistic Model
module and QR Map module.
(2) Target-bufer-based Rate Controller: To avoid playback
stall, we need to control the bufer stay at a target level.
Thus, this module calculates the total transmission bitrate
budget of segments according to Eq. (13) which takes the
output of Bandwidth Estimation module.
(3) Viewport Probabilistic Model: This module calculates the
viewing probability of each tile considering the user’s ori-
entation prediction error. It takes the output of Orientation
Prediction module and SRD information and calculates the
result according to Eq. (10).
(4) QR Map: This module generates a quality-rate (QR) map
for all segments according to the attributes in MPD.
(5) Bandwidth Estimation: We can record the download dura-
tion of segments and then obtain the corresponding time-
varying throughput. This can be achieved by the onProgress
callback of the standard XMLHttpRequest API of the web
Session: Fast Forward 2 MM’17, October 23–27, 2017, Mountain View, CA, USA
319
Page 6
Bandwidth Estimation
User Head
Positon
QoE-driven Optimizer
Target Buffer-based
Rate Controller
Viewport Probabilistic
Model
Orientation Prediction
QR
Map
360ProbDASH Player HTTP Server
Video Cropper
Encoder
segment
segment
segment segment
. . .
MPD
<xml>
. . .
SRD
size
quality
. . .
</xml>
HTTP GET
Internet
Media Content
Media Content
segment
MPD
360 Video Source
Figure 6: System Architecture
browser. Since the bandwidth estimation is not the key
point of this paper, we just use the average result of previ-
ous 3 seconds.
(6) Orientation Prediction: The monitoring of user’s orienta-
tion can be achieved by the DeviceOrientation callback of
the standard Web API. Then, we apply Linear Regression
model to predict the user’s orientation.
In addition, to play 360 videos, we develop a graphic engine as a
player wrapper based onWeb Graphics Library (WebGL). Therefore,
the user can watch 360 video through our 360ProbDASH.
5 PERFORMANCE EVALUATION
To evaluate the performance of 360ProbDASH, we carry out
extensive simulation experiments and real-world Internet exper-
iments under various head movement traces and network condi-
tions.
5.1 Setup
In the experiments, we imitate user’s head motion by embedding
real user’s head movement trace into the player and actively ma-
nipulate the network conditions to observe how diferent schemes
react to the network luctuations. Speciically, we examine the per-
formance on video sequence and 5 user’s head movement traces
on this video, which are generously provided by AT&T [19]. The
sequence is about 3 minutes long with the resolution 2880×1440 inERP format. We chop it into small chunks with a constant duration
of 1 second (T = 1). Then, for each chunk, we further partition it
into 6x12 tiles (N = 72). The bitrate levels of each segment are set
as 20kbps, 50kbps, 100kbps, 200kbps, 300kbps. The video codec is
the widely used open source encoder x264 [5]. All video segments
are packaged by the tool MP4Box [2]. It is worth noting that the
exact size of each segment could be diferent from its coding rate,
especially for the chunks with short duration. To avoid its impacts
on rate adaptation, we also include segment size into MPD ile. At
the client, the bufer size is set to Bmax = 3s. The target bufer level
is set to Btarget = 2.5s and Rmin is set to 200kbps. The weight in our
objective function is set to η = 0.0015 which shows a good trade-of
between expected quality and spatial variance in quality. We use 5
head movement traces apart from the test head movement traces as
the training set, on which we train the parameters in the Gaussian
Distribution of prediction error. The result is:
Table 1: Gaussian Distribution Settings
Yaw Pitch Roll
µα = −0.54, σα = 7.03 µβ = 0.18, σβ = 2.55 µγ = 2.16, σγ = 0.15
To validate the eiciency of the proposed 360ProbDASH, we se-
lect three typical 360 video streaming methods as the comparisons:
• ERP: Its format is same as ordinary video. This method is
widely developed on Internet, such as YouTube [6].
• Tile: It only requests tiles corresponding to the user’s cur-
rent viewport, such as in [14]. But it doesn’t apply any
viewport prediction algorithm. This is the baseline method
of tile-based streaming.
• Tile-LR: This tile-basedmethod [19] uses Linear Regression
to predict future viewport and requests corresponding tiles.
The bitrate of each tile is allocated equally.
In performance comparison, we take the following measurement
metrics into consideration:
• Stall Ratio: This metric represents the playback continuity
which calculates the percentage of the duration of stall
over the total video streaming time.
• Viewport PSNR (V-PSNR) [27]: This metric directly indi-
cates the quality of content in the user’s viewport.
• Spatial Quality Variance: If the quality of content is not
smooth, it will decrease the user’s QoE [25]. We calculate
this value according to the coeicient of variation (CV) of
quality of content in the viewport.
• Viewport Deviation: Blank block may be rendered on the
screen if the viewport adaptation algorithm picks wrong
tiles. This metric calculates the percentage of the blank
area over the viewport area.
5.2 Playback Continuity and Bitrate
In the simulation experiments, we actively manipulate the net-
work conditions to evaluate the performance of playback continu-
ity and downloading bitrate under ixed bandwidth and long-term
bandwidth variations.
Session: Fast Forward 2 MM’17, October 23–27, 2017, Mountain View, CA, USA
320
Page 7
Time (sec)
0 30 60 90 120
Ch
un
k's
Bit
rate
(k
bp
s)
0
500
1000
1500
2000
Bandwidth ERP Tile Tile-LR 360ProbDASH
(a) Fixed Bandwidth: 2Mbps
Time (sec)
0 30 60 90 120
Ch
un
k's
Bit
rate
(k
bp
s)
0
1000
2000
3000
Bandwidth ERP Tile Tile-LR 360ProbDASH
(b) Varying Bandwidth: 1-3Mbps
Figure 7: Bitrate under Diferent Network Conditions
Fig.7(a) shows the bitrate of total requested segments per second
under ixed bandwidth (2Mbps) scenario. For the three comparison
methods of ERP, Tile and Tile-LR, the bitrate of tiles is adapted by
estimated bandwidth. For Tile and Tile-LR schemes, the bitrate of
tiles is allocated equally and quantized according to the discrete
available bitrate. As a consequence, the total bitrate of segments is
lower than the available bandwidth which results in low bandwidth
utilization. On the contrast, 360ProbDASH allocates the total bitrate
to tiles by their weight according to our QoE optimizer. Thus, it
eliminates the efects of bitrate quantization.
Fig. 7(b) demonstrates the performance under log-term band-
width variations (1Mbps→3Mbps per 20s). The chunk’s bitrate of
ERP is at a low level since bitrate quantization. Besides, we can
observe that both Tile, Tile-LR and 360ProbDASH can react to band-
width changes timely. But 360ProbDash achieves higher bitrate
because of the proposed target-bufer-based rate control algorithm
and probabilistic viewport adaptation.
Table 2 summarizes average bandwidth utilization (Bw. Utiliz.)
and playback stall ratio. We can see that 360ProbDASH achieves the
highest bandwidth utilization. Besides, it decides the total bitrate
according to bufer occupancy and estimated bandwidth which can
avoid playback stall efectively. On the contrast, ERP, Tile and Tile-
LR adapts bitrate only based on historical bandwidth, they could
overestimate the network capacity which leads to playback stall
under a small bufer.
5.3 Viewport Quality and Spatial Variance
In the simulation experiments, we evaluate the metrics of V-
PSNR and spatial quality variance under real head movement traces.
The bandwidth through these tests is ixed at 2Mbps.
The average V-PSNR among the head movement traces is shown
in Fig. 8. All tile-based schemes achieves higher V-PSNR than ERP.
This echoes the conclusion that tile-based method is more eicient
Table 2: Bandwidth Utilization and stall
Alg.Bandwidth=2Mbps Bandwidth=1-3Mbps
Bw. Utiliz. (%) Stall (%) Bw. Utiliz. (%) Stall (%)
ERP 74.45 0 64.89 10.93
Tile 80.44 0 64.27 1.33
Tile-LR 79.69 0 66.06 1.27
360ProbDASH 97.51 0 93.55 0
Trace 1 Trace 2 Trace 3 Trace 4 Trace 5
V-P
SN
R (
dB
)
0
10
20
30
40ERP Tile Tile-LR 360ProbDASH
Figure 8: Average V-PSNR
Trace 1 Trace 2 Trace 3 Trace 4 Trace 5
Qual
ity V
aria
nce
0
0.5
1
1.5
2
2.5ERP Tile Tile-LR 360ProbDASH
Figure 9: Average Spatial
Quality Variance
in 360 video streaming with less bandwidth waste. Besides, the
proposed 360ProbDASH achieves the highest viewport quality since
we obtain the optimal bitrate of tiles considering its bitrate-quality
relationship under probabilistic model.
Fig. 9 compares the spatial quality variance of diferent methods.
Our proposed approach has the most smooth quality variance in
viewport. This is because, we design the optimization problem to
minimize the spatial quality variance. The ERP also has a small
variance in quality since it requests whole 360 content in the same
one frame which smooth the quality to some extent.
Fig. 10 shows the viewport deviation ratio plotted against time.
Due to the space limitation, we only show the result on three traces.
The viewport deviation can represent the user’ head prediction error
to an extent. Obviously, ERP request the full view of 360 videowhich
result in zero blank area ratio. We can see that the blank area can
be more than 40% in non-prediction method Tile. It will deinitely
decrease user’s QoE. Our proposed scheme outperforms the Tile
and Tile-LR schemes, since we take the probability of prediction
error into consideration which results in almost no blank area.
Table 3: Performance Comparison and Our Improvement
Metrics ERP Tile Tile-LR 360ProbDASH
V-PSNRValue (dB) 24.45 31.16 32.38 34.06
Relative Imp. +39.3% +9.31% +5.19% -
Spacial Quality Value (CV) 1.05 1.89 1.81 0.97
Variance Relative Imp. +8.25% +48.67% +46.41% -
Viewport Value (%) 0 3.62 0.96 0.13
Deviation Absolute Imp. -0.13% +3.49% +0.83% -
Table 3 summarizes the performance results and improvement
(Imp.) of 360ProbDASH over the three comparison methods. Our
proposed 360ProbDASH achieves 39.3% V-PSNR improvement at
most, and 46.41% quality variance reduction compared to Tile-LR
which is the tile-based method with viewport prediction. This vali-
dates the proposed 360ProbDASH is able to achieve better V-PSNR
with smooth spatial quality. Besides, the viewport deviation ratio
of 360ProbDASH is the smallest among all tile-based schemes.
Session: Fast Forward 2 MM’17, October 23–27, 2017, Mountain View, CA, USA
321
Page 8
Time (sec)
0 30 60 90 120
Vie
wp
ort
Dev
iati
on
(%
)
0
20
40
60
ERP
Tile
Tile-LR
360ProbDASH
(a) Trace 1
Time (sec)
0 30 60 90 120
Vie
wp
ort
Dev
iati
on
(%
)
0
20
40
60
ERP
Tile
Tile-LR
360ProbDASH
(b) Trace 2
Time (sec)
0 30 60 90 120
Vie
wp
ort
Dev
iati
on
(%
)
0
20
40
60
ERP
Tile
Tile-LR
360ProbDASH
(c) Trace 3
Figure 10: Viewport Deviation under Diferent User’s Head Movement Traces
Chunk Bitrate (kbps)
0 1000 2000 3000 4000 5000
CD
F
0
0.2
0.4
0.6
0.8
1
Tile
Tile-LR
360ProbDASH
(a) CDF of Total Request Segment Bitrate
V-PSNR (dB)
10 20 30 40 50
CD
F
0
0.2
0.4
0.6
0.8
1
Tile
Tile-LR
360ProbDASH
(b) CDF of V-PSNR of Request Segment
Viewport Deviation (%)
0 20 40 60 80 100
CD
F
0
0.2
0.4
0.6
0.8
1
Tile
Tile-LR
360ProbDASH
(c) CDF of Viewport Deviation of Request Segment
Figure 11: Internet Experiment results
5.4 Real-world Experiments over Internet
To further evaluate the performance under severe network condi-
tions, we conduct a series of experiments over real-world Internet.
An Apache HTTP Server is setup in Hong Kong, and a client is
located at a campus in Beijing. They are connected through Inter-
net links. Due to the fact that Internet bandwidth is time-varying,
we run the three tile-based methods sequentially (Tile, Tile-LR,
360ProbDASH) and repeat them for 10 rounds. In each two rounds,
we import the same head movement trace into the client for difer-
ent methods. Thus, 5 head movement traces are used throughout
the entire experiments. The performances are illustrated in Fig. 11.
As shown in Fig. 11(a), our proposed 360ProbDASH can improve
the video bitrate and bandwidth utilization. This is because we use
target-bufer-based control to decide the total bitrate budget and
allocate them to tiles by weight according to our QoE-driven opti-
mizer. On the contrast, Tile and Tile-LR sufer from low bandwidth
utilization because of bitrate quantization.
As illustrated in Fig. 11(b), during 80% time, the proposed 360Prob-
DASH achieves 3-5dB V-PSNR gain compared to other methods.
This demonstrates that the probabilistic model viewport predic-
tion has improved viewport quality signiicantly. The results that
Tile-LR’s PSNR is higher than that of Tile also validate the efect of
viewport prediction.
Fig. 11(c) compares the accuracy of viewport prediction. Tile-LR
is better than Tile since it predicts the user’s orientation in the near
future. The proposed 360ProbDASH takes the prediction error into
consideration which has the lowest viewport deviation ratio among
the three tile-based schemes. Therefore, our probabilistic model
can avoid missing tiles to a great extent.
6 CONCLUSIONS
Tile-based HTTP adaptive streaming is a promising way to de-
liver 360 video through the Internet. However, it invokes problem of
pre-fetching tiles error, playback stall and border of mixed-bitrate
tiles. In this work, we propose a probabilistic tile-based adaptive
streaming system, called 360ProbDASH. In rate adaptation, it ap-
plies a target-bufer-based control algorithm to ensure continuous
playback within small bufer. In viewport adaptation, it constructs a
probabilistic model to copewith the viewport prediction error. Then,
we formulate a QoE-driven optimization problem: minimizing ex-
pected quality distortion of tiles and spatial variability of quality
under the constraint of total transmission bitrate. We implement a
360ProbDASH prototype and carry out extensive experiments on a
simulation test-bed and real-world Internet with various real user’s
head movement traces. Our approach outperforms other methods
in V-PSNR, spatial quality smoothness and playback continuity. In
our future work, we plan to apply saliency model which takes the
content into account to assist viewport adaptation more precisely.
ACKNOWLEDGEMENTS
This work was supported by National Natural Science Founda-
tion of China under contract No. 61471009 and Culture Develop-
ment Funding under Grant No.2016-288.
Session: Fast Forward 2 MM’17, October 23–27, 2017, Mountain View, CA, USA
322
Page 9
REFERENCES[1] dash.js. https://github.com/Dash-Industry-Forum/dash.js/wiki.[2] MP4Box. https://gpac.wp.mines-telecom.fr/mp4box/.[3] Oculus Rift. https://www.oculus.com/rift/.[4] Omnidirectional Media Application Format (OMAF). http://mpeg.chiariglione.
org/standards/mpeg-a/omnidirectional-media-application-format.[5] x264. http://www.videolan.org/developers/x264.html.[6] YouTube Live in 360 Degrees Encoder Settings. https://support.google.com/
youtube/answer/6396222.[7] ISO/IEC 23009-1:2014/Amd 2:2015. Spatial Relationship Description, Generalized
URL Parameters and Other Extensions.[8] S. Akhshabi, A. C. Begen, and C. Dovrolis. 2011. An Experimental Evaluation of
Rate-adaptation Algorithms in Adaptive Streaming over HTTP. In Proceedingsof the second annual ACM Conference on Multimedia Systems (MMSys). ACM,157ś168.
[9] Gene Cheung, Zhi Liu, Zhiyou Ma, and Jack ZG Tan. 2017. Multi-StreamSwitching for Interactive Virtual Reality Video Streaming. In arXiv preprintarXiv:1703.09090.
[10] Lucia D’Acunto, Jorrit van den Berg, Emmanuel Thomas, and Omar Niamut.2016. Using MPEG DASH SRD for Zoomable and Navigable Video. In Proceedingsof the 7th International Conference on Multimedia Systems (MMSys). ACM, 34.
[11] Vamsidhar Reddy Gaddam, Michael Riegler, Ragnhild Eg, Carsten Griwodz, andPål Halvorsen. 2016. Tiling in Interactive Panoramic Video: Approaches andEvaluation. IEEE Transactions on Multimedia (TMM) 18, 9 (2016), 1819ś1831.
[12] Mohammad Hosseini. 2017. View-aware Tile-based Adaptations in 360 VirtualReality Video Streaming. In IEEE Virtual Reality (VR). IEEE, 423ś424.
[13] Mohammad Hosseini and Viswanathan Swaminathan. 2016. Adaptive 360 VRVideo Streaming: Divide and Conquer. In 2016 IEEE International Symposium onMultimedia (ISM). IEEE, 107ś110.
[14] Masayuki Inoue, Hideaki Kimata, Katsuhiko Fukazawa, and Norihiko Matsuura.2010. Interactive Panoramic Video Streaming System over Restricted BandwidthNetwork. In Proceedings of the ACM International Conference on Multimedia (MM).ACM, 1191ś1194.
[15] ISO/IEC JTC1/SC29/WG11/M. 2016. VR/360 Video Truncated Square PyramidGeometry for OMAF.
[16] End-to-end Optimizations for Dynamic Streaming. https://code.facebook.com/posts/637561796428084.
[17] Mina Makar, Aditya Mavlankar, Piyush Agrawal, and Bernd Girod. 2010. Real-time Video Streaming with Interactive Region-of-interest. In IEEE InternationalConference on Image Processing (ICIP). IEEE, 4437ś4440.
[18] King-To Ng, Shing-Chow Chan, and Heung-Yeung Shum. 2005. Data Com-pression and Transmission Aspects of Panoramic Videos. IEEE Transactions onCircuits and Systems for Video Technology (TCSVT) 15, 1 (2005), 82ś95.
[19] Feng Qian, Lusheng Ji, Bo Han, and Vijay Gopalakrishnan. 2016. Optimizing 360Video Delivery over Cellular Networks. In Proceedings of the 5th Workshop onAll Things Cellular: Operations, Applications and Challenges. ACM, 1ś6.
[20] Ngo QuangMinh Khiem, Guntur Ravindra, Axel Carlier, andWei Tsang Ooi. 2010.Supporting Zoomable Video Streams with Dynamic Region-of-interest Cropping.In Proceedings of the irst annual ACM Conference on Multimedia Systems (MMSys).ACM, 259ś270.
[21] Robert Skupin, Yago Sanchez, Cornelius Hellge, and Thomas Schierl. 2016. TileBased HEVC Video for Head Mounted Displays. In 2016 IEEE International Sym-posium on Multimedia (ISM). IEEE, 399ś400.
[22] J. P. Snyder. 1993. Flattening the Earth: Two Thousand Years of Map Projections.University of Chicago Press (1993).
[23] Kashyap Kammachi Sreedhar, Alireza Aminlou, Miska M Hannuksela, and Mon-cef Gabbouj. 2016. Viewport-Adaptive Encoding and Streaming of 360-DegreeVideo for Virtual Reality Applications. In 2016 IEEE International Symposium onMultimedia (ISM). IEEE, 583ś586.
[24] ISO/IEC JTC1/SC29/WG11 W13533. 2012. MPEG DASH: The Standard for Multi-media Streaming over the Internet.
[25] Hui Wang, Vu-Thanh Nguyen, Wei Tsang Ooi, and Mun Choon Chan. 2014.Mixing Tile Resolutions in Tiled Video: A perceptual Quality Assessment. InProceedings of Network and Operating System Support on Digital Audio and VideoWorkshop (NOSSDAV). ACM, 25.
[26] Richard Yao, Tom Heath, Aaron Davies, Tom Forsyth, Nate Mitchell, and PerryHoberman. 2014. Oculus VR Best Practices Guide. Oculus VR (2014).
[27] Matt Yu, Haricharan Lakshman, and Bernd Girod. 2015. A Framework to EvaluateOmnidirectional Video Coding Schemes. In IEEE International Symposium onMixed and Augmented Reality (ISMAR). 31ś36.
[28] Alireza Zare, Alireza Aminlou, Miska M Hannuksela, and Moncef Gabbouj. 2016.HEVC-compliant Tile-based Streaming of Panoramic Video for Virtual RealityApplications. In Proceedings of the ACM International Conference on Multimedia(MM). ACM, 601ś605.
Session: Fast Forward 2 MM’17, October 23–27, 2017, Mountain View, CA, USA
323