26
362 Gulf Breeze Pkwy Suite 106 Gulf Breeze, FL 32561 LOUISIANA STATEWIDE SURVEY SURVEY RESEARCH REPORT Verne Kennedy, Ph.D. JULY 27-31, 2015
| Date post: | 25-Dec-2015 |
| Category: |
Documents |
| Upload: | scot-french |
| View: | 216 times |
| Download: | 0 times |

362 Gulf Breeze PkwySuite 106
Gulf Breeze, FL 32561
LOUISIANA STATEWIDE SURVEY
SURVEY RESEARCH REPORTVerne Kennedy, Ph.D.
JULY 27-31, 2015

PREVIEW OF JULY SURVEY One absolute in political campaigns is that change is
inevitable. 15 years of closely monitoring Louisiana Gubernatorial
campaigns shows that critical changes usually occurs two to three months from the Primary.
The major change in July was a decline in Vitter’s vote from 23% vote and 5% lean in both May and June to 15% vote and 5% lean in July. In June Vitter received 35% white vote and lean compared to 27% vote and lean in July. Of course, the August survey could show a change in the opposite direction.
All surveys have a margin of error and may vary a few percent compared to actual opinion of all voters. This 600 sample telephone survey has a 4% error factor at a ,95 level of confidence meaning 95% probability that results were within 4% compared to how all voters would have responded.
2 MRI

PREVIEW OF JULY SURVEY (2)White voters changed from June to July
regarding Vitter vote and lean combined: committed Republicans 55% to 48%, lean Republicans 45% to 34%, women 33% to 26%, Evangelicals 33% to 26% and seniors 37% to 31%.
Angelle’s media produced may have increased his Primary vote. Vote and lean whites combined giving Angelle a 5% increase between June and July.
Undecided whites declined only 2% meaning that many voters leaving Vitter went to another candidate rather than going to undecided which usually occurs before moving to another candidate.
3 MRI
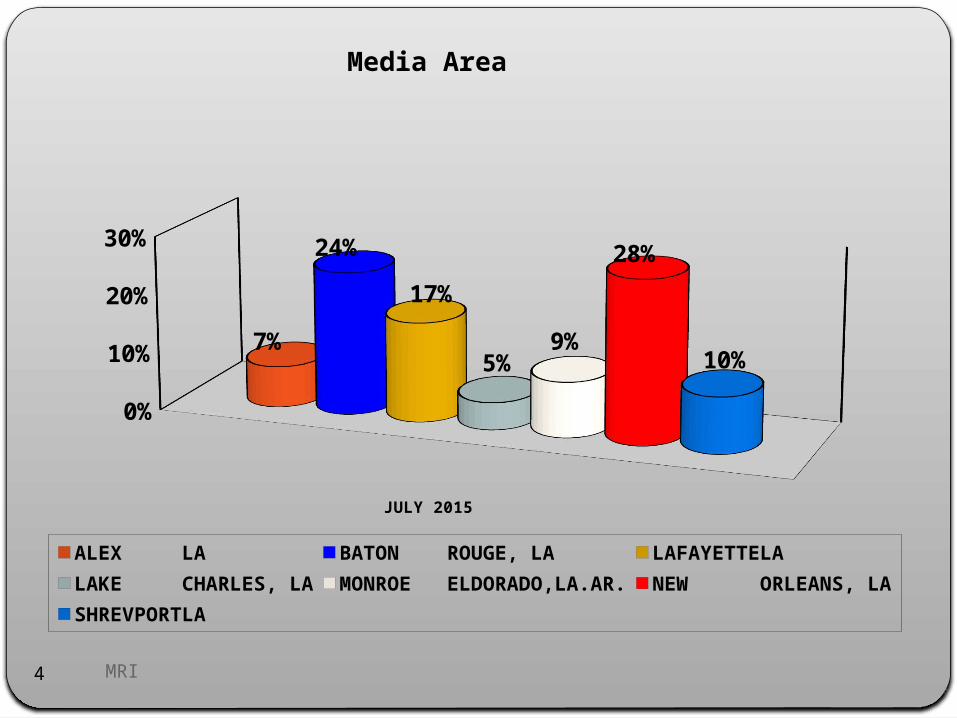
0%5%
10%15%20%25%30%
7%
24%
17%
5%9%
28%
10%
ALEX LA BATON ROUGE, LA LAFAYETTELA LAKE CHARLES, LA
MONROE ELDORADO,LA.AR. NEW ORLEANS, LA SHREVPORTLA
JULY 2015
Media Area
MRI4

27%
73%
AFRICAN AMERICAN ETHNIC MAJORITY
ETHNICITY
MRI5

0%5%
10%15%20%25%30%
22%
9%
27%
12%
27%
3%
DEM INDEP DEM COMPLET INDEPEND. INDEP REP REP NOT SURE
JULY 2015
REGARDLESS OF HOW YOU ARE REGISTERED TO VOTE, DO YOU THINK OF YOURSELF AS A REPUBLICAN, A DEMOCRAT, OR AN INDEPENDENT? (IF INDEPENDENT, ASK) DO YOU LEAN MORE TOWARD THINKING OF YOURSELF AS A REPUBLICAN OR A DEMOCRAT?
MRI6

52%
35%
12%
Chart Title
DEM REP UNAFFIL.
ACTUAL VOTER REGISTRATION
MRI7

0%5%
10%15%20%25%30%35%40%
7%11%
19%26%
37%
18-34 35-44 45-54 55-64 65+
JULY 2015
AGE
MRI8
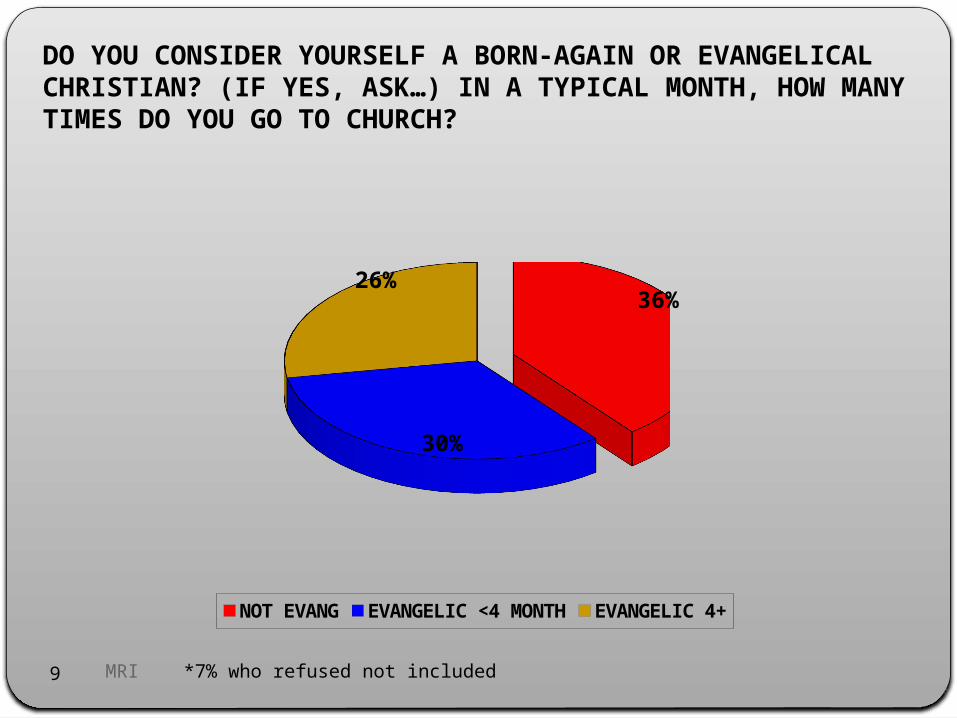
36%
30%
26%
NOT EVANG EVANGELIC <4 MONTH EVANGELIC 4+
DO YOU CONSIDER YOURSELF A BORN-AGAIN OR EVANGELICAL CHRISTIAN? (IF YES, ASK…) IN A TYPICAL MONTH, HOW MANY TIMES DO YOU GO TO CHURCH?
MRI *7% who refused not included9

0%5%
10%15%20%25%30%
7%
21%27%
22%
11%10%
<$20,000 $20,000 $39,999 $40,000 $59,999$60,000 $79,999 $80,000 $100,000 >100,000
JULY 2015
WHICH OF THE FOLLOWING CATEGORIES INCLUDES YOUR ANNUAL HOUSEHOLD INCOME? JUST STOP ME WHEN I READ THE CORRECT CATEGORY.
MRI10

44%
56%
MALE FEMALE
GENDER
MRI11

26%
74%
YES NO
CELL PHONE INTERVIEWS
MRI12

AWARNESS & OPINION OF CANDIDATESAwareness also called name recognition is
measured by asking: “As I read a list of names, please tell whether or not you are familiar with each name. If you have never heard the name just say so. (IF RECOGNIZE, ASK…) Do you have a favorable or unfavorable opinion of him/her?”
Ratios of favorable to unfavorable opinion are depicted as the number of favorable opinion voters for each unfavorable voter such as 2.0:1 meaning 2 favorable for each unfavorable voter for that candidate.

38%
7%
29%
26%
FAVOR UNFAVOR NO OPIN NOT AWARE
PUBLIC SERVICE COMMISSIONER SCOTT ANGELLE FROM LAFAYETTE.
May 60% 6.7:1 June 73% 3.3:1 July 74% 5.2:1*
MRI *Total awareness and ratios of favorable to unfavorable voters.14

30%
9%27%
34%
FAVOR VERY UNFAVORABLE NO OPIN NOT AWARE
JOHN BEL EDWARDS, A CATHOLIC DEMOCRATIC STATE REPRESENTATIVE FROM TANGIPAHOA PARISH.
May 58% 2.4:1 June 62% 2.0:1 July 66% 3.4:1
MRI15

41%
9%
27%
23%
FAVOR UNFAVOR NO OPIN NOT AWARE
LT. GOVERNOR JAY DARDENNE FROM BATON ROUGE.
Total May 80% 6.3:1 June 87% 3.8:1 July 77% 4.8:1
MRI16

39%
33%
20%
8%
FAVOR UNFAVOR NO OPIN NOT AWARE
U.S. SENATOR DAVID VITTER FROM JEFFERSON PARISH
May 96% 1.8:1 June 97% 1.4:1 July 92% 1.2:1
MRI 17

0%
5%
10%
15%
20%
25%24%
13%
20% 22%21%
ANGELLE DARDENNE BEL EDWARDS VITTER NOT SURE
JULY 2015
IF THE ELECTION FOR GOVERNOR WERE HELD TODAY, WHICH OF THE FOLLOWING WOULD YOU FAVOR: THE REPUBLICANS ARE SCOTT ANGELLE, JAY DARDENNE, AND DAVID VITTER? THE DEMOCRAT IS JOHN BEL EDWARDS?
MRI Indicates combined vote and lean responses for each candidate.18

1. SCOTT ANGELLE (R) 10% 11% 16% 2. LEAN SCOTT ANGELLE (R) 8 4 9 3. JAY DARDENNE (R) 8 8 8 4. LEAN JAY DARDENNE (R) 5 1 4 5. JOHN BEL EDWARDS (D) 15 15 14 6. LEAN JOHN BEL EDWARDS (D) 5 12 6 7. DAVID VITTER (R) 23 23 15 8. LEAN DAVID VITTER (R) 8 5 7 98. NOT SURE 16 21 21
MAY JUNE JULY
Actual Responses to Previous QuestionActual Responses:

WHY REDISTRIBUTE AFRICAN AMERICAN VOTERS
Regardless of responses, African Americans have a history of voting about 90% for Democrats and about 10% for Republicans.
The African American Redistribution slides redistribute that vote to represent historical voting behavior.
The 10% vote for Republicans is distributed based on percent vote from African Americans each candidate received.
Redistributed responses are far more accurate indicators of candidate support at time this survey was conducted.

AFRICAN AMERICAN REDISTRIBUTED
With survey error factor Edwards runs first and Vitter and Angelle are statistically tied.
YES NO
SCOTT ANGELLE (R) 21% 25%
JAY DARDENNE (R) 12 12
JOHN BEL EDWARDS (D) 34 20
DAVID VITTER (R) 21 22
UNDECIDED 12* 21
*In all redistributed tables all undecided are white voters.
21

41%
31%
29%
VITTER BEL EDWARDS NOT SURE
IN A RUN-OFF FOR GOVERNOR WOULD YOU FAVOR: REPUBLICAN DAVID VITTER OR DEMOCRAT JOHN BEL EDWARDS?
MRI Indicates combined vote and lean responses for each candidate .22

Actual Responses ALL Voters IN A RUN-OFF FOR GOVERNOR WOULD YOU FAVOR: REPUBLICAN DAVID VITTER OR DEMOCRAT JOHN BEL EDWARDS?
MAY JUNE JULY
1. DAVID VITTER (R) 32% 33% 28%
2. LEAN DAVID VITTER (R) 13 11 13
3. LEAN JOHN BEL EDWARDS (D) 11 19 16
4. JOHN BEL EDWARDS (D) 25 15 15
98. NOT SURE 19 22 29

AFRICAN AMERICAN REDISTRIBUTED
YES NO
DAVID VITTER (R) 38% 41%
JOHN BEL EDWARDS (D) 42 31
UNDECIDED 20 29
Note: With a +/- 4% error factor Edwards and Vitter are statistically tied.
24

0%5%
10%15%20%25%30%35%40%45%
28%
7%
18%
8%
40%
HOLDEN GUILLORY NUNGESSER YOUNG NOT SURE
JULY 2015
IN AN ELECTION FOR LT. GOVERNOR HELD TODAY WOULD YOU FAVOR: MELVIN “KIP” HOLDEN, A DEMOCRAT; ELBERT GUILLORY, A REPUBLICAN; WILLIAM “BILLY” NUNGESSER, A REPUBLICAN; OR JOHN YOUNG, A REPUBLICAN?
MRI25

AFRICAN AMERICAN REDISTRIBUTED
YES NO
MELVIN “KIP” HOLDEN (D) 39% 27%
ELBERT GUILLORY (R) 5 6
WILLIAM “BILLY” NUNGESSER (R) 16 17
JOHN YOUNG (R) 7 8
UNDECIDED 33 41
Note: A third of all voters (all white) are voting one third Democrat and two thirds Republican in the current survey.
26


![Gulf Coast Breeze. (Crawfordville, Florida) 1898-03-04 [p ].ufdcimages.uflib.ufl.edu/UF/00/07/59/04/00041/00317.pdf · I GULF 001811 BREEZE LOCAL 1o0v11hi-toAdvertisements Orleans](https://static.documents.pub/doc/80x56/5d335af088c9937d538ce341/gulf-coast-breeze-crawfordville-florida-1898-03-04-p-i-gulf-001811-breeze.jpg)


