Page 1
363. Fellenius, B.H., 2016. The unified design of piled
foundations. The Sven Hansbo Lecture. Geotechnics for
Sustainable Infrastructure Development – Geotec Hanoi 2016,
edited by Phung Duc Long, Hanoi, November 23-25, pp. 41-66.
Page 2
Geotechnics for Sustainable Infrastructure Development - Geotec Hanoi 2016, Phung (edt). ISBN 978-604-82-0013-8
41
Keywords: Single piles, pile groups, piled foundations, piled rafts.
ABSTRACT. The unified method for analysis of the interaction of forces and movements that governs
the settlement of a foundation supported on a single pile or on a small group of piles is presented. It is
shown that the response to loads applied to foundations supported on single piles and narrow pile groups
differ from that of foundations supported on wide pile groups and that the settlement of the wide group
can be analyzed using the simple model of an equivalent pier placed on an equivalent raft at the pile toe
level. The effect of downdrag acting along the perimeter piles of a wide pile group is indicated and
referenced to measurements. The conditions for presence of a contact stress below a pile cap and below a
wide piled raft are discussed. The recommendations of the ISSMGE TC212 for design of piled raft
foundation is quoted and the implication of the assumptions applied is highlighted.
1. SINGLE PILES AND SMALL PILE GROUPS
The unified method of design of piled foundation is
based on designing foundations considering actual
and acceptable settlements, as opposed to basing
the design on a pile "capacity" reduced by various
factors of safety or resistance factors. The unified
method is a logical method because it considers
actually occurring loads, deformations, and
movements, whereas the conventional design
means calculating forces for an ultimate condition
that supposedly will never develop. The main
approach to the unified method was proposed more
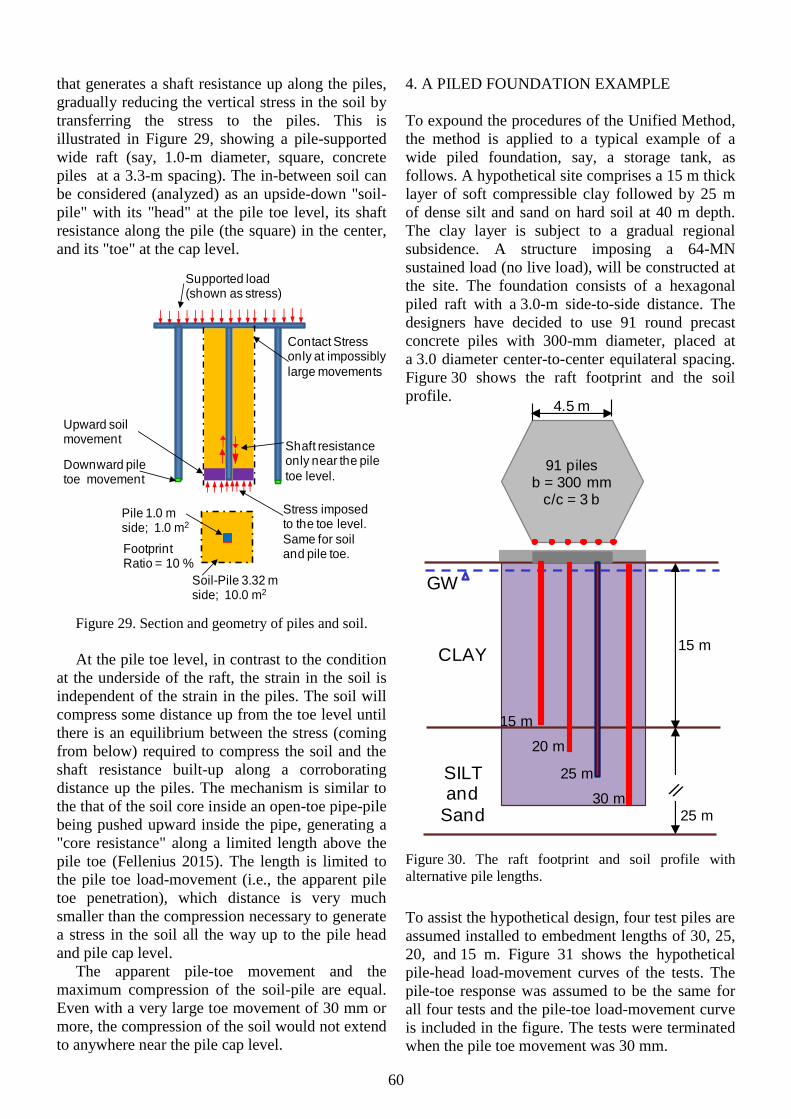
than 30 years ago (Fellenius 1984; 1988).
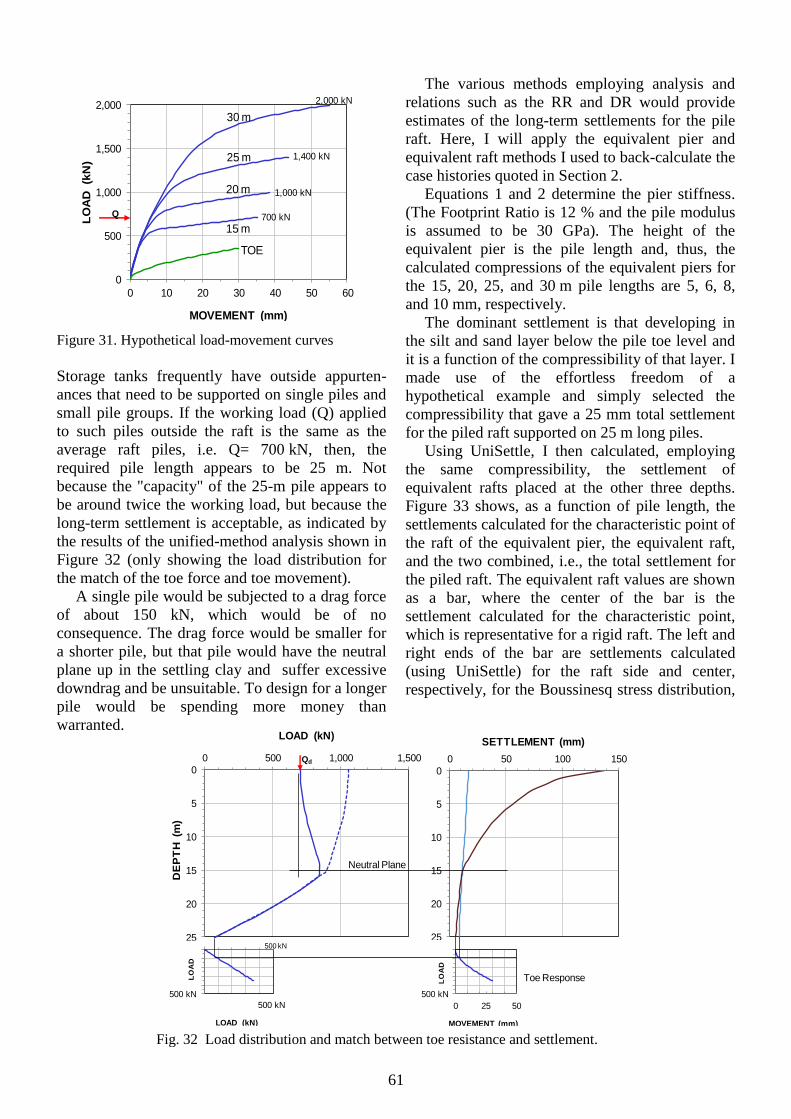
However, many have still difficultly in taking the
step from the conventional "capacity-reasoning" to
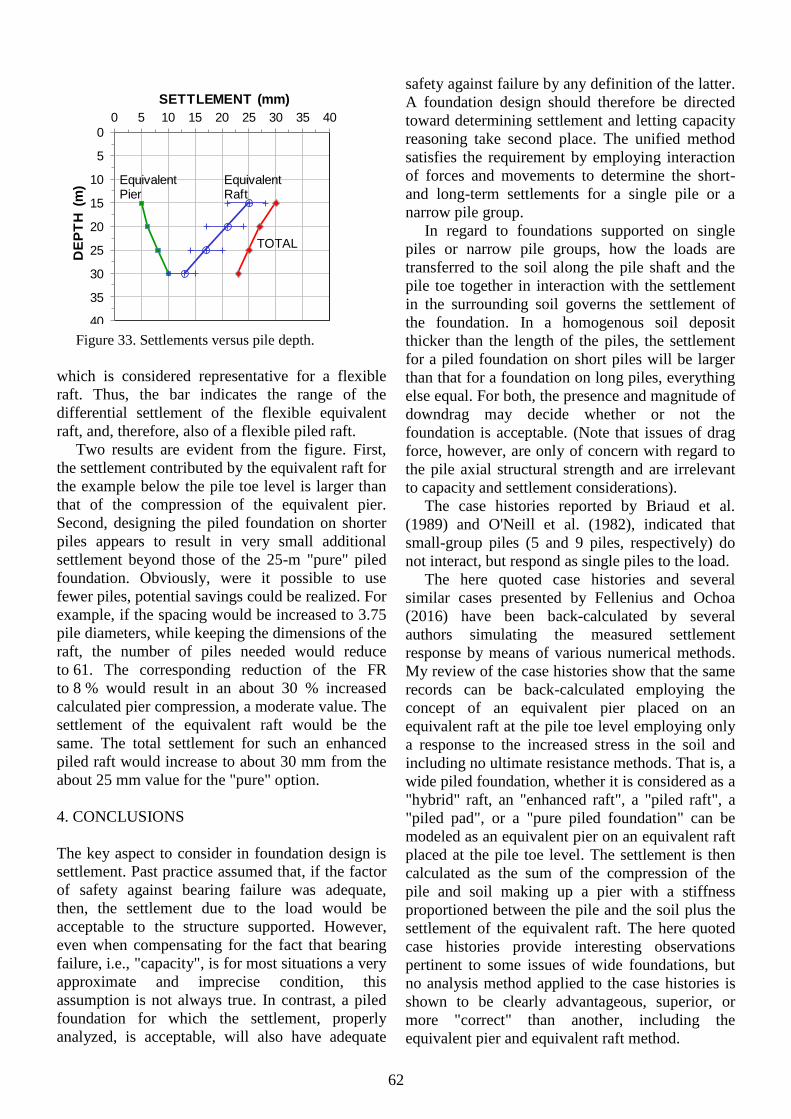
the more rational "deformation-reasoning" of the
unified method. The following notes aim to explain
the basics of the unified design.
Consider a hypothetical case of a single 300 mm
diameter, round, concrete pile installed through
25 m of clay and 5 m into an underlying sand.
Figure 1 shows typical load-movement curves
determined from a hypothetical static loading test
on the pile calculated using the UniPile software
(Goudreault and Fellenius 2014). The input data
are from Case 9 of the examples in the software
Figure 1. Typical results of a hypothetical static
loading test on the hypothetical pile.
manual, although slightly simplified. The test is
assumed to have been carried out in equal load
increments (125 kN) until large significant pile toe
movements were recorded. The pile head load-
movement curve shows the load (1,400 kN) that
corresponds to the Offset Limit and the load
(1,600 kN) that gave a 30-mm pile toe movement.
(I have found that the two load levels are useful
when comparing the response of different piles to
load). Coincidentally, the 30-mm toe movement is
Hansbo Lecture
The Unified Design of Piled Foundations
Bengt H. Fellenius, Dr. Tech., P.Eng.
Consulting Engineer, Sidney, BC, V8L 2B9, Canada.
E-mail: [email protected]
0
500
1,000
1,500
2,000
0 10 20 30 40 50 60 70
LO
AD
(k
N)
MOVEMENT (mm)
Shaf t
Toe
Offset Limit Head
Load at 30 mm toe movement
Page 3
42
also 10 % of the pile toe diameter. The load
applied to the pile head that resulted in a
movement equal to 10-% of the toe diameter is
frequently used as a definition of capacity. This
definition originates in a misconception of a
recommendation by Terzaghi (Likins et al. 2011).
The hypothetical pile is assumed to have been
instrumented for measuring the distribution of load
down the pile during the static loading test. The
hypothetically measured distributions for the
applied loads are shown in Figure 2, as calculated
using UniPile. The assumed t-z functions for the
shaft (clay and sand) and q-z function for the pile
toe are indicated. The figure also shows the
hypothetical distribution of settlement at the site
assumed to be caused by a small lowering of the
groundwater table or by a similar change of
effective stress triggering a consolidation process.
Notice that the soil below the pile toe level was
assumed sufficiently dense or stiff not to develop
any appreciable settlement due to the groundwater
table lowering or to the increase of stress from the
load transferred to the soil below the pile toe level.
The shaft resistance t-z curves represent the
shear-movement response of the soil along the pile.
Depending on piles and soil, the response in any
given case will differ from that of another case.
Responses may exhibit large and small movement
before a peak shear resistance, before continuing in
a strain-hardening, strain-softening, or plastic
mode. Normally, the shear it is not associated with
volume change, although, it is conceivable that, on
occasions, the soil nearest the pile surface can
contract or dilate due to the shear movement, with
corresponding slight effect on the single-pile t-z
curve.
At the pile toe, however, the downward
movement of the pile (per q-z function), displaces
the soil both below the pile toe level, to the side,
and—to a limited height—also up along the side of
the pile. The q-z function incorporates both effects
and the q-z curve combines the effects of soil being
displaced and the soil volume being changed due to
the shear forces that develop around the pile toe,
where both compression and dilation can occur.
The conventional approach is to determine a
"safe" working load by applying some definition of
"capacity" to the pile head load-movement curve.
(The definitions actually used in the engineering
practice for what constitutes "capacity" differ
widely). The working load is then determined by
dividing the "capacity" with a factor of safety
larger than unity or, in LRFD, multiplying it with a
resistance factor smaller than unity.
Conventionally, it is assumed that the service-
ability (settlement aspect) of the piled foundation is
ensured by this approach.
When the long-term settlement of the soil
surrounding the pile is small, the approach usually
results in a piled foundation that does not
experience adverse deformations for the applied
working load. On the other hand, when the soil, as
in the subject case, settles around the pile, a drag
force and a downdrag will develop. Some codes
and standards, e.g., the AASHTO Specs and the
EuroCode, add the calculated drag force to the
working load. When the drag force is correctly
estimated (as opposed to underestimating it, which
is a common mistake), this approach often results
in that the pile, as originally designed, will seem to
be unable to carry the desired working load and,
therefore, the design is changed to employ larger,
0
5
10
15
20
25
30
35
0 200 400 600 800 1,000 1,200 1,400 1,600 1,800
DE
PT
H (
m)
LOAD (kN)
SAND (t-z)
CLAY (t-z)
t-z and q-z curves
CLAY
SAND
0
5
10
15
20
25
30
35
0 100 200 300 400 500
DE
PT
H (
m)
SETTLEMENT (mm)
300 mm diameter, pile installed through 25 m of clay and 5 m into sand.
Long-term conditions
SAND Toe (q-z)
Figure 2. Distributions of axial load in the pile and settlement of the soil around the pile.
Page 4
43
longer piles, and/or adding piles. More enlightened
codes and standards, e.g., the Canadian Bridge
Design Code, the Australian Building Code, US
Corps of Engineers, etc., recognize that this
approach is not just ignorant, but costly, and, that it
yet does not ensure a safe foundation (Fellenius
2014a; 2016). The drag force is not the issue, the
downdrag is, and the action of the settling soil has
to be assessed in a settlement analysis.
The unified design considers the pile and soil
deformations (settlement) and recognizes the
fundamental reality that forces and movements are
related and cannot be considered separately from
each other. Thus, design of piled foundations
according to the unified method involves matching
the force and settlement interaction. A force
equilibrium is determined as the location where the
downward acting axial forces (dead load and drag
force) are equal to the upward acting forces
(positive shaft resistance below the equilibrium
depth and toe resistance). The settlement
equilibrium is determined as the location where the
pile and the soil settle equally (the direction of
shear forces along the pile changes from negative
to positive at this location). When the shaft shear
response is correctly identified, the two
equilibriums occur at the same depth, called
"neutral plane".
For the hypothetical case considered, as the
supported structure is constructed, it will introduce
a permanent working load (the dead or sustained
load), say, 600 kN. The transient (live) load for the
case is assumed to be about 100 kN. The loading
test indicates that the load transfer movement due
to the 600-kN load will be smaller than 10 mm.
The purpose of the settlement analysis per the
unified method is to determine the magnitude of
the additional settlement that will develop in the
long-term to follow the application of the load.
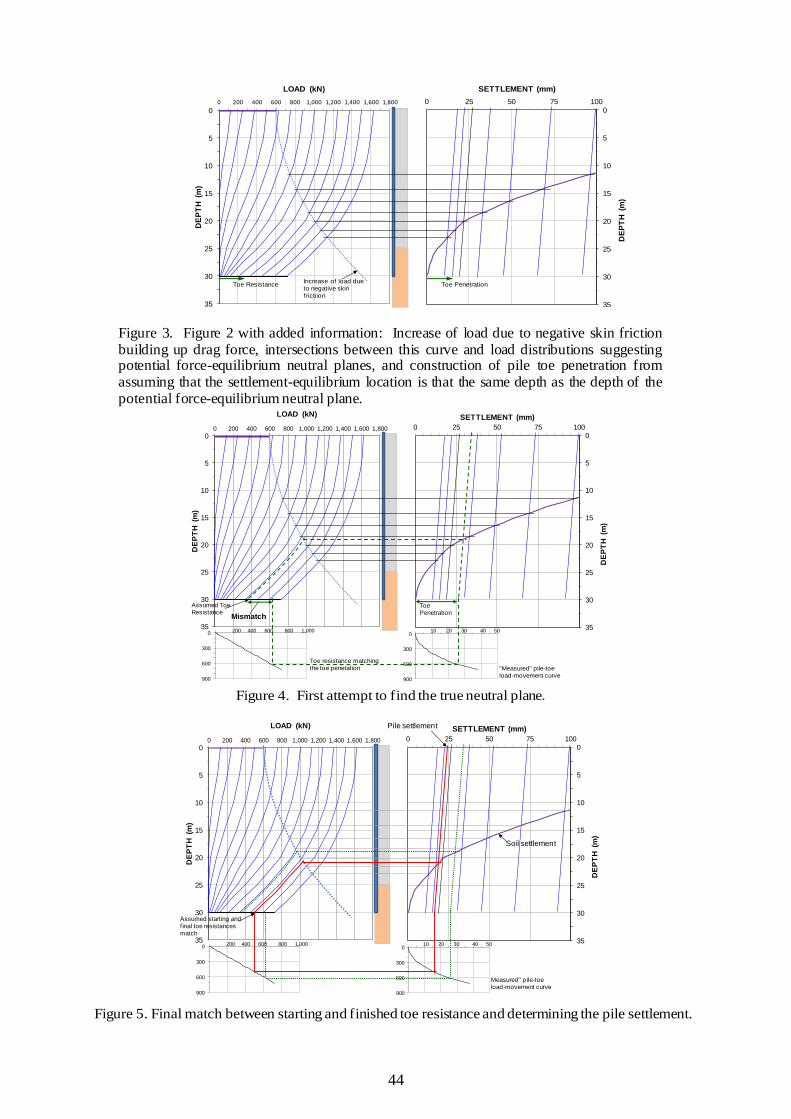
Figure 3 repeats Figure 2 and adds a curve to
the load distribution diagram labeled "Increase of
load due to negative skin friction", which mirrors
the shaft resistance reduction of axial load with
depth. The curve starts at the pile head at a load
equal to the 600-kN permanent working load for
the pile. Each intersection between the curve
labeled "Increase of load due to negative skin
friction" and the load distributions curves is a
potential force-equilibrium neutral plane. A series
of horizontal lines that intersect with the settlement
curve has been added from each such intersection
and each such intersection of these lines with the
settlement distribution is a potential settlement-
equilibrium neutral plane. At each potential
settlement-equilibrium neutral plane, a slightly
slanting line is drawn representing the pile
shortening for the axial load in the pile. At the pile
toe level, the distance between this line and the soil
settlement at the pile toe level represents the pile
toe penetration for the particular location of the
settlement-equilibrium plane. Each intersection of
the slanting lines with the line at the pile cap level
indicates the settlement of the foundation. The task
is to determine which of these would represent the
long-term settlement of the supported foundation.
The figure shows several potential locations of
force-equilibriums and settlement-equilibriums.
However, there is only one location (depth) that is
true, that is, only one location for which the pile
toe force determines a location of the force-
equilibrium that is at the same location (depth) as
the settlement-equilibrium producing a pile toe
penetration that, according to the pile toe load-
movement curve, corresponds to the pile toe force
in the load distribution diagram.
The true neutral plane location can be
determined by trial-and-error as illustrated in
Figure 4. A first-attempt toe force is assumed, and
the load distribution from this force is extended
upward to intersection with the drag force curve. A
horizontal line is then drawn to intersect with the
settlement distribution curve. If this intersection is
the settlement-equilibrium depth, then, the pile line
will determine the pile toe penetration. The
corresponding pile toe resistance is determined by
correlation with the pile toe load-movement curve.
As shown in the figure, this first-attempt resistance
does not match the originally assumed toe force,
the starting toe resistance. A new starting toe
resistance is therefore selected and the process is
repeated. After two or three attempts, a match (red
loop) is obtained as shown in Figure 5.
The purpose of matching the force-equilibrium
and settlement-equilibrium to the pile toe
movement and the pile toe force (never choose one
without the other) is to determine—predict—the
settlement of the single pile or small pile group.
There is a misconception around that the
movement measured for a specific applied load in a
static loading test directly represents the settlement
of a pile for the load. Note, however, that the static
loading test does not measure settlement, but
movement and, often, just the accumulated
compression of the pile for the applied test load. Of
course, knowing the movement response of a
single pile for an applied load, in particular the
Page 5
44
0
5
10
15
20
25
30
35
0 200 400 600 800 1,000 1,200 1,400 1,600 1,800
DE
PT
H (
m)
LOAD (kN)
0
5
10
15
20
25
30
35
0 25 50 75 100
DE
PT
H (
m)
SETTLEMENT (mm)
0
300
600
900
0
300
600
900
200 400 600 800 1,000 10 20 30 40 50
Mismatch
Toe Penetration
Assumed Toe Resistance
Toe resistance matching the toe penetation "Measured" pile-toe
load-movement curve
0
5
10
15
20
25
30
35
0 200 400 600 800 1,000 1,200 1,400 1,600 1,800
DE
PT
H (
m)
LOAD (kN)
0
5
10
15
20
25
30
35
0 25 50 75 100
DE
PT
H (
m)
SETTLEMENT (mm)
Toe PenetrationIncrease of load due to negative skin f rictiion
Toe Resistance
0
5
10
15
20
25
30
35
0 200 400 600 800 1,000 1,200 1,400 1,600 1,800
DE
PT
H (
m)
LOAD (kN)
0
5
10
15
20
25
30
35
0 25 50 75 100
DE
PT
H (
m)
SETTLEMENT (mm)
0
300
600
900
0
300
600
900
200 400 600 800 1,000 10 20 30 40 50
Assumed starting and f inal toe resistances match
Pile settlement
Soil settlement
Measured" pile-toeload-movement curve
Figure 4. First attempt to find the true neutral plane.
Figure 3. Figure 2 with added information: Increase of load due to negative skin frictionbuilding up drag force, intersections between this curve and load distributions suggestingpotential force-equilibrium neutral planes, and construction of pile toe penetration fromassuming that the settlement-equilibrium location is that the same depth as the depth of thepotential force-equilibrium neutral plane.
Figure 5. Final match between starting and finished toe resistance and determining the pile settlement.
Page 6
45
pile-toe load-movement, is a vital part of
determining the settlement for that pile, as
illustrated in the forgoing.
The analysis shown in Figure 5 produced a
calculated pile head long-term settlement of about
25 mm, which is satisfactory for most piled
foundations. Depending on the height of the
transition zone (transition from negative to positive
shaft shear directions), the drag force will amount
to about 350 through 400 kN. It will prestress the
pile and it will essentially be a beneficial load. The
maximum axial load at the neutral plane will be
about 1,000 kN, which is well within the pile
structural strength. When, as in this case, the loads
from the supported structure also includes transient
(live) loads (here 100 kN), these will just replace a
similar magnitude of drag force. There will be a
small pile shortening, but it is recovered when the
live load is gone and does not add to the long-term
settlement.
For a single pile, the portion of load reaching
the pile toe influences only a small volume of soil,
and its compression due to the increased stress is
included in the pile-toe load-movement response,
the q-z relation.
Piles making up a small group not wider than 3
or 4 rows of piles, will normally respond with a
load distribution in the long-term similar to that of
a single pile and develop a similar neutral plane
location. However, the accumulated loads applied
to a small (or narrow) group will add stress to the
soil underneath the pile toe level that can result in
settlement in addition to that due to other factors,
local fills, other foundations, groundwater table
lowering etc. The stress increase below the toe
level is the effect of the toe resistance and the shaft
resistance between the neutral plane and the pile
toe level (for a narrow group), which will add
stress to an area wider than the group footprint.
The shaft resistance can be considered to originate
from a string or assembly of pile elements between
the neutral plane and the pile toe. Thus, the closer
one such element is to the pile toe, the less wide
the area affected by the shaft resistance of the
element.
Fellenius (2016) suggested that settlement
below the pile toe level due to the shaft resistance
on a small group of piles functioning as single piles
should be calculated over an equivalent raft that is
wider and longer than the footprint by a width
equal to 20 % of the distance between the neutral
plane and the pile toe level. That is, the equivalent
raft at the pile toe is widened by 1(H):5(V) from a
raft at the neutral plane equal to the pile group
footprint (envelop) area, as illustrated in Figure 6.
The load stressing that widened toe raft is then
equal to the total load applied to the pile group.
Figure 6. Distribution of stress below the neutral plane
for a group of piles. Only one pile is shown.
1.1 Discussion
What factor of safety, Fs, does the 700-kN load
represent for the single pile example? If the about
1,400-kN Offset Limit marked in Figure 1 would
be taken as the pile capacity, then, the Fs would be
2.0. As mentioned, some like to define capacity as
the applied load that gave a pile toe movement
equal to 10 % of the pile diameter, which load is
1,600 kN here, and, thus, would indicate an Fs of
2.3. (A capacity based on a certain toe movement
is rational. This notwithstanding that basing that
movement on the pile diameter is most irrational;
what movement and settlement the structure can
accept is not a function of the pile diameter).
Whether or not "the capacity" is defined as
1,400 kN or 1,600 kN, the long-term settlement
will be the same, but, as no surprise, increasing the
total load by 100 kN permanent load to 800 kN
would increase the long-term settlement. How
much is easily determined from the procedure
illustrated in Figures 4 and 5; the new settlement-
equilibrium neutral-plane would coincidentally be
about where the dashed green lines intersect in the
Figure 4 settlement diagram. That is, the calculated
pile long-term settlement would increase to about
35 mm. Whether this larger settlement would be a
satisfactory outcome of the design or not, the
structure supported on the pile would be the party
telling, the factor of safety has no say.
Indeed, the definition of capacity and choice of
factor of safety has little to say about the long-term
response of the foundation. The proper design
Page 7
46
question to pose is "what is the magnitude of the
acceptable settlement?". Moreover, a margin
against unacceptable settlement cannot be
determined by repeating the analysis for an applied
load increased by a single "serviceability" factor.
The unified method might show for one case that
the new settlement due to a so-increased load
would still be acceptable for the structure
supported, while in another case having some
different conditions of soil, the increase would
show to be beyond acceptable. In short, the
assessment using a factor of any kind would
require considering a combined effect of a load
increase and changed location of the neutral plane.
The important requirement for a design of a
foundation supported on a single pile, or on a small
group of piles, is to indicate the long-term pile
head settlement associated with the working load—
unfactored.
In many approaches to modeling the response of
a single pile to load, the shaft and toe resistances
are assumed to be "ideally" elastic-plastic, i.e., that
both have an ultimate resistance for a specific
movement (different for the shaft and toe) beyond
which the resistance stays constant, i.e., the
ultimate resistance is reached. However, the reality
is that the shaft resistance response is rarely ideally
plastic even at large movement, but can instead be
both strain-hardening and strain softening. And, the
pile toe resistance never reaches a plastic state, but
is always strain-hardening. This means that the
capacity determined from the shape of the pile-
head load-movement curve (as established in a
static loading test) is different from the one
determined as the sum of the resistance of the
individual pile shaft and toe elements. The fact that
many theories use the latter and then verify the
relevance of the results to the former does not instil
much confidence in a design of a piled foundation
based on a capacity reasoning.
The rational approach to the uncertainty of the
foundation design lies primarily in the settlement
analysis, notably the settlement distribution, which
in effect is a prediction of the most probable future
development. The settlement distribution, there-
fore, should be conservatively estimated with
regard to the factors that increase the effective
stress and to the compressibility parameters
employed in the settlement analysis, as well as to
other potential geotechnical and geological facts of
the site. The pile load distribution, even if from
measurements, needs to be carefully assessed, in
particular, the pile toe load-movement response, as
it is the most critical component of the load
response. However, a settlement/deformation
analysis is by far more reliable than the "capacity"
approach. For example, most people would initially
think that if the static loading test is performed
before full set-up has occurred, the additional shaft
resistance—increase of capacity—developed over
time would assure a hidden extra "safety".
However, if in the illustrated single pile case, set-
up would increase the long-term shaft resistance in
the clay beyond that measured in the "test", the
effect would be a lifting of the neutral plane and,
potentially, a larger long-term settlement of the
piled foundation. That is, a design based on the
"capacity" approach might then result in a less
serviceable foundation.
2. PILE GROUPS
2.1 General
When designing a foundation as a conventional
piled foundation group of piles, the common
approach is to perform the usual bearing
capacity/factor-of-safety calculations considering
the group response to be somewhat smaller than
the response of the same number of single piles,
which then is accounted for by applying a so-called
"efficiency coefficient" smaller than unity.
However, this disregards the fact that, while a
single pile imparts but little stress to the soil below
the pile toe, apart from the rather small volume
nearest the toe, a pile group will distribute load and
stress to a much larger volume, determined by the
width of the pile group.
The surface area of the perimeter (the envelop)
of a uniform pile group is much larger than the
surface area of an equal number of single piles. For
example, a group of piles at a 3-diameter spacing,
has an envelope surface area about ten times larger
than the sum of the surface area of all the piles in
the group.
The bending stiffness of a foundation raft
controls the forces in a raft resulting from
differential settlement. According to O'Brian et al.
(2012), the raft stiffness, K, is linearly proportional
to the ratio between the E modulus of the raft and
that of the soil, Er and Es, respectively, times the
ratio (K) between the raft thickness (t) and width,
(B), raised to the power of 3: (K = t/B)3. The
authors indicate a raft stiffness ratio of four orders
of magnitude when going from an infinitely
flexible through an infinitely rigid raft.
Considering the large difference in E-modulus
between concrete and soil, the E -modulus ratio,
Page 8
47
(Er/Es), is about 103 to 10
4, and the fact that the
stiffness ratio, K, is usually smaller than 1, it is
clear that, typically, the usual raft stiffness is on the
flexible side. The question whether or not a portion
of a raft is on the rigid side depends mainly on the
presence or not of a shear wall on the raft placed
perpendicularly to the bending axis considered.
If the settlement in the surrounding soils is
small, the long-term effect has no other
consequence than some inconsequential drag force
developing in the perimeter piles. On the other
hand, if the settlement in the surrounding soils is
appreciable, a significant downdrag will develop
for the perimeter piles unless they are installed so
that the pile toes are in very competent soil capable
of building up toe resistance at small movement. If,
on the other hand, significant downdrag would
affect the perimeter piles, some downdrag could
even occur for the next row or column of piles. It
may then be advisable to have the perimeter piles
longer than the interior piles in order to minimize
the otherwise larger downward movement of the
perimeter piles. Either way, the soil conditions will
trend to minimize the differences so the foundation
raft responds more like a flexible raft.
For a large (wide) piled foundation, the
resistance along the perimeter can be disregarded.
Thus, all the applied load will be transferred to the
pile toe level. However, in contrast to the small
pile group or a group of widely spaced piles, there
will not be a separate action of the pile toes being
pushed into the soil, but the entire body
("equivalent pier") of piles and soil will act as a
unit and the load will be distributed between the
piles and the soil, notwithstanding that there is
shaft resistance interaction between the piles.
As is the case for the foundation on a single
pile, for a foundation on a group of piles, the key
design task is to determine the future settlement of
the foundation. However, the result of a static
loading test on a single pile has little direct bearing
on the design of the settlement for a foundation on
a pile group. Therefore, the frequently applied way
to calculate settlement as equal to the accumulated
movements from the equivalent load-movement
response of each pile in the group, as illustrated in
Figure 7, is a fallacious approach that has led to
many more or less complex methods for
calculating settlement of a piled foundation, none
correct.
If a load applied to the pile cap results in that
each individual pile in the group mobilizes only a
portion of its available total pile resistance, and
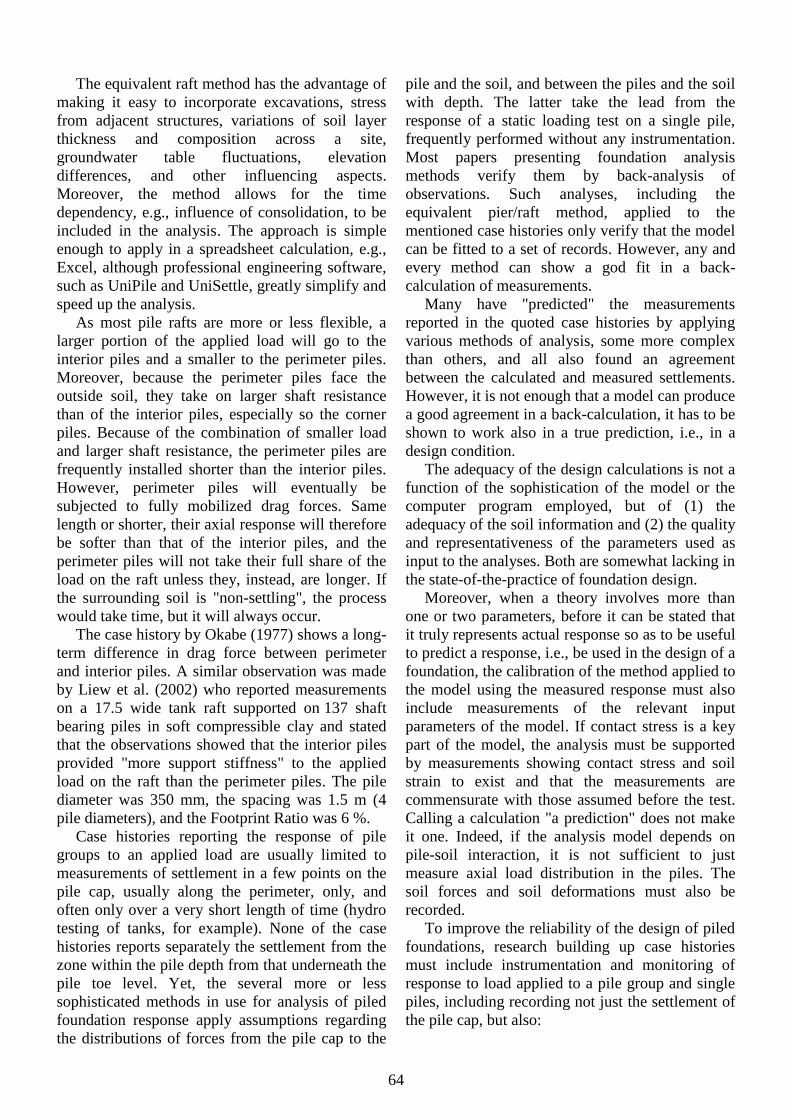
Figure 7. The misconception of calculating pile group
settlement treating each pile as a single pile and
accumulating the movements from an equivalent static
loading tests on each pile
minimal contact stress under the pile cap. The piles
will respond by a shaft resistance distribution and
some toe resistance. Such piled foundation is then
labeled a "pure" piled foundation, as opposed to a
"piled raft", which is when there is a contact
between the surface of the soil and the underside of
the pile cap. Some call the latter foundations
"hybrid foundations", "pile-enhanced rafts", "raft
enhanced-piles", or "combined pile-raft founda-
tion". While there is little consensus of what term
to use, the variety of terms imply a consensus on
expectations of a difference between a pile raft
with a contact stress as opposed to a "pure" pile
foundation. However, be the foundation a "pure"
foundation or a "piled raft" foundation, the actual
distributions of axial load down the piles in the
group are more complex than for a single pile.
Moreover, for "pure" pile group foundation on long
piles, the pile compression may result in a
downward movement of the pile head large enough
for a contact to develop, but contact stress?
In the long-term, the soil in between the piles
will undergo volume changes, mostly reduce and,
consequently, move downward. The movement
causes negative skin friction accumulating to a
drag force in the piles. The maximum drag force
that can act on the interior piles in a group is the
weight of the soil in-between the piles. In contrast,
the perimeter piles can experience more or less
fully mobilized drag force, and, more important,
downdrag. The drag force is in most cases
inconsequential, but the downdrag can result in
uneven stress distribution on the piles and
undesirable bending stress in the slab.
Papers discussing pile group response to load
characterize piled foundations as small or large,
narrow or wide ("narrow" and "wide" refer to
width, which is always shorter than the length). A
narrow or small pile group can be defined as a
b
c/c
Footprint width, B
Original ground surface Load, Q
Acc. MovementsMovement for a single pile
Page 9
48
group being no wider than 3 or 4 rows of piles and
it can be assumed to respond to load much in the
same way as an equal number of single piles. The
response of groups composed of large number of
rows and columns, will be significantly different,
however, depending on the actual number of rows
and columns, but more important, on the spacing
between the piles, because the piles will interact
via the shaft resistance, which effect will be
enhanced by deeper pile embedment.
Publications sometimes label a piled foundation
as small or large according to a definition proposed
by Randolph and Clancy (1993), who separated
small pile groups from large by a pile-group
Aspect-Ratio, R, defined as R = √(ns/D ), were "n"
is the number of piles in the group, "s" is center-to-
center distance between the piles, and "D" is the
pile embedment length. A small group has R < 3
and a large group has R > 3. A group of 12 piles
with a 300 mm diameter to 10 m depth placed at a
center-to-center distance of 3 pile diameters would
have R = 1.0 and be a small group. I am reluctant,
however, to accept that the pile groups comprising
38 piles to 40 m depth with Aspect Ratio of 1.9 and
the 144 piles to 48 m depth with Aspect Ratios
of 1.2, reported by Mandolini et al. (2005) and
Okabe (1977), respectively, as detailed below,
would be defined as "small".
A "pure" foundation alternative would normally
comprise longer piles than a "piled raft"
foundation. Often a comparison—per settlements
or costs—between the two types is based on the
"pure" piled foundation being designed con-
ventionally per bearing capacity calculations and
factors of safety, whereas the "piled raft" is
designed by different analytical methods
emphasizing settlement and relying on support
from contact stress. First, this is not an apple-to-
apple comparison. Second, the "bearing" effect of
contact stress, if at all significant, would
reasonably be diminishing with depth and be
negligible for all but for groups comprising rather
short piles.
Pile in a small (narrow) group will respond to
an applied load much in a way similar to that of
single piles, but for the effect of the accumulation
of stress imposed to the soil below the pile toe
level. If such a group would be tested with a
common cap resting on the ground, of course, a
significant contact stress could develop as the test
progressed. The pile cap is a resistance element
that functions much like a pile toe or a helical plate
in a screwpile. UniPile models the cap or element
by input of a q-z relation with its individual
stiffness response. The software can simulate—
match—an actual loading test from start to finish.
However, for long-term conditions of a narrow
piled foundation designed with a conventional
factor of safety larger than unity, the soil will settle
away from the pile cap, and there will be no
contact stress contribution to the pile response.
One piled foundation variation is to have the
piles not connected to the foundation slab, but
functioning as soil reinforcing units. The terms
used for this type of foundation are "piled pad" or
"disconnected footing", and others. For case
history examples, see Pecker (2004) and Amini et
al. (2008). Such designs will have to consider the
potential for horizontal displacement in the upper
soils layer; the flaring out to the pile, which then
will cause the foundation to settle.
I have found the concept of Footprint Ratio
useful, i.e., the ratio between the total area of all
piles over the footprint area of the pile group
defined by the envelop around the piles. A spacing
of 3 pile diameters in a symmetrical placement
with equal spacing for all piles in a wide
foundation (triangular configuration) corresponds
to a 10-% Footprint Ratio. If, instead, the pile
configuration as well as the piles are square and the
spacing refers to the pile face-to face diameter, the
Footprint Ratio is 11 %, which is about the same
value. A 2-diameter spacing results in Footprint
Ratios of 22 and 25 %, respectively. (On an aside, I
have found that Footprint Ratios for wide pile
groups larger than 15 % frequently will result in
construction difficulties unless the piles are very
short). Usually, piled foundations are designed
with the center-to-center spacing between the piles
in a group equal to 3 pile diameters or larger. As
the spacing increases, the difference in response
between interior and perimeter piles will diminish.
Perhaps, for wide groups with a 2 %, or smaller
Footprint Ratio, i.e., a spacing beyond about 7 pile
diameters, the pile response will be similar to that
of single piles, somewhat depending on the length
of the piles. For example, the Footprint Ratios for
the below mentioned cases reported by Mandolini
et al. (2005) and Okabe (1977) were 9 % and 22 %,
respectively.
The Footprint Ratio approach is best suited for
foundations that have at least an 8-row width.
Consider, for example, a square foundation on four
piles, also square (side = b) placed at a spacing
equal to 3b. The side of the area enveloping the
piles is 3b + b and the total area is 16b2 (not
Page 10
49
the 9b2-area of an infinitely wide group). Thus, the
Footprint Ratio is nb2/16b
2 = n/16 = = 25 %. If
instead the number of piles would be 9, 16, 25, 36,
49, 64, 100, and 400, the Footprint Ratios would
become 18 %, 16 %, 15 %, 14 %, 13.5 %, 13.2 %,
12.7 %, and 11.9 %. A square pile group
containing an infinite number of square piles
placed at a three face-to-face diameter spacing
would have a Footprint Ratio of 11.1 %. If instead
the piles are circular, all the mentioned ratios
would reduce by π/4 and the Footprint Ratio of the
infinitely large group would reduce from 11% to
9%. Obviously, the Footprint Ratio concept is not
suitable for narrow groups. Although an exact
number can be obtained for each specific case, it is
best considered as an approximate reference
number to aid designer judgment in the design of
wide piled foundations.
Depending on pile embedment length in a wide
piled foundation, even with the piles spaced out
across the foundation footprint, at Footprint Ratios
larger than about 4 %, i.e., a pile spacing smaller
than about 5 diameters, a piled foundation will tend
to act as a pier or block, be an equivalent pier,
composed of piles and soil responding together—
acting as a unit. The "equivalent pier" has a
stiffness, EA, determined by a modulus, Epier,
proportioned between the soil modulus and the pile
modulus, as indicated in Equations 1 and 2. The
pier compression will be entirely governed by the
so proportioned stiffness (pile-soil combination
above the pile toe level) and, thus, the pile and the
soil will work in unison.
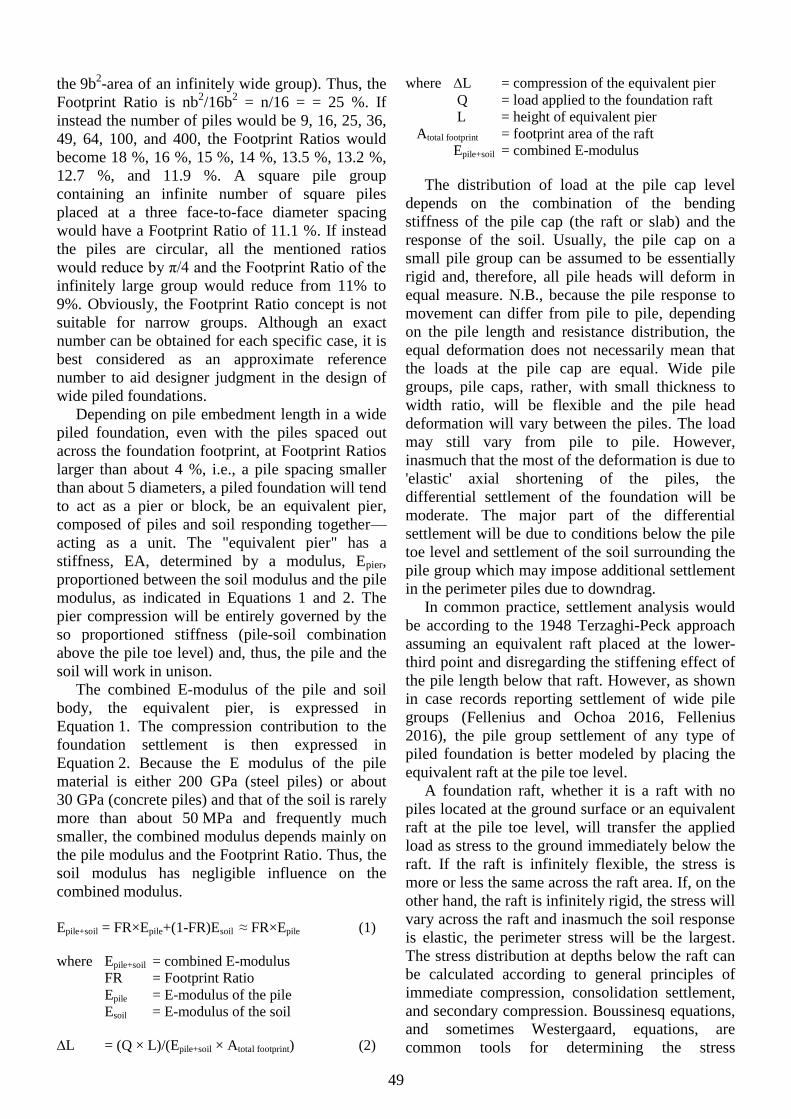
The combined E-modulus of the pile and soil
body, the equivalent pier, is expressed in
Equation 1. The compression contribution to the
foundation settlement is then expressed in
Equation 2. Because the E modulus of the pile
material is either 200 GPa (steel piles) or about
30 GPa (concrete piles) and that of the soil is rarely
more than about 50 MPa and frequently much
smaller, the combined modulus depends mainly on
the pile modulus and the Footprint Ratio. Thus, the
soil modulus has negligible influence on the
combined modulus.
Epile+soil = FR×Epile+(1-FR)Esoil ≈ FR×Epile (1)
where Epile+soil = combined E-modulus
FR = Footprint Ratio
Epile = E-modulus of the pile
Esoil = E-modulus of the soil
∆L = (Q × L)/(Epile+soil × Atotal footprint) (2)
where ∆L = compression of the equivalent pier
Q = load applied to the foundation raft
L = height of equivalent pier
Atotal footprint = footprint area of the raft
Epile+soil = combined E-modulus
The distribution of load at the pile cap level
depends on the combination of the bending
stiffness of the pile cap (the raft or slab) and the
response of the soil. Usually, the pile cap on a
small pile group can be assumed to be essentially
rigid and, therefore, all pile heads will deform in
equal measure. N.B., because the pile response to
movement can differ from pile to pile, depending
on the pile length and resistance distribution, the
equal deformation does not necessarily mean that
the loads at the pile cap are equal. Wide pile
groups, pile caps, rather, with small thickness to
width ratio, will be flexible and the pile head
deformation will vary between the piles. The load
may still vary from pile to pile. However,
inasmuch that the most of the deformation is due to
'elastic' axial shortening of the piles, the
differential settlement of the foundation will be
moderate. The major part of the differential
settlement will be due to conditions below the pile
toe level and settlement of the soil surrounding the
pile group which may impose additional settlement
in the perimeter piles due to downdrag.
In common practice, settlement analysis would
be according to the 1948 Terzaghi-Peck approach
assuming an equivalent raft placed at the lower-
third point and disregarding the stiffening effect of
the pile length below that raft. However, as shown
in case records reporting settlement of wide pile
groups (Fellenius and Ochoa 2016, Fellenius
2016), the pile group settlement of any type of
piled foundation is better modeled by placing the
equivalent raft at the pile toe level.
A foundation raft, whether it is a raft with no
piles located at the ground surface or an equivalent
raft at the pile toe level, will transfer the applied
load as stress to the ground immediately below the
raft. If the raft is infinitely flexible, the stress is
more or less the same across the raft area. If, on the
other hand, the raft is infinitely rigid, the stress will
vary across the raft and inasmuch the soil response
is elastic, the perimeter stress will be the largest.
The stress distribution at depths below the raft can
be calculated according to general principles of
immediate compression, consolidation settlement,
and secondary compression. Boussinesq equations,
and sometimes Westergaard, equations, are
common tools for determining the stress
Page 11
50
distribution below the raft and to its sides. For
settlement calculation under rigid raft, the
calculated stress underneath the characteristic point
is used as this is where it is equal for flexible and
rigid rafts (Fellenius 2016).
The last two decades have seen several
numerical methods developed, incorporating inter-
action between the pile cap (raft), the piles, and the
soil. For example, the ISSMGE Committee TC212
has produced guidelines for the design of a piled-
raft foundation as a "combined pile-raft foundation
(CPRF)" as foundation elements with the
interaction between these and the soil (Katzenbach
and Choudhury 2013). The publication includes
several references on the subject.
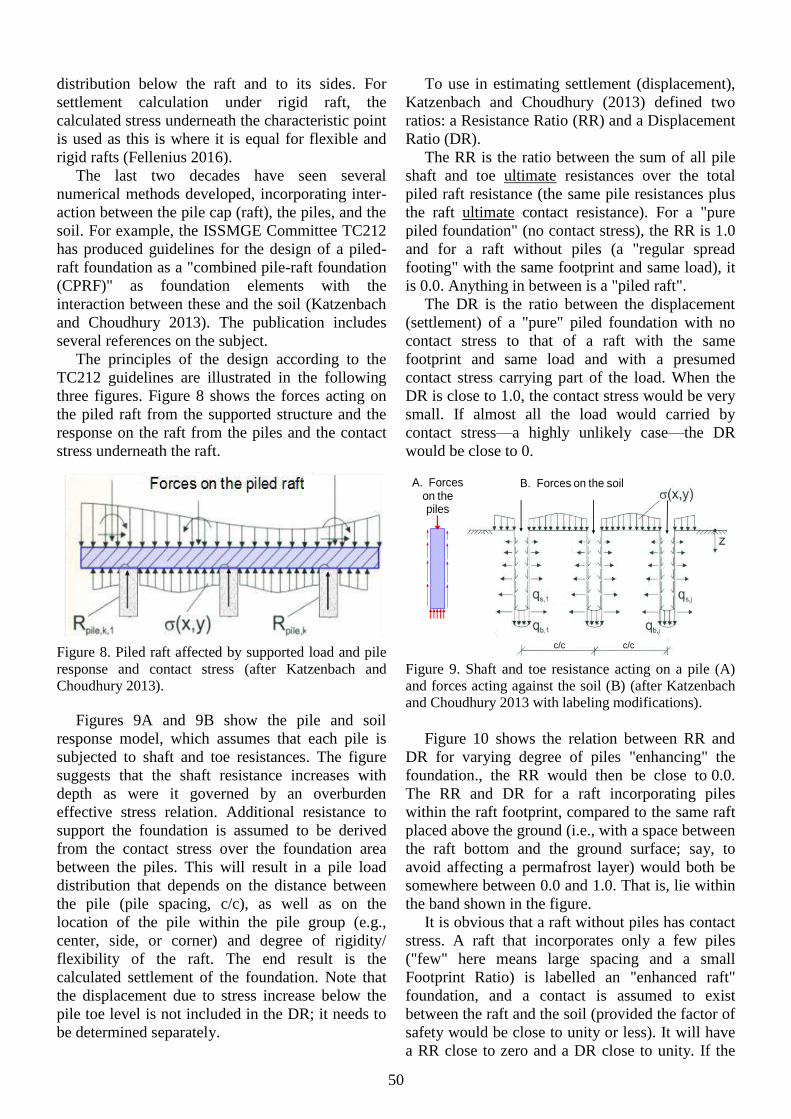
The principles of the design according to the
TC212 guidelines are illustrated in the following
three figures. Figure 8 shows the forces acting on
the piled raft from the supported structure and the
response on the raft from the piles and the contact
stress underneath the raft.
Figure 8. Piled raft affected by supported load and pile
response and contact stress (after Katzenbach and
Choudhury 2013).
Figures 9A and 9B show the pile and soil
response model, which assumes that each pile is
subjected to shaft and toe resistances. The figure
suggests that the shaft resistance increases with
depth as were it governed by an overburden
effective stress relation. Additional resistance to
support the foundation is assumed to be derived
from the contact stress over the foundation area
between the piles. This will result in a pile load
distribution that depends on the distance between
the pile (pile spacing, c/c), as well as on the
location of the pile within the pile group (e.g.,
center, side, or corner) and degree of rigidity/
flexibility of the raft. The end result is the
calculated settlement of the foundation. Note that
the displacement due to stress increase below the
pile toe level is not included in the DR; it needs to
be determined separately.
To use in estimating settlement (displacement),
Katzenbach and Choudhury (2013) defined two
ratios: a Resistance Ratio (RR) and a Displacement
Ratio (DR).
The RR is the ratio between the sum of all pile
shaft and toe ultimate resistances over the total
piled raft resistance (the same pile resistances plus
the raft ultimate contact resistance). For a "pure
piled foundation" (no contact stress), the RR is 1.0
and for a raft without piles (a "regular spread
footing" with the same footprint and same load), it
is 0.0. Anything in between is a "piled raft".
The DR is the ratio between the displacement
(settlement) of a "pure" piled foundation with no
contact stress to that of a raft with the same
footprint and same load and with a presumed
contact stress carrying part of the load. When the
DR is close to 1.0, the contact stress would be very
small. If almost all the load would carried by
contact stress—a highly unlikely case—the DR
would be close to 0.
Figure 9. Shaft and toe resistance acting on a pile (A)
and forces acting against the soil (B) (after Katzenbach
and Choudhury 2013 with labeling modifications).
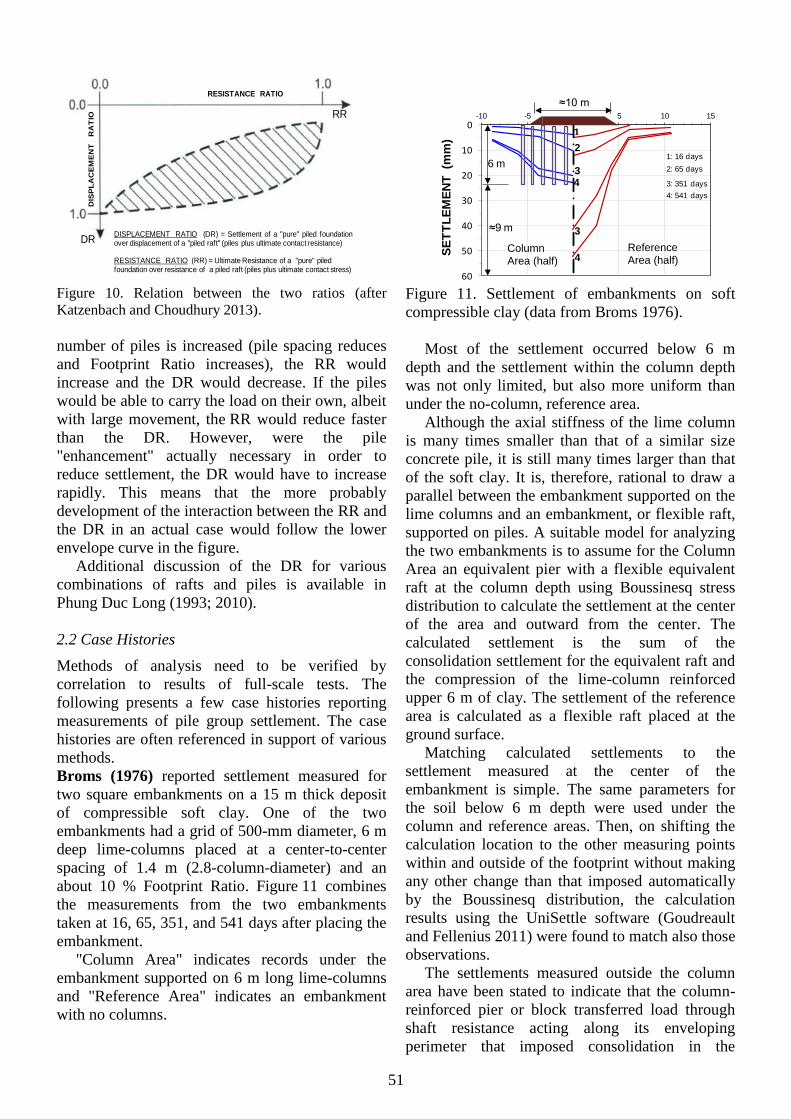
Figure 10 shows the relation between RR and
DR for varying degree of piles "enhancing" the
foundation., the RR would then be close to 0.0.
The RR and DR for a raft incorporating piles
within the raft footprint, compared to the same raft
placed above the ground (i.e., with a space between
the raft bottom and the ground surface; say, to
avoid affecting a permafrost layer) would both be
somewhere between 0.0 and 1.0. That is, lie within
the band shown in the figure.
It is obvious that a raft without piles has contact
stress. A raft that incorporates only a few piles
("few" here means large spacing and a small
Footprint Ratio) is labelled an "enhanced raft"
foundation, and a contact is assumed to exist
between the raft and the soil (provided the factor of
safety would be close to unity or less). It will have
a RR close to zero and a DR close to unity. If the
Forceson thepiles
c/c c/c
Forces on the soilA. Forces
on the piles
B. Forces on the soil
Page 12
51
Figure 10. Relation between the two ratios (after
Katzenbach and Choudhury 2013).
number of piles is increased (pile spacing reduces
and Footprint Ratio increases), the RR would
increase and the DR would decrease. If the piles
would be able to carry the load on their own, albeit
with large movement, the RR would reduce faster
than the DR. However, were the pile
"enhancement" actually necessary in order to
reduce settlement, the DR would have to increase
rapidly. This means that the more probably
development of the interaction between the RR and
the DR in an actual case would follow the lower
envelope curve in the figure.
Additional discussion of the DR for various
combinations of rafts and piles is available in
Phung Duc Long (1993; 2010).
2.2 Case Histories
Methods of analysis need to be verified by
correlation to results of full-scale tests. The
following presents a few case histories reporting
measurements of pile group settlement. The case
histories are often referenced in support of various
methods.
Broms (1976) reported settlement measured for
two square embankments on a 15 m thick deposit
of compressible soft clay. One of the two
embankments had a grid of 500-mm diameter, 6 m
deep lime-columns placed at a center-to-center
spacing of 1.4 m (2.8-column-diameter) and an
about 10 % Footprint Ratio. Figure 11 combines
the measurements from the two embankments
taken at 16, 65, 351, and 541 days after placing the
embankment.
"Column Area" indicates records under the
embankment supported on 6 m long lime-columns
and "Reference Area" indicates an embankment
with no columns.
Figure 11. Settlement of embankments on soft
compressible clay (data from Broms 1976).
Most of the settlement occurred below 6 m
depth and the settlement within the column depth
was not only limited, but also more uniform than
under the no-column, reference area.
Although the axial stiffness of the lime column
is many times smaller than that of a similar size
concrete pile, it is still many times larger than that
of the soft clay. It is, therefore, rational to draw a
parallel between the embankment supported on the
lime columns and an embankment, or flexible raft,
supported on piles. A suitable model for analyzing
the two embankments is to assume for the Column
Area an equivalent pier with a flexible equivalent
raft at the column depth using Boussinesq stress
distribution to calculate the settlement at the center
of the area and outward from the center. The
calculated settlement is the sum of the
consolidation settlement for the equivalent raft and
the compression of the lime-column reinforced
upper 6 m of clay. The settlement of the reference
area is calculated as a flexible raft placed at the
ground surface.
Matching calculated settlements to the
settlement measured at the center of the
embankment is simple. The same parameters for
the soil below 6 m depth were used under the
column and reference areas. Then, on shifting the
calculation location to the other measuring points
within and outside of the footprint without making
any other change than that imposed automatically
by the Boussinesq distribution, the calculation
results using the UniSettle software (Goudreault
and Fellenius 2011) were found to match also those
observations.
The settlements measured outside the column
area have been stated to indicate that the column-
reinforced pier or block transferred load through
shaft resistance acting along its enveloping
perimeter that imposed consolidation in the
DISPLACEMENT RATIO (DR) = Settlement of a "pure" piled foundationover displacement of a "piled raft" (piles plus ultimate contact resistance)
RESISTANCE RATIO (RR) = Ultimate Resistance of a "pure" piled foundation over resistance of a piled raft (piles plus ultimate contact stress)
RESISTANCE RATIOD
ISP
LA
CE
ME
NT
R
AT
IO RR
DR
0
10
20
30
40
50
60
-10 -5 0 5 10 15
SE
TT
LE
ME
NT
(m
m)
≈10 m
6 m
≈9 m
Reference Area (half)
Column Area (half)
1: 16 days
2: 65 days
3: 351 days
1
4: 541 days
2
34
4
3
Page 13
52
surrounding clay. However, as the calculations
using the UniSettle software show, the settlements
outside the two footprint areas are caused by the
stress from the embankment load acting at the toe
of the lime columns or at the ground surface of the
reference embankment.
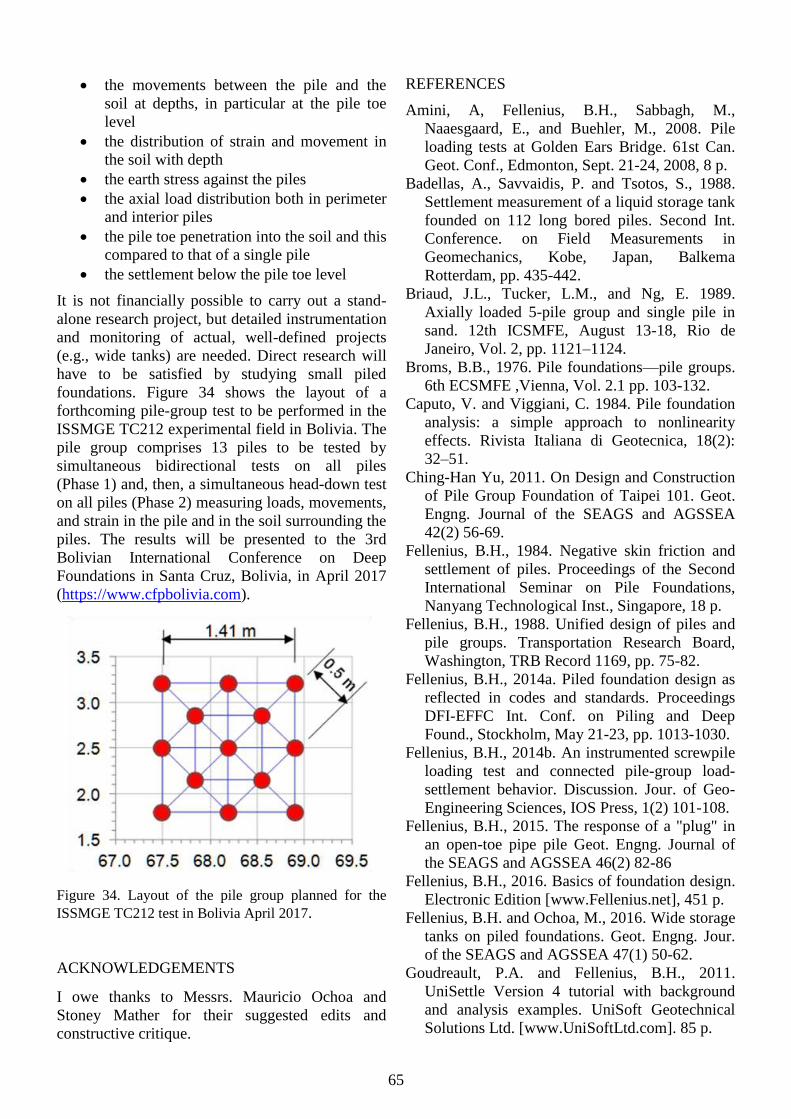
Okabe (1977) reported results from a series of
investigations undertaken to study the effect of
drag force on driven foundation piles installed at a
low-lying wet paddy field through a compressible
sandy silt undergoing regional settlement. The
unfactored working load was 800 kN. The soils
consisted of soft compressible sandy silt to about
40+ m depth and the area was expected to settle
due to fill being placed across the site. The study
involved a "pure" piled foundation supporting
a 30-MN bridge pier supported on 38 piles. The
piles were 700-mm diameter, 40 m long, closed-toe
steel pipe piles, joined by a common cap. The piles
were placed in the corners of equilateral triangles
with a 1.5 m, i.e., 2.1 pile diameters center-to-
center spacing (Footprint Ratio = 20 %). The
layout is shown in Figure 12 indicating the location
of four test piles for which axial strain was
monitored and evaluated to axial pile load at four
depths over 1,040 days. Three of the test piles were
interior piles and one was a perimeter pile. A fifth
test pile, a single 600-mm diameter, closed-toe
steel pipe pile was driven away from the group and
to 43 m depth into dense sand to serve as a
reference pile. It also was instrumented.
Figure 13 shows the load distributions in test
piles. The distributions in the three interior piles
were quite similar to each other, but differed
considerable from the perimeter and reference
piles. The paper reporting the study did not include
any measurements taken before the casting of the
foundation slab. It is probable that some axial
residual force developed in the piles from the
driving and from the soil reconsolidation. This
would explain why the measurements did not
indicate any increase of load with depth, i.e., no
shaft resistance. The tendency of the distributions
to reduce below about 25 m depth is commensurate
with presence of locked-in (residual) force load.
The dashed straight line represents the per pile
soil weight with depth. Note, however, that, while
the perimeter pile was fully affected by the settling
soil and showed the same "negative-skin-friction"
development as the single pile, the interior piles
did not show a build-up of drag force; the main
message, here.
Figure 12. Layout of piles for pile-group study (data
from Okabe 1977).
Figure 13. Load distribution in the three interior and
perimeter piles and the reference single pile (data from
Okabe 1977).
Generally, other than for a small piled foundation,
when load is applied to the pile cap, the piles are
not pushed individually through the soil, but they
and the in-between soil start to move together—
move as a unit. Because the perimeter piles have to
face the outside soil, their response is different to
the interior piles as illustrated in the quoted study.
The study was directed toward the drag force,
which in the state-of-the-practice of the times, was
considered the key factor. Unfortunately, the
settlements of the pile and the soil were considered
less important and were not measured (reported).
Monitored Piles
9.4 m
10.6
m
1.5
m
1.5 m 0.7 m
Page 14
53
O'Neill et al. (1982) compared the load-movement
response of a single pile to that of a nine-pile
group. The piles were 273 mm diameter closed-toe
steel pipe piles with 9 mm wall driven to 13 m
embedment into a thick deposit of over-
consolidated stiff salty clay. The pile group
configuration was a square grid with 1.64 m side
measured center-to-center of the piles. The pile cap
was above the ground surface. The pile group is
small by any definition. For groups as small as this,
indicating spacing in terms of pile diameter and
Footprint Ratio is not meaningful.
Figure 14 shows the layout of the group. Static
loading tests were first performed on the single pile
and on the nine-pile group. Thereafter, the four
corner piles and the center pile were tested
together, with the mid-side pile not loaded. Then,
the four mid-side piles were tested together. The
purpose of the tests was to study group effect, i.e.,
load-movement of a single pile v. a group of piles.
Figure 15 shows the average pile-head load-
movement response of the single pile and the test
on the nine-pile group. Compared to the response
of the single pile, the group responses are much
softer. The results have been used to correlate a
group "efficiency" factor and in models
incorporating the pile spacing and number of piles,
or by some more sophisticated analysis
incorporating the same along with aspects of
interaction between the piles, soil module, and
shear zones. Either approach was then rationalized
by the larger movement for the same load—softer
response—of the nine-pile group as opposed to that
of the single pile.
As the test on the corner piles plus the center
pile and on the mid-side piles are re-loading tests,
comparing their results to that of the single pile are
not really an apple-to-apple comparison. However,
comparing the results of the four-, five-, and nine-
pile groups is.
Using the UniPile software, I fitted the load-
movement of the single pile with input of t-z
functions for the shaft resistance and q-z function
for the toe resistance forcing a fit to the measured
curve, incorporating the measured residual force in
the pile. The fitted curve is added to the figure. I
then calculated the settlement for an equivalent raft
placed at the pile toe level and determined a
reloading modulus number of the clay below the
pile toe that fitted (gave) the measured 2 mm
settlement difference between the single pile and
the nine-pile group for the 700 kN maximum test
load. Next, without changing any other input than
Figure 14. Layout of the 9-pile group and the
configuration of the tests on the 9, 5, and 4 piles (data
from O'Neill et al. 1982).
Figure 15. Pile-head load-movement curves for the
single pile, the nine-pile group, and for the reloading of
five and four piles in the group (data from O'Neill et al.
1982).
load, I calculated the equivalent raft settlement for
the other tests. The so-calculated pile-head load-
movement, also shown in the figure, indicates
agreement with the measured load-movement
curve.
The good fit to the nine-pile group curve does
not prove that the equivalent pier plus equivalent
raft is the correct method of analysis. However, it
does support that a reason for the softer response of
the group as opposed to that of the single pile,
could well have been that the soil volume below
the piles was affected by the applied load and not
due to interaction between the piles in the group.
0
200
400
600
800
0 2 4 6 8 10
LO
AD
P
ER
P
ILE
(k
N)
PILE HEAD MOVEMENT (mm)
Single, Measured
Single, Fitted
9-group, Measured
9-group, Fitted
4-group, Measured
5-group, Measured
Single Pile9 Piles
Page 15
54
Badellas et al. (1988) and Savvaidis (2003)
presented a case history of settlement
measurements for a 38 m diameter, liquid storage
tank in Greece supported on a piled foundation.
The soil profile consisted of 40 m of soft
compressible soil followed by dense coarse-
grained soil. The groundwater table was at
about 1.5 m depth. The tank bottom consisted of
an 800 mm thick concrete raft and the total dead
weight of the empty tank was 70 MN (about
60 kPa stress). The foundation was designed as a
"pure" piled foundation and comprised a total of
112, 1,000 mm diameter, 42 m long bored piles.
The Footprint Ratio was about 8 % and the average
spacing was about 3.6 pile diameters. No results of
any static loading test was reported.
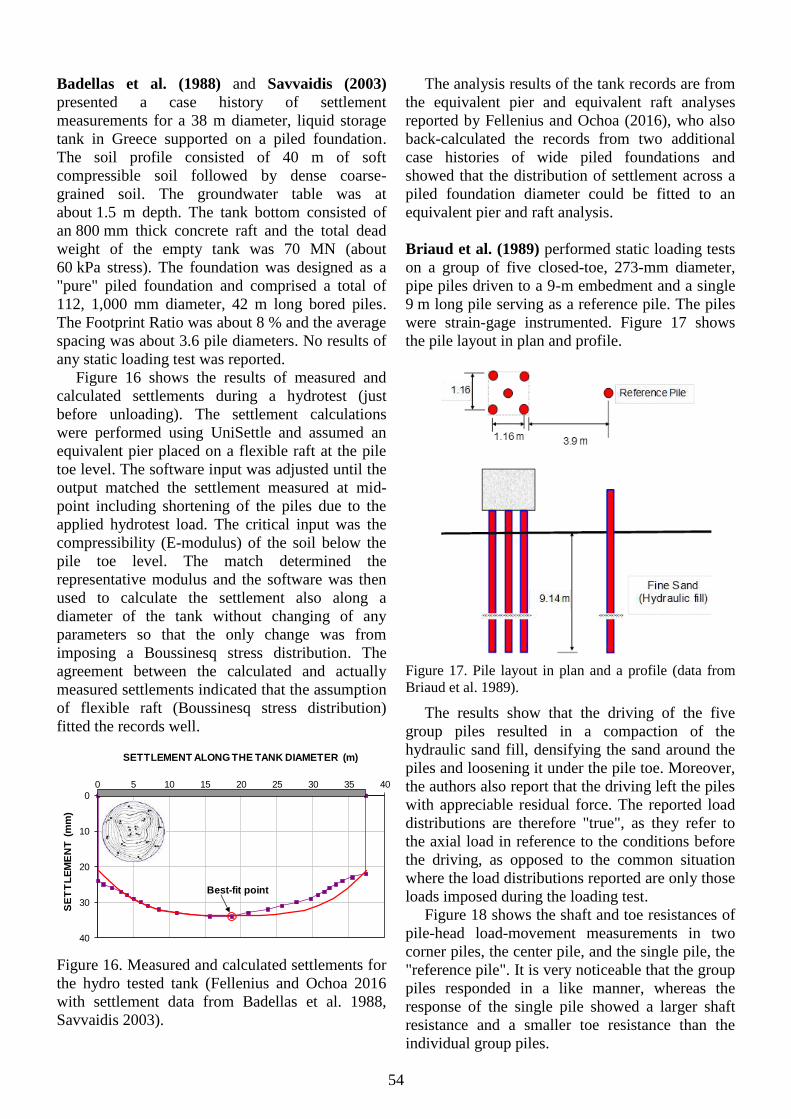
Figure 16 shows the results of measured and
calculated settlements during a hydrotest (just
before unloading). The settlement calculations
were performed using UniSettle and assumed an
equivalent pier placed on a flexible raft at the pile
toe level. The software input was adjusted until the
output matched the settlement measured at mid-
point including shortening of the piles due to the
applied hydrotest load. The critical input was the
compressibility (E-modulus) of the soil below the
pile toe level. The match determined the
representative modulus and the software was then
used to calculate the settlement also along a
diameter of the tank without changing of any
parameters so that the only change was from
imposing a Boussinesq stress distribution. The
agreement between the calculated and actually
measured settlements indicated that the assumption
of flexible raft (Boussinesq stress distribution)
fitted the records well.
Figure 16. Measured and calculated settlements for
the hydro tested tank (Fellenius and Ochoa 2016
with settlement data from Badellas et al. 1988,
Savvaidis 2003).
The analysis results of the tank records are from
the equivalent pier and equivalent raft analyses
reported by Fellenius and Ochoa (2016), who also
back-calculated the records from two additional
case histories of wide piled foundations and
showed that the distribution of settlement across a
piled foundation diameter could be fitted to an
equivalent pier and raft analysis.
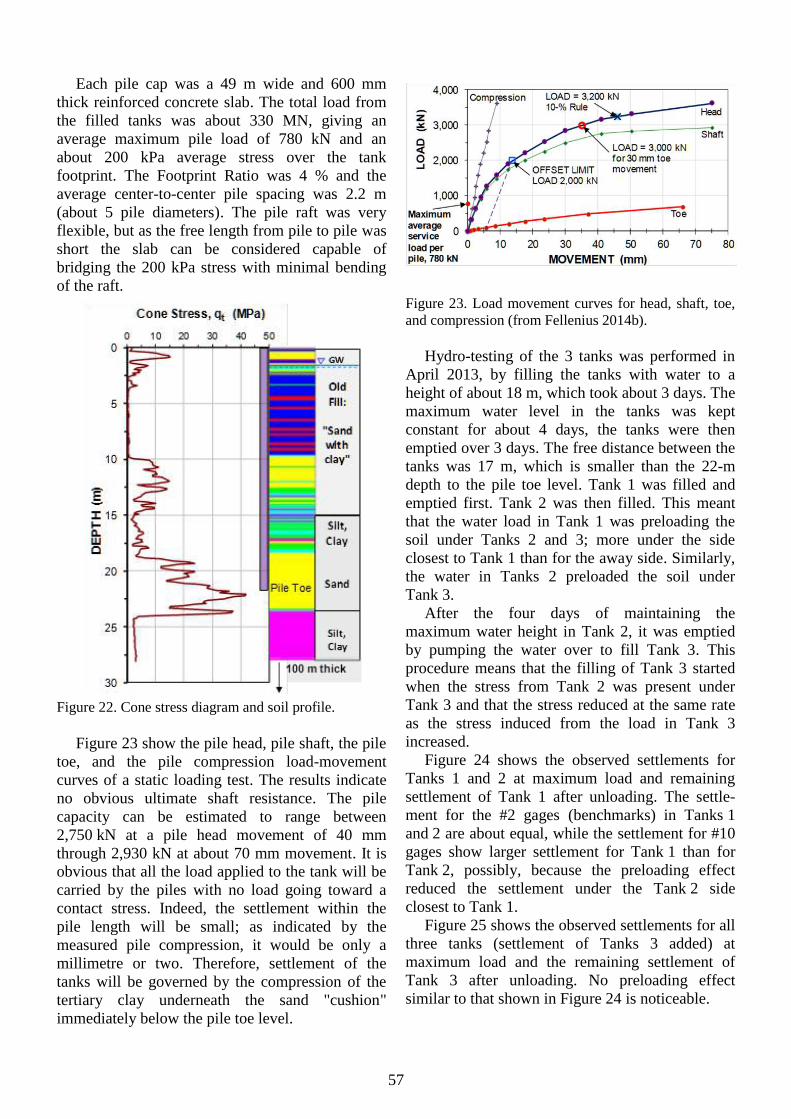
Briaud et al. (1989) performed static loading tests
on a group of five closed-toe, 273-mm diameter,
pipe piles driven to a 9-m embedment and a single
9 m long pile serving as a reference pile. The piles
were strain-gage instrumented. Figure 17 shows
the pile layout in plan and profile.
Figure 17. Pile layout in plan and a profile (data from
Briaud et al. 1989).
The results show that the driving of the five
group piles resulted in a compaction of the
hydraulic sand fill, densifying the sand around the
piles and loosening it under the pile toe. Moreover,
the authors also report that the driving left the piles
with appreciable residual force. The reported load
distributions are therefore "true", as they refer to
the axial load in reference to the conditions before
the driving, as opposed to the common situation
where the load distributions reported are only those
loads imposed during the loading test.
Figure 18 shows the shaft and toe resistances of
pile-head load-movement measurements in two
corner piles, the center pile, and the single pile, the
"reference pile". It is very noticeable that the group
piles responded in a like manner, whereas the
response of the single pile showed a larger shaft
resistance and a smaller toe resistance than the
individual group piles.
0
10
20
30
40
0 5 10 15 20 25 30 35 40
SE
TT
LE
ME
NT
(m
m)
SETTLEMENT ALONG THE TANK DIAMETER (m)
Best-fit point
Page 16
55
Figure 18. Results of the static loading tests separated
on shaft resistance and toe resistance (data from Briaud
et al., 1989).
Figure 19 shows the portion of the total applied
load for each of the five piles in the group. The
curves are so similar that the conclusion must be
that each of the five responded as a single pile.
Definitely, the response of the "reference pile" was
different from that of the group piles, but this was
due to the compaction effects and not to any single
pile response versus group response to load. The
case history is justifiably well-recognized and is
frequently referenced. However, I think that those
using the records of the test to verify methods for
prediction of single pile settlement versus pile
group settlement have stretched the rather limited
results a mite.
Figure 19. Distribution of load between the five piles in
the group (data from Briaud et al. 1989)
Russo and Viggiani (1995) and Mandolini et al.
(2005) reported a case history of a "pure" piled
foundation of the main pier of the cable-stayed
bridge over the Garigliano River in Southern Italy;
constructed in 1991-94 and founded in deep
compressible silty clay. The piled foundation
comprised 144 mandrel-driven, then concrete-
filled, steel pipe piles, 48 m long, 406-mm
diameter, uniformly distributed in a 10.6 m by 19.0
m raft (Russo and Viggiani 1995), as shown in
Figure 20. The pile configuration was rectangular,
comprising 9 rows and 16 columns, and the pile
c/c distance was 1.2 m, (3.0 pile diameters). The
Footprint Ratio was 9 %. Enveloping the raft, a
wall of 800 mm diameter bored piles to 12 m depth
were constructed to protect against scour. These
piles were free from contact with the raft and the
pipe piles. The unfactored load from the pier
was 800 kN/pile, which incorporated a factor of
safety of 3.0 on pile capacity as verified in static
loading tests during the design. The foundation was
instrumented to monitor the pile axial load in
35 piles and the contact stress between the raft and
the soil at eight locations as the bridge was
constructed. The monitoring continued for about
ten years following the construction. Settlements
were monitored by survey.
Figure 20. Pile layout at the main pier of the Garigliano
bridge (after Russo and Viggiani 1995 and Mandolini et
al. 2005).
0
2
4
6
8
10
12
14
0 10 20 30 40 50 60
PO
RT
ION
OF
MA
XIM
UM
A
VE
RA
GE
RE
SIS
TA
NC
E (
%)
PILE TOE MOVEMENT (mm)
Corner
Corner
Single
Center
TOE RESISTANCE
0
20
40
60
80
100
120
0 2 4 6 8 10 12 14
PO
RT
ION
O
F M
AX
IMU
M
AV
ER
AG
E R
ES
IST
AN
CE
(%
)
PILE HEAD MOVEMENT (mm)
Corner
Corner
Single
Center
SHAFT RESISTANCE
0
10
20
30
0 500 1,000 1,500 2,000 2,500
PO
RT
ION
OF
TO
TA
L
AP
PL
EID
LO
AD
(%
)
TOTAL LOAD APPLIED TO GROUP (kN)
CenterPile
Page 17
56
At first, the measurements showed larger loads
on the perimeter piles than on the interior, but, with
time, the load on the perimeter piles decreased,
while the load on the interior piles increased.
Throughout the construction, the total load
measured in the pile gages corresponded closely to
the net weight from the raft and the pier. At the end
of construction, the average settlement was about
42 mm. Ten years later, it had increased to 52 mm.
Because of the rigid cap, no differential settlement
developed.
The earth cells measuring the contact stress
registered only negligible values, during the
construction of the raft and the pier above. The
authors suggested that the absence of significant
contact stress was due to "the cells not working
properly". No discussion of a possible reason for
the "malfunction" is included.
The authors also suggested that the reduction of
the load measured in the perimeter piles was due to
creep of the reinforced concrete raft. However, I
believe the settlement of the soil surrounding the
pile group (the magnitude was not included in the
paper) resulted in drag forces on the perimeter
piles, causing the perimeter piles to be partially
unloaded from the raft. In other words, the
response of the interior and perimeter piles was
very similar to that of the foregoing case history.
The bored-piles were short, 12 m, and were not
able to shield the 48 m long perimeter piles from
the settling soil below 12 m depth.
Lee and Xiao (2001) compiled test records from
Caputo and Viggiani (1984) on the results of static
loading tests on three single piles, Piles 1, 2, and 3.
While measuring the pile-head load-movement on
the test piles, for each test, they also measured the
movement of an unloaded, "passive" pile a short
distance away. Piles 1 and 2, active and passive
piles, had 400 mm diameter and 8.6 and 8.0 m
embedment. Piles 3, active and passive piles, had
500 mm diameter and 20.6 m embedment. The
side-to-side distances between the active and
passive piles were 0.8, 1.2, and 3.0 m, respectively.
Figure 21 shows that loading the active piles
induced small downward movement on the passive
piles. For the rather small 6-mm pile head
movement of the active piles, the passive pile
movements were about 0.2 to 0.3 mm regardless of
the distance between the active and passive piles.
For the wider and longer pile, Pile #3, the
passive pile moved 0.8 mm when the active pile
moved 30 mm. The movements of both active and
Figure 21. Movements induced in passive piles a
distance away from test piles. (Data from Lee and Xiao
2001, Caputo and Viggiani 1984).
passive piles were probably measured against a
reference beam that may or may not have been
common to the piles, and whether the load was
applied by jacking against a loaded platform or
reaction piles, the reaction arrangement might have
affected the measurements. The actual movement
values matter less. The key point is that the tests
showed that even when piles are separated by
distance equal to several pile diameters, they will
interact. Presumably, the presence of a passive or
equally active pile near a loaded pile will have an
effect on the axial loads and displacements of the
loaded pile. However, to my knowledge there are
as yet no such measurements available.
van Impe et al. (2013), van Impe (2016), and
Fellenius (2014b) analyzed a case of settlements
of three 33,000 m3 in volume, 19 m in height, oil
tanks, each supported on 422 piles. The piles were
460-mm diameter, 21.6 m long screw piles (Omega
piles). Figure 22 shows that the soil profile
consisted of a 15 m thick old fill of sand with clay
deposited on about 4 m of silt and clay and 5 m of
sand on a tertiary, slightly overconsolidated stiff
clay at 24 m depth that continued for about 100 m.
0
200
400
600
800
1,000
0 1 2 3 4 5 6 7
LO
AD
(k
N)
MOVEMENT (mm)
0
400
800
1,200
1,600
2,000
0 4 8 12 16 20 24
LO
AD
(k
N)
MOVEMENT (mm)
ACTIVE
PASSIVE
ACTIVE
PASSIVE
#1 #2
#3
400 mm Pile DiameterDistances: 0.8 m (#1)
1.2 m (#2)
500 mm Pile DiameterDistance: 3.0 m (#3)
#3
Page 18
57
Each pile cap was a 49 m wide and 600 mm
thick reinforced concrete slab. The total load from
the filled tanks was about 330 MN, giving an
average maximum pile load of 780 kN and an
about 200 kPa average stress over the tank
footprint. The Footprint Ratio was 4 % and the
average center-to-center pile spacing was 2.2 m
(about 5 pile diameters). The pile raft was very
flexible, but as the free length from pile to pile was
short the slab can be considered capable of
bridging the 200 kPa stress with minimal bending
of the raft.
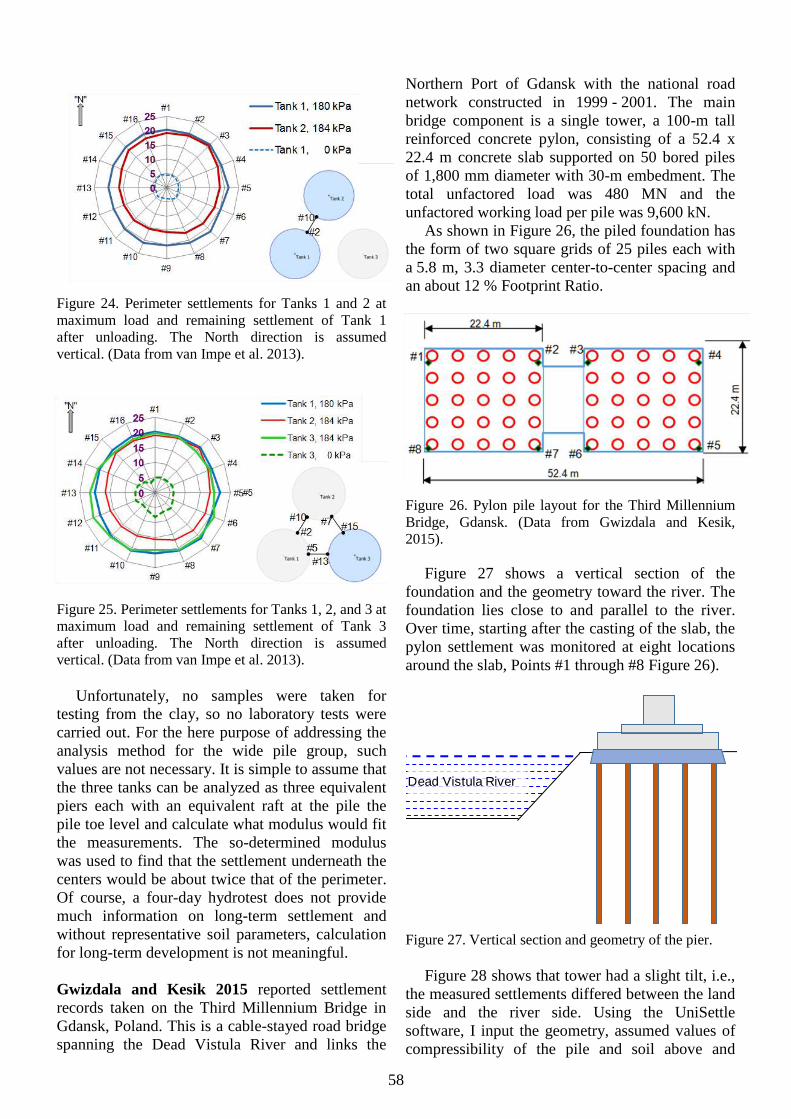
Figure 22. Cone stress diagram and soil profile.
Figure 23 show the pile head, pile shaft, the pile
toe, and the pile compression load-movement
curves of a static loading test. The results indicate
no obvious ultimate shaft resistance. The pile
capacity can be estimated to range between
2,750 kN at a pile head movement of 40 mm
through 2,930 kN at about 70 mm movement. It is
obvious that all the load applied to the tank will be
carried by the piles with no load going toward a
contact stress. Indeed, the settlement within the
pile length will be small; as indicated by the
measured pile compression, it would be only a
millimetre or two. Therefore, settlement of the
tanks will be governed by the compression of the
tertiary clay underneath the sand "cushion"
immediately below the pile toe level.
Figure 23. Load movement curves for head, shaft, toe,
and compression (from Fellenius 2014b).
Hydro-testing of the 3 tanks was performed in
April 2013, by filling the tanks with water to a
height of about 18 m, which took about 3 days. The
maximum water level in the tanks was kept
constant for about 4 days, the tanks were then
emptied over 3 days. The free distance between the
tanks was 17 m, which is smaller than the 22-m
depth to the pile toe level. Tank 1 was filled and
emptied first. Tank 2 was then filled. This meant
that the water load in Tank 1 was preloading the
soil under Tanks 2 and 3; more under the side
closest to Tank 1 than for the away side. Similarly,
the water in Tanks 2 preloaded the soil under
Tank 3.
After the four days of maintaining the
maximum water height in Tank 2, it was emptied
by pumping the water over to fill Tank 3. This
procedure means that the filling of Tank 3 started
when the stress from Tank 2 was present under
Tank 3 and that the stress reduced at the same rate
as the stress induced from the load in Tank 3
increased.
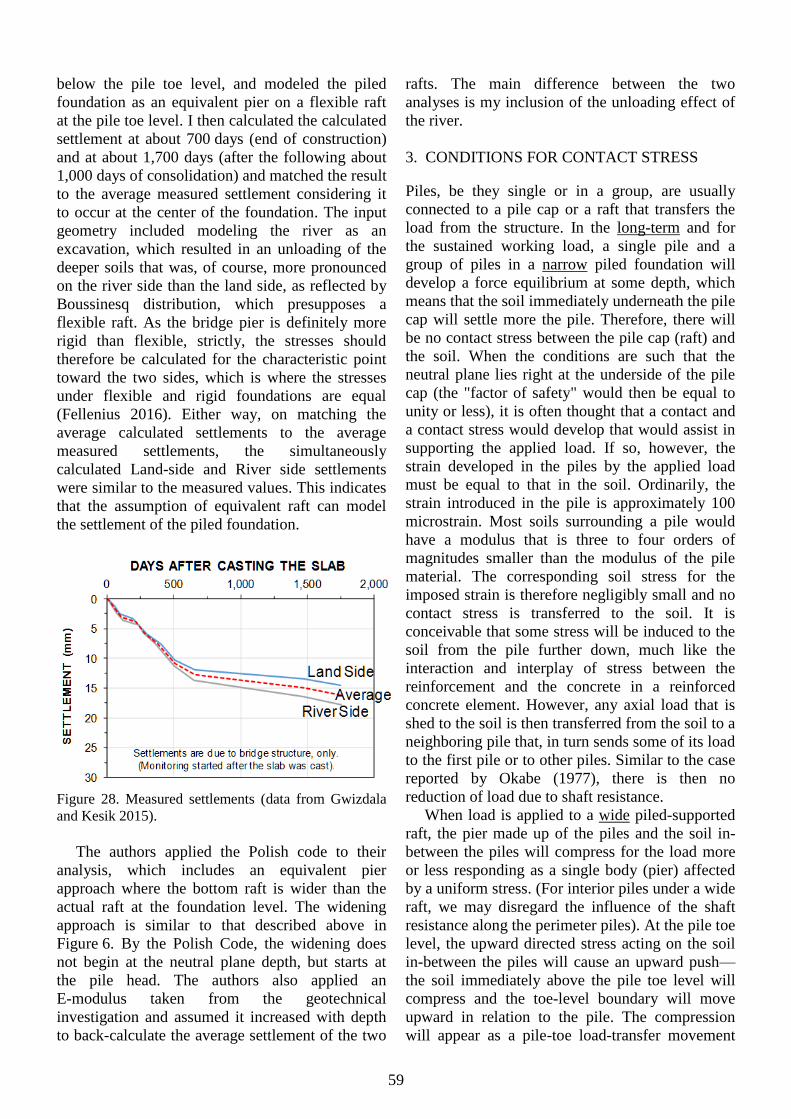
Figure 24 shows the observed settlements for
Tanks 1 and 2 at maximum load and remaining
settlement of Tank 1 after unloading. The settle-
ment for the #2 gages (benchmarks) in Tanks 1
and 2 are about equal, while the settlement for #10
gages show larger settlement for Tank 1 than for
Tank 2, possibly, because the preloading effect
reduced the settlement under the Tank 2 side
closest to Tank 1.
Figure 25 shows the observed settlements for all
three tanks (settlement of Tanks 3 added) at
maximum load and the remaining settlement of
Tank 3 after unloading. No preloading effect
similar to that shown in Figure 24 is noticeable.
Page 19
58
Figure 24. Perimeter settlements for Tanks 1 and 2 at
maximum load and remaining settlement of Tank 1
after unloading. The North direction is assumed
vertical. (Data from van Impe et al. 2013).
Figure 25. Perimeter settlements for Tanks 1, 2, and 3 at
maximum load and remaining settlement of Tank 3
after unloading. The North direction is assumed
vertical. (Data from van Impe et al. 2013).
Unfortunately, no samples were taken for
testing from the clay, so no laboratory tests were
carried out. For the here purpose of addressing the
analysis method for the wide pile group, such
values are not necessary. It is simple to assume that
the three tanks can be analyzed as three equivalent
piers each with an equivalent raft at the pile the
pile toe level and calculate what modulus would fit
the measurements. The so-determined modulus
was used to find that the settlement underneath the
centers would be about twice that of the perimeter.
Of course, a four-day hydrotest does not provide
much information on long-term settlement and
without representative soil parameters, calculation
for long-term development is not meaningful.
Gwizdala and Kesik 2015 reported settlement
records taken on the Third Millennium Bridge in
Gdansk, Poland. This is a cable-stayed road bridge
spanning the Dead Vistula River and links the
Northern Port of Gdansk with the national road
network constructed in 1999 - 2001. The main
bridge component is a single tower, a 100-m tall
reinforced concrete pylon, consisting of a 52.4 x
22.4 m concrete slab supported on 50 bored piles
of 1,800 mm diameter with 30-m embedment. The
total unfactored load was 480 MN and the
unfactored working load per pile was 9,600 kN.
As shown in Figure 26, the piled foundation has
the form of two square grids of 25 piles each with
a 5.8 m, 3.3 diameter center-to-center spacing and
an about 12 % Footprint Ratio.
Figure 26. Pylon pile layout for the Third Millennium
Bridge, Gdansk. (Data from Gwizdala and Kesik,
2015).
Figure 27 shows a vertical section of the
foundation and the geometry toward the river. The
foundation lies close to and parallel to the river.
Over time, starting after the casting of the slab, the
pylon settlement was monitored at eight locations
around the slab, Points #1 through #8 Figure 26).
Figure 27. Vertical section and geometry of the pier.
Figure 28 shows that tower had a slight tilt, i.e.,
the measured settlements differed between the land
side and the river side. Using the UniSettle
software, I input the geometry, assumed values of
compressibility of the pile and soil above and
Dead Vistula River
Page 20
59
below the pile toe level, and modeled the piled
foundation as an equivalent pier on a flexible raft
at the pile toe level. I then calculated the calculated
settlement at about 700 days (end of construction)
and at about 1,700 days (after the following about
1,000 days of consolidation) and matched the result
to the average measured settlement considering it
to occur at the center of the foundation. The input
geometry included modeling the river as an
excavation, which resulted in an unloading of the
deeper soils that was, of course, more pronounced
on the river side than the land side, as reflected by
Boussinesq distribution, which presupposes a
flexible raft. As the bridge pier is definitely more
rigid than flexible, strictly, the stresses should
therefore be calculated for the characteristic point
toward the two sides, which is where the stresses
under flexible and rigid foundations are equal
(Fellenius 2016). Either way, on matching the
average calculated settlements to the average
measured settlements, the simultaneously
calculated Land-side and River side settlements
were similar to the measured values. This indicates
that the assumption of equivalent raft can model
the settlement of the piled foundation.
Figure 28. Measured settlements (data from Gwizdala
and Kesik 2015).
The authors applied the Polish code to their
analysis, which includes an equivalent pier
approach where the bottom raft is wider than the
actual raft at the foundation level. The widening
approach is similar to that described above in
Figure 6. By the Polish Code, the widening does
not begin at the neutral plane depth, but starts at
the pile head. The authors also applied an
E-modulus taken from the geotechnical
investigation and assumed it increased with depth
to back-calculate the average settlement of the two
rafts. The main difference between the two
analyses is my inclusion of the unloading effect of
the river.
3. CONDITIONS FOR CONTACT STRESS
Piles, be they single or in a group, are usually
connected to a pile cap or a raft that transfers the
load from the structure. In the long-term and for
the sustained working load, a single pile and a
group of piles in a narrow piled foundation will
develop a force equilibrium at some depth, which
means that the soil immediately underneath the pile
cap will settle more the pile. Therefore, there will
be no contact stress between the pile cap (raft) and
the soil. When the conditions are such that the
neutral plane lies right at the underside of the pile
cap (the "factor of safety" would then be equal to
unity or less), it is often thought that a contact and
a contact stress would develop that would assist in
supporting the applied load. If so, however, the
strain developed in the piles by the applied load
must be equal to that in the soil. Ordinarily, the
strain introduced in the pile is approximately 100
microstrain. Most soils surrounding a pile would
have a modulus that is three to four orders of
magnitudes smaller than the modulus of the pile
material. The corresponding soil stress for the
imposed strain is therefore negligibly small and no
contact stress is transferred to the soil. It is
conceivable that some stress will be induced to the
soil from the pile further down, much like the
interaction and interplay of stress between the
reinforcement and the concrete in a reinforced
concrete element. However, any axial load that is
shed to the soil is then transferred from the soil to a
neighboring pile that, in turn sends some of its load
to the first pile or to other piles. Similar to the case
reported by Okabe (1977), there is then no
reduction of load due to shaft resistance.
When load is applied to a wide piled-supported
raft, the pier made up of the piles and the soil in-
between the piles will compress for the load more
or less responding as a single body (pier) affected
by a uniform stress. (For interior piles under a wide
raft, we may disregard the influence of the shaft
resistance along the perimeter piles). At the pile toe
level, the upward directed stress acting on the soil
in-between the piles will cause an upward push—
the soil immediately above the pile toe level will
compress and the toe-level boundary will move
upward in relation to the pile. The compression
will appear as a pile-toe load-transfer movement
Page 21
60
that generates a shaft resistance up along the piles,
gradually reducing the vertical stress in the soil by
transferring the stress to the piles. This is
illustrated in Figure 29, showing a pile-supported
wide raft (say, 1.0-m diameter, square, concrete
piles at a 3.3-m spacing). The in-between soil can
be considered (analyzed) as an upside-down "soil-
pile" with its "head" at the pile toe level, its shaft
resistance along the pile (the square) in the center,
and its "toe" at the cap level.
Figure 29. Section and geometry of piles and soil.
At the pile toe level, in contrast to the condition
at the underside of the raft, the strain in the soil is
independent of the strain in the piles. The soil will
compress some distance up from the toe level until
there is an equilibrium between the stress (coming
from below) required to compress the soil and the
shaft resistance built-up along a corroborating
distance up the piles. The mechanism is similar to
the that of the soil core inside an open-toe pipe-pile
being pushed upward inside the pipe, generating a
"core resistance" along a limited length above the
pile toe (Fellenius 2015). The length is limited to
the pile toe load-movement (i.e., the apparent pile
toe penetration), which distance is very much
smaller than the compression necessary to generate
a stress in the soil all the way up to the pile head
and pile cap level.
The apparent pile-toe movement and the
maximum compression of the soil-pile are equal.
Even with a very large toe movement of 30 mm or
more, the compression of the soil would not extend
to anywhere near the pile cap level.
4. A PILED FOUNDATION EXAMPLE
To expound the procedures of the Unified Method,
the method is applied to a typical example of a
wide piled foundation, say, a storage tank, as
follows. A hypothetical site comprises a 15 m thick
layer of soft compressible clay followed by 25 m
of dense silt and sand on hard soil at 40 m depth.
The clay layer is subject to a gradual regional
subsidence. A structure imposing a 64-MN
sustained load (no live load), will be constructed at
the site. The foundation consists of a hexagonal
piled raft with a 3.0-m side-to-side distance. The
designers have decided to use 91 round precast
concrete piles with 300-mm diameter, placed at
a 3.0 diameter center-to-center equilateral spacing.
Figure 30 shows the raft footprint and the soil
profile.
Figure 30. The raft footprint and soil profile with
alternative pile lengths.
To assist the hypothetical design, four test piles are
assumed installed to embedment lengths of 30, 25,
20, and 15 m. Figure 31 shows the hypothetical
pile-head load-movement curves of the tests. The
pile-toe response was assumed to be the same for
all four tests and the pile-toe load-movement curve
is included in the figure. The tests were terminated
when the pile toe movement was 30 mm.
CLAY
91 pilesb = 300 mm
c/c = 3 b
SILT and
Sand
GW
15 m
25 m
//
20 m
25 m
30 m
15 m
4.5 m
Supported load (shown as stress)
Contact Stress only at impossibly
large movements
Shaft resistance only near the pile
toe level.
Stress imposed to the toe level.
Same for soil and pile toe.
Upward soil movement
Downward piletoe movement
Pile 1.0 m side; 1.0 m2
Footprint Ratio = 10 %
Soil-Pile 3.32 m side; 10.0 m2
Page 22
61
Figure 31. Hypothetical load-movement curves
Storage tanks frequently have outside appurten-
ances that need to be supported on single piles and
small pile groups. If the working load (Q) applied
to such piles outside the raft is the same as the
average raft piles, i.e. Q= 700 kN, then, the
required pile length appears to be 25 m. Not
because the "capacity" of the 25-m pile appears to
be around twice the working load, but because the
long-term settlement is acceptable, as indicated by
the results of the unified-method analysis shown in
Figure 32 (only showing the load distribution for
the match of the toe force and toe movement).
A single pile would be subjected to a drag force
of about 150 kN, which would be of no
consequence. The drag force would be smaller for
a shorter pile, but that pile would have the neutral
plane up in the settling clay and suffer excessive
downdrag and be unsuitable. To design for a longer
pile would be spending more money than
warranted.
The various methods employing analysis and
relations such as the RR and DR would provide
estimates of the long-term settlements for the pile
raft. Here, I will apply the equivalent pier and
equivalent raft methods I used to back-calculate the
case histories quoted in Section 2.
Equations 1 and 2 determine the pier stiffness.
(The Footprint Ratio is 12 % and the pile modulus
is assumed to be 30 GPa). The height of the
equivalent pier is the pile length and, thus, the
calculated compressions of the equivalent piers for
the 15, 20, 25, and 30 m pile lengths are 5, 6, 8,
and 10 mm, respectively.
The dominant settlement is that developing in
the silt and sand layer below the pile toe level and
it is a function of the compressibility of that layer. I
made use of the effortless freedom of a
hypothetical example and simply selected the
compressibility that gave a 25 mm total settlement
for the piled raft supported on 25 m long piles.
Using UniSettle, I then calculated, employing
the same compressibility, the settlement of
equivalent rafts placed at the other three depths.
Figure 33 shows, as a function of pile length, the
settlements calculated for the characteristic point of
the raft of the equivalent pier, the equivalent raft,
and the two combined, i.e., the total settlement for
the piled raft. The equivalent raft values are shown
as a bar, where the center of the bar is the
settlement calculated for the characteristic point,
which is representative for a rigid raft. The left and
right ends of the bar are settlements calculated
(using UniSettle) for the raft side and center,
respectively, for the Boussinesq stress distribution,
0
5
10
15
20
25
0 500 1,000 1,500
DE
PT
H (
m)
LOAD (kN)
0
5
10
15
20
25
0 50 100 150
SETTLEMENT (mm)
0 25 50
LO
AD
MOVEMENT (mm)
LO
AD
Toe Response
Neutral Plane
Qd
500 kN
500 kN
500 kN
LOAD (kN)
500 kN
Fig. 32 Load distribution and match between toe resistance and settlement.
0
500
1,000
1,500
2,000
0 10 20 30 40 50 60
LO
AD
(k
N)
MOVEMENT (mm)
30 m
25 m
20 m
15 m
1,400 kN
1,000 kN
700 kN
2,000 kN
TOE
Q
Page 23
62
Figure 33. Settlements versus pile depth.
which is considered representative for a flexible
raft. Thus, the bar indicates the range of the
differential settlement of the flexible equivalent
raft, and, therefore, also of a flexible piled raft.
Two results are evident from the figure. First,
the settlement contributed by the equivalent raft for
the example below the pile toe level is larger than
that of the compression of the equivalent pier.
Second, designing the piled foundation on shorter
piles appears to result in very small additional
settlement beyond those of the 25-m "pure" piled
foundation. Obviously, were it possible to use
fewer piles, potential savings could be realized. For
example, if the spacing would be increased to 3.75
pile diameters, while keeping the dimensions of the
raft, the number of piles needed would reduce
to 61. The corresponding reduction of the FR
to 8 % would result in an about 30 % increased
calculated pier compression, a moderate value. The
settlement of the equivalent raft would be the
same. The total settlement for such an enhanced
piled raft would increase to about 30 mm from the
about 25 mm value for the "pure" option.
4. CONCLUSIONS
The key aspect to consider in foundation design is
settlement. Past practice assumed that, if the factor
of safety against bearing failure was adequate,
then, the settlement due to the load would be
acceptable to the structure supported. However,
even when compensating for the fact that bearing
failure, i.e., "capacity", is for most situations a very
approximate and imprecise condition, this
assumption is not always true. In contrast, a piled
foundation for which the settlement, properly
analyzed, is acceptable, will also have adequate
safety against failure by any definition of the latter.
A foundation design should therefore be directed
toward determining settlement and letting capacity
reasoning take second place. The unified method
satisfies the requirement by employing interaction
of forces and movements to determine the short-
and long-term settlements for a single pile or a
narrow pile group.
In regard to foundations supported on single
piles or narrow pile groups, how the loads are
transferred to the soil along the pile shaft and the
pile toe together in interaction with the settlement
in the surrounding soil governs the settlement of
the foundation. In a homogenous soil deposit
thicker than the length of the piles, the settlement
for a piled foundation on short piles will be larger
than that for a foundation on long piles, everything
else equal. For both, the presence and magnitude of
downdrag may decide whether or not the
foundation is acceptable. (Note that issues of drag
force, however, are only of concern with regard to
the pile axial structural strength and are irrelevant
to capacity and settlement considerations).
The case histories reported by Briaud et al.
(1989) and O'Neill et al. (1982), indicated that
small-group piles (5 and 9 piles, respectively) do
not interact, but respond as single piles to the load.
The here quoted case histories and several
similar cases presented by Fellenius and Ochoa
(2016) have been back-calculated by several
authors simulating the measured settlement
response by means of various numerical methods.
My review of the case histories show that the same
records can be back-calculated employing the
concept of an equivalent pier placed on an
equivalent raft at the pile toe level employing only
a response to the increased stress in the soil and
including no ultimate resistance methods. That is, a
wide piled foundation, whether it is considered as a
"hybrid" raft, an "enhanced raft", a "piled raft", a
"piled pad", or a "pure piled foundation" can be
modeled as an equivalent pier on an equivalent raft
placed at the pile toe level. The settlement is then
calculated as the sum of the compression of the
pile and soil making up a pier with a stiffness
proportioned between the pile and the soil plus the
settlement of the equivalent raft. The here quoted
case histories provide interesting observations
pertinent to some issues of wide foundations, but
no analysis method applied to the case histories is
shown to be clearly advantageous, superior, or
more "correct" than another, including the
equivalent pier and equivalent raft method.
0
5
10
15
20
25
30
35
40
0 5 10 15 20 25 30 35 40
DE
PT
H (
m)
SETTLEMENT (mm)
Equivalent Pier
Equivalent Raft
TOTAL
Page 24
63
The conventional understanding of the
difference between a wide "pure" piled foundation
and a piled raft is that the piles in the former have a
"capacity", by some definition or other, that
significantly exceeds the average working load
applied to the foundation, whereas the "capacity"
of the piles in the latter is at most about the same as
the working load, i.e., the factor of safety is about
1.0, or even smaller. It is generally thought that a
contact stress between the raft and the soil would
develop for the latter type and that the contact
stress would provide additional bearing resistance
to the raft foundation as opposed to no contact
stress (where the raft is above the ground level).
The contact stress analysis shown in Section 3
indicates that whether or not contact stress
develops is a function of the pile shaft resistance,
not the total resistance: contact stress would only
develop if the applied load per pile is larger than
the shaft resistance (defined per some movement
criterion)—otherwise not. However, for a wide pile
foundation, the strain in the pile (at the raft
underside) must be equal to the strain in the soil
immediately underneath the raft. The amount of
strain decides the stress in the piles as well as the
stress in the soil, that is, the contact stress. The
strain imposed in the pile by a usual working load
rarely exceeds 100 µϵ. That same strain in a natural
soil with a 50 MPa upper limit of E-modulus,
which would be a stiff soil, indicates a soil contact
stress of no more than about 5 kPa. It may be quite
possible that the contact stress cells reported by
Russo and Viggiani (1995) and Mandolini et al.
(2005) were working properly, after all.
Furthermore, the condition for the presence of
shaft resistance along the pile surface, i.e.,
presence of a shear zone, is that the pile moves
down relative the soil. However, near the pile
underside of a wide piled raft (N.B., in contact with
the soil), the pile can neither move more nor less
than the soil. Right at the raft underside, therefore,
there cannot be a relative movement between the
pile and the soil, i.e., the pile does not slide past the
soil, and no shaft resistance can be mobilized. If
the contact stress would be a significant, the soil
strain would be correspondingly large, but it could
still be no larger than the pile strain, that is, the
stress cannot be "significant", but must be
negligible. Deeper down below the raft, the shaft
resistance is governed by the movement due to the
difference between the soil strain accumulated to
compression (large) and the pile compression
(small).
To mobilize shaft resistance, a pile has to move
in relation to the soil, which it does not do at the
connection to the pile cap (the raft). However, does
the pile move against the soil further down the pile
or is the soil just there for the ride? The case
history by Okabe (1977) indicated that shaft
resistance mobilized along interior piles would be
smaller than that of a single pile, or perimeter piles,
as it should be; it cannot be larger than the weight
of the soil in-between the piles.
The observations reported by Lee and Xiao
(2001) showed that a single passive pile reacted to
the loading of another pile (active pile) located up
to 3 m away, indicating that one pile will interact
with neighboring piles in a group. The interaction
may result in the piles and soil responding together
as a single pier or block. This would enable the
foundation to rely on shaft resistance along the
perimeter of the pile group, that is, the foundation
would benefit from the many times larger surface
of the pier as opposed to that of the sum of the
surface of the individual piles. It would be an
interesting experiment to remove the soil along the
outward facing side of the perimeter of a pile group
and measure the resulting change. Say, by
excavating a trench enveloping the group.
As also actually successfully designed and
constructed enhanced piled foundations bear out,
e.g., Tan et al. 2005, Poulos (2009; 2013),
Katzenbach et al. (2009), Ching-Han You (2011),
and Rudianto (2016), significant savings can be
realized by selecting an enhanced piled
foundations—a "piled raft employing fewer and
shorter piles. However, there is a dearth of full-
scale case histories reporting settlement
measurements on wide pile-enhanced foundations,
i.e., foundations on piles with a significantly larger
working load per pile than would ordinarily be
considered for a single pile at the site and no full-
scale cases reporting measurements of strain and
relative movement between the piles and the soil
underneath the raft.
The settlement in the soils below the pile toe
level can be modeled by applying conventional
methods of settlement analysis to an equivalent raft
loaded by the permanent load from the structure
supported. To obtain a reliable design requires
good quality data on the compressibility of the
soils under the pile toe level and the potential
influence of stress changes due to adjacent features
of the site.
Page 25
64
The equivalent raft method has the advantage of
making it easy to incorporate excavations, stress
from adjacent structures, variations of soil layer
thickness and composition across a site,
groundwater table fluctuations, elevation
differences, and other influencing aspects.
Moreover, the method allows for the time
dependency, e.g., influence of consolidation, to be
included in the analysis. The approach is simple
enough to apply in a spreadsheet calculation, e.g.,
Excel, although professional engineering software,
such as UniPile and UniSettle, greatly simplify and
speed up the analysis.
As most pile rafts are more or less flexible, a
larger portion of the applied load will go to the
interior piles and a smaller to the perimeter piles.
Moreover, because the perimeter piles face the
outside soil, they take on larger shaft resistance
than of the interior piles, especially so the corner
piles. Because of the combination of smaller load
and larger shaft resistance, the perimeter piles are
frequently installed shorter than the interior piles.
However, perimeter piles will eventually be
subjected to fully mobilized drag forces. Same
length or shorter, their axial response will therefore
be softer than that of the interior piles, and the
perimeter piles will not take their full share of the
load on the raft unless they, instead, are longer. If
the surrounding soil is "non-settling", the process
would take time, but it will always occur.
The case history by Okabe (1977) shows a long-
term difference in drag force between perimeter
and interior piles. A similar observation was made
by Liew et al. (2002) who reported measurements
on a 17.5 wide tank raft supported on 137 shaft
bearing piles in soft compressible clay and stated
that the observations showed that the interior piles
provided "more support stiffness" to the applied
load on the raft than the perimeter piles. The pile
diameter was 350 mm, the spacing was 1.5 m (4
pile diameters), and the Footprint Ratio was 6 %.
Case histories reporting the response of pile
groups to an applied load are usually limited to
measurements of settlement in a few points on the
pile cap, usually along the perimeter, only, and
often only over a very short length of time (hydro
testing of tanks, for example). None of the case
histories reports separately the settlement from the
zone within the pile depth from that underneath the
pile toe level. Yet, the several more or less
sophisticated methods in use for analysis of piled
foundation response apply assumptions regarding
the distributions of forces from the pile cap to the
pile and the soil, and between the piles and the soil
with depth. The latter take the lead from the
response of a static loading test on a single pile,
frequently performed without any instrumentation.
Most papers presenting foundation analysis
methods verify them by back-analysis of
observations. Such analyses, including the
equivalent pier/raft method, applied to the
mentioned case histories only verify that the model
can be fitted to a set of records. However, any and
every method can show a god fit in a back-
calculation of measurements.
Many have "predicted" the measurements
reported in the quoted case histories by applying
various methods of analysis, some more complex
than others, and all also found an agreement
between the calculated and measured settlements.
However, it is not enough that a model can produce
a good agreement in a back-calculation, it has to be
shown to work also in a true prediction, i.e., in a
design condition.
The adequacy of the design calculations is not a
function of the sophistication of the model or the
computer program employed, but of (1) the
adequacy of the soil information and (2) the quality
and representativeness of the parameters used as
input to the analyses. Both are somewhat lacking in
the state-of-the-practice of foundation design.
Moreover, when a theory involves more than
one or two parameters, before it can be stated that
it truly represents actual response so as to be useful
to predict a response, i.e., be used in the design of a
foundation, the calibration of the method applied to
the model using the measured response must also
include measurements of the relevant input
parameters of the model. If contact stress is a key
part of the model, the analysis must be supported
by measurements showing contact stress and soil
strain to exist and that the measurements are
commensurate with those assumed before the test.
Calling a calculation "a prediction" does not make
it one. Indeed, if the analysis model depends on
pile-soil interaction, it is not sufficient to just
measure axial load distribution in the piles. The
soil forces and soil deformations must also be
recorded.
To improve the reliability of the design of piled
foundations, research building up case histories
must include instrumentation and monitoring of
response to load applied to a pile group and single
piles, including recording not just the settlement of
the pile cap, but also:
Page 26
65
the movements between the pile and the
soil at depths, in particular at the pile toe
level
the distribution of strain and movement in
the soil with depth
the earth stress against the piles
the axial load distribution both in perimeter
and interior piles
the pile toe penetration into the soil and this
compared to that of a single pile
the settlement below the pile toe level
It is not financially possible to carry out a stand-
alone research project, but detailed instrumentation
and monitoring of actual, well-defined projects
(e.g., wide tanks) are needed. Direct research will
have to be satisfied by studying small piled
foundations. Figure 34 shows the layout of a
forthcoming pile-group test to be performed in the
ISSMGE TC212 experimental field in Bolivia. The
pile group comprises 13 piles to be tested by
simultaneous bidirectional tests on all piles
(Phase 1) and, then, a simultaneous head-down test
on all piles (Phase 2) measuring loads, movements,
and strain in the pile and in the soil surrounding the
piles. The results will be presented to the 3rd
Bolivian International Conference on Deep
Foundations in Santa Cruz, Bolivia, in April 2017
(https://www.cfpbolivia.com).
Figure 34. Layout of the pile group planned for the
ISSMGE TC212 test in Bolivia April 2017.
ACKNOWLEDGEMENTS
I owe thanks to Messrs. Mauricio Ochoa and
Stoney Mather for their suggested edits and
constructive critique.
REFERENCES
Amini, A, Fellenius, B.H., Sabbagh, M.,
Naaesgaard, E., and Buehler, M., 2008. Pile
loading tests at Golden Ears Bridge. 61st Can.
Geot. Conf., Edmonton, Sept. 21-24, 2008, 8 p.
Badellas, A., Savvaidis, P. and Tsotos, S., 1988.
Settlement measurement of a liquid storage tank
founded on 112 long bored piles. Second Int.
Conference. on Field Measurements in
Geomechanics, Kobe, Japan, Balkema
Rotterdam, pp. 435-442.
Briaud, J.L., Tucker, L.M., and Ng, E. 1989.
Axially loaded 5-pile group and single pile in
sand. 12th ICSMFE, August 13-18, Rio de
Janeiro, Vol. 2, pp. 1121–1124.
Broms, B.B., 1976. Pile foundations—pile groups.
6th ECSMFE ,Vienna, Vol. 2.1 pp. 103-132.
Caputo, V. and Viggiani, C. 1984. Pile foundation
analysis: a simple approach to nonlinearity
effects. Rivista Italiana di Geotecnica, 18(2):
32–51.
Ching-Han Yu, 2011. On Design and Construction
of Pile Group Foundation of Taipei 101. Geot.
Engng. Journal of the SEAGS and AGSSEA
42(2) 56-69.
Fellenius, B.H., 1984. Negative skin friction and
settlement of piles. Proceedings of the Second
International Seminar on Pile Foundations,
Nanyang Technological Inst., Singapore, 18 p.
Fellenius, B.H., 1988. Unified design of piles and
pile groups. Transportation Research Board,
Washington, TRB Record 1169, pp. 75-82.
Fellenius, B.H., 2014a. Piled foundation design as
reflected in codes and standards. Proceedings
DFI-EFFC Int. Conf. on Piling and Deep
Found., Stockholm, May 21-23, pp. 1013-1030.
Fellenius, B.H., 2014b. An instrumented screwpile
loading test and connected pile-group load-
settlement behavior. Discussion. Jour. of Geo-
Engineering Sciences, IOS Press, 1(2) 101-108.
Fellenius, B.H., 2015. The response of a "plug" in
an open-toe pipe pile Geot. Engng. Journal of
the SEAGS and AGSSEA 46(2) 82-86
Fellenius, B.H., 2016. Basics of foundation design.
Electronic Edition [www.Fellenius.net], 451 p.
Fellenius, B.H. and Ochoa, M., 2016. Wide storage
tanks on piled foundations. Geot. Engng. Jour.
of the SEAGS and AGSSEA 47(1) 50-62.
Goudreault, P.A. and Fellenius, B.H., 2011.
UniSettle Version 4 tutorial with background
and analysis examples. UniSoft Geotechnical
Solutions Ltd. [www.UniSoftLtd.com]. 85 p.
Page 27
66
Goudreault, P.A. and Fellenius, B.H., 2014.
UniPile Version 5, User and Examples Manual.
UniSoft Geotechnical Solutions Ltd.
[www.UniSoftLtd.com]. 120 p.
Gwizdala, K. and Kesik, P., 2015. Pile group
settlement, methods, examples of calculations
referred to measurement results carried out in
field tests. 16th ECSMGE, Edinburgh,
September 13-17, pp. 1091-1096.
Katzenbach, R., Ramm, H., and Choudhury, D.,
2012. Combined piled-raft foundation—a
sustainable concept. Ninth International
Conference on Testing and Design Methods for
Deep Foundations, Kanazawa, Japan,
September 18-20, 10 p.
Katzenbach, R. and Choudhury, D., 2013.
ISSMGE Combined piled-raft foundation
guideline. Technische Universitat Darmstadt,
Institute and Laboratory of Geotechnics,
Darmstadt, 23 p.
Liew, S.S., Gue, S.S, and Tan, Y.C., 2002. Design
and instrumentation results of a reinforced
concrete piled raft supporting 2,500-tonne oil
storage tank on very soft alluvium deposits. 9th
International Conference. on Piling and Deep
Foundations, Nice, June 3-5, pp. 263-269.
Lee, K.M. and Xiao, X.R., 2001. A simplified
nonlinear approach for pile group settlement
analysis in multilayered soils. CGJ 38(6)
1063-1080.
Likins, G.E., Fellenius, B.H., and Holtz, R.D.,
2011. Pile Driving Formulas—Past and Present.
ASCE Geo-Congress Oakland, March 25-29,
2012, Full-scale Testing in Foundation Design,
State of the Art and Practice in Geotechnical
Engineering, M.H. Hussein, K.R. Massarsch,
G.E. Likins, and R.D. Holtz, eds., ASCE, GSP
227, pp. 737-753.
Mandolini, A., Russo, G. and Viggiani, C. 2005.
Pile foundations: experimental investigations,
analysis, and design. 16th ICSMGE, Osaka,
Japan, September 12–16, pp. 17-213.
Okabe, T., 1977. Large negative friction and
friction-free piles methods. 9th ICSMFE,
Tokyo, July 11-15, Vol. 1, pp. 679-682.
O'Brian, A.S., Burland, J.B., and Chapman, T.,
2012. Chapter 56. Rafts and piled rafts. Manual
of Geotechnical Engineering, Institution of
Civil Engineers, London, Ch. 56, pp. 853-886.
O’Neill, M.W., Hawkins, R.A., and Mahar, L.J.
(1982). Load transfer mechanisms in piles and
pile groups. ASCE J., 108(12) 1605-1623.
Pecker, A.. 2004. Design and Construction of the
Rion Antirion Bridge. Conf. on Geot. Engng for
Transportation Projects, Geo-Trans, ASCE Los
Angeles July 27-31, 2004, Eds. M.K. Yegian
and E. Kavazanjian, Vol. 1 pp. 216-240.
Phung Duc Long, 2010. Piled Raft – A cost-
effective foundation method for high-rises.
Geot. Engng. Journal of the SEAGS and
AGSSEA 41(3) 1-12.
Phung Duc Long, 1993. Footings with settlement-
reducing piles in non-cohesive soil. Swedish
Geotechnical Institute, Report 43, 179 p.
Poulos, H.G., 2009. Tall buildings and deep
foundations—Middle East challenges. 17th
ICSMGE Alexandria, October 5-9, pp. 3173-
3205.
Poulos, H.G., 2013. Challenges in the design of tall
building foundations. Geot. Engng. Journal of
the SEAGS and AGSSEA 45(4) 108-112.
Randolph, M.F. and Clancy, P., 1993. Efficient
design of piled rafts. Second Int. Geot. Seminar
on Deep Foundations on Bored and Auger Piles,
Ghent, 1–4 June, 993, pp. 119–130.
Rudianto, S., 2016. Foundation design and
construction on karstic rock for a 92-storey
tower in Kuala Lumpur, Malaysia. Annual
Congress of Indonesian Structural Engineer
Association, Jakarta, August 23-24, 8 p.
Russo, G. and Viggiani, C. (1995). Long-term
monitoring of a piled foundation. Fourth Int.
Symp.on Field Measurements in Geomechanics,
Bergamo, pp. 283–290.
Savvaidis, P., 2003. Long term geodetic
monitoring of deformation of a liquid storage
tank founded on piles. 11th FIG Symposium on
Def. Measurements, Santorini, Greece, 8p.
Tan, Y.C., Chow, C.M., and Gue, S.S., 2005. A
design approach for piled raft with short friction
piles for low rise buildings on very soft clay.
Geot. Engng. Journal of the SEAGS and
AGSSEA 36(1) 870102.
van Impe, P.O., VanImpe, W.F., and Seminck, L.,
2013. Instrumented screwpile load test and
connected pile-group load-settlement behavior.
Journal of Geo-Engineering Sciences, IOS
Press, 1(1) 13-36.
van Impe, W.F., 2016. A case study of large screw-
pile groups behavior. Symposium on Pile
Design and Displacements, May 27, Den
Hague., 74 p.