FINANCIAL REPORT ANLYSIS LETTER OF TRANSMITTAL May 26, 2008 Mrs. Shumaila Israr Course Instructor, Financial Management Bahria University Karachi. Madam: We herewith present our “Term Report” authorized by you as a requirement for this course. In this report, we have tried to provide analysis of financial statements of Lucky Cement Ltd. We hope we have covered all that was required for the report. If there be any clarification demanded, we would appreciate a call from you to our group members. Sincerely, Muhammad Zain Ahsan Faheem Muhammad Usman Badar BAHRIA UNIVERSITY KARACHI Page 1
Transcript
FINANCIAL REPORT ANLYSIS
LETTER OF TRANSMITTAL
May 26, 2008
Mrs. Shumaila Israr
Course Instructor, Financial Management
Bahria University Karachi. Madam:
We herewith present our “Term Report” authorized by you as a requirement for this course.In this report, we have tried to provide analysis of financial statements of Lucky Cement Ltd.
We hope we have covered all that was required for the report.
If there be any clarification demanded, we would appreciate a call from you to our group members.
Sincerely,
Muhammad Zain
Ahsan Faheem
Muhammad Usman Badar
BAHRIA UNIVERSITY KARACHI Page 1
FINANCIAL REPORT ANLYSIS
ACKNOWLEDGEMENT
In the name of “Allah”, the most beneficent and merciful who gave us strength and knowledge to complete this report. This report is a part of our course “Financial Management”. This has proved to be a great experience. This report is a combine effort of Muhammad Zain, Ahsan Faheem & Muhammad Usman Badar.We would like to express our gratitude to our Finance teacher Ms. Shumaila Israr; who gave us this opportunity to fulfill this report. We would also like to thank our colleagues who participated in a focus group session. They gave us many helpful comments which helped us a lot in preparing our report.
BAHRIA UNIVERSITY KARACHI Page 2
FINANCIAL REPORT ANLYSIS
VISION STATEMENT AND MISSION STATEMENT OF LUCKY CEMENT LTD.
VISION
Our vision is to supply cement globally at ease, simultaneously publicizing our brand worldwide and identifying our social responsibility by engaging in a number of social welfare activities, for
the benefit of poor and needy people.
MISSION
We are an industrial organization with a big capital base, using state of the art technology in manufacturing and marketing of cement globally. Our strength lies in the continuous value addition of the Company through sound investments in sustainable areas for customers, employees and shareholders. With no compromise on quality and a vital role to play in social responsibilities we seek innovative answers to complex problems.
BAHRIA UNIVERSITY KARACHI Page 3
FINANCIAL REPORT ANLYSIS
COMPANY PROFILE
Sponsored by well known “Yunus Brothers Group – one of the largest export houses of Pakistan”, Lucky Cement Limited is presently a 21,000 Tons Per Day, dry process Cement Plant.
Lucky Cement came into existence in 1996 with a daily production capacity of 4200 Tons par day, currently is an omnipotent cement plant of Pakistan, and rated amongst the few best Plants in Asia
With production facilities in Pezu (Production capacity: 13,000 Tons per day) as well as in Karachi (Production capacity: 8000 Tons per day) it has the tendency to become the hub of cement production in Asia.
In addition, Lucky Cement is aggressively pursuing to develop export markets for cement to export bulk loose cement from Pakistan to the Gulf Countries, African Markets, and Far East Region including Nepal & Sri Lanka. Considering sizeable exports potential, Lucky Cement has decided to increase the capacity of its Karachi Plant by addition of two more Production lines, having capacity of 2.5 Million Tons per Annum. The expansion program is likely to be completed by end 2008.
It is the desire of Lucky Cement to put Pakistan on world map as a leading producer & exporter of loose cement in international market.
Lucky cement has made an investment of over US$ 8 Million to develop the infrastructure & logistics and is further developing a fleet of cement bulkers to carry loose cement from its Karachi Plant to the Ports.
For loading cement form the bulkers to vessels, Lucky Cement has a dedicated system for discharging cement directly from the bulkers to the vessels; at very fast discharge rates, reducing the vessels idle time in turn making the shipments timely as per the customer requirements.
Lucky Cement has also installed Jumbo Packers at its Karachi Plant to dispatch cement in one ton packing requirement.
All this and much more have made Lucky Cement the largest cement producer, with major emphasis on supply of superior quality cement to its consumers.
BAHRIA UNIVERSITY KARACHI Page 4
FINANCIAL REPORT ANLYSIS
COMPANY’S PRODUCTS
Lucky Cement aims at producing cement to suit every user. The following types of cement are available:
ORDINARY PORTLAND CEMENT (OPC)Ordinary Portland cement is available in darker shade as well as in light shades in Lucky Star
with different brand names to suit the requirement of users.
It is used in all general constructions especially in major prestigious projects where cement is to meet stringent quality requirements; it can be used in concrete mortars and grouts etc. Ordinary
Portland cement is compatible/consumable with admixture/ retarders etc.
SULPHATE RESISTANT CEMENT (SRC)Sulphate resistant Cement’s best quality is to provide effective and long lasting strength against
sulphate attacks and is very suitable for constructions near sea shores as well as for canals linings. It provides very effective protection against alkali attacks.
SLAG CEMENTSlag cement is also available for specific user requirements.
Slag cement, has been incorporated into concrete projects for over a century to improve durability and reduce life cycle costs. Among its measurable benefits in concrete are better
workability and finish ability, higher compressive and flexural strengths, and improved resistance to aggressive chemicals.
CORE VALUES & OUR BUSINESS STRATEGY
BAHRIA UNIVERSITY KARACHI Page 5
FINANCIAL REPORT ANLYSIS
At Lucky Cement we comprehend our core values to be the most significant factor leading to the existence and growth of this prestigious organization.
How we accomplish our mission is as vital as the mission itself. Thus these values are not only on paper and pen but lounge deep in the heart of each individual working or associated with lucky cement.
These values are reflected within the name of LUCKY itself: They are as follows.
L = LEADERSHIP - We don't just innovate industry practices - we are defining the way business will be done in the future. We are pioneers.
U = UNDERSTANDING - Whereby we understand the demands of cement industry at a global level, parallel to the needs of people, associated with us in one way or the other.
C = COMMITMENT - One word that sums it all at Lucky Cement is the commitment of people to quality, relationship and most importantly our customers, who can never be disappointed at any cost.
K = KONSTANT - The most important element to balance any equation worldwide, at Lucky Cement we assign the value of Konstant with consistency of profits, as profits are required to sustain and grow any organization. They are in-turn the ultimate measure of efficiency.
Y = YOU - This attitude is a built-in character. At lucky cement we always maintain, ‘You first, Me last’ approach, not only to please but to delight our employees, shareholders, customers, and all the other people who expect a result from Lucky Cement.
BAHRIA UNIVERSITY KARACHI Page 6
FINANCIAL REPORT ANLYSIS
RATIO ANALYSIS
A statistic has little value in isolation. Hence, a profit figure of Rs.100 million is meaningless unless it is related to either the firm’s turnover (sales revenue) or the value of its assets. Accounting ratios attempt to highlight the relationships between significant items in the accounts of a firm.
Financial ratios are the analyst’s microscope; they allow them to get a better view of the firm’s financial health than just looking at the raw financial statements
Ratios are used by both internal and external analysts
Internal uses
Planning Evaluation of management
External uses
Credit granting Performance monitoring Investment decisions Making of policies
CATEGORIES OF FINANCIAL RATIOSBAHRIA UNIVERSITY KARACHI Page 7
FINANCIAL REPORT ANLYSIS
The accounting ratios can be grouped in to six categories:
1. Liquidity Ratios shows the extent to which the firm can meet its financial obligations.
2. Asset Management Ratios shows how effectively the firm manages its assets.
3. Debt Management Ratios examine the degree to which a firm uses debt financing or financial leverages.
4. Profitability Ratios relates profits to sales and assets.
5. Market Value Measures are a measure of the return on investment.
RATIO ANALYSIS OF LUCKY CEMENT YEAR 2006-2007
BAHRIA UNIVERSITY KARACHI Page 8
FINANCIAL REPORT ANLYSIS
LIQUIDITY RATIOSA fully liquidity analysis requires the use of cash budgets, but by relating the amount of cash and other current assess to current obligations, ratio analysis provides a quick, easy-to-use measure
of liquidity.
2006
Current ratio = Current Asset Current Liabilities
= 4455494000 4752035000
Current ratio = 0.938 times
2007
Current ratio = Current Asset Current Liabilities
= 5402678000 6352556000
Current ratio = 0.85 times
ANALYSIS:Although in both years the position of the company to pay off its short term debt is not very good. It is necessary for the company that its current ratio remains above 1 time to meet its short term obligations and in the case of lucky cement the current of year 2007 is declining because the short obligations (liabilities) are increasing at a faster pace than its current assets.
2006
BAHRIA UNIVERSITY KARACHI Page 9
FINANCIAL REPORT ANLYSIS
Quick ratio = Current Asset- Inventory Current Liabilities
= 4455494000 - 431418000 4752035000
Quick ratio = 0.847 times
2007
Quick ratio = Current Asset- Inventory Current Liabilities
= 5402678000-676256000 6352556000
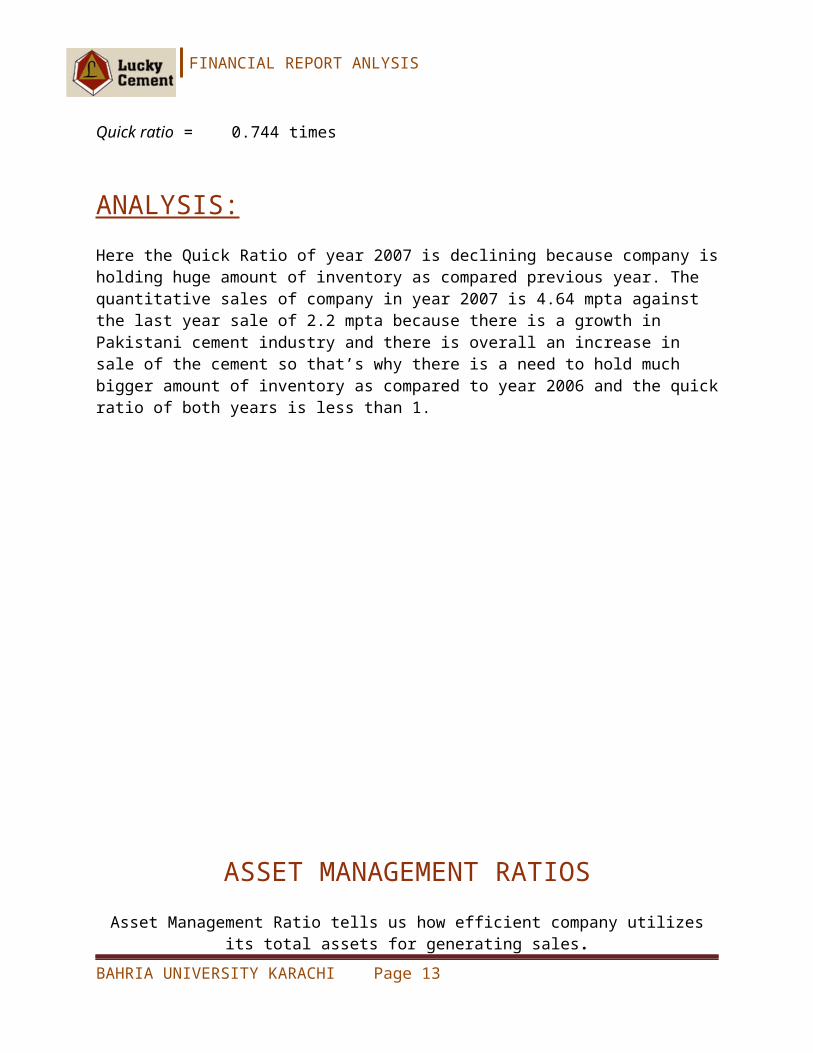
Quick ratio = 0.744 times
ANALYSIS:Here the Quick Ratio of year 2007 is declining because company is holding huge amount of inventory as compared previous year. The quantitative sales of company in year 2007 is 4.64 mpta against the last year sale of 2.2 mpta because there is a growth in Pakistani cement industry and there is overall an increase in sale of the cement so that’s why there is a need to hold much bigger amount of inventory as compared to year 2006 and the quick ratio of both years is less than 1.
BAHRIA UNIVERSITY KARACHI Page 10
FINANCIAL REPORT ANLYSIS
ASSET MANAGEMENT RATIOSAsset Management Ratio tells us how efficient company utilizes its total assets for generating
sales.
2006
Inventory turnover = Sales Avg inventory
= 8054101000 431418000
Inventory turnover = 18.669 times
2007
Inventory turnover = Sales Avg inventory
= 12521861000 676256000
Inventory turnover = 18.516 times
ANALYSIS:Inventory Turnover Ratio indicates the effectiveness of the inventory management practices of the firm. The inventory turnover of year 2007 is less than the inventory turn over of year 2006 but as the whole cement industry is growing and the company is maintaining a big amount of inventory as compare to the inventory of year 2006 so that’s why the inventory turnover is decreasing and the inventory turnover ratio of year 2006 was 18.669 which indicates that 18.669 times in a year the inventory of the firm is converted into receivables or cash. However, in 2007, the inventory turnover ratio decreased to 18.516. This was due to the fact that the company, in 2007, invested more in inventory as compared to previous year.
2006
BAHRIA UNIVERSITY KARACHI Page 11
FINANCIAL REPORT ANLYSIS
Average collection period = Account Receivable * 365 Sales
Account Receivables = Trade debts+ other receivables
= 98389000+83912000 = 182301000
Average collection period = 182301000 * 365 8054101000
Average collection period = 8.262 days
2007
Average collection period = Account Receivable * 365 Sales
Account Receivables = Trade debts+ other receivables
= 476667000+176546000 = 653213000
Average collection period = 653213000 * 365 12521861000
Average collection period = 19.041 days
ANALYSIS:Credit policy is defined as the maximum time period allowed to the customer to pay back.The average collection period in the year 2006 was 8.262 days which means that the firm is able to collect its receivables within approximately 10 days. However, in 2007, the average collection period increased to 19.041 days, thus now the company is collecting its receivable within approximately 20 days. There could be many reasons for this increase in average collection period such as, problem in management, lack of incentive given to its customers or undependable customer.
2006
BAHRIA UNIVERSITY KARACHI Page 12
FINANCIAL REPORT ANLYSIS
Fixed Asset turnover = Sales Fixed Asset
= 8054101000 19165108000
Fixed Asset turnover = 0.42 times
2007
Fixed Asset turnover = Sales Fixed Asset
= 12521861000 20318908000
Fixed Asset turnover = 0.616 times
ANALYSIS:The fixed turnover ratio measures how effective the firm uses plant and equipment.The role of fixed asset is to support the sales. The fixed Asset turnover ratio of year 2007 is 0.616 times and in year 2006 was 0.42 this shows that as the fixed asset increases there is also an increase in the sales.
2006
BAHRIA UNIVERSITY KARACHI Page 13
FINANCIAL REPORT ANLYSIS
Total Asset turnover = Sales Total Asset
= 8054101000 23622777000
Total Asset turnover = 0.341 times
2007
Total Asset turnover = Sales Total Asset
= 12521861000 25723761000
Total asset turnover = 0.487 times
ANALYSIS:The final asset management ratio the total asset turn over ratio measures the turnover of all the firm assets and help us to identify when problem occur that is a problem in fixed assets or in current assets.. In 2006, it was 0.341 times and in year 2007 is 0.487 this change was brought about by an increase of 55.5% in the sales. Where as the total assets only increased by 8.8%.
BAHRIA UNIVERSITY KARACHI Page 14
FINANCIAL REPORT ANLYSIS
DEBT MANAGEMENT RATIOShows the extent to which the firm is financed by debt.
2006
Debt ratio = Total Debt Total Asset
= 16553144000 23622777000
Debt ratio = 70.1 %
2007
Debt ratio = Total Debt Total Asset
= 16370211000 25723761000
Debt ratio = 63.6 %
ANALYSIS:The debt to equity ratio in 2006 was 70.1% which shows that 70.1% of financing through debt. However in 2007 the debt to equity ratio decreased to 63.6% which shows that the company curtails its financing through debts although there is an decline in the risk the company facing but still the firm debt financing on the higher side as compared to ideal situation which is 60% equity & 40% debt.
2006
BAHRIA UNIVERSITY KARACHI Page 15
FINANCIAL REPORT ANLYSIS
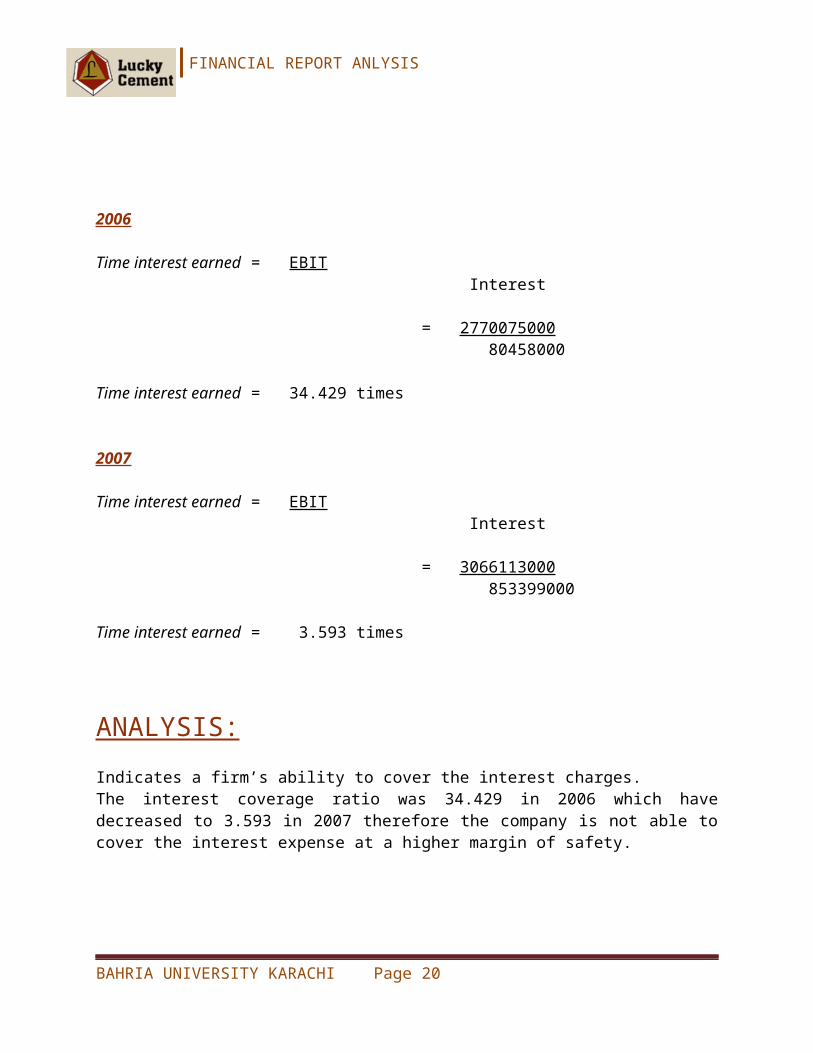
Time interest earned = EBIT Interest
= 2770075000 80458000
Time interest earned = 34.429 times
2007
Time interest earned = EBIT Interest
= 3066113000 853399000
Time interest earned = 3.593 times
ANALYSIS:Indicates a firm’s ability to cover the interest charges.The interest coverage ratio was 34.429 in 2006 which have decreased to 3.593 in 2007 therefore the company is not able to cover the interest expense at a higher margin of safety.
2006
BAHRIA UNIVERSITY KARACHI Page 16
FINANCIAL REPORT ANLYSIS
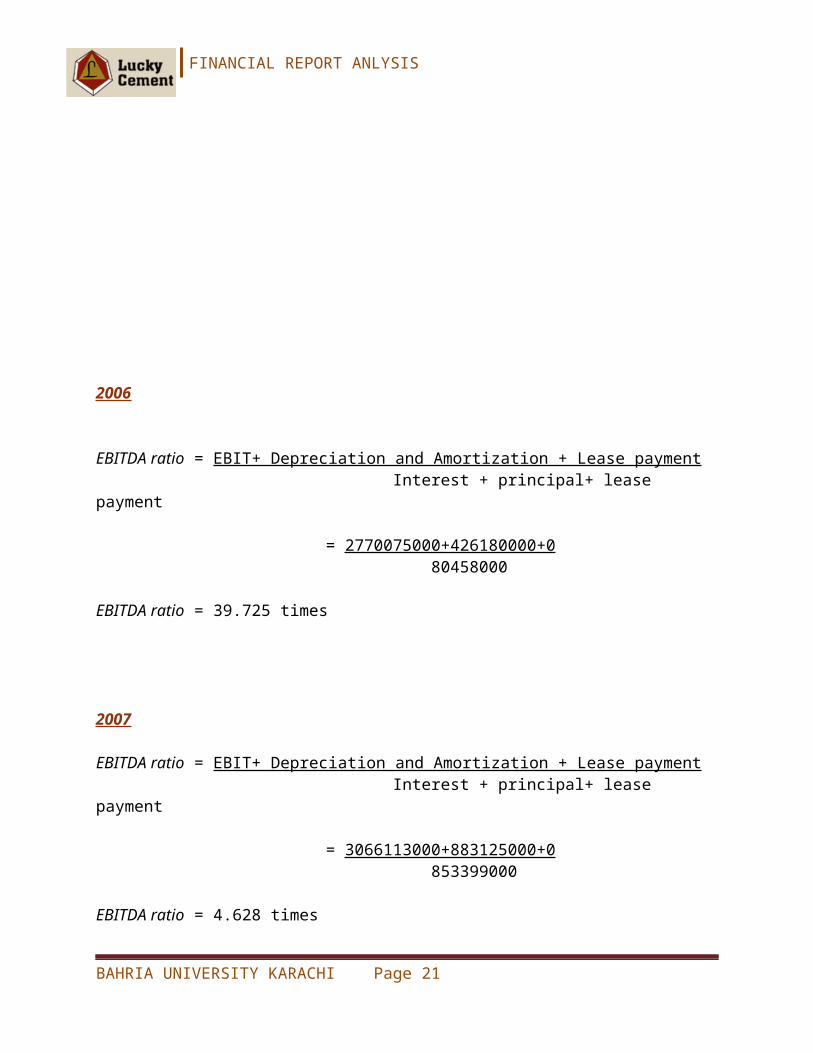
EBITDA ratio = EBIT+ Depreciation and Amortization + Lease payment Interest + principal+ lease payment
= 2770075000+426180000+0 80458000
EBITDA ratio = 39.725 times
2007
EBITDA ratio = EBIT+ Depreciation and Amortization + Lease payment Interest + principal+ lease payment
= 3066113000+883125000+0 853399000
EBITDA ratio = 4.628 times
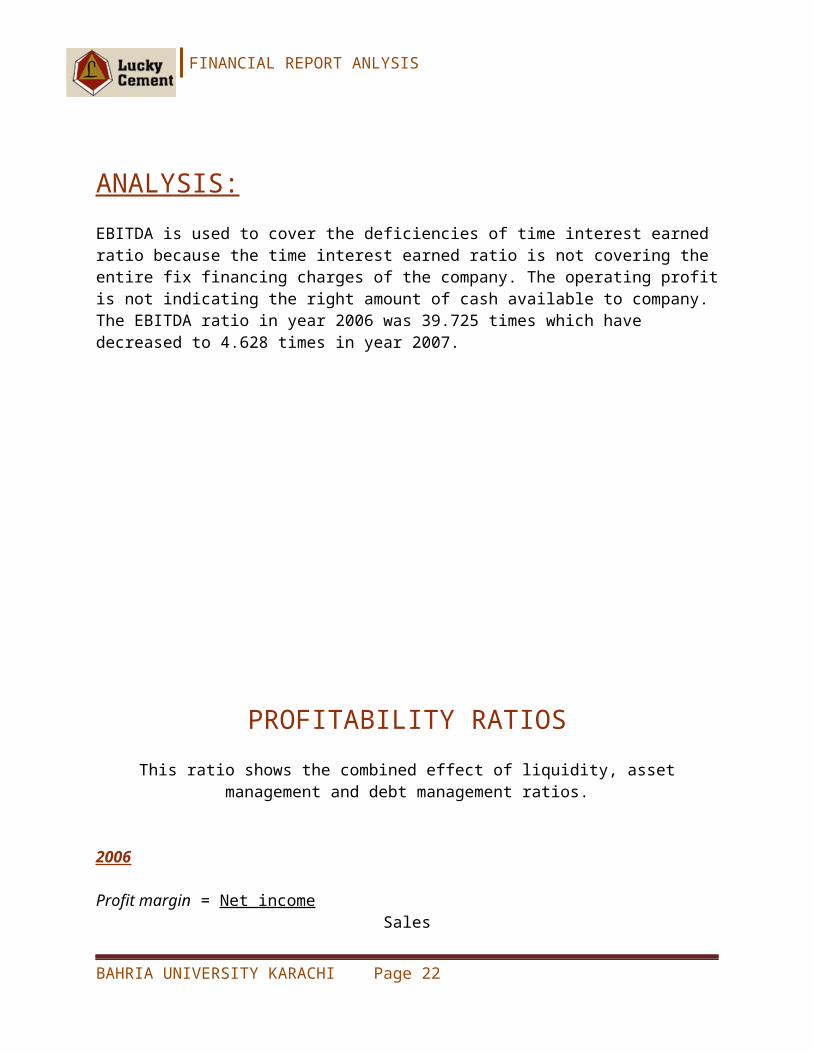
ANALYSIS:EBITDA is used to cover the deficiencies of time interest earned ratio because the time interest earned ratio is not covering the entire fix financing charges of the company. The operating profit is not indicating the right amount of cash available to company. The EBITDA ratio in year 2006 was 39.725 times which have decreased to 4.628 times in year 2007.
BAHRIA UNIVERSITY KARACHI Page 17
FINANCIAL REPORT ANLYSIS
PROFITABILITY RATIOSThis ratio shows the combined effect of liquidity, asset management and debt management
ratios.
2006
Profit margin = Net income Sales
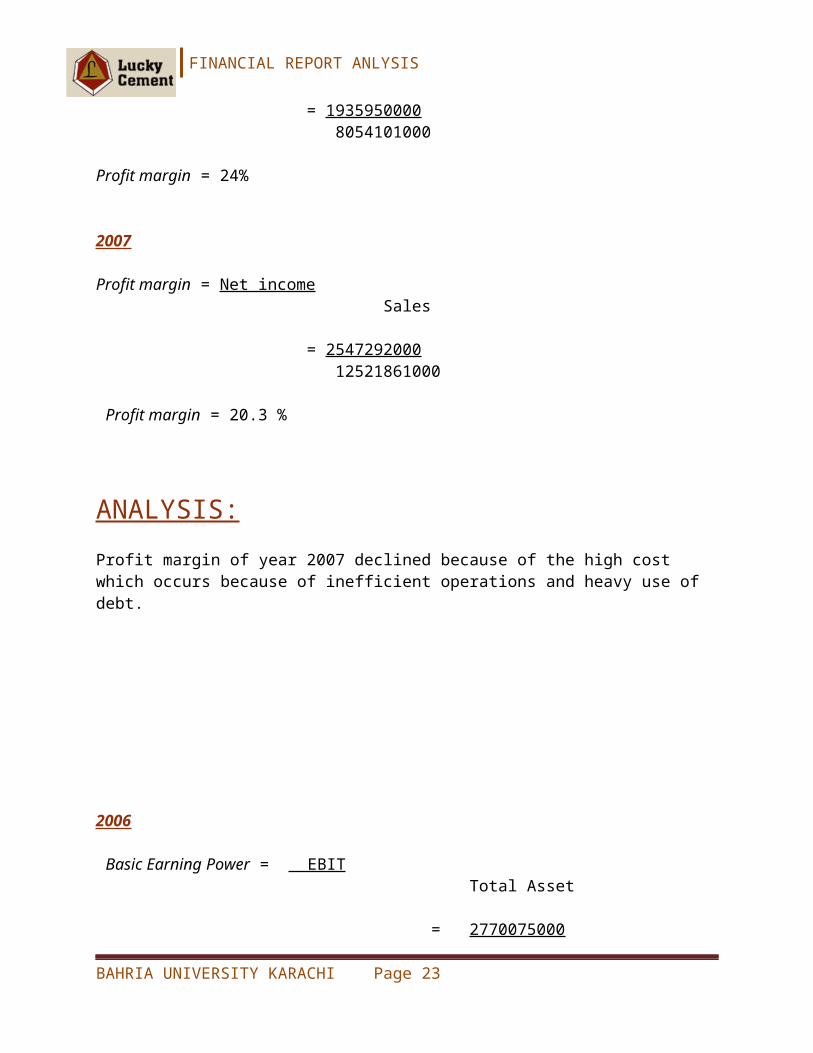
= 1935950000 8054101000
Profit margin = 24%
2007
Profit margin = Net income Sales
= 2547292000 12521861000
Profit margin = 20.3 %
ANALYSIS:Profit margin of year 2007 declined because of the high cost which occurs because of inefficient operations and heavy use of debt.
2006
BAHRIA UNIVERSITY KARACHI Page 18
FINANCIAL REPORT ANLYSIS
Basic Earning Power = EBIT Total Asset
= 2770075000 23622777000
Basic Earning Power = 11.7%
2007
Basic Earning Power = EBIT Total Asset
= 3066113000 25723761000
Basic Earning Power = 11.9%
ANALYSIS:
This ratio shows the raw earning power of the firm asset before the influence of taxes and leverage and it is useful for comparing firm with difference tax situations and different degrees of financial leverage. The BEP of year 2006 was 11.7 % which increased little bit in 2007 to 11.9% the result shows that operating profit of year 2007 is growing by 1.1% .
2006
BAHRIA UNIVERSITY KARACHI Page 19
FINANCIAL REPORT ANLYSIS
Return on Asset = Net income Total Asset
= 1935950000 23622777000
Return on Asset = 8.19 %
2007
Return on Asset = Net income Total Asset
= 2547292000 25723761000
Return on Asset = 9.9 %
ANALYSIS:The Return on Assets gradually rose in year 2007, to 9.9% from 8.19%, in year 2006. Total asset increased by 8.8%.This shows that the company uses its total assets more efficiently over these years which also increased net income over the years. This ratio shows that how much company has earned on its assets.
BAHRIA UNIVERSITY KARACHI Page 20
FINANCIAL REPORT ANLYSIS
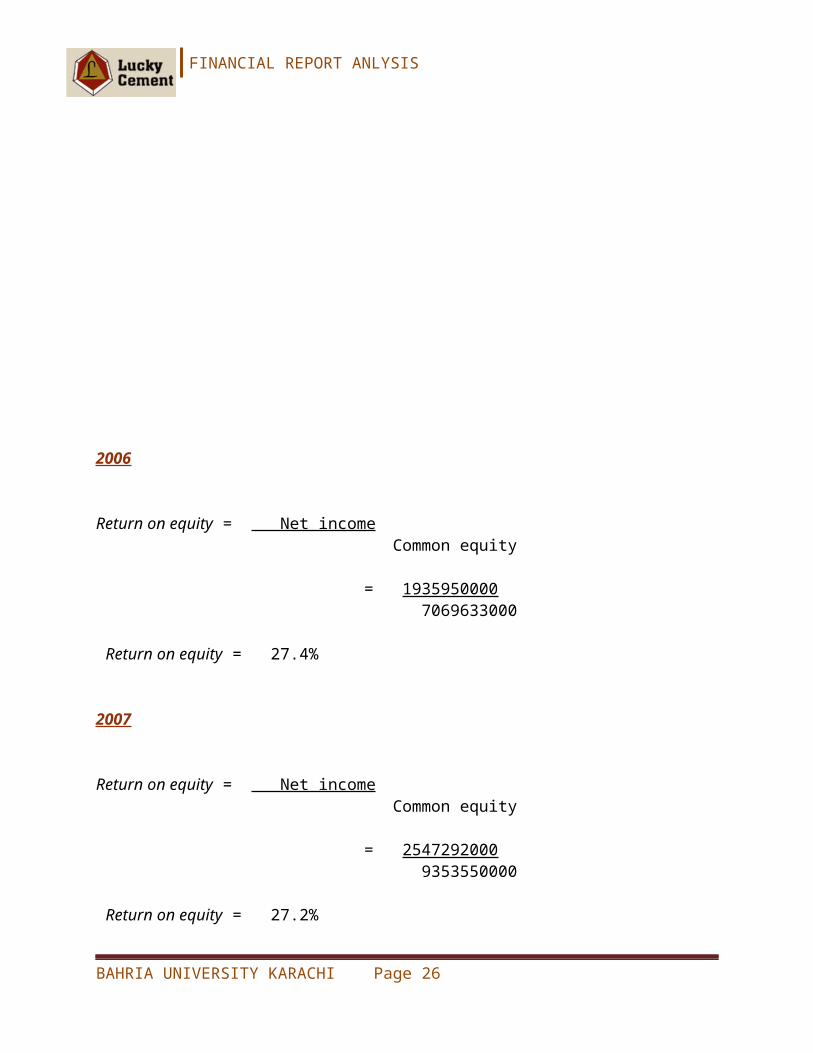
2006
Return on equity = Net income Common equity
= 1935950000 7069633000
Return on equity = 27.4%
2007
Return on equity = Net income Common equity
= 2547292000 9353550000
Return on equity = 27.2%
ANALYSIS:
This ratio is the most important ratio for investor point of view. This ratio shows that how much investors get return on their money that they have invested in company stocks. If we compare the ROE of 2006 to 2007 there is a decline on ROE by 0.02% and this is not a good sign for the investors to invest in company shares and this is also a threat to Lucky cement because it is the goal of every company to maximize its shareholders wealth.
MARKET VALUE RATIOSBAHRIA UNIVERSITY KARACHI Page 21
FINANCIAL REPORT ANLYSIS
It relates the firm’s stock price to its earning, cash flow, and book value per share. These ratios give management an identicationof what investors think of the company’s past performance and
future prospects.
2006
Price per share / EPS = Price per share EPS
= 127 7.35
Price per share / EPS = 17.279 times
2007
Price per share / EPS = Price per share EPS
= 127 9.67
Price per share / EPS = 13.133 times
Analysis:
(P/E) ratio shows how much investor are willing to pay per Rupee of reported profits. In comparison of 2006 and 2007 (P/E) ratio there is a decline in (P/E) ratio by 4.146 times in 2007. This shows that there is a weak growth prospect of the company and the company is much riskier then other companies in the industry and the investors are not willing to take risk.
2006
BAHRIA UNIVERSITY KARACHI Page 22
FINANCIAL REPORT ANLYSIS
Price per share / Cash flow = Price per share Cash flow
# of shares = Net income EPS
= 1935950000 7.35
# of shares = 263394558
Cash flow = Net income + Non cash expense # of share
= 1935950000+417441000 263394558
Cash flow = 8.935
Price per share/ Cash flow = 127 8.935
Price per share/ Cash flow =14.214 times
2007
BAHRIA UNIVERSITY KARACHI Page 23
FINANCIAL REPORT ANLYSIS
Price per share / Cash flow = Price per share Cash flow
# of shares = Net income EPS
= 2547292000 9.67
# of shares = 263422130
Cash flow = Net income + Non cash expense # of share
= 2547292000 + 883125000 263422130
Cash flow = 13.023
Price per share/Cash flow = 127 13.023
Price per share/Cash flow = 9.75 times
Analysis:There is a decline in the Price/Cash Flow Ratio in year 2007 this ratio show that the company growth prospect is weak and the company is more risky.
BAHRIA UNIVERSITY KARACHI Page 24
FINANCIAL REPORT ANLYSIS
2006
Market / Book value ratio = Market value per share Book value per share
Book value = Common equity # of shares
= 7069633000 263394558
= 26.840
Market/Book value ratio = 127 26.840
Market/Book value ratio = 4.732 times
2007
Market / Book value ratio = Market value per share Book value per share
Book value = Common equity # of shares
= 9353550000 263422130
= 35.508
Market/Book value ratio = 127 35.508
Market/Book value ratio = 3.577 times
BAHRIA UNIVERSITY KARACHI Page 25
FINANCIAL REPORT ANLYSIS
Analysis:
This ratio of stock’s market price to its book value gives another indication of how investors regard the company. This ratio shows that how much investor are willing to pay more for the stocks than their accounting book value. As the M/B ratio is decline in 2007 to 3.577 times this shows that investors willingness to buy the Lucky cement share is decreasing and this also a bad sign for the Lucky cement company.
Additional Fund Needed (AFN)BAHRIA UNIVERSITY KARACHI Page 26