58
Chapter 37 David Sutton
| Date post: | 18-Aug-2015 |
| Category: |
Education |
| Upload: | muhammad-bin-zulfiqar |
| View: | 61 times |
| Download: | 1 times |

Chapter 37 David Sutton

DAVID SUTTON PICTURES
DR. Muhammad Bin Zulfiqar PGR-FCPS III SIMS/SHL
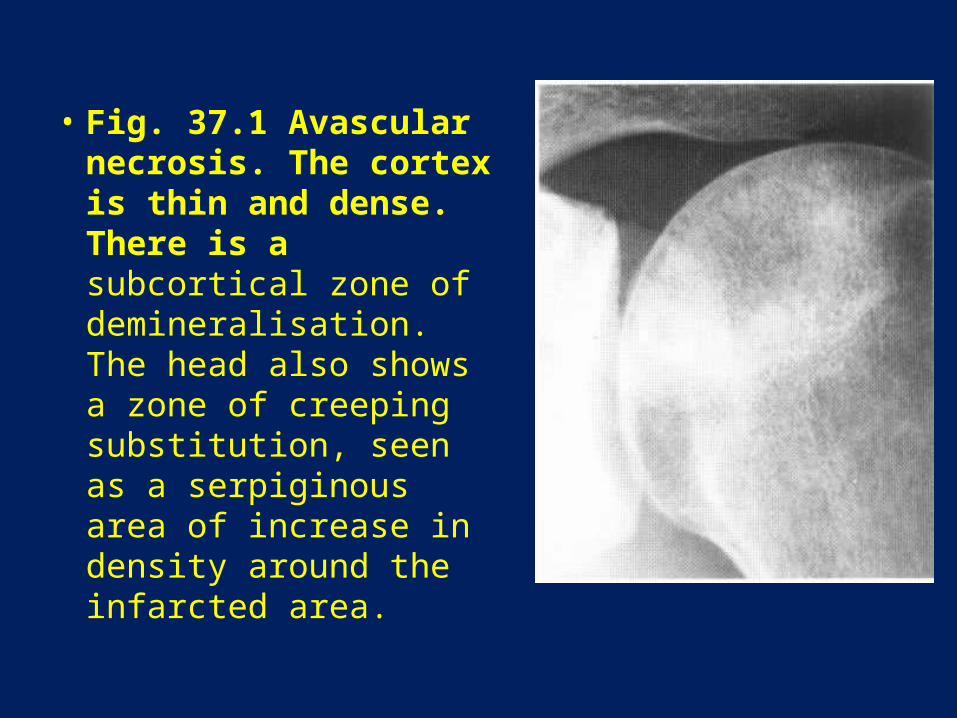
• Fig. 37.1 Avascular necrosis. The cortex is thin and dense. There is a subcortical zone of demineralisation. The head also shows a zone of creeping substitution, seen as a serpiginous area of increase in density around the infarcted area.
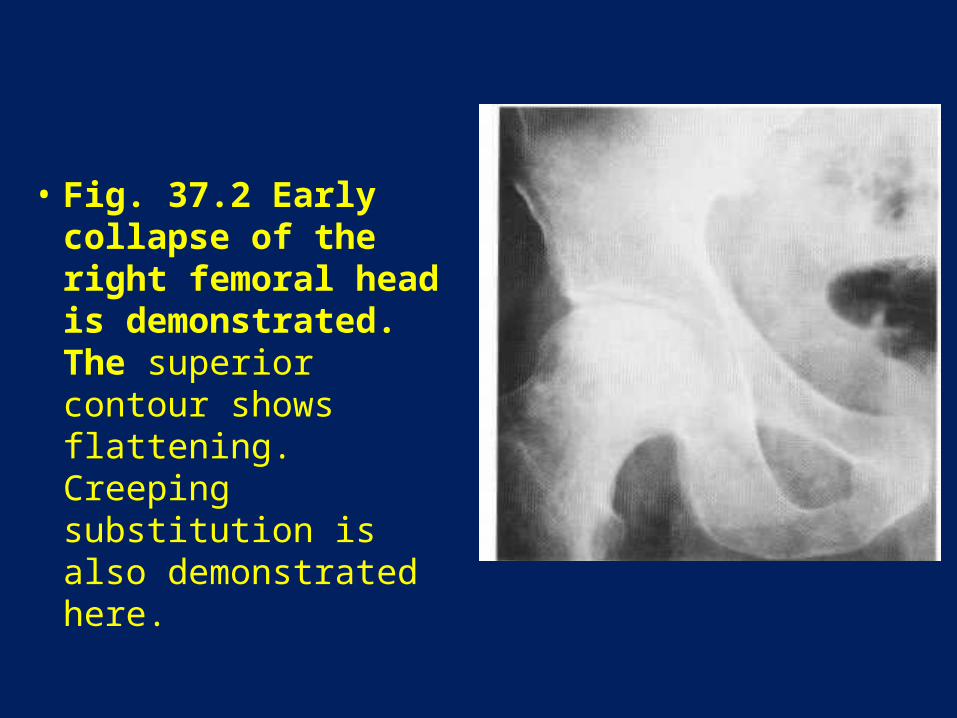
• Fig. 37.2 Early collapse of the right femoral head is demonstrated. The superior contour shows flattening. Creeping substitution is also demonstrated here.

• Fig. 37.3 Avascular necrosis. Structural failure with fractures of both femoral heads. There is subarticular cyst formation and sclerosis resulting from trabecular compression.

• Fig. 37.4 Sickle cell disease. There is widespread sclerosis of bone following infarction. The hip joint space is narrowed and the femoral head has migrated superolaterally. This may be the result of infection. A split cortex or bone-within-a-bone appearance is seen within the proximal femur (arrows).
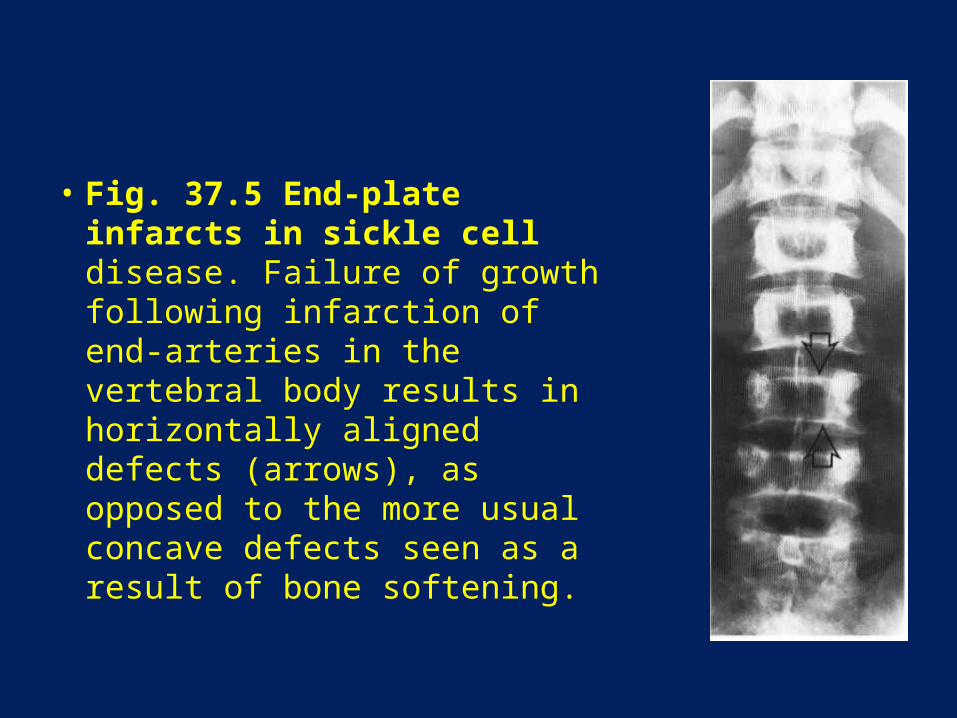
• Fig. 37.5 End-plate infarcts in sickle cell disease. Failure of growth following infarction of end-arteries in the vertebral body results in horizontally aligned defects (arrows), as opposed to the more usual concave defects seen as a result of bone softening.
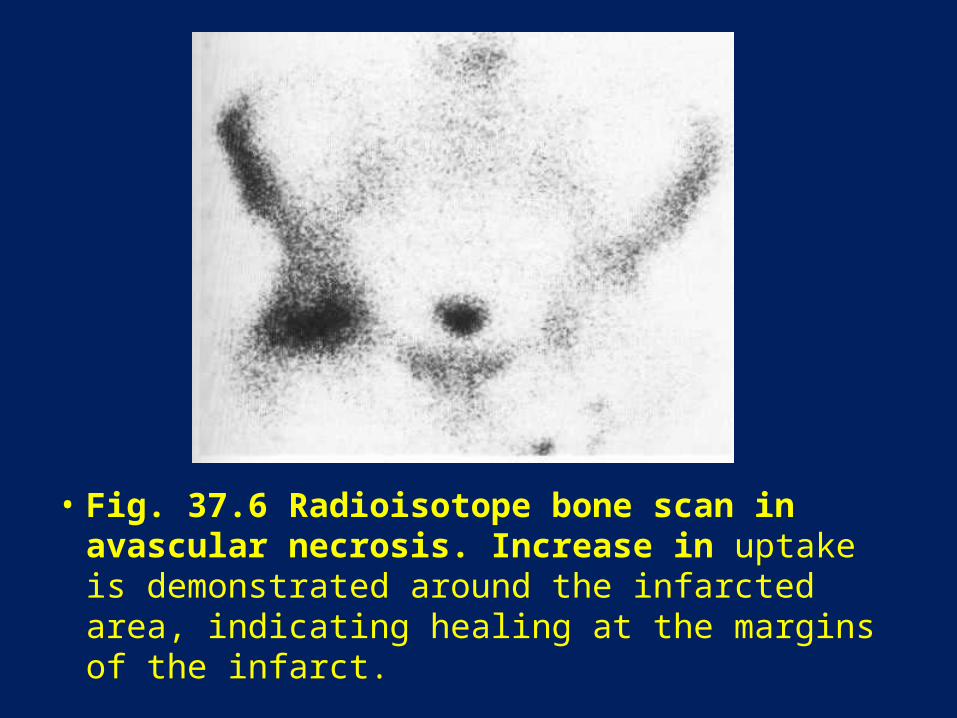
• Fig. 37.6 Radioisotope bone scan in avascular necrosis. Increase in uptake is demonstrated around the infarcted area, indicating healing at the margins of the infarct.
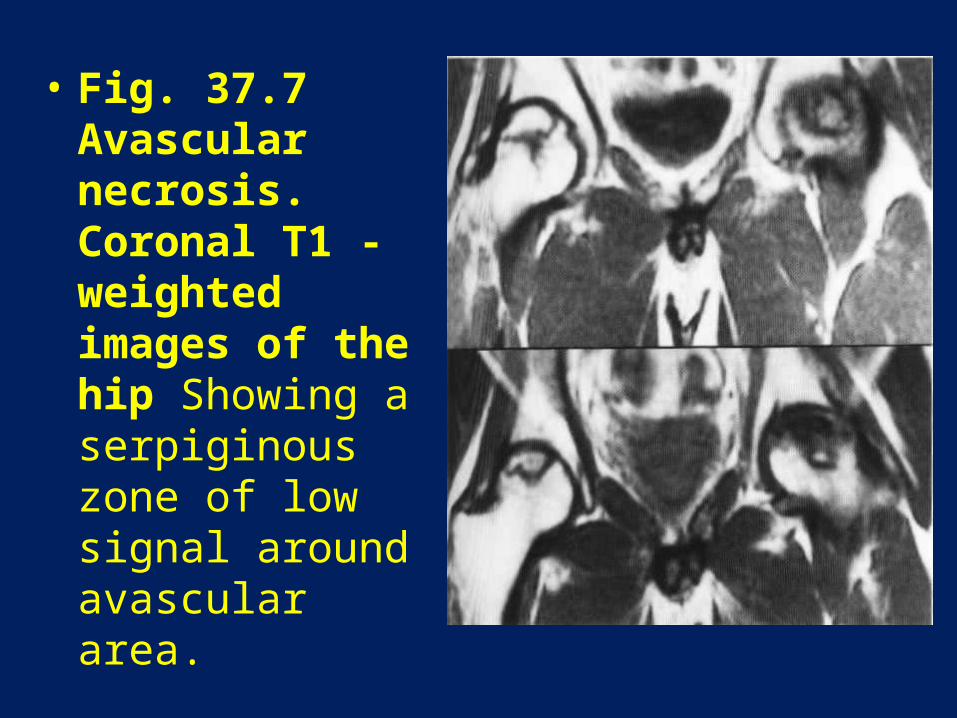
• Fig. 37.7 Avascular necrosis. Coronal T1 -weighted images of the hip Showing a serpiginous zone of low signal around avascular area.
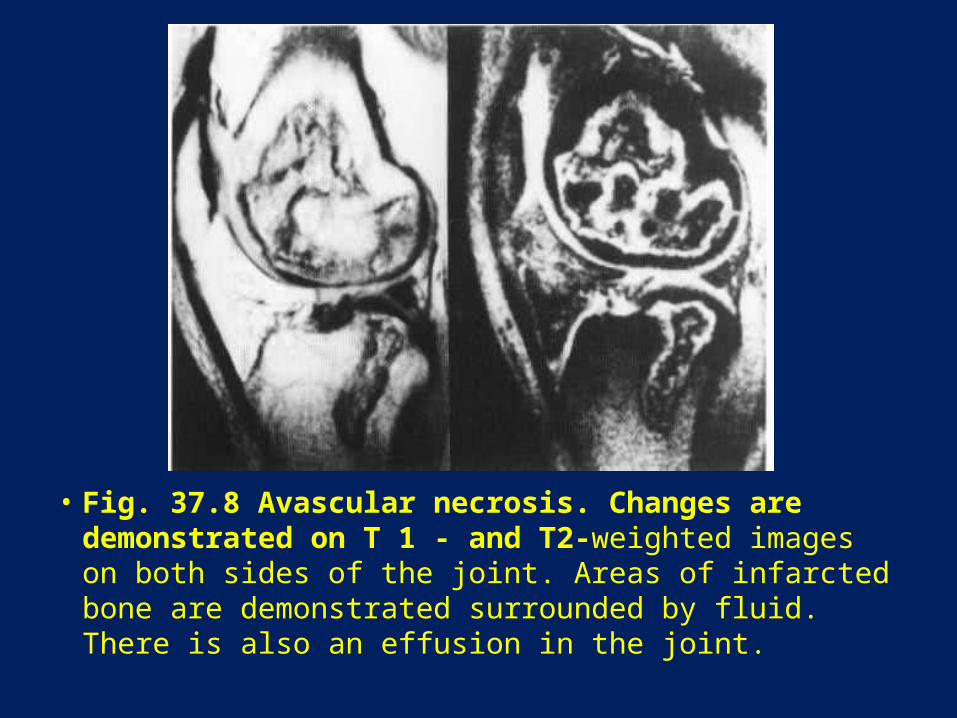
• Fig. 37.8 Avascular necrosis. Changes are demonstrated on T 1 - and T2-weighted images on both sides of the joint. Areas of infarcted bone are demonstrated surrounded by fluid. There is also an effusion in the joint.
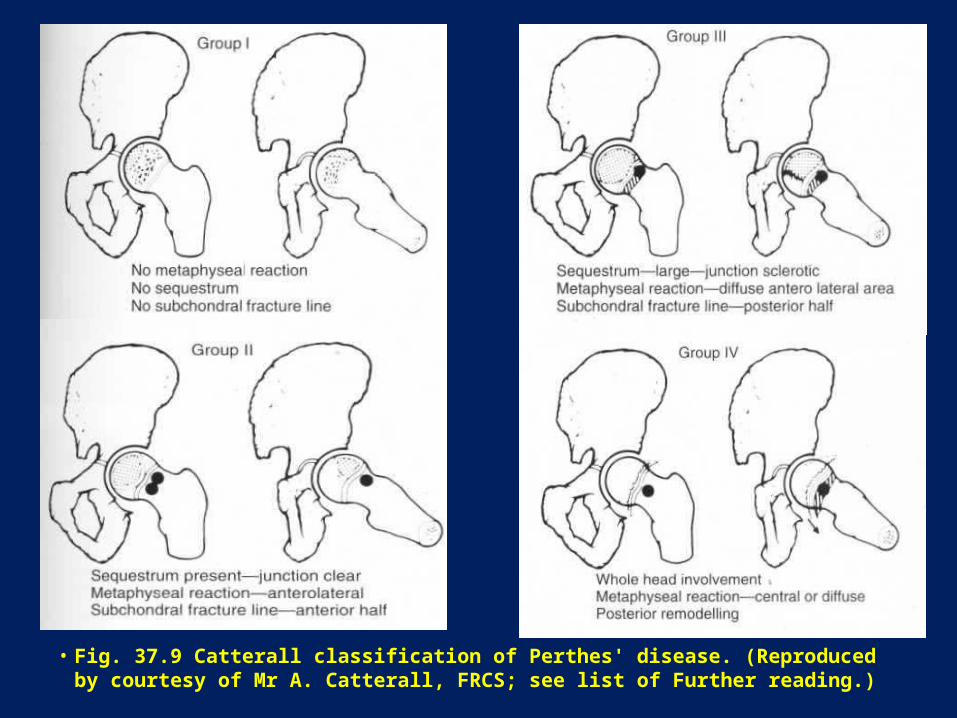
• Fig. 37.9 Catterall classification of Perthes' disease. (Reproduced by courtesy of Mr A. Catterall, FRCS; see list of Further reading.)
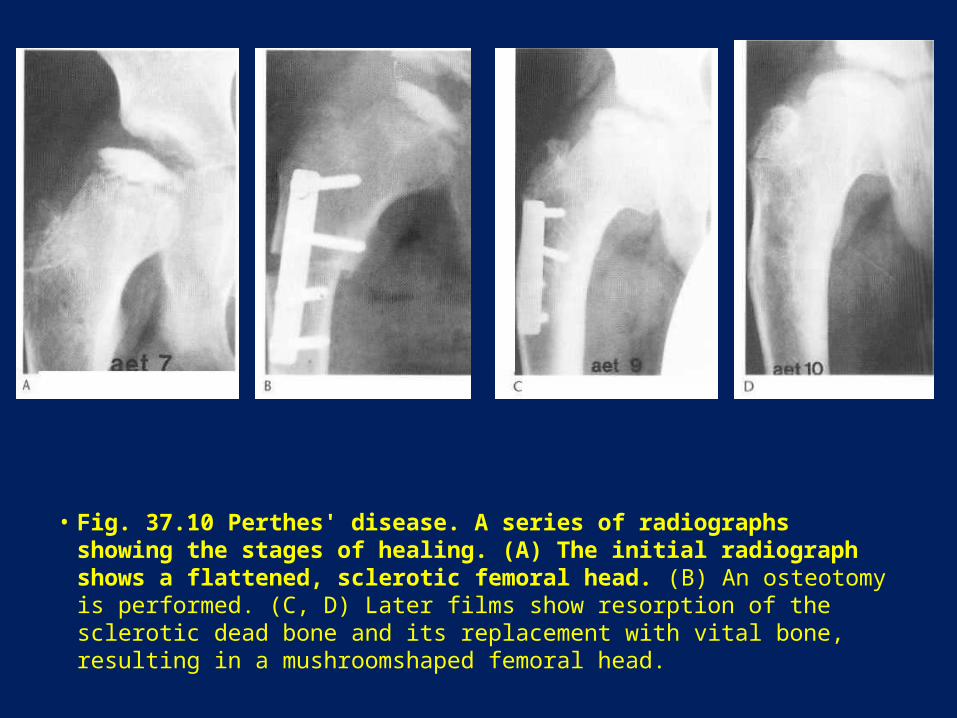
• Fig. 37.10 Perthes' disease. A series of radiographs showing the stages of healing. (A) The initial radiograph shows a flattened, sclerotic femoral head. (B) An osteotomy is performed. (C, D) Later films show resorption of the sclerotic dead bone and its replacement with vital bone, resulting in a mushroomshaped femoral head.
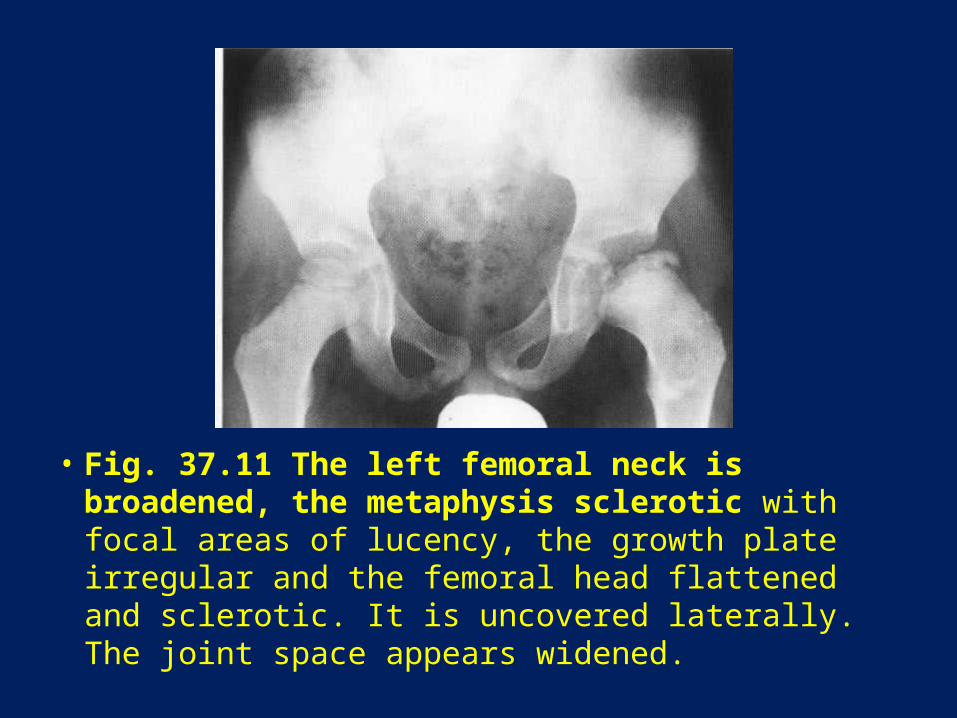
• Fig. 37.11 The left femoral neck is broadened, the metaphysis sclerotic with focal areas of lucency, the growth plate irregular and the femoral head flattened and sclerotic. It is uncovered laterally. The joint space appears widened.
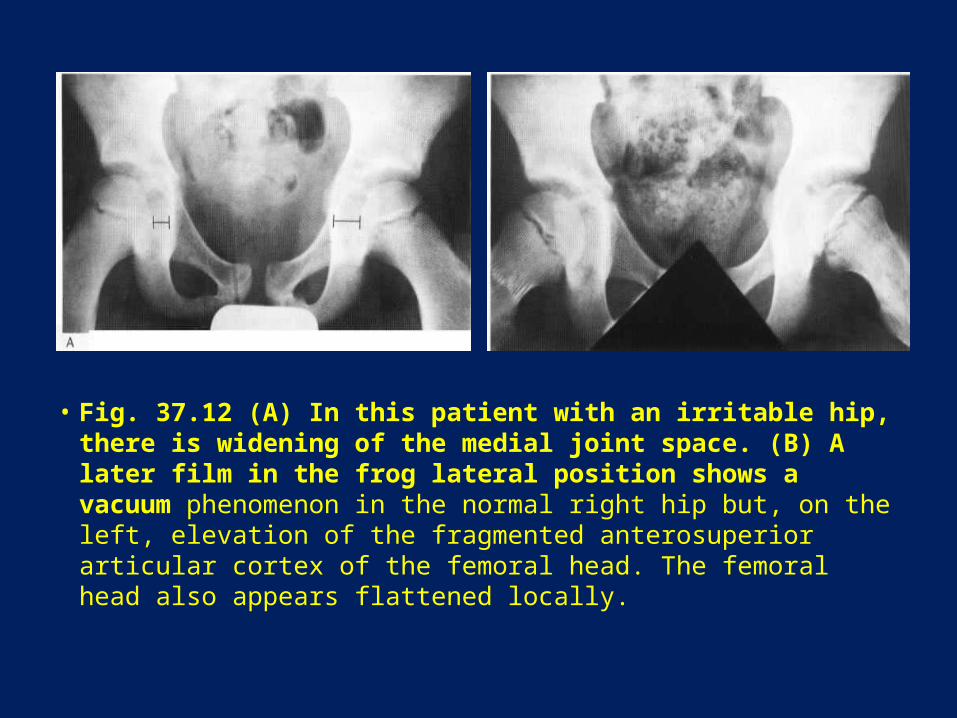
• Fig. 37.12 (A) In this patient with an irritable hip, there is widening of the medial joint space. (B) A later film in the frog lateral position shows a vacuum phenomenon in the normal right hip but, on the left, elevation of the fragmented anterosuperior articular cortex of the femoral head. The femoral head also appears flattened locally.
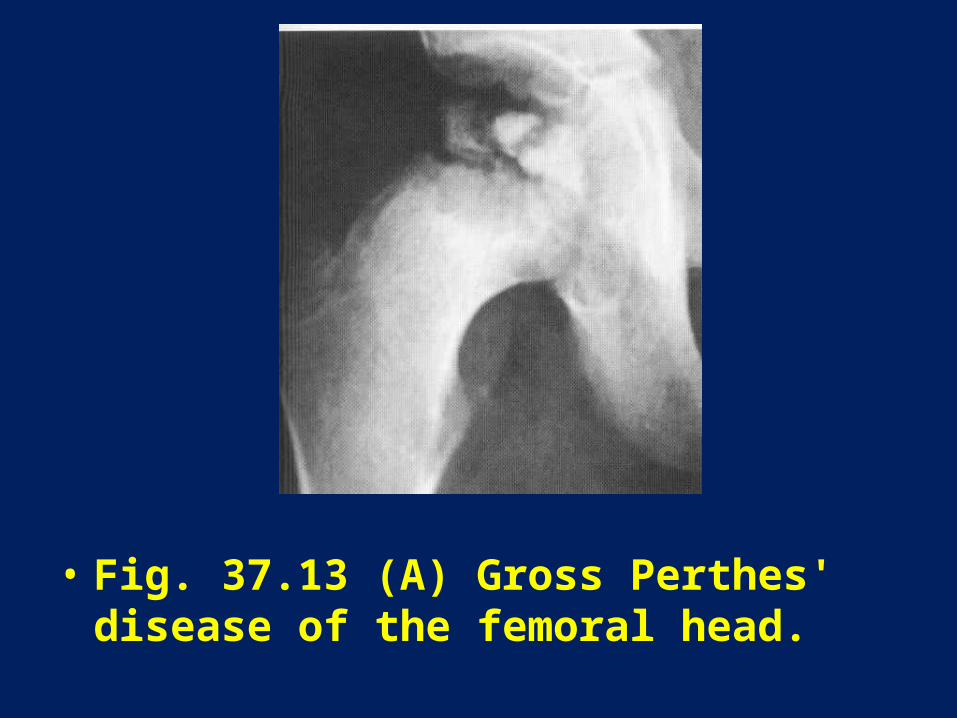
• Fig. 37.13 (A) Gross Perthes' disease of the femoral head.
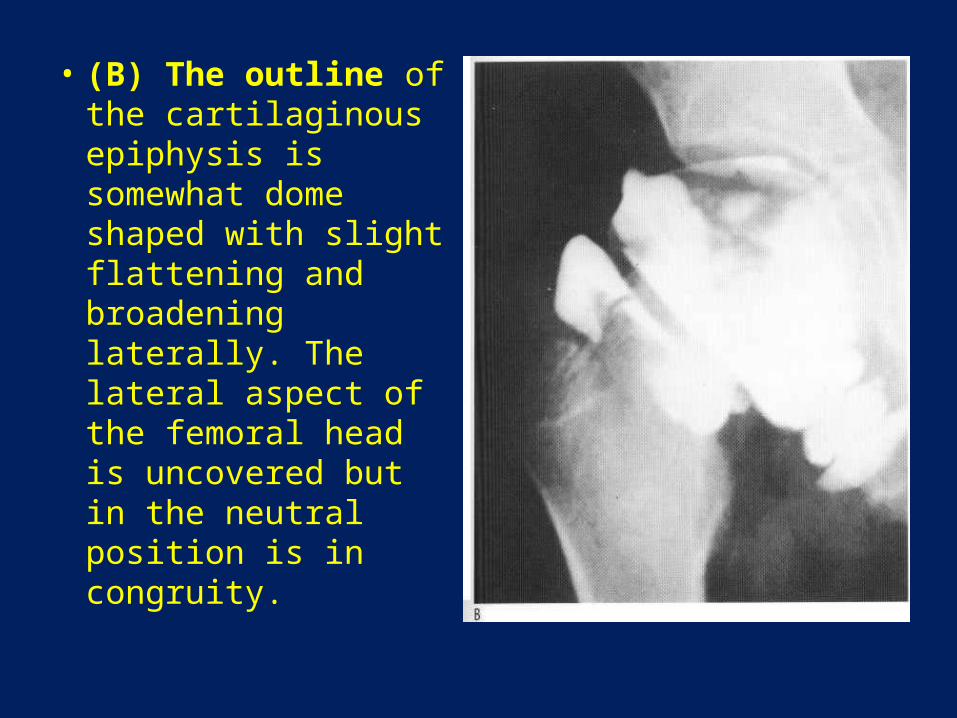
• (B) The outline of the cartilaginous epiphysis is somewhat dome shaped with slight flattening and broadening laterally. The lateral aspect of the femoral head is uncovered but in the neutral position is in congruity.
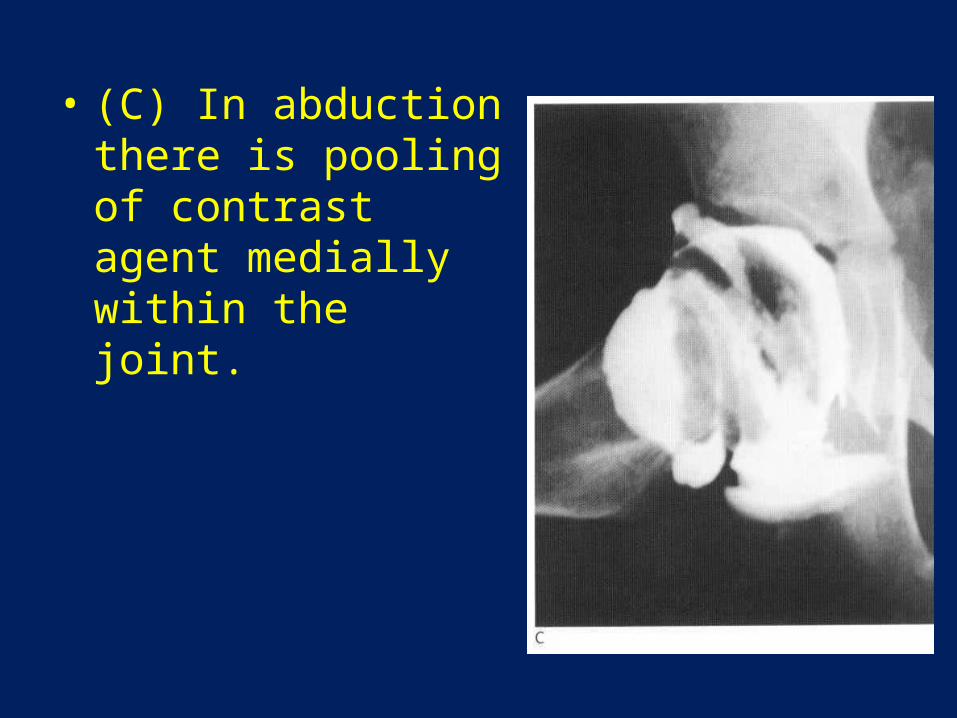
• (C) In abduction there is pooling of contrast agent medially within the joint.

• Fig: 37.14 Sagittal scan of a child's hip. In (A) and (B) the high echogenicity of the cortical bone of the epiphysis (E) and metaphysis (M) are noted. The (VV) indicate the joint capsule, in (A) this is concave along the femoral neck but in (B) this is convex to the femoral neck beneath which there is anechoic fluid (fl).

• Fig. 37.15 Perthes' disease. (A) The lateral aspect of the right femoral head does not show up on radionuclide scanning. (B) On X-ray, the involved area looks smaller than on the scan. The right ossific nucleus is flattened, irregular and smaller than that on the normal left side. It shows collapse. The growth plate and metaphysis are irregular.
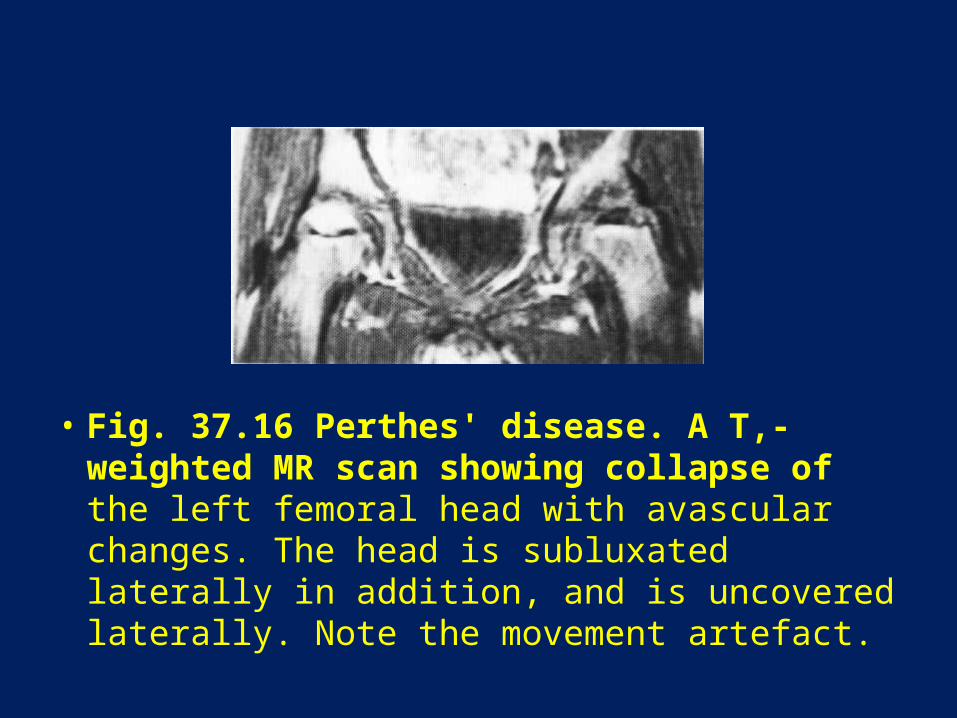
• Fig. 37.16 Perthes' disease. A T,-weighted MR scan showing collapse of the left femoral head with avascular changes. The head is subluxated laterally in addition, and is uncovered laterally. Note the movement artefact.
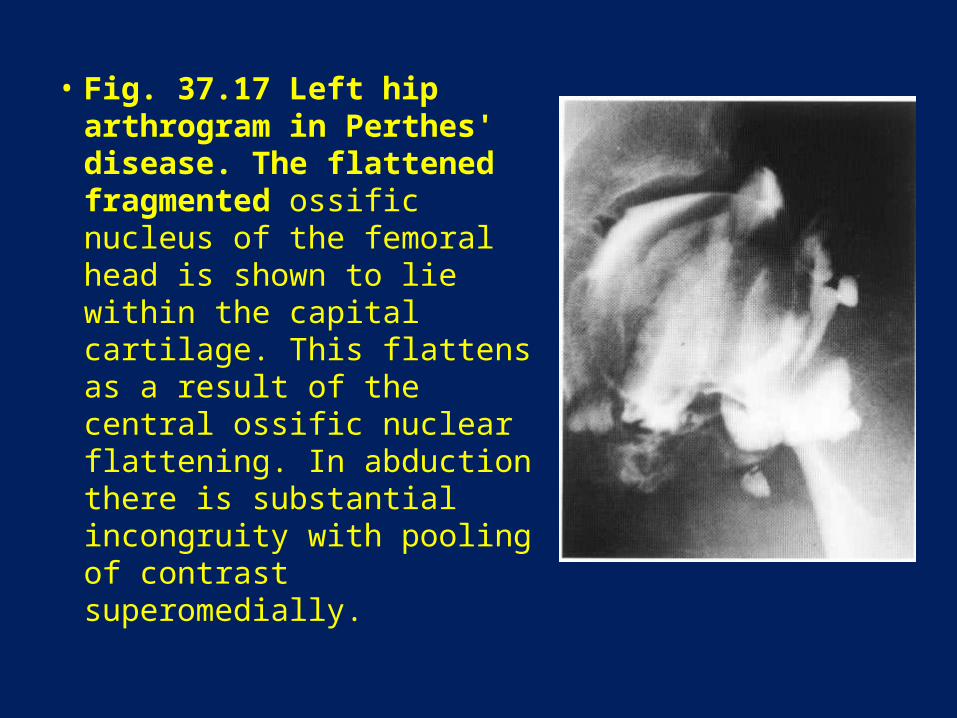
• Fig. 37.17 Left hip arthrogram in Perthes' disease. The flattened fragmented ossific nucleus of the femoral head is shown to lie within the capital cartilage. This flattens as a result of the central ossific nuclear flattening. In abduction there is substantial incongruity with pooling of contrast superomedially.
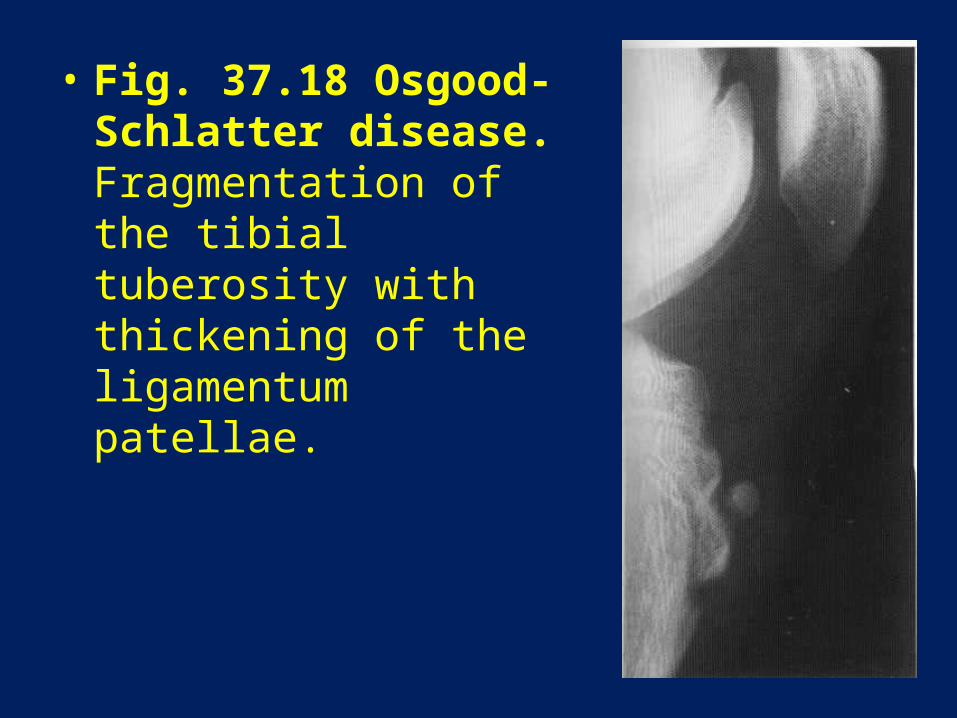
• Fig. 37.18 Osgood-Schlatter disease. Fragmentation of the tibial tuberosity with thickening of the ligamentum patellae.
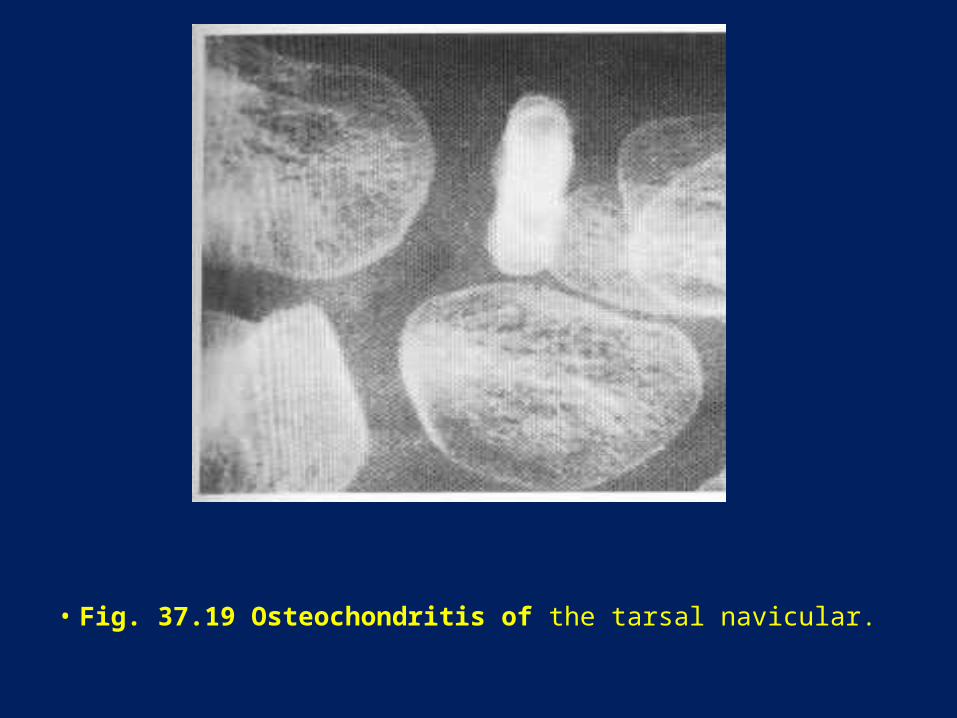
• Fig. 37.19 Osteochondritis of the tarsal navicular.
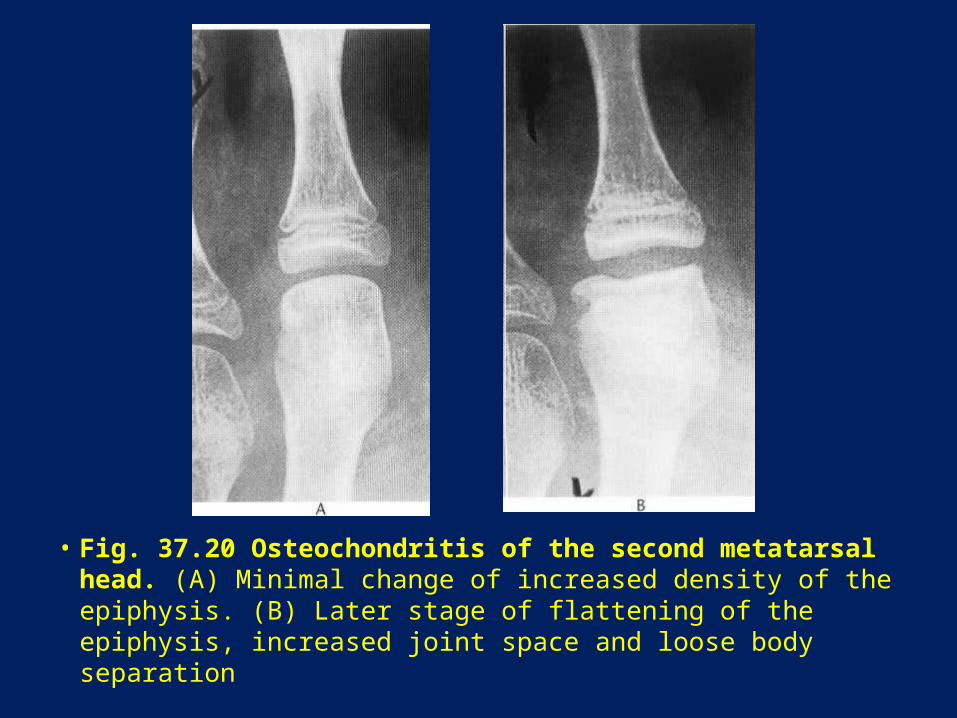
• Fig. 37.20 Osteochondritis of the second metatarsal head. (A) Minimal change of increased density of the epiphysis. (B) Later stage of flattening of the epiphysis, increased joint space and loose body separation
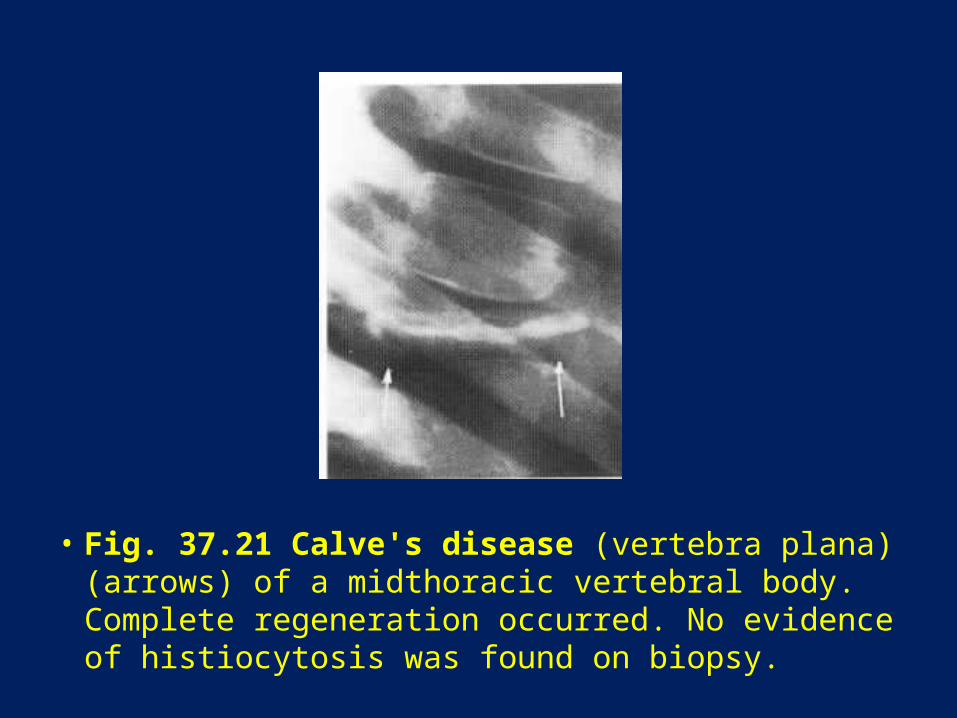
• Fig. 37.21 Calve's disease (vertebra plana) (arrows) of a midthoracic vertebral body. Complete regeneration occurred. No evidence of histiocytosis was found on biopsy.
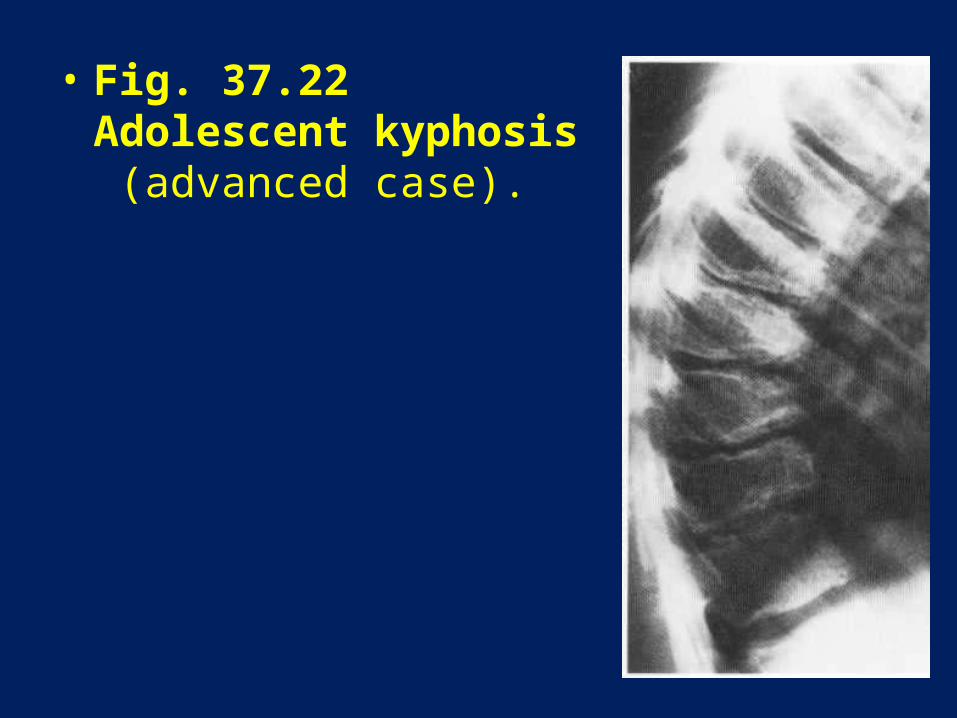
• Fig. 37.22 Adolescent kyphosis (advanced case).
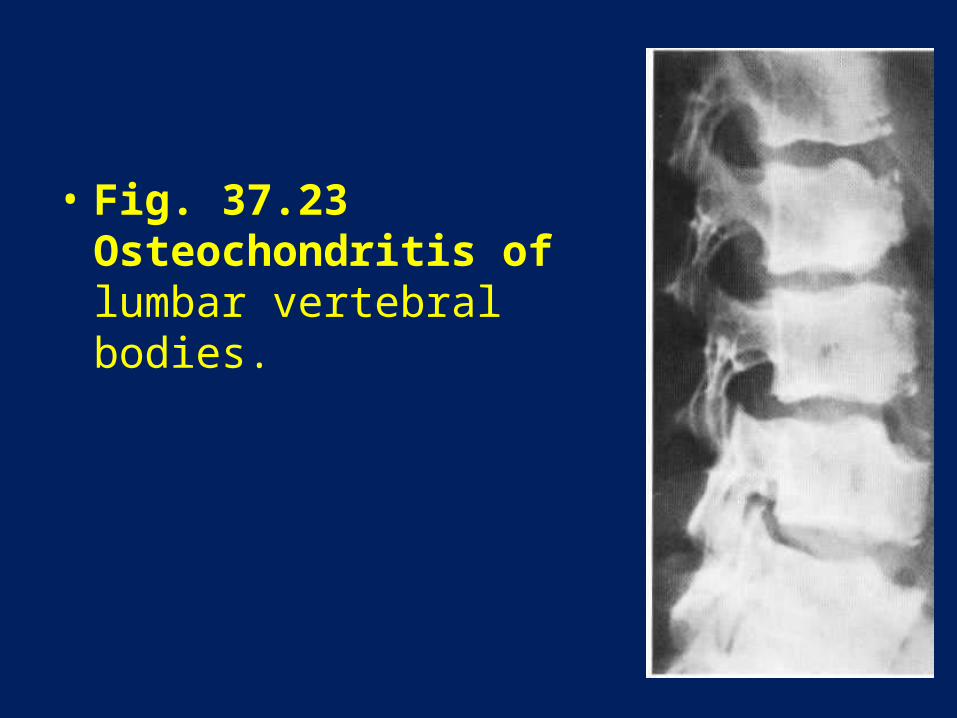
• Fig. 37.23 Osteochondritis of lumbar vertebral bodies.

• Fig. 37.24 (A) T,-weighted sagittal MR scan of the lumbar spine showing rounded, fairly central end-plate defects into which distal material is herniated. (B) The discogram of the same patient shows the distal herniation into the defects
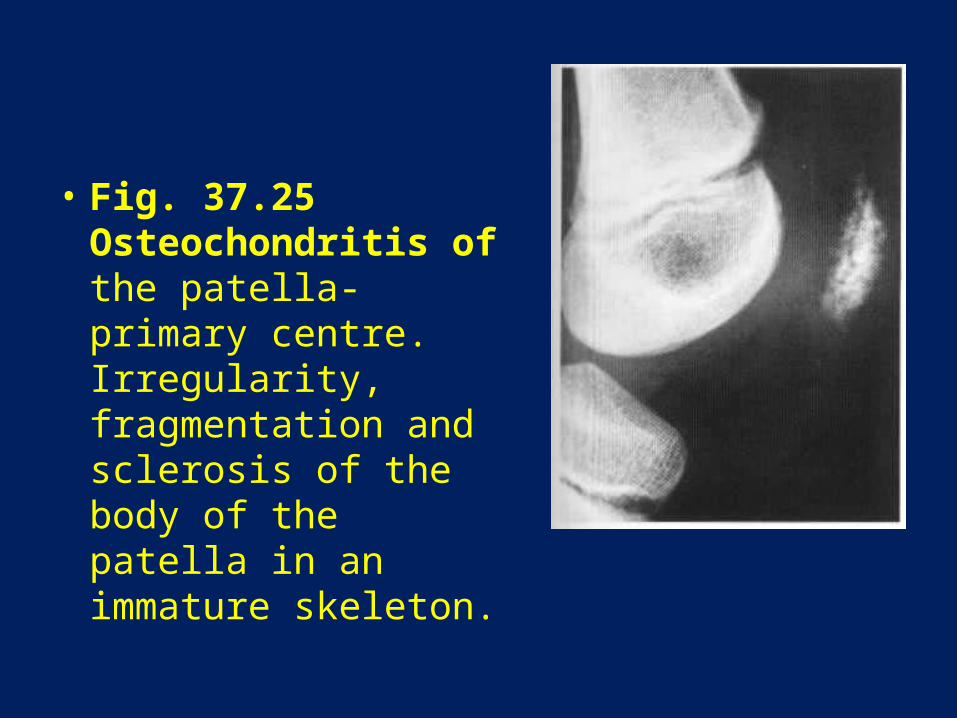
• Fig. 37.25 Osteochondritis of the patella-primary centre. Irregularity, fragmentation and sclerosis of the body of the patella in an immature skeleton.
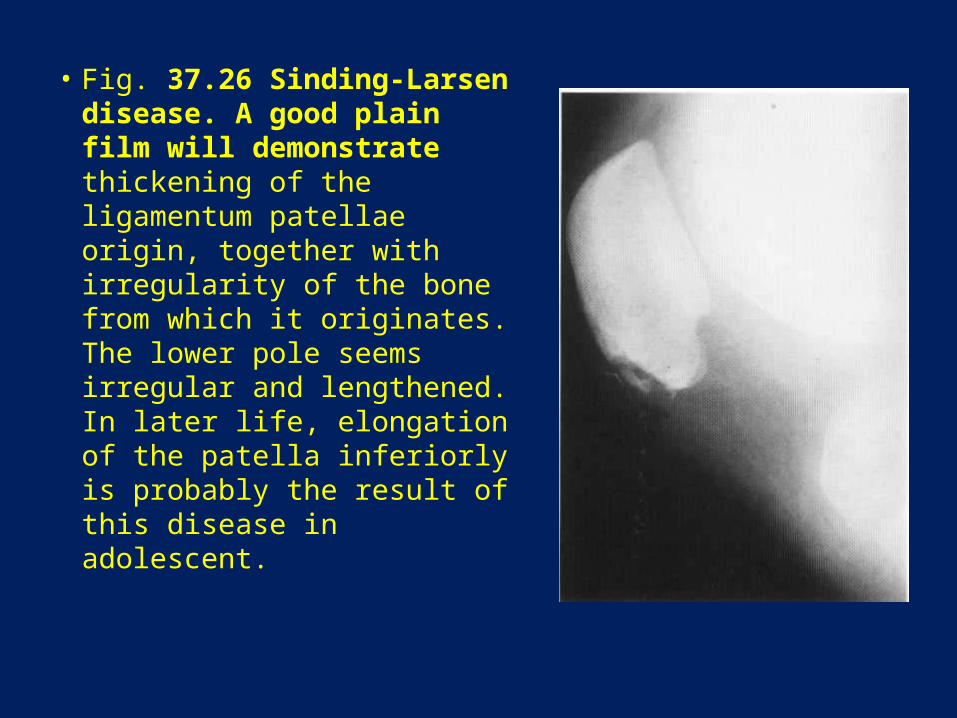
• Fig. 37.26 Sinding-Larsen disease. A good plain film will demonstrate thickening of the ligamentum patellae origin, together with irregularity of the bone from which it originates. The lower pole seems irregular and lengthened. In later life, elongation of the patella inferiorly is probably the result of this disease in adolescent.
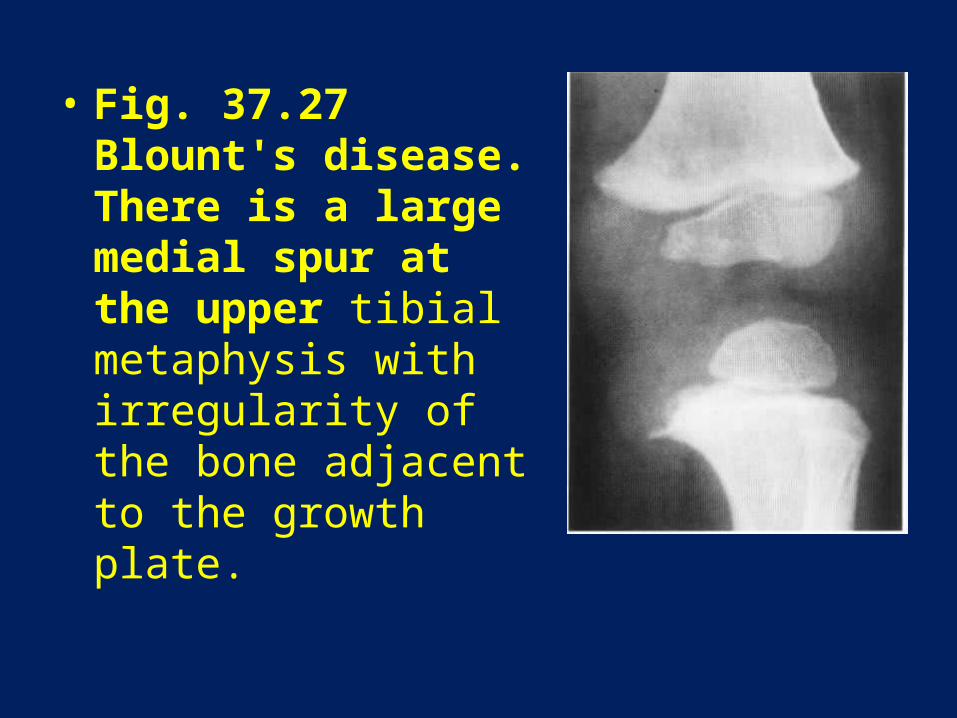
• Fig. 37.27 Blount's disease. There is a large medial spur at the upper tibial metaphysis with irregularity of the bone adjacent to the growth plate.
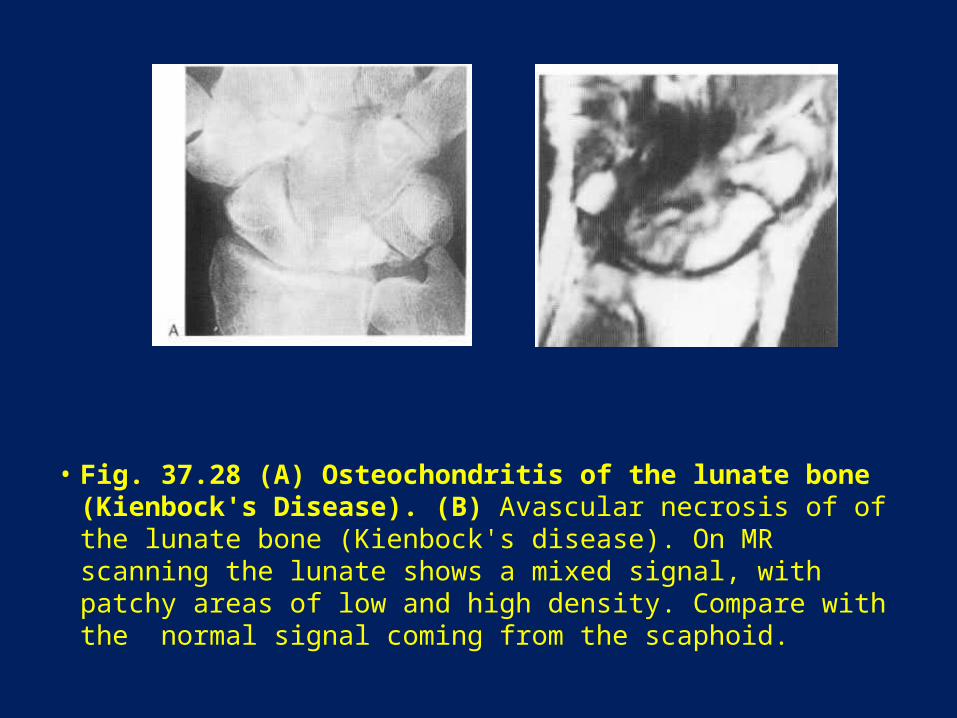
• Fig. 37.28 (A) Osteochondritis of the lunate bone (Kienbock's Disease). (B) Avascular necrosis of of the lunate bone (Kienbock's disease). On MR scanning the lunate shows a mixed signal, with patchy areas of low and high density. Compare with the normal signal coming from the scaphoid.
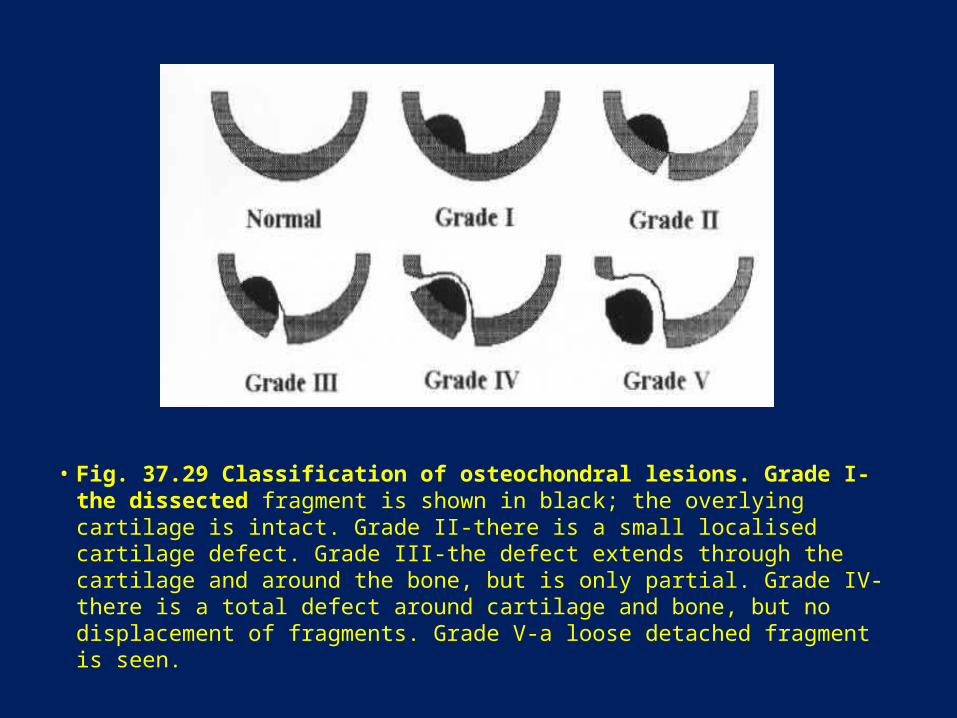
• Fig. 37.29 Classification of osteochondral lesions. Grade I-the dissected fragment is shown in black; the overlying cartilage is intact. Grade II-there is a small localised cartilage defect. Grade III-the defect extends through the cartilage and around the bone, but is only partial. Grade IV-there is a total defect around cartilage and bone, but no displacement of fragments. Grade V-a loose detached fragment is seen.

• Fig. 37.30 (A,B) Osteochondritis dissecans of the medial femoral condyle (arrow). (C) T, coronal and sagittal fat-suppression images of the knee demonstrating osteochondritis dissecans at a typical site. On the latter image, the defect is seen to contain fluid.

• Fig. 37.31 Osteochondritis dissecans of the medial part of the articular surface of the talus.

• Fig. 37.32 Osteochondritis of the talar dome. (A) The medial corner of the talus is a very common site for osteochondral defects, seen as a low signal change on this coronal T1 -weighted MR sequence. (B) The lesion is also seen on the adjacent axial image (arrow).

• Fig. 37.33 Caisson disease of both shoulders. Medullary infarcts are demonstrated. These are well defined. There is a split cortex on the right. The humeral heads are flattened and irregular. Secondary osteoarthritic change is shown. Widespread metaphyseal infarction is demonstrated. The infarcted areas have well-defined margins that are symmetrically metaphyseal.
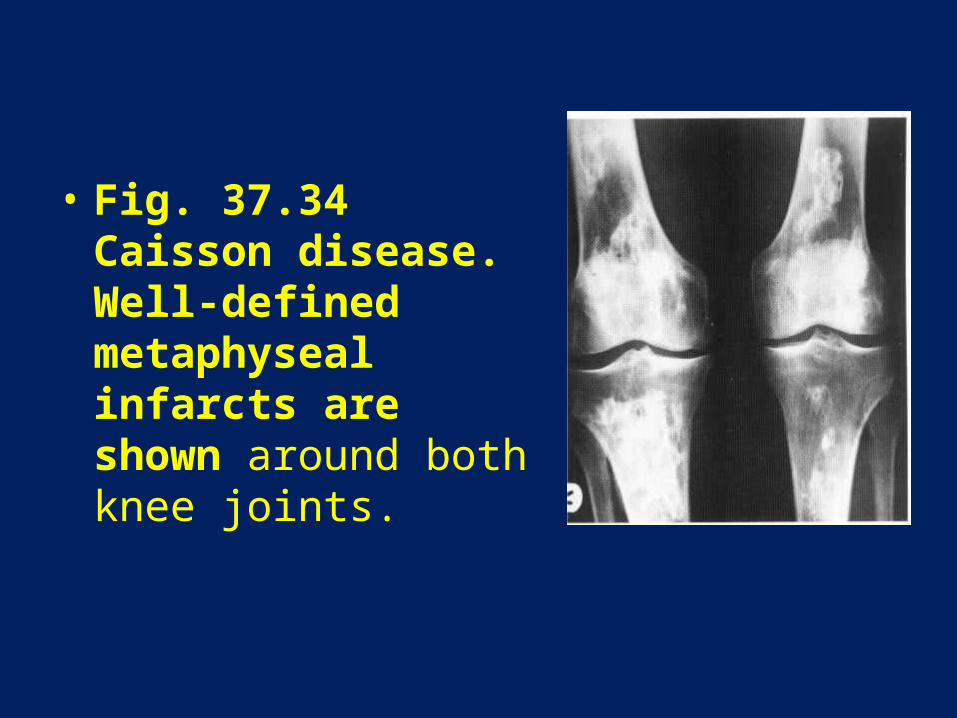
• Fig. 37.34 Caisson disease. Well-defined metaphyseal infarcts are shown around both knee joints.

Fig. 37.35 Changes of medullary infarction are associated with an area of osteolysis due to fibrosarcoma.
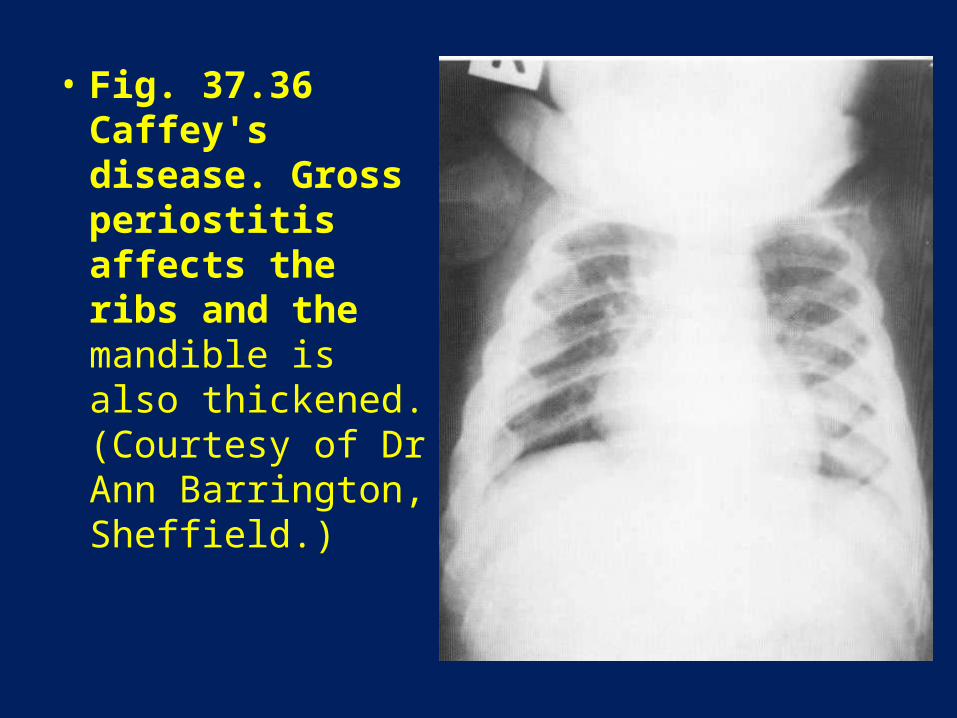
• Fig. 37.36 Caffey's disease. Gross periostitis affects the ribs and the mandible is also thickened. (Courtesy of Dr Ann Barrington, Sheffield.)
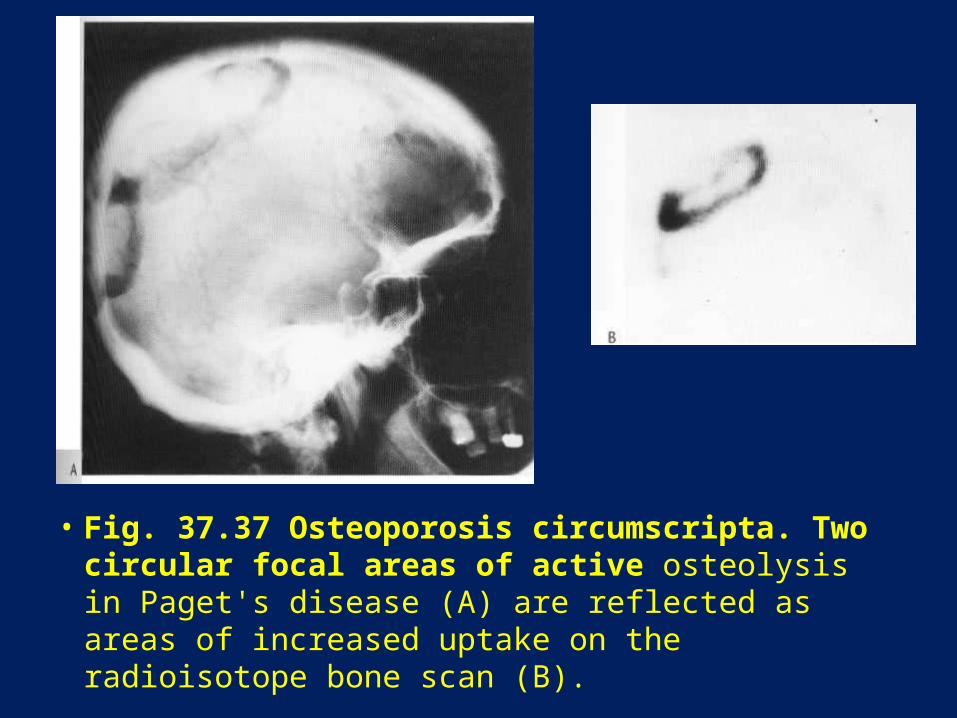
• Fig. 37.37 Osteoporosis circumscripta. Two circular focal areas of active osteolysis in Paget's disease (A) are reflected as areas of increased uptake on the radioisotope bone scan (B).
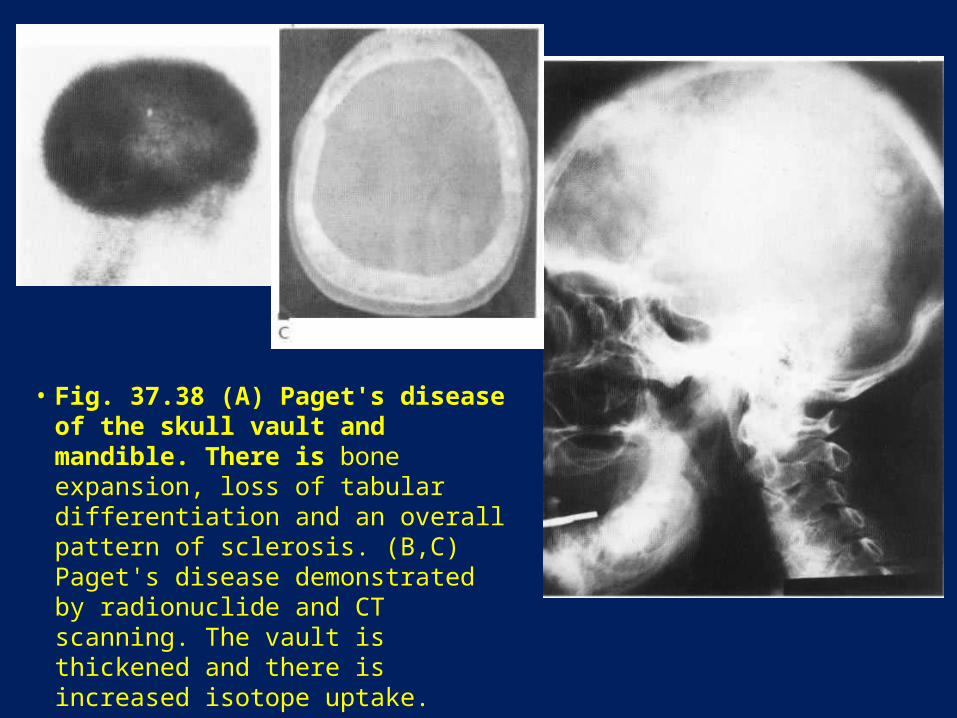
• Fig. 37.38 (A) Paget's disease of the skull vault and mandible. There is bone expansion, loss of tabular differentiation and an overall pattern of sclerosis. (B,C) Paget's disease demonstrated by radionuclide and CT scanning. The vault is thickened and there is increased isotope uptake.
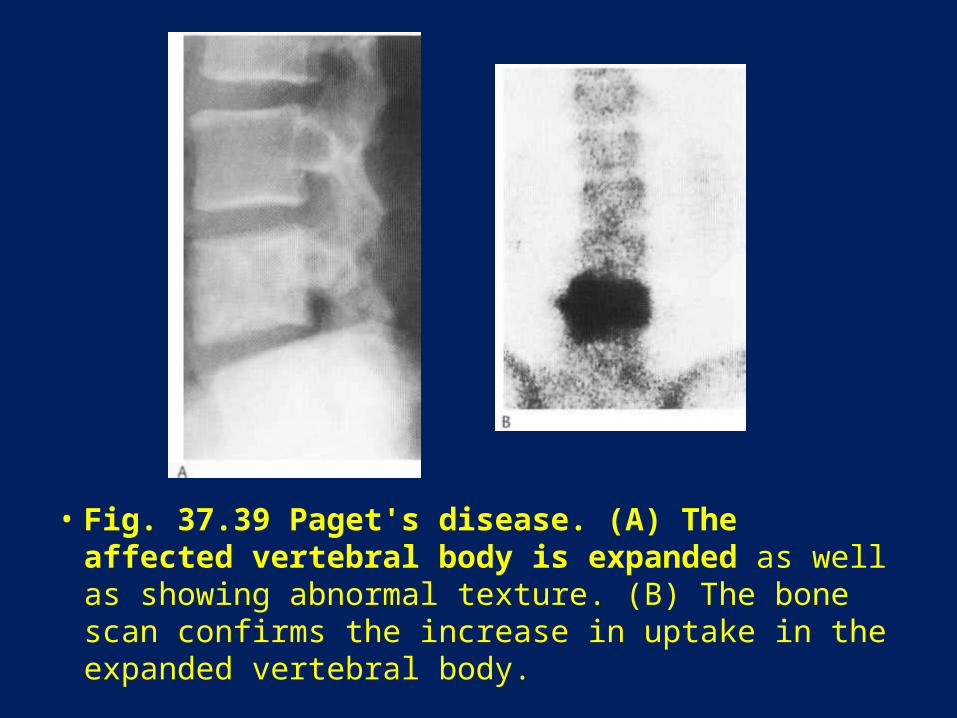
• Fig. 37.39 Paget's disease. (A) The affected vertebral body is expanded as well as showing abnormal texture. (B) The bone scan confirms the increase in uptake in the expanded vertebral body.

• Fig. 37.39 Paget's disease. (C) The CT scan shows the rather spongy texture of the abnormal body, extending into the pedices and laminae.
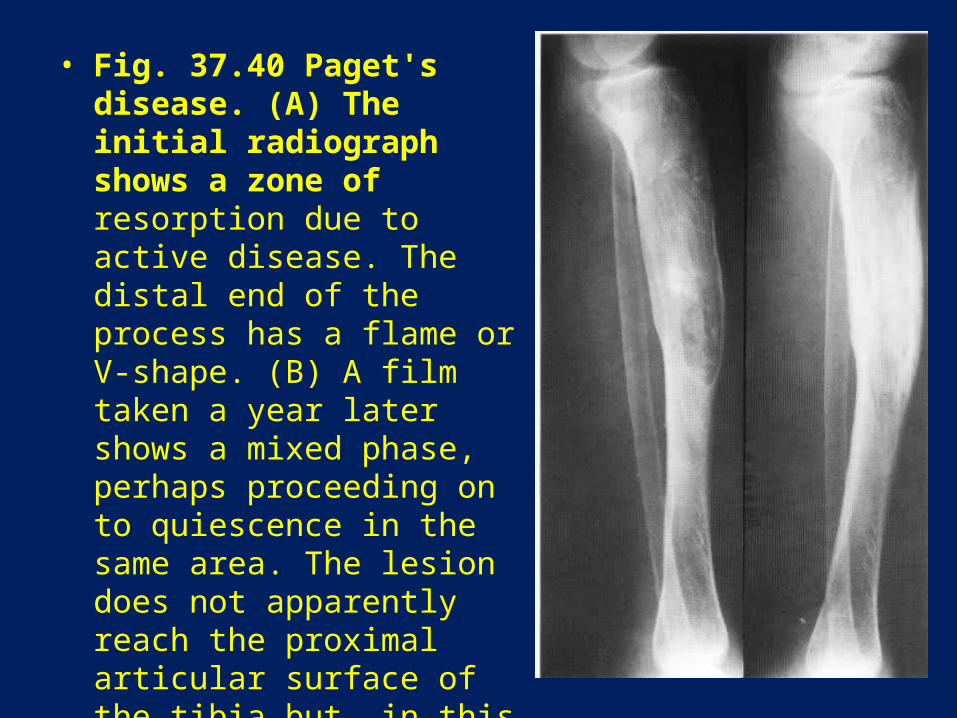
• Fig. 37.40 Paget's disease. (A) The initial radiograph shows a zone of resorption due to active disease. The distal end of the process has a flame or V-shape. (B) A film taken a year later shows a mixed phase, perhaps proceeding on to quiescence in the same area. The lesion does not apparently reach the proximal articular surface of the tibia but, in this long bone, it does not always do so. It seems in this patient to be related to the fused growth plate for the tibial tuberosity.
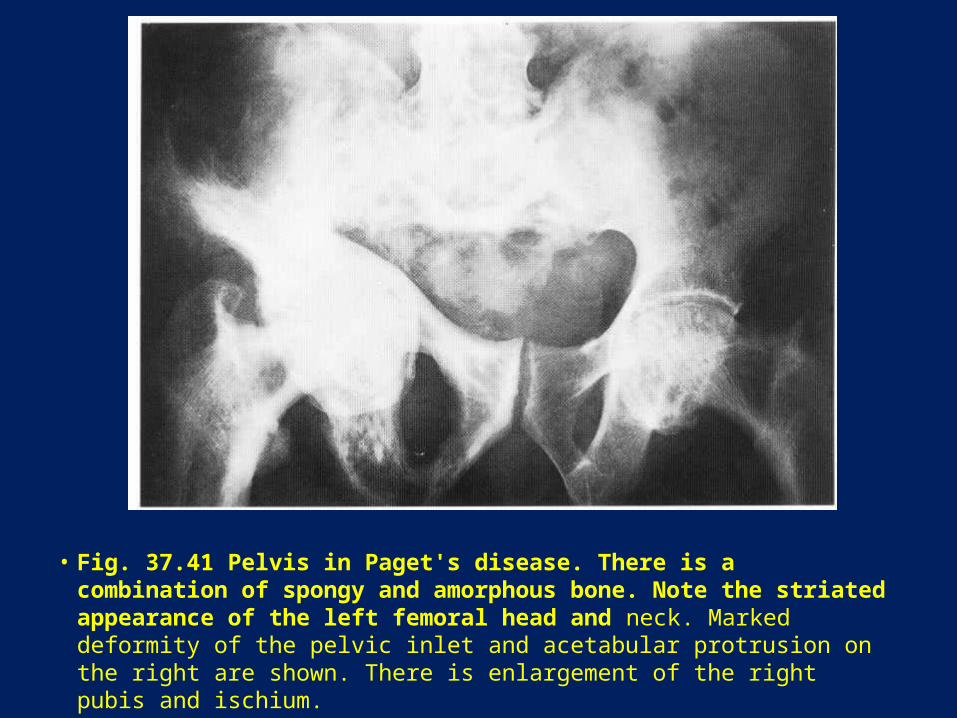
• Fig. 37.41 Pelvis in Paget's disease. There is a combination of spongy and amorphous bone. Note the striated appearance of the left femoral head and neck. Marked deformity of the pelvic inlet and acetabular protrusion on the right are shown. There is enlargement of the right pubis and ischium.
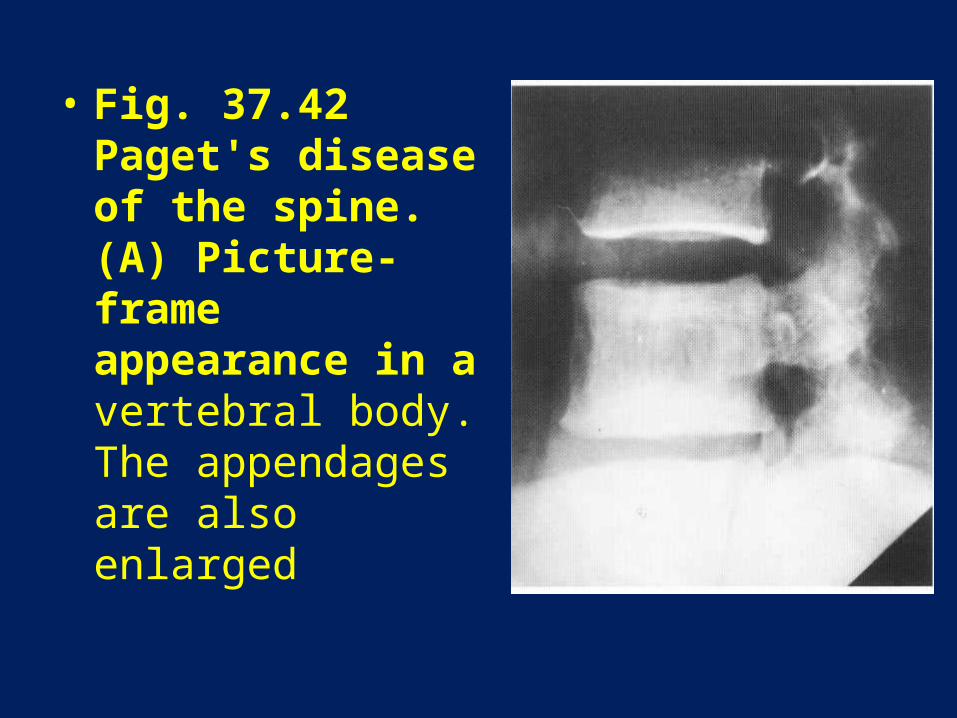
• Fig. 37.42 Paget's disease of the spine. (A) Picture-frame appearance in a vertebral body. The appendages are also enlarged

• Fig. 37.42 Paget's disease of the spine. (B) Vertebral collapse and expansion together with abnormal bone texture in another patient.
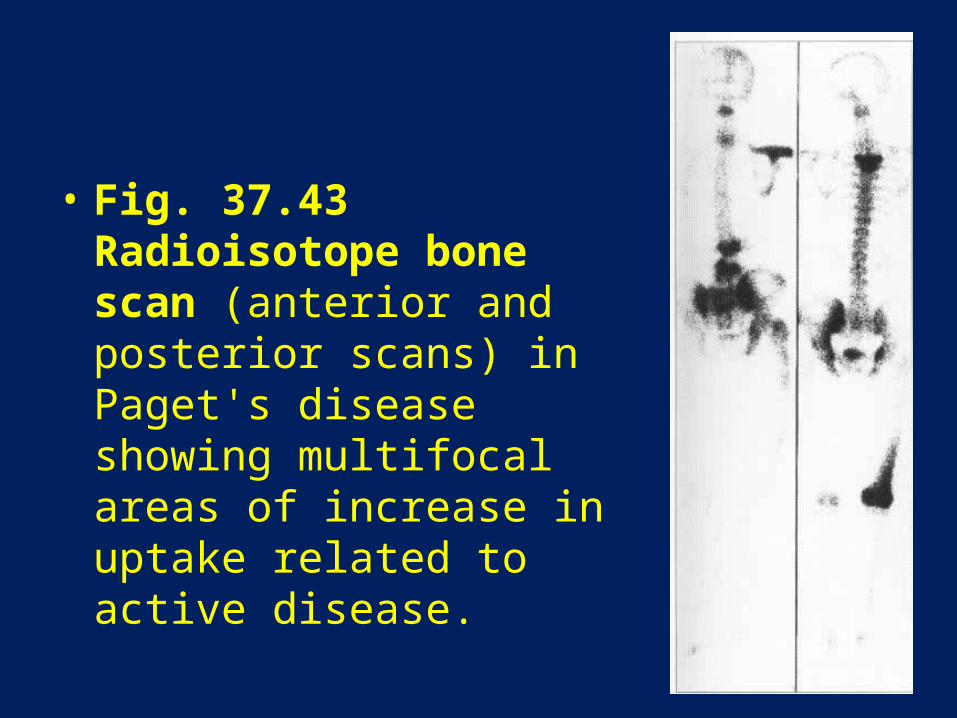
• Fig. 37.43 Radioisotope bone scan (anterior and posterior scans) in Paget's disease showing multifocal areas of increase in uptake related to active disease.
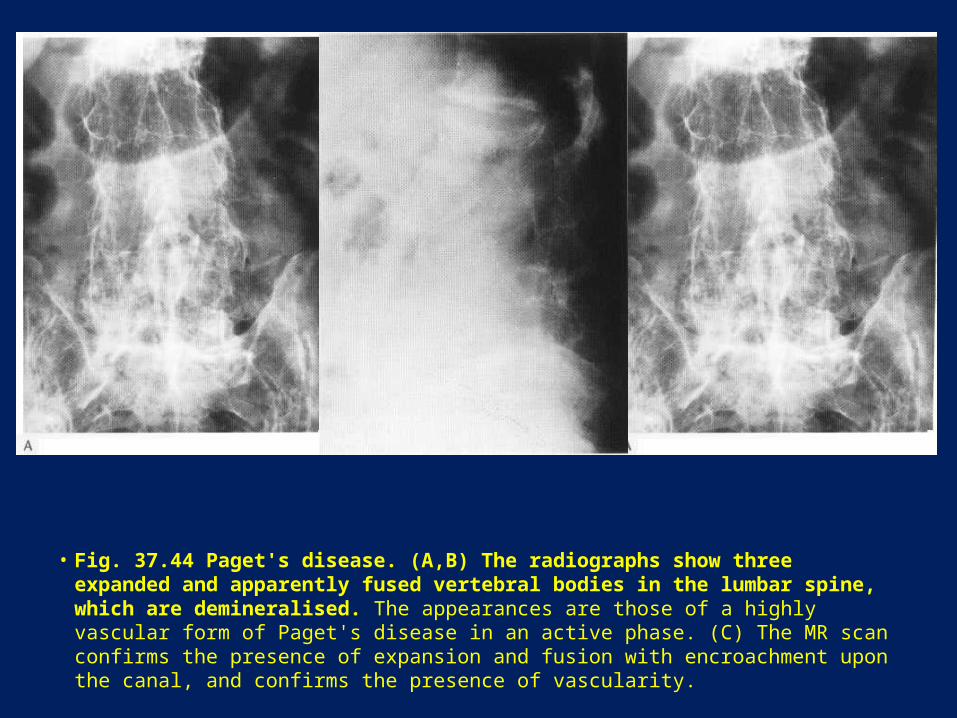
• Fig. 37.44 Paget's disease. (A,B) The radiographs show three expanded and apparently fused vertebral bodies in the lumbar spine, which are demineralised. The appearances are those of a highly vascular form of Paget's disease in an active phase. (C) The MR scan confirms the presence of expansion and fusion with encroachment upon the canal, and confirms the presence of vascularity.
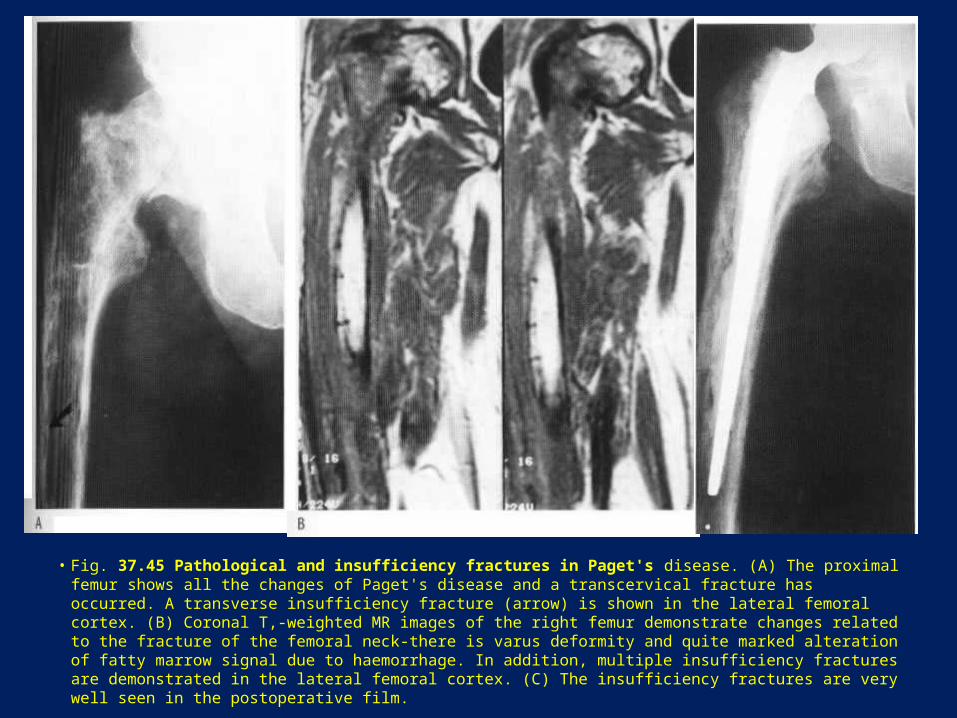
• Fig. 37.45 Pathological and insufficiency fractures in Paget's disease. (A) The proximal femur shows all the changes of Paget's disease and a transcervical fracture has occurred. A transverse insufficiency fracture (arrow) is shown in the lateral femoral cortex. (B) Coronal T,-weighted MR images of the right femur demonstrate changes related to the fracture of the femoral neck-there is varus deformity and quite marked alteration of fatty marrow signal due to haemorrhage. In addition, multiple insufficiency fractures are demonstrated in the lateral femoral cortex. (C) The insufficiency fractures are very well seen in the postoperative film.
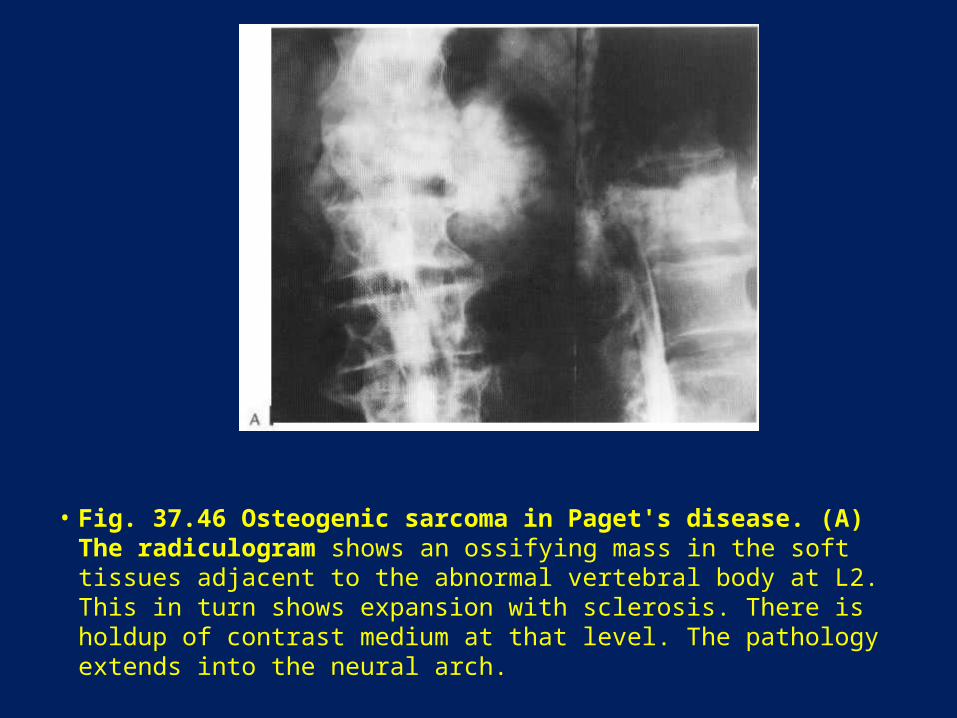
• Fig. 37.46 Osteogenic sarcoma in Paget's disease. (A) The radiculogram shows an ossifying mass in the soft tissues adjacent to the abnormal vertebral body at L2. This in turn shows expansion with sclerosis. There is holdup of contrast medium at that level. The pathology extends into the neural arch.
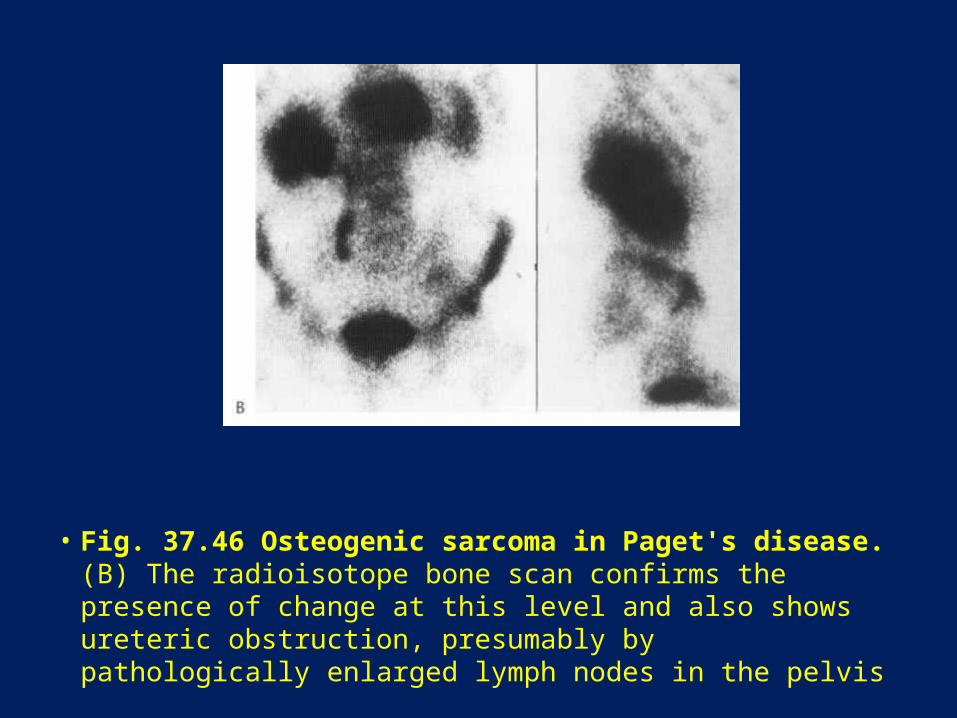
• Fig. 37.46 Osteogenic sarcoma in Paget's disease. (B) The radioisotope bone scan confirms the presence of change at this level and also shows ureteric obstruction, presumably by pathologically enlarged lymph nodes in the pelvis

• Fig. 37.46 Osteogenic sarcoma in Paget's disease. (C) The CT scan confirms the presence of sclerotic Paget's disease within the vertebral body but also demonstrates the ossifying sarcomatous mass in the soft tissues. The spinal canal is encroached upon. (Courtesy of Dr K. Walmsley.)

• Fig. 37.47 Tuberous sclerosis. Flame-shaped areas of sclerosis in the iliac blades.
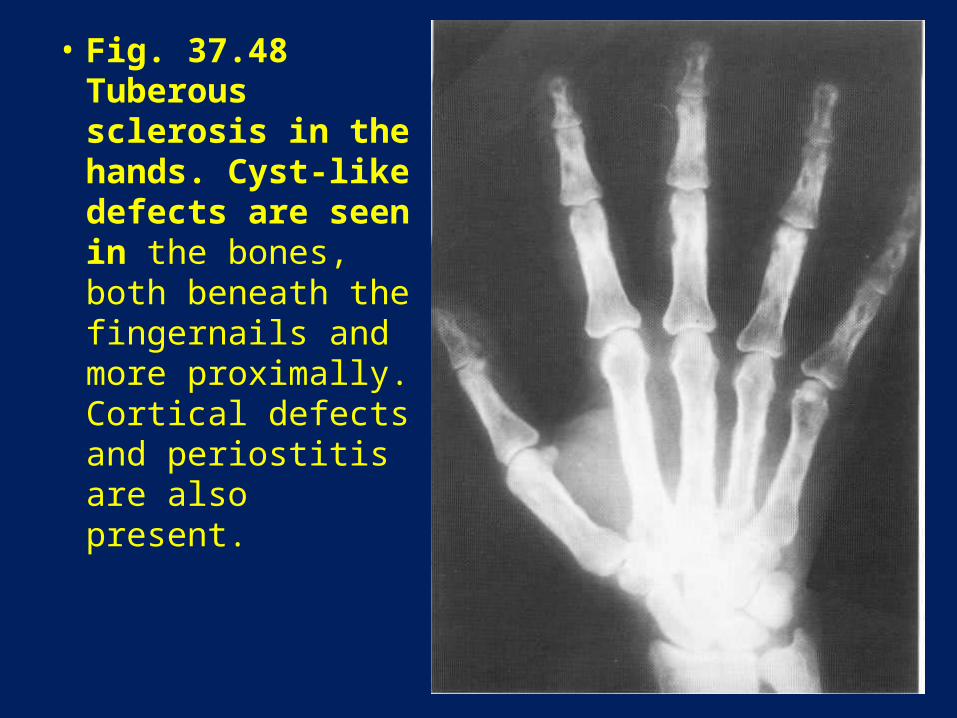
• Fig. 37.48 Tuberous sclerosis in the hands. Cyst-like defects are seen in the bones, both beneath the fingernails and more proximally. Cortical defects and periostitis are also present.
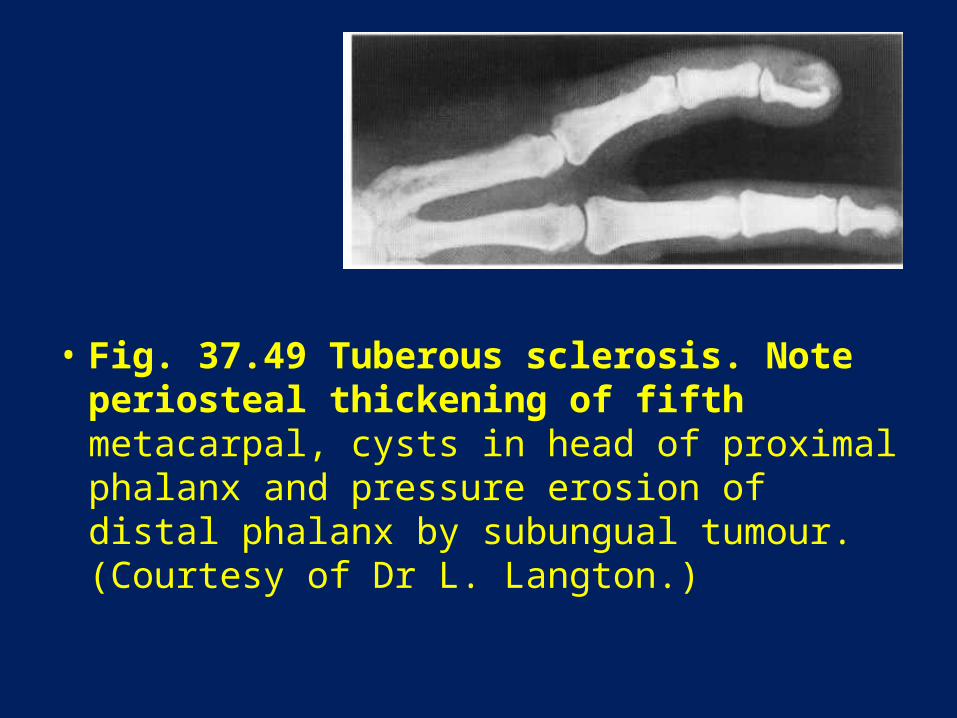
• Fig. 37.49 Tuberous sclerosis. Note periosteal thickening of fifth metacarpal, cysts in head of proximal phalanx and pressure erosion of distal phalanx by subungual tumour. (Courtesy of Dr L. Langton.)


