+ All Categories
Home > Documents > 38 Distortions to Agricultural Incentives in Sri...

38 Distortions to Agricultural Incentives in Sri...

Date post: 21-Mar-2018
Category:
Upload: hadung
View: 238 times
Download: 2 times
Share this document with a friend
53
38 Distortions to Agricultural Incentives in Sri Lanka Jayatillake Bandara and Sisira Jayasuriya Griffith University, Brisbane [email protected] La Trobe University, Melbourne [email protected] Agricultural Distortions Working Paper 31, December 2007 This is a product of a research project on Distortions to Agricultural Incentives, under the leadership of Kym Anderson of the World Bank‟s Development Research Group. The authors are grateful for helpful comments from workshop participants and for funding from World Bank Trust Funds provided by the governments of Ireland, Japan, the Netherlands (BNPP) and the United Kingdom (DfID). This Working Paper series is designed to promptly disseminate the findings of work in progress for comment before they are finalized. The views expressed are the authors‟ alone and not necessarily those of the World Bank and its Executive Directors, nor the countries they represent, nor of the institutions providing funds for this research project. Public Disclosure Authorized Public Disclosure Authorized Public Disclosure Authorized Public Disclosure Authorized Public Disclosure Authorized Public Disclosure Authorized Public Disclosure Authorized Public Disclosure Authorized
Transcript

38

Distortions to Agricultural Incentives

in Sri Lanka

Jayatillake Bandara and Sisira Jayasuriya

Griffith University, Brisbane

[email protected]

La Trobe University, Melbourne

[email protected]

Agricultural Distortions Working Paper 31, December 2007

This is a product of a research project on Distortions to Agricultural Incentives, under the leadership of

Kym Anderson of the World Bank‟s Development Research Group. The authors are grateful for helpful

comments from workshop participants and for funding from World Bank Trust Funds provided by the

governments of Ireland, Japan, the Netherlands (BNPP) and the United Kingdom (DfID).

This Working Paper series is designed to promptly disseminate the findings of work in progress for

comment before they are finalized. The views expressed are the authors‟ alone and not necessarily those of

the World Bank and its Executive Directors, nor the countries they represent, nor of the institutions

providing funds for this research project.

Pub

lic D

iscl

osur

e A

utho

rized

Pub

lic D

iscl

osur

e A

utho

rized

Pub

lic D

iscl

osur

e A

utho

rized

Pub

lic D

iscl

osur

e A

utho

rized

Pub

lic D

iscl

osur

e A

utho

rized

Pub

lic D

iscl

osur

e A

utho

rized

Pub

lic D

iscl

osur

e A

utho

rized

Pub

lic D

iscl

osur

e A

utho

rized

wb350881
Typewritten Text
56075 v1

1

Distortions to Agricultural Incentives in Sri Lanka

Jayatillake Bandara and Sisira Jayasuriya

Sri Lanka‟s agricultural policies since independence in 1948 have reflected changes on

overall development strategy, as well as the interplay of conflicting domestic political

considerations, including the need to balance producer and consumer interests,

government revenue needs, and ethnic and regional factors.

Sri Lanka was a relatively affluent open agricultural economy at the time of its

independence from colonial rule in 1948, with one of the highest levels of per capita

income in Asia, a vibrant democracy, and levels of health, education and other human

development that rivalled even those of many developed industrial economies. It was an

oasis of peace, stability and order in a turbulent region (de Silva 1981). Prospects for

rapid economic development appeared rosy. To many observers it seemed the country

with the best prospects for development in Asia (Athukorala and Jayasuriya 1994).

However, five decades later it is clear that it has failed to live up to its early promise. It

remains a low-income economy, having slipped well below the high-performing East

Asian economies in per capita income terms, and mired in seemingly intractable violent

ethnic and social conflicts.

Since independence Sri Lanka has experimented with a wide variety of policy

regimes, switching from open „non-interventionist‟ free-market policies (up to 1959) to

dirigiste import-substituting industrialization (ISI) (1960 to 1977) and then to export-

oriented liberalization (after 1977). Although its economic growth performance from the

late 1970s has been relatively satisfactory in comparison to many similar developing

countries, its agricultural sector performance – with nearly stagnant per capita

agricultural output – has been disappointing and has hampered poverty alleviation. Its

agricultural policies through this period have reflected the changes in the thrust and

2

direction of its broader development strategy. However, there are also elements of

enduring continuity in agricultural policy throughout this period.1

Sri Lanka‟s agricultural sector has two sub-sectors: an import-competing food

crop sector dominated by rice but also including a range of „subsidiary‟ food crops, and

an export crop sector dominated by tea (Sri Lanka is the world‟s largest tea exporter) but

also including rubber, coconut and several minor export crops (cinnamon, spices, etc.).2

Fruits and vegetables, livestock and diary are mostly import-competing (and generally

protected) although small quantities of specific commodities are exported.

Agricultural policy until well into the 1980s taxed export agriculture while

providing various forms of input subsidies (irrigation, fertilizer, R&D and extension) to

protected import-competing food agriculture, particularly rice. The shift to inward-

oriented development strategies from the late 1950s, with protection for import-

substituting industries and accompanying real exchange overvaluation (leading to

exchange controls and a discriminatory dual exchange rate regime) exacerbated the

burden on export crops. Despite assistance and protection for import-competing food

agriculture, the policy regime during this period probably had an overall anti-agricultural

bias.

The process of policy liberalization from the late 1970s eroded the former overall

anti-agricultural bias. Direct taxation of export crops was sharply reduced in the 1980s

and largely eliminated by the early 1990s, and manufacturing trade liberalization

drastically lowered the indirect burden on agriculture flowing from industrial

protectionism. But policy reforms have been both limited and selective in the import-

competing parts of the agricultural sector. Many import-competing agricultural industries,

including not only rice but also several others such as sugar, potatoes and dairy, have

continued to enjoy both direct input subsidies and, to varying degrees, protection through

the trade regime. Thus the overall policy regime – in general far more liberal than at any

1 For reviews of agricultural policy in Sri Lanka, see Thorbecke and Svejnar (1987), Bhalla (1991), World

Bank (1995), Athukorala and Kelegama (1998), Anderson (2002) and Sanderatne (2004). 2 These „minor export crops‟ are often referred to as „non-traditional‟ agricultural exports, distinguishing

them from the „traditional exports‟ of tea, rubber and coconut, even though many of these crops have been

exported for thousands of years while tea and rubber were introduced to the country only in the late 19th

century.

3

time since the late 1950s – now tends to have a pro-agricutural bias because of the

reduction in taxes on agricultural exports.

Protection from import competitions and direct assistance to food agriculture have

failed to achieve their stated goals of adequately encouraging production of staples and

reducing the growing gap between rural and urban household incomes. True, domestic

rice production increased substantially, but overall food production has almost stagnated

(growing less than half as fast as in other developing countries over the 1990s) such that

food self-sufficiency has kept declining and rural poverty alleviation has been slow. It is

clear that a comprehensive re-assessment of agricultural policies should be on the policy

agenda as a priority issue.

Economic growth and structural changes

Since independence in 1948, Sri Lanka has had regular changes in government with

distinctly different economic policy orientations. As indicated earlier, it has experimented

with a wide variety of economic policy regimes under different governments. However,

since 1977 the basic direction of policy has not changed despite several changes of

government, although there have been differences in the pace and scope of liberalization

measures. Figure 1 shows real GDP growth rates and the changing policy regimes under

different governments.3

Relatively slow per capita growth during the 1950s and 1960s was followed by

particularly traumatic experiences during 1970-77, when policy responses to the impact

of the first oil shock of 1973 and to a youth rebellion resulted in severe import

compression and shortages of essential goods. This generated widespread popular

discontent against the ISI policies and extensive government intervention in the economy.

As a result, there was massive popular support for a shift in policy that brought into

power a new United National Party (UNP) government in 1977 that pledged to adopt

3 For more details of the policy regimes and growth experience, see Athukorala and Rajapatirana (2000),

Athukorala and Jayasuriya (1994), World Bank (2004), Weerakoon (2004) and Kelegama (2004).

4

„open economy‟ policies. A major liberalization effort was launched in 1977, marking a

decisive break with the previous policy regime.

As a result of progressive pro-market reforms from 1977, Sri Lanka became and

still is the most open economy in South Asia. Since 1977 it has averaged a reasonably

healthy real average annual GDP growth rate of 4.75 percent (3.5 percent per capita),

attaining a per capita income of US$1200 by 2006 at the official exchange rate (and over

$4,000 in PPP dollars). Despite ongoing ethnic and social conflicts that have plagued the

country for nearly two decades, this is a higher growth rate than achieved by most

countries that had similar per capita incomes in the mid-1970s, with only Botswana

recording faster growth.

Starting with above average human development indicators across a wide range of

indicators from its early years of independence (achieved through investments in health

and education financed by taxes on plantation crop exports), Sri Lanka has managed to

maintain its position: life expectancy at birth for males and females, for example,

averages 72 and 76 years – higher than the middle-income country average – and its

literacy rate is over 90 percent. Nevertheless, Sri Lanka‟s overall developmental

performance is disappointing when compared with the high-performing East Asian

economies, given that Sri Lanka had comparable or higher real incomes and human

capital endowments in the 1950s and early 1960s. This poor performance is at least in

part due to the ongoing civil war and ethnic conflict that has caused enormous damage to

the economy and to the wider socio-political environment.4

The overall position of agriculture within the national economy is shown in Table

1. The shares of the agricultural sector in GDP, employment and exports has declined

progressively from the 1950s, although the sector remains a major source of income and

employment of a large proportion of the population, and a significant source of national

export earnings.5 In contrast to the gradual shrinking of agriculture‟s share of GDP, the

fall in its share in exports in the 1970s and 1980s has been sharp (Figure 2). Until the late

4 The cost of the war between 1983 and 2000 was conservatively estimated at twice the value of Sri

Lanka‟s 1996 GDP (Arunatilaka, Jayasuriya and Kelegama 2001). 5 Note that processing of tea, rubber and coconut products – usually included under manufacturing – is

included in this table under Agriculture, Forestry and Fisheries to indicate the overall contribution of the

sector to the economy.

5

1960s agricultural commodities accounted for more than 90 percent of Sri Lanka‟s

exports but since the early 1990s its share has been below 20 percent, with manufacturing

– particularly garments – emerging as the major export category.6

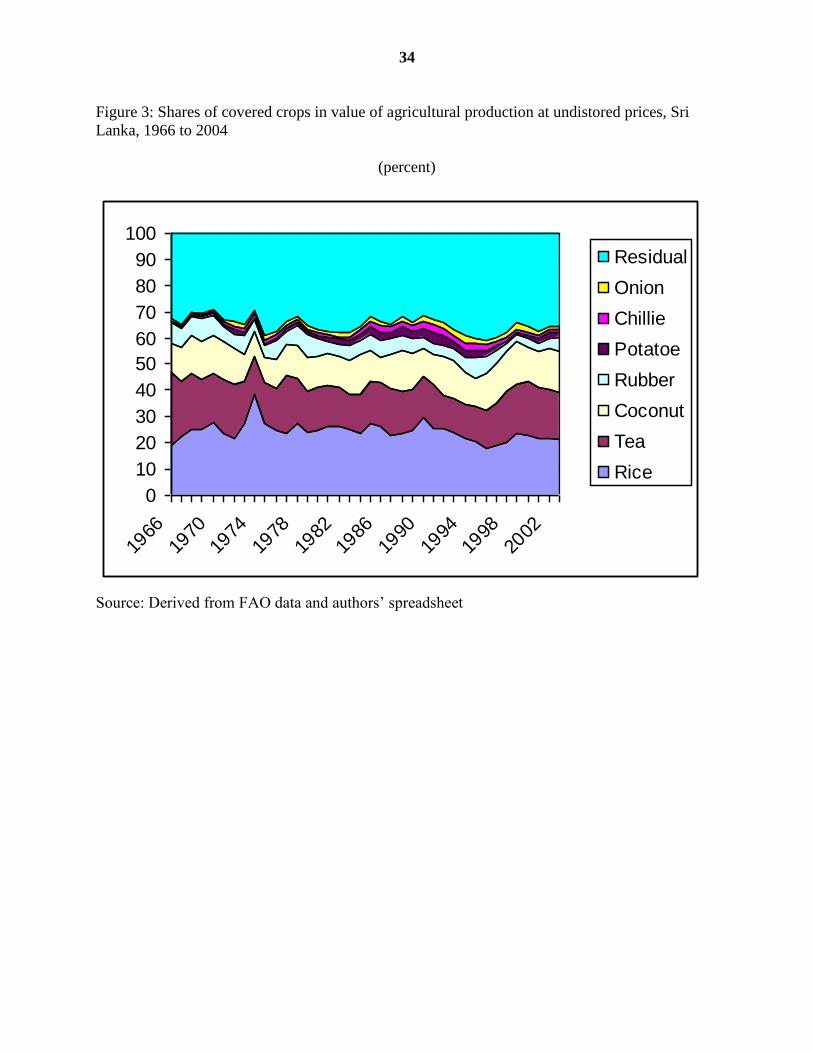
The shares of different agricultural products in the value of agricultural

production and in household consumption expenditure are shown in Figure 3. Paddy

accounted for around 25 percent of agricultural and fisheries output in the early 1980s,

but its share is now barely half that. Likewise, the share of rice in household spending has

halved over that period and currently is around one-tenth.

The agricultural sector is widely considered to have contributed to the poor

performance of the wider economy: “In terms of sectoral contributions to growth,

agriculture has been a continual drag….”, and “the long-term average growth rate in

agriculture has barely exceeded the rate of population growth, which has contributed to

the persistence of poverty (the headcount ratio stood at 23 percent in 2002, which is

relatively high for Sri Lanka‟s per capita income)” (IMF 2005, p. 5).

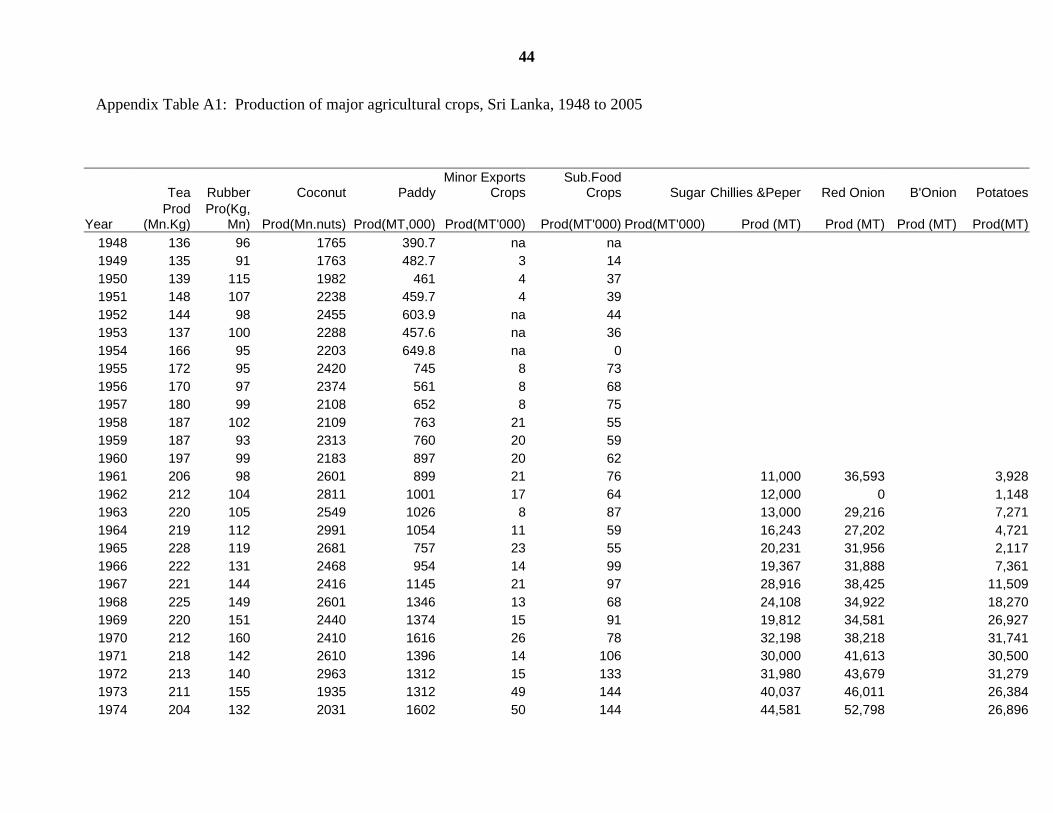
Within agriculture, the output of most crops has either stagnated or declined since

the 1980s (Appendix Table 1). Tea is the sole important exception. Tea output expanded

from around 200 million kgs per year in the early 1980s to around 300 million kgs at the

turn of the century. A combination of area expansion (primarily from an expansion of

smallholder cultivation in the low-altitude regions) and higher-yielding new cultivars was

stimulated by higher prices for the „stronger‟ teas produced in lower altitudes. Production

of rice and coconuts – the two crops that dominate smallholder agriculture in Sri Lanka –

has stagnated, while outputs of rubber, minor crops and subsidiary food crops, including

income-elastic horticultural crops, have fallen quite significantly. This has meant that

non-tea agricultural exports have fallen while food imports have grown. Overall, Sri

Lanka‟s per capita food production has fallen by over 12 percent since 1980, compared

with a rise of 48 percent in other developing countries on average (World Bank 2001).

This raises the question: did policy distortions contribute to this relatively poor

performance?

6 Agriculture‟s contribution to net exports is greater than implied by these gross export data because exports

of garments that dominate manufactured exports have a large import content (Athukorala and Bandara

1989).

6

Policy evolution

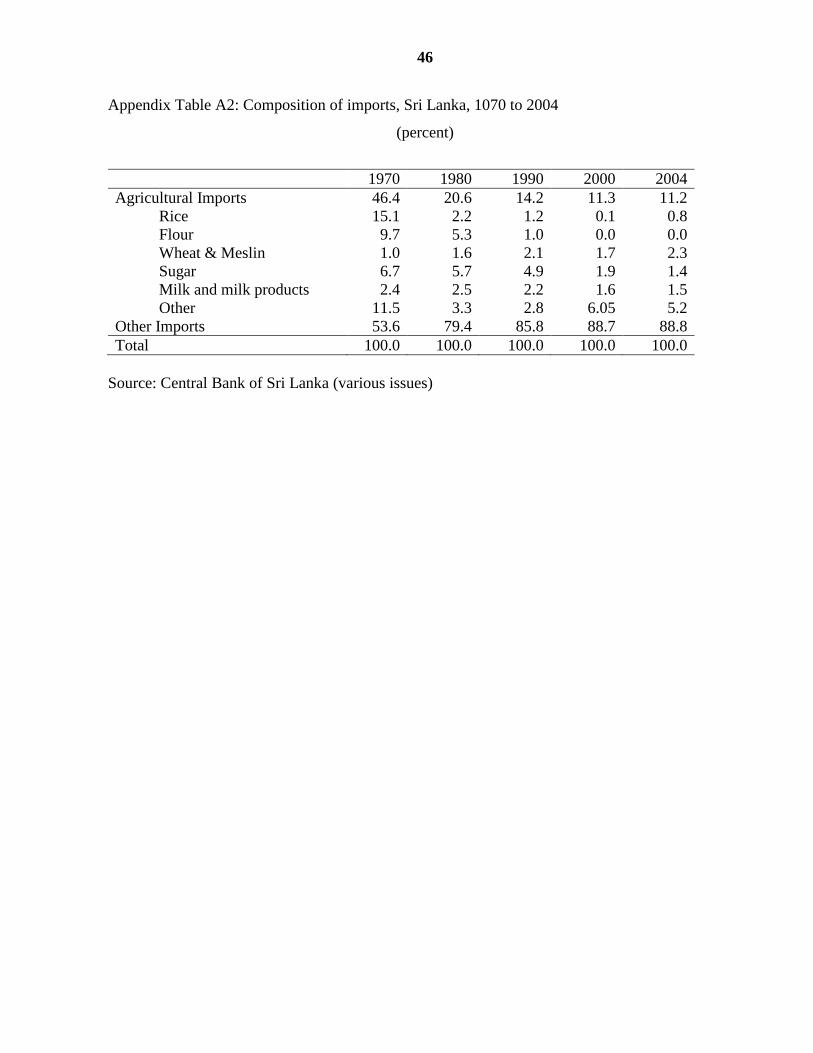
At the time of independence, Sri Lanka‟s three plantation crops – tea, rubber and coconut

– dominated Sri Lanka‟s exports, while significant quantities of rice, wheat and other

food products were imported. This basic distinction between exportable and import-

competing agricultural products is critical to understanding Sri Lankan agricultural

policy. Export dependence varies greatly, however. For example, more than 80 percent of

the coconut crop is domestically consumed, with both nuts and oil being essential parts of

the Sri Lankan diet. The share of domestic consumption is quite low in the case of tea

(less than 15 percent) while for rubber it is around 35 percent thanks to an expansion of

rubber-based manufacturing industries.

The tea and rubber sectors had a pronounced dualistic structure. Foreign-owned

large plantations contributed a large share of output at the start of the post-independence

era, but they were taken over by the state in 1974. Then from the early 1990s they were

progressively handed back to the private sector, including foreign companies, but the

share of large plantations has been in gradual decline. By contrast, the import-competing

food crops as well as the coconuts have always been dominated by smallholders,

although a substantial proportion of the coconut industry was held in the form of large

plantations until land reforms in the early 1970s.

Export taxes on agricultural crops (tea, rubber and coconut products) initially

were a major source of government revenue, accounting for around 30 percent of all

government tax revenues during the 1950s. They helped finance expenditures on public

education and health, and on food subsidies. Levies on exports also financed agricultural

research, extension and replanting programs for plantation crops. The structure of export

taxes not only reduced average producer revenues but also had the effect of greatly

lowering gains from any price increases. When domestic prices rose, whether due to

world price increases or because of currency devaluations, government tax revenues

siphoned off the bulk of the price increase. This meant that while producers had to bear

the cost increases linked to domestic inflation, they were largely deprived of the benefit

7

of any exchange rate adjustments that were made – as happened on several occasions

from the late 1960s onwards – to restore international competitiveness of tradeables

sectors.

In common with many other developing countries, Sri Lanka followed a food self

sufficiency policy, narrowly interpreted as one of encouraging „rice self sufficiency‟. On

the production side this involved major investments in irrigation (irrigation water being

supplied at no cost to farmers), fertilizer subsidies, and the provision of rice and other

agricultural research and extension services. There was also a public distribution system

for procurement and marketing of paddy and other commodities, aimed at making rice

more affordable for consumers. Staple food prices were heavily regulated until the 1977

liberalization, and many of them have remained subject to strong government

interventions – including regulation of import volumes – aimed at maintaining price

stability.

From the late 1950s, the structure of incentives was further biased against export

crops with the adoption of import and exchange controls in response to growing balance

of payments problems caused partly by a secular downward movement of Sri Lanka‟s

international terms of trade. The adoption of these measures, rather than a currency

devaluation, led to real exchange rate overvaluation. The import restrictions (tariffs and,

increasingly, non-tariff measures) and exchange controls were further strengthened

subsequently as a result of the ideological shift to an ISI development strategy. The result

was high manufacturing protection, severe import compression, pervasive state controls

in trade, marketing and distribution, persistent exchange rate overvaluation, exchange

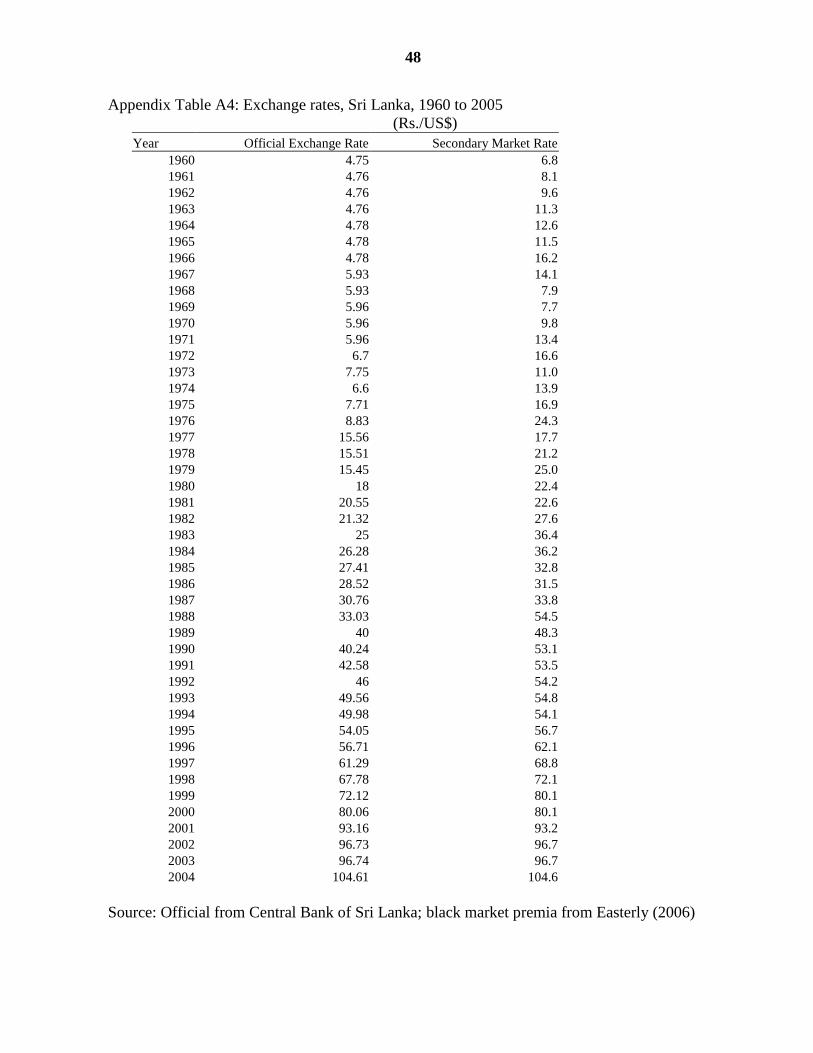
controls and a formal dual exchange rate system between 1968 and 1977.7 Under the dual

exchange rate system, there was a basic rate and a so-called Foreign Exchange

Entitlement Certificate Scheme (FEECS) which was initially (in 1968) set at 44 percent

higher (more depreciated) rate, but adjusted to 55 percent in 1969 and then to 65 percent

in 1972. The main plantation crops (tea, rubber and coconut) – the „traditional exports‟ –

had to convert export earnings at the less favorable official exchange rate while non-

7 See Athukorala and Jayasuriya (1994) for a description of these developments. Athukorala and

Rajapatirana (2000) provide an analysis of the manufacturing sector developments.

8

traditional exports were eligible for the FEECS rate.8 The highly overvalued official

exchange rate, rather than the somewhat more realistic FEECS rate, was also applied to

some imports of the major agricultural products such as rice, wheat and sugar. However,

such imports were heavily regulated and under direct government control. Hence rice

producers were still shielded from import competition. And there is other evidence (for

example, the high premium in black market rates of exchange) that there was substantial

real exchange overvaluation which discriminated against exportable industries and

favored import-competing ones, both in agriculture and elsewhere.

In short, despite the fact that the rice sector was granted special incentives and

other import-competing agricultural products also gained significant protection from the

import substitution strategy, studies such as that of Bhalla (1991) conclude that there was

an overall bias against agriculture because of the severity of the anti-export impact of the

overvalued currency, the large weight of exports in farm output, and the high protection

granted to manufacturing. This started to change only from 1977, with the policy shift

away from the ISI strategy and its replacement with more liberal pro-market policies.

After the 1977 policy liberalization food subsidies to consumers were sharply

reduced,9 and the emphasis on food self-sufficiency was enhanced. Public investments in

major irrigation systems were expanded, for example. The government implemented a

huge irrigation-cum-hydropower scheme (the Accelerated Mahaweli Development

Project) with substantial foreign assistance, and around one-third of all government

capital expenditure was devoted to this single project for several years from 1979. The

project was explicitly rationalised as a major step towards achieving rice self sufficiency

– the coveted national goal – and thereby it appealed to the popular imagination which

partially blunted the political impact of cuts in food subsidies.10

8 The large plantation crop sector also suffered much investor uncertainty from the mid-1950s, including

facing the threat of nationalization before they were finally taken over by the state in the mid-1970s. 9 In the past the government encouraged substitution in consumption of wheat for rice, to reduce the fiscal

burden of the consumer rice subsidy. 10

However, the project was resented by sections of the minority Tamil community: not only was an appeal

for extending irrigation to the existing Tamil farming areas rejected, but the newly irrigated lands were

settled largely with members of the majority Sinhalese community. This has been highlighted in numerous

studies. For example, a study by the OECD Development Assistance Committee pointed out how the

project exacerbated ethnic tensions: “The conspicuous absence of consideration of the project‟s possible

negative impact on simmering tensions is striking – considering that it had glaring ethno-political

implications: (1) there was an ethnic overlay to the geographical areas which would benefit (or not) from

9

The 1977 reforms also reduced manufacturing sector trade protection, and explicit

export taxes on plantation crops were largely eliminated in the 1980s. There were both

fiscal pressures and political imperatives driving the reduction of export taxes on

plantation crops: nationalisation of large foreign-owned plantations had transferred them

to state ownership from mid-1970s, and the land reforms of the early 1970s had

broadened their ownership base, largely among Sinhalese smallholders (Moore 1985).

Trade liberalization was not uniform though: it extended to some import-

competing agriculture, but excluded others. Crops that were widely cultivated in the

North (e.g. red onion, chillies, grapes) were subject to liberalization while protection for

other crops (such as potato) were maintained and even increased.

After the initial economic growth stimulus following the liberalization of 1977

and the huge public sector investment boom (assisted by a massive flow of foreign aid),

growth started to slacken even though the economy was cushioned for a while by a tea

price boom in the early 1980s. Simmering ethnic tensions erupted into a secessionist war

following anti-Tamil riots in 1983, and social tensions in the south led to a highly

disruptive rural youth rebellion in the late 1980s. Economic and political conditions

worsened, and the economy lost steam. In 1990/91, responding an emerging balance of

the project; and (2) the government decision to resettle displaced Sinhalese villagers in traditionally Tamil

regions. The decision by the Jayawardene government to compress and accelerate the 30-year program into

six years further exacerbated ethnic tensions. The original version of the programme had included irrigation

projects in the Tamil-majority Northern Province; but this was removed from the accelerated programme

with the argument that it would be too expensive and problematic technically” (Bush 1999). These facts are

well known, extensively documented and not contested by any serious scholar of Sri Lanka. “Since the

1930s and especially the 1940s resettlement projects have been implemented in Sri Lanka to alleviate the

growing shortage of land in the south-west, where the population is very largely Sinhalese. Sri Lanka's

Tamils have opposed these projects because they threaten to change the ethnic majority in the provinces

concerned to the disadvantage of the Tamils and Muslims. With the Mahaweli project, which has been

planned since the 1960s and consists of a large number of subsidiary energy generation projects, the

country's largest scheme was launched, the aim being to use at least 74 percent of the settled area – where

Tamils previously formed the majority of the population – for Sinhalese. The Sinhalese settlement projects

became one of the decisive motivating factors in the Tamils' resistance. This is not least evident from the

many attacks on colonies of new Sinhalese settlers during the civil war.” (Klingebiel, 2001, p. 10). Peebles

(1990) points out how the scheme was re-designed in a way that excluded the largely Tamil populated

Northern Province: “The choice of projects to be developed also reflects the focus on Sinhalese settlement.

Under the Water Resources Development Plan systems J, K and L and part of system I fell within the

Northern Province and were to irrigate 232,000 acres by a Northern Central Province canal. None of these

systems were included in the Accelerated program…” (p.43). See also Moore (1985), Manogaran (1987).

The World Bank, a major donor, subsequently acknowledged the problems related to this project‟s

perceived ethnic bias in a World Bank study: “…..donors may have missed a significant opportunity to

promote equitable participation through the huge Mahaweli power, irrigation and resettlement scheme”

(Kreimer at al. 1998, p. 22).

10

payments crisis, the government devalued the currency and initiated a second wave of

liberalization (Dunham and Kelegama 1997).

Liberalization proceeded in an uneven way following the initial measures. Export

duties on plantation crops, already reduced substantially from the mid-1980s, were

eliminated in 1992, while high rates of nominal (and effective) protection for import-

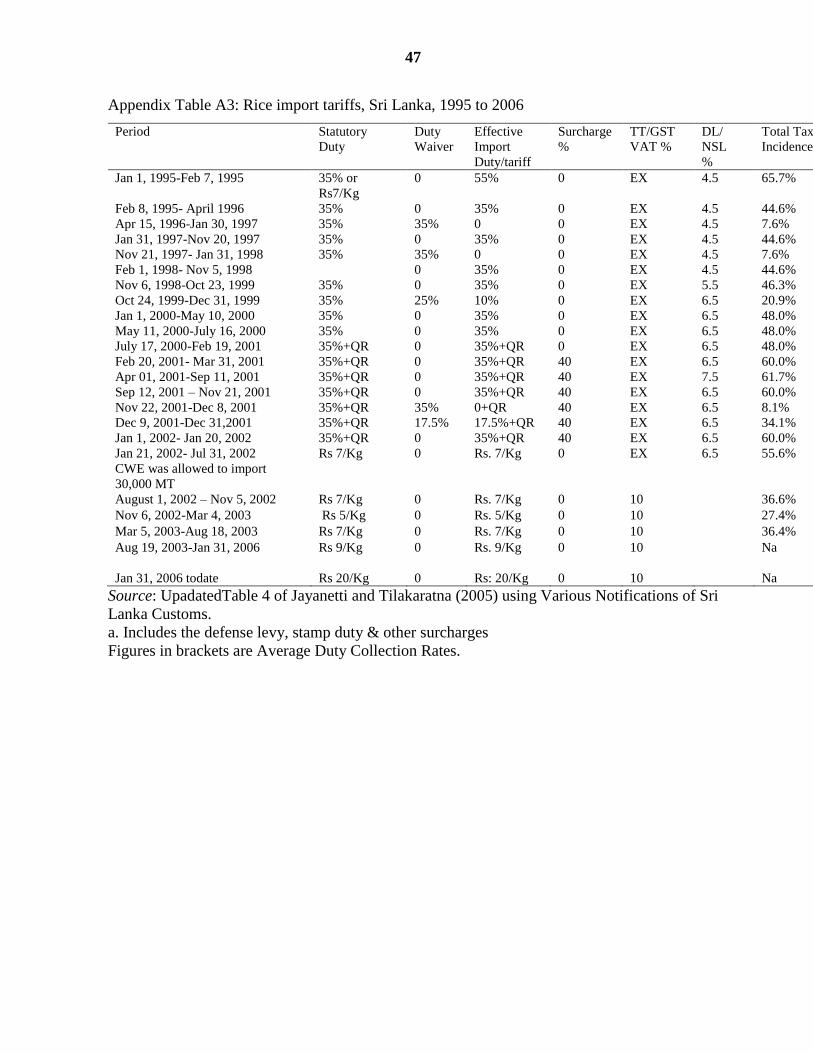
competing agriculture continued (Edwards 1993, World Bank 1995). The government

frequently used regulatory controls on imports, manipulating licensing and variable

tariffs, to achieve not only protection but also price stability. The latter was particularly

important in the case of the highly politically sensitive commodities such as rice and, at

times, also coconut. Tariffs on agricultural imports were gradually reduced through to

1993 and, as part of the GATT‟s Uruguay Round Agreement on Agriculture, Sri Lanka

bound all its tariffs on agricultural goods at a uniform rate of 50 percent from January

1995 – although this was well above applied tariffs. Subsequently it removed quantitative

restrictions on all agricultural imports except wheat and wheat flour. In fact some of the

most important changes since the early 1990s have been not so much in the level of

restrictions as in the move away from various forms of nontariff barriers including

regulatory interventions to more transparent tariff-based import restrictions. The general

picture, which is confirmed by the various indicators of assistance provided below, is that

the policy regime in recent years has provided assistance to import-competing agriculture

and at rates similar to the levels of assistance to manufacturing industry.11

The general trend in overall policy – despite phases of slow progress and

occasional backsliding – has been towards progressive liberalization, and Sri Lanka now

has perhaps the most open trade regime in South Asia. The evolution of the overall

structure of incentives can be seen by looking at the changes for the manufacturing sector

and the two agricultural sub-sectors. At the time of the 1977 reforms, the implicit rates of

protection for manufacturing as well as many import-competing agricultural commodities

11

Athukorala and Kelegama (1998) suggest that the actual level of protection for manufacturing tended to

be overestimated by the use of gazetted tariff rates which were often higher than actual tariffs because of

various tariff loopholes and exemptions. But the same may be true of earlier estimates of effective

assistance to agriculture. For example, the World Bank (1995) produced estimates that attempted to take

into account the provision of free or subsidized inputs such as irrigation water used by many import-

competing crops grown under irrigated conditions, including rice. We believe the approach used to derive

that implicit subsidy associated with free irrigation water tended to overestimate it.

11

were extremely high. Even after major reforms, effective protection of the manufacturing

sector in 1979 has been estimated to be 137 percent (Cuthbertson and Athukorala 1991).

This had fallen to 90 percent in 1981, and was estimated to have come down to 77

percent in 1991 and 43 percent in 1994 (World Bank 2004). By 2005, liberalization in the

manufacturing sector had proceeded further.

In addition to reforms in manufacturing, there have been important moves

towards liberalizing the food import-competing sector. Wheat imports were liberalized by

ending a government-granted long term monopoly on flour milling to a Singaporean

based company (PRIMA) that also gave them a virtual monopoly on animal feed supply.

Government trading enterprises play a role in both domestic distribution and international

trade, but it is minor.

Trade policy continues to protect rice and several other import-competing food

crops (such as potato) with the use of seasonally varying tariffs and specific duties. Those

interventions respond to domestic price and supply conditions. Further, despite the

shrinking share of agriculture in both GDP and employment, agricultural producer

subsidies remain important as governments have responded to intense pressure to

maintain and even expand them. For example, subsidies such as for fertilizer (targeted

largely though not solely towards import-competing crops, particularly those cultivated

by smallholders) continue, in a very volatile political environment. Periodically the

fertilizer subsidy has been a component of government assistance to agriculture, and

populist governments have used it to appeal to the politically important farming

community. Until recently its aggregate assistance effect would have not been large, but

the fertilizer subsidy doubled in 2006 compared with 2005, and its cost may have risen by

a further one-third to reach Rs 11 billion ($1200 million) or more in 2007 (Figure 4).

There are also frequent ad hoc changes to import policies particularly in the case of

„subsidiary‟ food crops such as potato and onion, where small but politically powerful

farm groups exercise much political clout.

Thus the broad contours of present agricultural policies in Sri Lanka appear to

resemble some aspects of the early agricultural policy evolution in more-developed East

Asian economies: overall a relatively liberal trade regime, but granting significant

protection for particular import-competing agricultural industries. In the next section we

12

present the estimates of a number of indicators of incentives for major agricultural

products and different commodity categories (such as exportable and import-competing

products). We then attempt to explain the changing pattern of agricultural

taxation/assistance since independence that has led to the current outcome.

Direct and indirect distortions to incentives

The main focus of the present study‟s methodology for estimatingthe extent of distortions

to agricultural incentives (Anderson et al. 2008) is on government-imposed measures that

create a gap between actual domestic prices and what they would be under free markets.

Since it is not possible to understand the characteristics of agricultural development with

a sectoral view alone, the project‟s methodology estimates the effects not only of direct

agricultural policy measures (including distortions in the foreign exchange market), but

also of distortions in non-agricultural sectors that compete with farmers for mobile

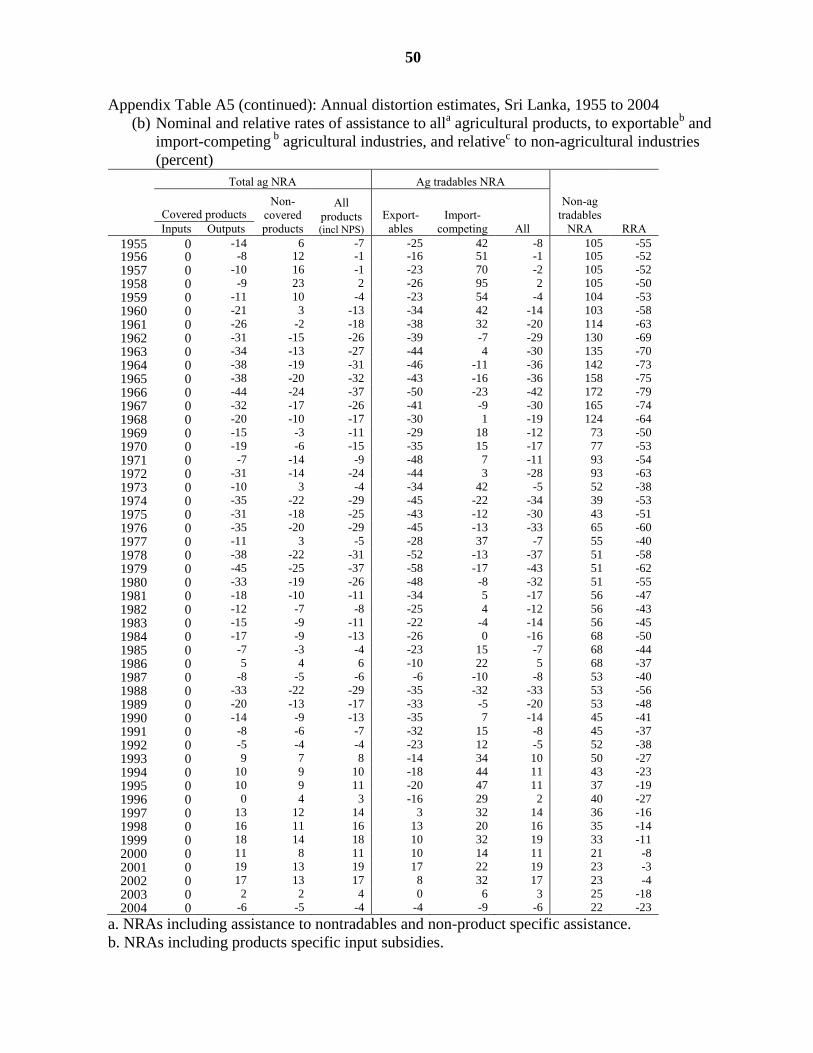
resources such as labor and capital. More specifically, this study computes Nominal Rates

of Assistance (NRAs) for farmers and also generates an NRA for nonagricultural

tradables, for comparison with that for agricultural tradables via the calculation of a

Relative Rate of Assistance (RRA – see Anderson et al. 2008).

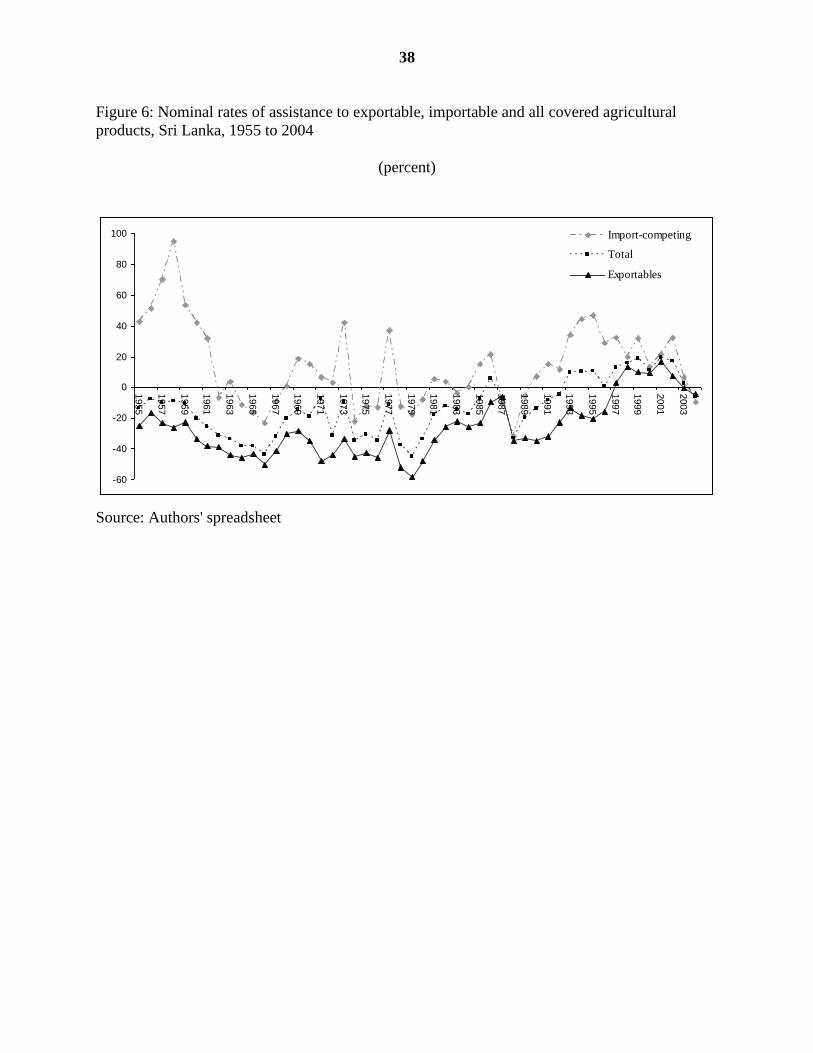
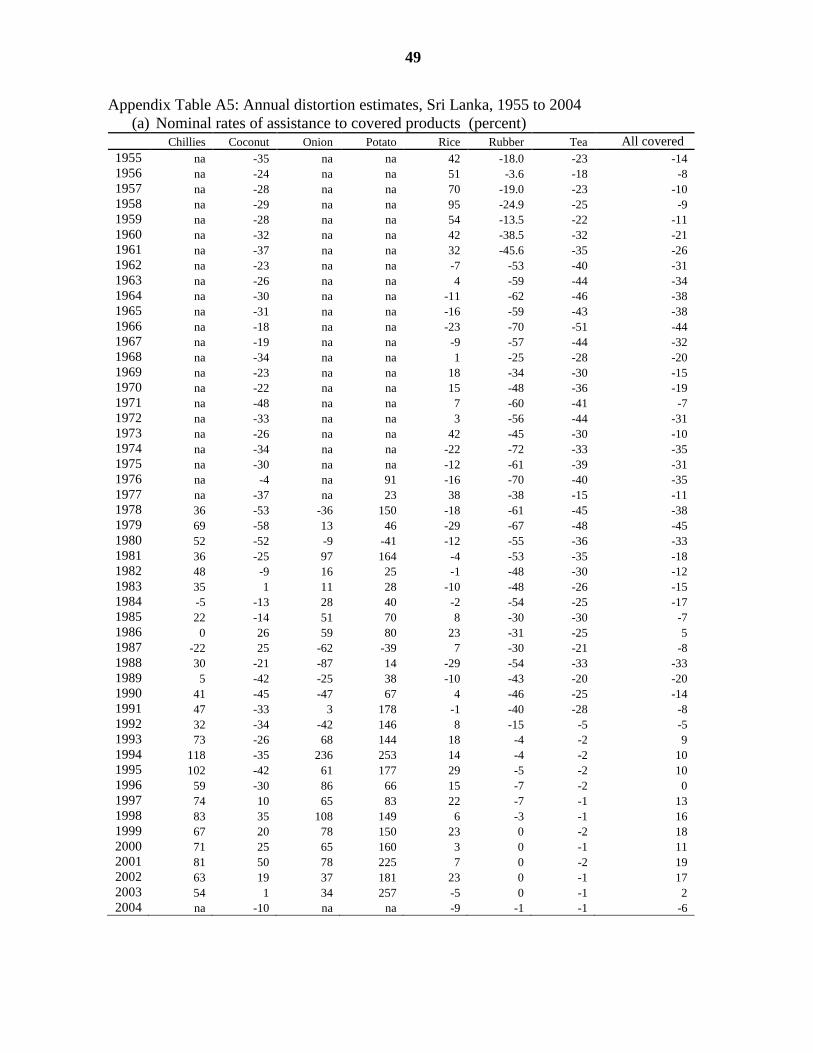
We present in Table 2 our estimates of temporal patterns of distortions to

agricultural incentives from 1955 to 2004 for seven major commodities: three exportables

(rubber, coconut and tea) and four import-competing products (rice, potato, onion and

chillies).12

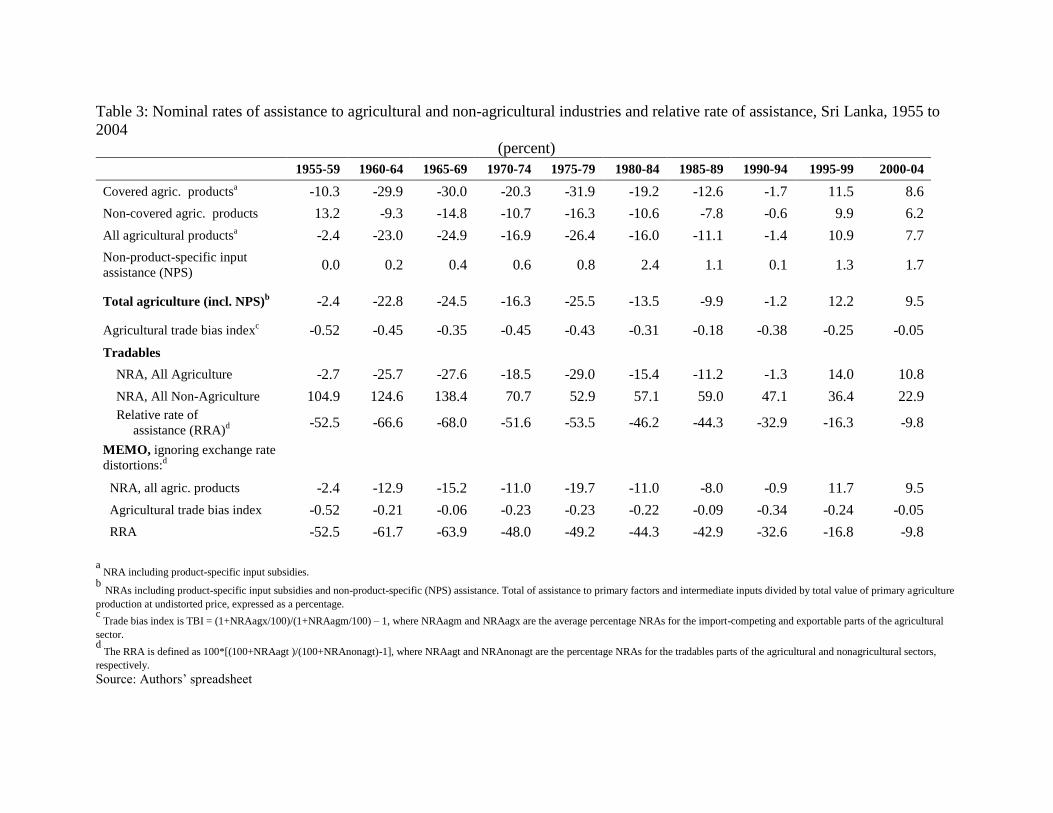
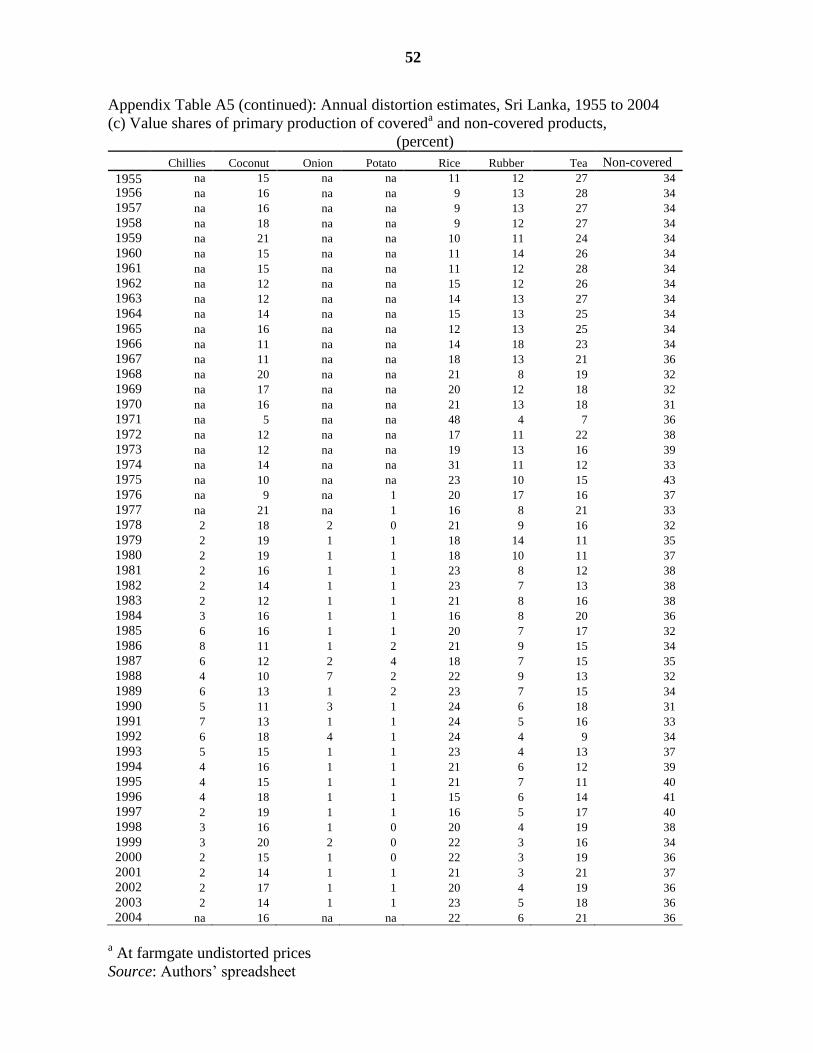
In Table 3 we also include a guesstimate of the NRA for non-covered farm

products, which account for around one-third of the overall value of agricultural

production. That guesstimate assumes non-covered products are equally divided between

exportables, nontradables and import-competing products (one-third each of the residual

12

Some commodities, such as livestock including dairying, are not included in this exercise because of

severe data limitations. For the livestock sector, for example, consistent time series data on domestic prices

of meat products are not available, and international prices for comparable quality meat products are also

not available. The quality differences between domestic and world market products, except perhaps in the

case of chicken, are so large as to make them almost completely different products.

13

value of farm production), and that for nontradables the NRA is zero while for

exportables and importables they are equal to the estimated NRAs for the two sub-sets of

covered products (all of which are tradable). The farm input assistance was minor before

2005 and so no estimate is included for such non-product-specific assistance. The NRA

for non-agricultural tradables is based on the import duty collection rate for import-

competing manufacturing and an assumption that direct assistance to non-agricultural

exportables is zero.13

This can substantially underestimate the actual rate of

manufacturing protection, because high tariffs (or binding non-tariff barriers) may result

in low rates of import duty collections because they lead to lower import volumes. We

believe the non-agricultural NRA before liberalization in 1977-78 would be significantly

higher than indicated by these data, and that the RRAs may therefore correspondingly

underestimate the policy bias against agriculture. (Annual time-series NRAs and value of

production shares of different commodities are tabulated in the Appendix.)

Export crops

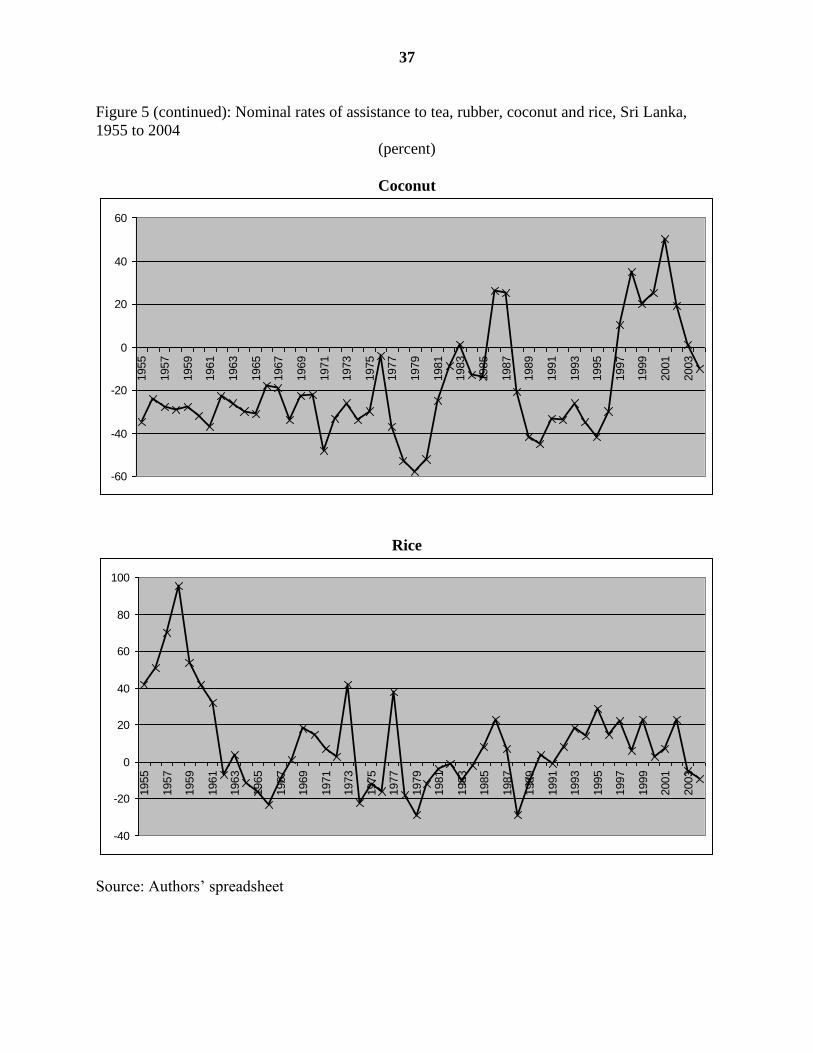
We begin by focusing on export crops before turning to import-competing ones, and in

doing so refer to the NRA five-year average estimates in Table 2 and the annual estimates

depicted in Figure 5.

Tea

The annual NRA estimate for tea, which is based on the ratio of the domestic Colombo

Auction price and the average fob export price of bulk leaf tea, suggests that this industry

has been taxed by more than 30 percent up to the mid-1980s. Since then the estimated

rate of taxation has declined sharply as export taxes were progressively lowered and

largely abolished by the early 1990s. The NRA has fluctuated around that trend (see

Figure 5), primarily because the export tax rate was on a sliding scale such that taxation

was higher during periods of high international prices. There was a steep increase in taxes

13

These NRAs for tradables include an estimate of the trade tax effect of the overvalued exchange rate. As

outlined in the methodology, that estimate uses the black market exchange rate premium (see Easterly

2006) and assumes that only half of exporters‟ foreign exchange rate earnings are sold to the government at

the official rate. See Anderson et al. (2008) for details of this methodology.

14

in the immediate aftermath of the 1977 reforms, for example, associated with the

exchange rate depreciation that accompanied the liberalization (which increased the

domestic currency price on which the tax was based) and the international tea price

increase of the early 1980s. There is no evidence of significant market imperfections

within the domestic market for tea production, processing and wholesale marketing

through the auction. The Colombo Tea Auction is considered to be quite competitive

though there have been some criticisms of the system in the past. Hence the rate of export

taxes and cesses provides a reasonable estimate of NRAs given the fact that it is not

possible to use domestic and border price data to directly compute NRAs because of the

growth of importance of „value added teas‟ (tea bags etc) for which a reliable border price

is not available.

What is not reflected in these figures is that tea imports into Sri Lanka have been

effectively subject to a near total ban until recently, ostensibly to ensure that cheap

foreign teas are not re-exported as quality „Ceylon Tea‟. Though there has been some

relaxation of this recently, a prohibitive tariff has effectively ensured that tea imports are

negligible. The outcome has been that Sri Lanka lost the chance to develop a tea blending

industry, resulting in Dubai emerging as the centre of the lucrative tea blending centre

using significant quantities of both Sri Lankan tea and imported Sri Lankan labor

(Ganewatta 2002).

Rubber

The annual NRA for sheet rubber, which is based on the percentage gap between the

average domestic Colombo Auction price for sheet rubber and the average fob export

price of rubber, suggests that this industry has been taxed by even more than the tea

industry, by more than 50 percent up to the early 1980s. Since then the rate of taxation

has declined fairly rapidly, and reflecting the virtual elimination of export taxes, the NRA

estimate has averaged clse to zero in recent years. The NRA has fluctuated around this

trend (see Figure 5), again primarily because the export tax rate was on a sliding scale

such that taxation was higher during periods of high international prices. As with tea, the

rate of export taxes and cesses provide a reasonable estimate of NRAs in recent years

15

given that it is difficult to compute reliable NRAs from available price data because of

the changes in the composition of exported rubbers.

Coconut

Coconut products (copra, oil, fibre and coir products, etc.) were a major export product

category at the time of independence, but export volumes have since fallen. Because of

its importance as a food crop (in the form of nuts) and for coconut oil for household

consumption (it is the most widely used cooking oil), it attracted significant direct price

and non-price interventions by the government with the aim of stabilising domestic prices

while maintaining „reasonable‟ producer prices (de Silva 1979). However, over time

imported palm oil has emerged as a viable substitute for coconut oil in many domestic

uses. Thus in more recent years coconut oil may be considered an import-competing

product. Up to the early 1980s, the NRA estimates suggest the coconut industry was

taxed to a similar degree to tea (hence less than rubber), but since then its taxation has

averaged closer to zero and in the late 1990s/early 2000s the industry enjoyed a positive

NRA. This reflects the fact that imported palm oil has become a viable substitute for

coconut oil in many uses, and protection from that competition raised the domestic price

of coconuts above what it would have been without palm oil import restrictions. In the

case of coconuts, the reductions in export taxes did not produce corresponding reductions

in NRAs because of trade restrictions on coconuts and coconut products (such as export

bans) imposed to maintain low consumer prices (and „reasonable‟ producer prices).

Import-competing farm products

Rice

The pattern of NRAs for rice reflects the fluctuating impacts of direct government

interventions in response to changes in domestic supplies and international prices. Apart

from the 1980s, the NRA average each decade has been positive (Table 2), which is

16

consistent with the fact that both average consumer and producer domestic rice prices

have been usually above the average cif import price.14

When domestic prices fall, whether due to a bumper harvest at home or due to a

fall in the price of imports, pressures for assistance emerge. Rather than increase

domestic prices by direct purchases, the response to such political pressures from the rice

farming lobby usually has been to raise import barriers and expand input subsidies for

fertilizer, R&D, etc. Those ad-hoc policy changes in rice import tariffs since 1995 are

shown in Appendix Table A3, while the Figure 4 shows the dramatic increase in the

fertiliser subsidy in recent years.

A fuller picture of rice policy requires that it be placed in the context of the wider

cereal staples policies, particularly for wheat which is the closest substitute for rice in

consumption even though it is not produced domestically. Rice consumption in Sri Lanka

averages around 100 kg per capit per year, but wheat consumption has increased with

urbanization from less than 25 kg during the 1950s to nearly 50 kilogram per capita at

present. The consumer tax equivalent on wheat flour from import measures was low and

sometimes even negative until the early 1980s, but then it increased significantly and has

since fluctuated widely around an average value of more than 50 percent.

Chillies, onions and potatoes

High rates of import protection were enjoyed by producers of chillies and onions in the

pre-liberalization protectionist period, but this protection came down after the

liberalization in 1977/78. In contrast, protection for potatoes increased sharply in the

post-liberalization period, particularly in the 1990s. Although imports were briefly

liberalised around 1996, potatoes – grown by only a few thousand farmers – have

continued to enjoy a pre-eminent position among protected crops.15

14

For those familiar with Sri Lanka‟s history of government subsidized rice provision for consumers, this

may seem rather puzzling. But those subsidies via ration shops apply only to a small fraction of national

consumption, such that the weighted average of the (very low) price of government-provided rice rations

and the open market price consumer price is close to the latter. 15

Tobacco is another crop that enjoys a high level of protection. According to the WTO Trade Policy

Review 2004, the average tariff for the tobacco sub-sector was 149 percent in 1998 and 153 percent in 2003

– well above the bound rate of 50 percent applying to most agricultural products.

17

Sugar

NRAs are not provided for sugar because it is predominantly imported and domestic

production is quite small. This is despite the fact that sugar has been heavily protected.

The level of protection has come down since the 1980s but remains quite high. During

the period up to the late 1970s when consumer food subsidies were not uncommon, sugar

was an exception: its high tariff brought in much needed government revenues that

helped maintain other food subsidy expenditures.

Agricultural versus nonagricultural assistance

The products covered in Table 2 account for about two-thirds of the overall value of

agricultural production. Their weighted average NRA was around -30 percent in the

1960s and 1970s, but following the reform of the late 1970s it rose to around -15

percent in the 1980s, to -2 percent in the first half of the 1990s, and to an average of

around 10 percent since then. The picture does not change much when our assumptions

about the NRA for non-covered products are included (top of Table 3), allowing us to

conclude that the direct taxing of Sri Lanka‟s agricultural sector has been gradually

phased out over the past three decades. This is not to say the sector is without price

distortions, as there is still some dispersion in the product NRAs and, in particular, the

NRA for exportables remains below that for importables. However, both of those

indicators of dispersion are now well below what they were in earlier decades. This is

depicted in Figure 6, and is captured also in the trade bias index shown in the middle of

Table 3.

Also important for intersectoral resource allocation is the extent to which non-

agricultural tradables have been assisted by the government. Prior to the 1977 reforms,

protection for import-competing manufacturing was extremely high. Even taking into

account the lower assistance to producers of other tradables, the nominal rates of

assistance to all non-agricultural tradable sectors was well over 100 pecent prior to the

1970s. By the late 1970s it had fallen to below 60 percent, and since the early 1990s it

has fallen further and is now les than 25 percent. When these estimates are combined

18

with those for agriculture to generate the relative rate of assistance (RRA), the full

extent of the discrimination against farmers becomes evident. As shown in the middle

rows of Table 3, those RRA values suggest that during the 1960s, Sri Lankan farmers

received only one-third of what they would have received had markets for both farm

and non-farm goods been free (RRA average of -67 percent). In the 1970s the extent of

discrimination was not much less (RRA average of -53 percent), but then the average

RRA continued to fall to around -45 percent in the 1980s, to -25 percent in the 1990s,

and to just under -10 percent on average in recent years. As is clear from Figure 7, the

decline in protection to manufacturing did more to reduce distortions harming farmers

then did the changes in direct agtricultural policies. And the exchange rate distortions

were not a major contributor to this trend in average NRA and RRA values, but they

did affect substantially the anti-trade bias of past policies (see bottom rows of Table 3)

The political economy of agricultural policies

What were the political forces behind the government‟s agricultural policy choices? We

consider first the export subsector, and then the import-competing subsector.

Export crops

At the time of independence relatively large scale, foreign owned companies dominated

tea and, to a lesser extent, rubber sectors. Even the coconut sector, though largely

smallholder based, still had a significant number of large „estates‟. There was little

political sympathy for the plantation sector from the left of centre coalitions that ruled the

country from 1956 to 1965 (with a brief interruption in 1960) and then again from 1970-

77. The foreign plantations were under threat of nationalization from 1956 onwards, and

finally they were nationalized in the mid-1970s when all large holdings were subjected to

a land reform. The majority of the workers in the large plantations, who had migrated

from South India from the mid-19th

century, had been politically marginalized by being

19

disenfranchised by the first post-independence government. And, most importantly

perhaps, government revenues depended heavily on foreign trade taxes, with export

duties alone contributing nearly one-third of all government revenues in the first decade

after independence. With slow economic growth, governments were continually under

fiscal pressure and had little scope, even if they desired, to reduce the export taxes on

plantation crops.

The combination of high taxes, secular falls in real world prices, and the threat of

nationalization led to a slow but steady decline of the plantation sector, particularly the

large plantations. The sector became more and more smallholder-based, a process that

accelerated after the land reforms. The large foreign-owned firms passed into state

ownership. The 1977 liberalization did not have an immediate positive impact on these

industries, however. The exchange rate reforms that involved a significant nominal

devaluation failed to have much of a positive impact on the sector because the structure

of progressive export taxes – involving a sliding scale of taxes – effectively taxed away

most of the gains from the devaluation (and periodic relative price improvements).

The plantation crop sector, and its role within the economy, had changed in quite

fundamental ways by the mid-1980s. Its share of the national economy had shrunk, and it

became quite clear that new investment in replantings and factory modernization were

essential if the decline of the sector was to be arrested. The political tensions that

emerged in the aftermath of the 1977 liberalization made the government more sensitive

to the political importance of plantation crop cultivators. The plantation crops were

cultivated almost entirely in the wetter central, western and southern regions of the

country, and the cultivators were predominantly from the majority Sinhalese community,

whose support was critical if the governing political parties were to stay in power. Also,

export taxes on plantation crops directly reduced revenues of state-owned large

plantations. These factors combined to erode the economic and political incentives for

maintaining the traditional high export tax regime.

Import-competing crops

20

We have seen that government policies towards import-competing crops have not been

uniform. Further, in the case of key staple food crops, most importantly in the case of

rice, there has been tension between the twin objectives of producer support and

maintenance of low consumer prices. As mentioned earlier, the enduring theme that runs

through Sri Lankan import-competing agricultural policy in the post-independence period

is this difficult balancing act between producers and consumers in staple food crops. This

is best illustrated when we examine policies towards the rice sector.

Rice policy

Rice is the most sensitive political commodity in the country. The immediate post-

independence governments – aided by the proceeds from high commodity prices during

the Korean War – were able to maintain and even expand the policy of providing cheap

subsidized rice to consumers through a universal rice ration, which they had inherited

from the British colonial rulers. It formed a central component of a wider political

strategy that aimed to undercut the potential threat from a Marxist left with strong roots in

trade unions. An attempt to reduce the rice subsidy in 1953 brought the country to the

verge of revolution. Subsequent attempts in this direction almost invariably led to the

downfall or political humiliation of the government. Subsidized rice distributed through

the ration system became a symbol of the political power of the powerful left-wing

parties in Sri Lanka.

Rice has enormous symbolism and emotive power in Sri Lanka. Rice self

sufficiency has been a slogan that appealed to deep seated nationalist aspirations,

particularly among the Sinhalese, whose ancient civilization was based on irrigated rice

cultivation and who are stirred by the vision – irrespective of its historical veracity – of a

Golden Age when Sri Lanka was supposedly the granary of the east and exported rice to

other parts of Asia. At a more mundane level, the landed rice cultivators and politically

powerful rice millers exert much clout in terms of garnering electoral support for

particular political parties. In Sri Lanka, the drive to attain rice self sufficiency was not

simply one of achieving a Green Revolution on existing rice lands. From the 1930s,

promotion of rice cultivation through land settlement schemes (“Colonisation Schemes”)

were linked to the restoration of the ancient glory of the Sinhalese in the sparsely

21

populated so-called dry zone of the country which had been the cradle of the ancient

hydraulic civilization. Restoration of old irrigation systems – already initiated during

colonial times by the British – and the building of new and grandiose irrigation systems

were seen as a vehicle for new Sinhalese farmer settlements in those parts of the country

that had been largely abandoned by previous generations.16

As Brunton (1992, p. 82)

pointed out, “the paddy society was almost entirely Sinhalese”. Thus the rice self

sufficiency drive became associated with the rising Sinhala nationalism of the post-

independence era.

In addition to free or subsidized provision of irrigation, fertilizer, seeds, research

and extension, etc. to assist producers, the government also purchased paddy from

farmers at a guaranteed price through a state trading entity. It distributed varying

quantities of rice rations to consumers at subsidized prices until the late 1970s, including

a period (1966-78) when some rationed rice was distributed free. In addition farmers sold

rice to private buyers who either milled it themselves or sold it to millers who then sold it

in the „open market‟. In 1972, facing rising international prices and hoping to increase

domestic supplies at lower prices, the government granted monopoly procurement rights

to the state-owned Paddy Marketing Board – but the monopoly could not be enforced,

and was abolished in 1975.17

The government has regulated international trade and

16

The President and other government leaders were quite explict about the goal of land settlement. For

example, the Minister responsible for the Mahaweli project, Gamini Dissanayake, wrote that it represented

“a return of the people to the ancient homeland …in the Rajarata” (Dissanayake 1983, p. 6, cited in

Tennekoon 1988). Rajarata is the popular name for the area, largely in the North Central province, that was

the heartland of the ancient Sinhalese kingdoms. Nimal Sanderatne, former Director of Economic Research

at the Central Bank of Sri Lanka, writes: “Colonization had another political significance in pluralist Sri

Lanka. It gave the majoity ethnic community the opportunity to resettle Sinhalese in the ancient historical

capitals and ancient kingdoms and thereby confirm the area as a Sinhalese rather than a Tamil region. The

land settlement issue has been a most controversial issue and was an underlying cause for the ethnic

conflict” (Sanderatne 2004, p. 211). Moore (1985, p. 96). adds: “ ….Dry Zone development has been

explicitly viewed as a means of increasing the Sinhalese population in the historic heartland of Sinhalese

civilization….Between 1946 and 1971 the Sinhalese proportion of the population of the five „frontier‟

districts – Amparai, Batticaloa, Polonnaruwa, Trincomalee and Anuradhapura – increased from 33 to 51

percent. The main cause was the migration of Sinhalese settlers to new irrigation schemes.” 17

These measures included prohibiting of storage and transportation of paddy in bulk, and procurement

price increases. But with open market prices high and private traders active in procuring rice despite

restrictions, the state agency was unable to procure expected quantities.

22

supplies to maintain stable consumer prices, and that remains a central goal of food

policy.18

The non-uniform pattern of trade liberalization from 1977 onwards can only be

understood by recognizing the central political role of rice, both in consumption and in

production. The reform government of 1977 was led by Mr J.R Jayawardena, a lifelong

opponent of the left, strongly pro-western in foreign policy, and a man who had tried and

failed once to dismantle the rice subsidy scheme. This was where the Accelerated

Mahaweli Development Project played a critical political role. It provided crucial popular

political support that enabled him to dismantle the rice subsidy scheme and crush the

traditional political left, while implementing major liberalization measures.

But the end of the rice subsidy scheme did not mean that domestic rice prices

were „left to the market‟, whereby rice producers would be exposed to the pressure of

cheap imports. So post-1977 government policies continued to aim at consumer price

stabilization around a „reasonable‟ price, while assisting producers through input

subsidies and import protection. The NRAs in rice also reflects the impact of

international price and weather-related domestic supply changes. Because non-tariff

barriers insulate domestic markets from international markets, changes in domestic

supply change domestic prices and, even in the absence of any change in the policy

regime, change estimated NRAs. Hence good harvests depress domestic prices and

generate pressures for assistance and increased protection.

Sri Lanka‟s signing of the Uruguay Round Agreement on Agriculture in 1994 did

not constrain the government from exercising a high degree of discretion in changing

tariffs, because applied tariffs were significantly lower than bound tariffs. The

government has frequently chosen to change import tariffs in response to domestic

pressures. For example, from 1995 rice imports were subject to a tariff of 35 percent, but

an import licensing requirement was imposed in July 2000. In July 2001 when the

domestic rice price increased because of a production shortfall, the government allowed

the state agency (the Cooperative Wholesale Establishment, CWE) as well as private

traders to import rice duty free, waiving the 35 percent tariff. Then in January 2002 a

18

For a comprehensive recent discussion of the paddy-rice sector, see Weerahewa (2004). Note that a

variety of both consumer and producer rice prices have existed, and the wide variety of different rice

varieties compound the problem of estimating average prices.

23

specific duty of Rs 7 per kg replaced the tariff – but the CWE was allowed to import rice

at a specific duty of Rs 4 per kg. In March 2002 the licensing requirement was removed

and the specific duty was raised to Rs. 5 per kg.19

It was raised further to Rs. 7 in March

2003, to Rs. 9 in August 2003, and to Rs. 20 in January 2006 (Appendix Table A3).

These policy gyrations reflect the political power of the large rice producers and

processors, but also the sensitivity of governments to consumer opposition to increases in

the price of the main staple food. The policy liberalization in 1977 clearly reduced

protection from the previous high levels, but they have not trended down since then. Sri

Lanka is considered a high-cost rice producer at the margin, so the sector would come

under considerable pressure, particularly in marginal areas, if trade were to be fully

liberalized.20

It would be a mistake to assume that the negative rice NRAs observed in

2003 and 2004, for example, represent a permanent policy shift. The difficult balancing

act between serving producer and consumer interests will continue. The policy responses

will be most sensitive to domestic price movements: high domestic prices will tend to

induce import liberalization, while low domestic prices will tend to induce import

restrictions and/or input subsidies (constrained of course by fiscal deficit considerations).

Wheat and sugar import policies

The changes over time in government policies towards wheat have been closely linked to

rice policies. During the 1950s and 1960s, when the government was providing a

subsidized rice ration to consumers, a significant proportion of the „ration rice‟ had to be

imported as domestic procurement was inadequate. The government had an incentive to

encourage substitution of wheat for rice in consumption to reduce the fiscal burden of the

rice subsidy, because wheat was relatively cheaper in international markets than rice (and

some came through US government aid). With the phase-out of the subsidized rice ration

19

This discussion is based on the WTO Trade Policy Review (2004) and IPS (2003). 20

The extent to which Sri Lanka has any comparative advantage in rice production has been the subject of

several studies and much debate. See Abeyratna et al. (1990), Shilipi (1995), Rafeek and Samarathunage

(2000), Kikuchi et al. (2000 and 2001), Weerahewa, Gunatilake and Pitigala (2003), and Thibbotuwawa

(2004).

24

scheme starting in 1979, incentives changed. Thus from the early 1980s rice was

implictly protected via tougher restrictions on wheat imports.21

Sugar imports were very heavily taxed in the pre-liberalization period. Tax levels

have come down since 1977, but are still high. The past heavy taxation has a simple

explanation: almost all sugar was imported as there was little domestic production, and

import taxes contributed to reducing the fiscal burden imposed by other food subsidies.

The prevailing domestic price of sugar was accepted by consumers though much higher

than the international price, and so long as domestic prices were not increased too much,

there was little political opposition to the maintenance of this implicit protection. The

continuing high protection of the sugar industry in recent years is not so much for

government revenue reasons as to honor a government-foreign private enterprise

agreement signed in the early 1980s.22

Chillies and onions

As noted previously, the liberalization of 1977 involved import liberalization that was

selective and discriminatory. The agricultural sub-sectors chosen for liberalization (and

continuing protection) had a clear regional dimension, which also overlapped with

ethnicity. The previous protectionist policies benefited so-called subsidiary food crops

(chillies, red onions) as well as crops like grapes. This encouraged expansion of these

21 The state monopoly on wheat imports and distribution that prevailed until 2001 (CWE) enabled the

government to influence domestic grain prices. PRIMA, a Singapore-based company had a monopoly on

wheat milling from 1980 under a 20-year agreement signed by the government (and extended for a further

5 years in 2000). CWE supplied wheat to this monopoly miller until 2001 when PRIMA was granted right

to import wheat. PRIMA also gained a virtual monopoly in the animal feed sector because it could retain

wheat bran and other milling by-products and had bought out the only viable competitor (a state agency

that was privatised). During the contract period, PRIMA could import wheat grain and mill-related

equipment duty-free, and also enjoyed income-tax exemptions. PRIMA‟s monopoly in wheat imports was

ended in 2006 but is being challenged in courts. The official justification given for the agreement with

PRIMA is that it helped to attract a wheat miller to Sri Lanka. This has certainly come at a large cost to the

country. Clearly these special privileges given to a foreign owned entity impose a burden on consumers

while not offering any benefits either to producers (no wheat is produced in the country) or in the way of

government revenues. We refrain from speculating on why the government provided these special

privileges for a large foreign firm with no obvious compensating benefits to the country. For a fuller

discussion of this, see Athukorala and Kelegama (1998). 22

That agreement has some quite striking similarities with the government agreement with the PRIMA

wheat agreement. This agreement has imposed a huge cost on domestic consumers while delivering

extremely high profits to the subsidiary of a giant US-based sugar producer. As in the case of PRIMA, this

too was „justified‟ by the government on the grounds that it attracted a foreign investor. Again, there are

other explanations possible as to why the government entered into this agreement, raising issues of good

governance, and complicity in rent extraction and rent sharing.

25

crops in particular regions, such as the Jaffna penisula. Jaffna district produced two-thirds

of the country‟s entire production of red onions. The dependency of farmers in these

areas on these high-value crops was such that by 1977/78 red onions and chillies

accounted for around 75 percent of the total area devoted to non-rice (minor food crop)

cultivation in the Jaffna district.23

It was also the only dry zone district that was a rice-

deficit region. The 1977 liberalization produced a sharp fall in protection. Despite the

negative income effects on producers, their opposition to the reform was ineffective. The

ability of Jaffna farmers to obtain any response to their demands was constrained by the

“marginality of the Sri Lankan Tamils to the electoral system as a whole” (Moore 1985,

p. 109).

Even so, this issue played an important role in Jaffna in the 1982 presidential

elections. The escalation of the ethnic tensions into a full-scale secessionist war from

1983 onwards has had devastating effects on the agricultural economy in the northern and

eastern provinces. During the past two decades, commercial ties with the rest of the

country have been massively disrupted. The upshot of these developments has been that

farmers in the southern regions expanded their production of minor food crops, and this

has changed the political dynamic in relation to minor crop policies. This is seen most

clearly in the case of policy towards crops such as potatoes, where a small group of

producers have been able to exercise much political clout, and consumer resistence to

high prices could be largely ignored. As seen in Table 2, despite occasional declines,

protection for potatoes has tended to increase over time (with increases also – although to

a lesser degree –for crops such as red onions and chillies). From many viewpoints, a

strong case can be made for removing assistance to potato growing, given its destructive

environmental impact on the fragile ecosystems of the country‟s most important river

catchments and repositories of sources of bio-diversity. As Bruton (1992, p. 170) points

out, “the strong commitment to the Sinalese culture made it dificult to design an

economic policy that was equally appropriate for both major ethnic groups”; and there

can be little doubt that the pattern of liberalization in the 1977/78 period is suggestive of

a strong ethnic bias. However, the near-complete marginalization of Tamil farmers in the

North and East from mainstream political life, and the collapse of the agricultural

23

Based on data from Department of Census and Statistics, Statistical Abstract – 1979.

26

economy of these regions from the mid-1980s due to the secesionist war, has meant that

the role of ethnicity has diminished in agricultural policy formulation. Tensions between

producer and consumer interests have thereby become the dominant political economy

issue.

Future prospects

Our discussion of the political economy of agricultural policies has pointed out a range of

factors that have influenced policy formation in agricultural crops. The broad sweep of

trade liberalization since the late 1970s has not by-passed the agricultural sector. Further

progress along these lines is likely, as many of the smaller import-competing sectors may

find it difficult to withstand the pressures for reform and liberalization. But liberalization

will be difficult in the case of rice, the most politically sensitive industry. The history of

agricultural policy in Sri Lanka and the experience of other countries in Asia suggest that

this will remain the strongest bastion of protectionist pressures in the country for some

time to come. Even in recent times, whenever the rice industry has been stressed by

falling prices, the government has come under pressure to placate the industry. Almost

invariably the government has done so, maintaining the historical pattern of special

treatment for this sector. Arguably the course of future agricultural trade liberalization

will depend on the extent to which rice producers in Sri Lanka are able to maintain their

political clout. But as long as rice (and wheat) remain major items in consumption

baskets, the level of direct price protection will also be constrained by the need to keep an

eye on consumer interests, particularly when international prices spike upwards as in

2008. Fiscal pressures will also place a limit to the extent to which governments can

provide assistance in the form of input subsidies. It will also be interesting to see if

governments will be able to maintain current levels and forms of protection for livestock,

chicken and diary industries (past data for which were not adequate for including in this

study).

27

References

Abeyratne, F., E. Neville, W.G. Somaratne, and P. Wickramaarachchi (1990),

“Efficiency of Rice Production and Issues Relating to Protection”, Sri Lanka

Journal of Agricultural Economics 1(1): 16-25.

Anderson, K. (2002), “Agricultural Development and Trade Reform: Their Contributions

to Economic Growth, Poverty Alleviation and Food Security in Sri Lanka”, Report

following a World Bank Mission to Sri Lanka, Washington DC, April.

Anderson, K., M. Kurzweil, W. Martin, D. Sandri and E. Valenzuela (2008),

“Methodology for Measuring Distortions to Agricultural Incentives”, Agricultural

Distortions Working Paper 02, World Bank, Washington DC, revised January.

Posted at wwwr.worldbank.org/agdistortions

Arunatilake, N., S. Jayasuriya and S. Kelegama (2001), “The Economic Cost of the War

in Sri Lanka”, World Development 29(9): 1483-1500.

Athukorala, P.-C. and J.S. Bandara (1989), “Growth of Manufactured Exports, Primary

Commodity Dependence, and Net Export Earnings: Sri Lanka”, World

Development 17(8): 897-903.

Athukorala, P-C. and S. Jayasuriya (1994), Macroeconomic Policies, Crises and Growth

in Sri Lanka, 1969-90, Washington DC: World Bank.

Athukorala, P.-C. and S. Kelegama (1998), “The Political Economy of Agricultural Trade

Policy: Sri Lanka in the Uruguay Round”, Contemporary South Asia 7(1): 7-36.

Athukorala, P.-C. and S. Rajapatirana (2000), Liberalisation and Industrial

Transformation: Sri Lanka in International Perspective, Oxford and Delhi:

Oxford University Press.

Bhalla, S. (1991), “Sri Lanka”, pp. 195-235 in A.O. Krueger, M. Schiff and A. Valdes

(eds.), The Political Economy of Agricultural Pricing Policy, Vol 2, Baltimore:

John Hopkins University Press.

Brunton, H.J. (1992), Sri Lanka and Malaysia: The Political Economy of Poverty, Equity,

and Growth, New York: Oxford University Press for the World Bank.

28

Bush, K. (1999), “The Limits and Scope for the use of Development Assistance

Incentives and Disincentives for Influencing Conflict Situations: Case Study for

Sri Lanka”, Development Assistance Committee, Paris: OECD.

Central Bank of Sri Lanka (various issues), Annual Report, Columbo.

Central Bank of Sri Lanka (various issues), Economics and Social Statistics of Sri Lanka,

Columbo.

Cuthbertson, A.G. and P. Athukorala (1990), “Sri Lanka”, Part 3 in D. Papageorgiou, M.

Michaely and A.M. Choksi (eds.), Liberalizing Foreign Trade: Indonesia,

Pakistan and Sri Lanka, pp. 287-414, Oxford: Basil Blackwell.

de Silva, K.M. (1981), A History of Sri Lanka, Delhi: Oxford University Press.

de Silva, H. and W. Sumith (1979), “ The Coconut Industry in Sri Lanka: An Analysis of

Government Intervention Measures”, unpublished Masters Thesis, Australian

National University, Canberra.

Department of Census and Statistics (various issues), National Accounts of Sri Lanka,

Columbo.

Department of Census and Statistics (1979), Statistical Abstract of the Democratic

Socialsit Republic of Sri Lanka -1979, Colombo.

Dissanayake, G. (1983), “Foreword”, in Mahaweli Projects and Programme 1984,

Ministry of Lands and Land Development and Mahaweli Development, Colombo.

Dunham, D. and S. Kelegama (1997), “Does Leadership Matter in the Economic Reform

Process? Liberalization and Governance in Sri Lanka, 1989-93”, World

Development 25: 179-190.

Easterly, W. (2006), Global Development Network Growth Database, accessible at

http://www.nyu.edu/fas/institute/dri/global%20development%20network%20gro

wth%20database.htm

Edwards, C. (1993), A Report on Protectionism and Trade Policy in Manufacturing and

Agriculture, Sri Lanka, Colombo: Institute of Policy Studies.

Ganewatta, G. (2002), The Market for Value Added Tea Products of Sri Lanka: an

Economic Analysis, unpublished PhD Thesis, LaTrobe University, Melbourne.

29

Gunasinghe, N. (1984), “The Open Economy and its Impact on Ethnic Relations in Sri

Lanka”, in Committee for Rational Development in Sri Lanka (CRD), Sri Lanka:

the Ethnic Conflict, Navarang, New Delhi.

International Monetary Fund (2005), Sri Lanka: Selected Issues and Statistical Appendix,

IMF Country Report No. 05/337, Washington DC: IMF.

Institute of Policy Studies (2003), Sri Lanka: State of the Economy 2002, Colombo:

Institute of Policy Studies.

Jayanetti, S. and G. Tilakaratna (2005), “Impact of Trade Liberalization on Poverty and

Houehold Welfare in Sri Lanka”, Research Studies: Poverty and Social Welfare

Series No. 6, Colombo: Institute of Policy Studies.

Kelegama, S. (2004) (ed.) Economic Policy in Sri Lanka: Issues and Debates, New

Delhi: Sage Publications and London: Thousand Oaks.

Kikuchi, M., R. Barker, M. Samad, and P. Weligamage (2000), “Comparative Advantage

of Rice Production in an Ex-rice Importing Country: The Case of Sri Lanka”,

Paper presented at the III Conference of Asian Society of Agricultural Economists

at Jaipur, 18-20 October.

Kikuchi, M., R. Barker, M. Samad, and P. Weligamage (2001), “Comparative Advantage

of Rice Production in Sri Lanka with Special Reference to Irrigation Costs”, Paper

presented at the Workshop on Medium- and Long-Term Prospects of Rice Supply

and Demand in the 21st Century 3-5 December.

Klingebiel, S. (2001), “The OECD, World Bank and International Monetary Fund:

Development Activities in the Crisis Prevention and Conflict Management

Sphere”, German Development Institute (GDI), Bonn.

Kreimer, A., J. Eriksson, R. Muscat, M. Arnold and C. Scott (1998), Experience with

Post-Conflict Reconstruction, A World Bank Operations Evaluation Study,

Washington DC: World Bank.

Ministry of Plantation Industries (various issues), Plantation Sector Pocket Book,

Columbo.

Moore M. (1985), The State and Peasant Politics in Sri Lanka, Cambridge, Cambridge

University Press.

30

Peebles, P. (1990), “Colonization and Ethnic Conflict in the Dry Zone of Sri Lanka”, The

Journal of Asian Studies 49(1): 30-55.

Rafeek, M.I.M. and P.A. Samarathunga (2000), “ Trade Liberalization and its Impact on

the Rice Sector of Sri Lanka”, Sri Lankan Journal of Agricultural Economics 3:

143-154.

Sanderatne, N. (2004), “Agricultural Development: Controversial Issues”, pp. 195-212 in

S. Kelegama (ed.), Economic Policy in Sri Lanka: Issues and Debates, New

Delhi: Sage Publications and London: Thousand Oaks.

Shilpi, F. (1995), “Policy Incentive, Diversification and Comparative Advantage of Non-

Plantation Crops in Sri Lanka”, Working Paper 2, World Bank, Washington DC.

Tennekoon, S.N. (1988), “Rituals of Development: The Accelerated Mahawali

Development Program of Sri Lanka”, American Ethnologist 15(2): 294-310.

Thibbotuwawa, M. (2004), “Analysis of the Comparative Advantage and Income from

Paddy Farming in Anuradhapura, Kurunagala and Gampaha Districts with Special

Emphasis on Scale of Cultivation”, unpublished Project Report, Department of

Agricultural Economics and Business Management, University of Peradeniya.

Thorbecke, E. and J. Svejnar (1987), Economic Policies & Agricultural Performance in

Sri Lanka: 1960-1984, Development Centre Studies, Paris: OECD.

Weerahewa, J. (2004), “Impacts of Trade Liberalization and Market Reforms on the

Paddy/Rice Sector in Sri Lanka”, MITD Discussion Paper No. 70, IFPRI,

Washington DC.

Weerahewa, J., H.M. Gunatilake and H. Pitigala (2003), “Future of Paddy Farming in Sri

Lanka: Scale, Comparative Advantage and Rural Poverty”, Sri Lanka Economic

Journal 3(2): 104-144.

Weerakoon, Dushni (2004), “The Influence of Development Ideology in Macroeconomic

Policy Reform Process‟, pp. 54-70 in S. Kelegama (ed.), Economic Policy in Sri

Lanka: Issues and Debates, New Delhi: Sage Publications and London: Thousand

Oaks.

World Bank (1995), Sri Lanka: Non-Plantation Crop Sector Policy Alternatives, Report

No: 14564-CE, Washington DC: World Bank.

31

World Bank (2003), Sri Lanka: Promoting Agricultural and Rural Non-farm Sector

Growth, Report No. 25387-CE, Washington DC: World Bank.

World Bank (2004), Trade Policies in South Asia: An Overview, Report No. 29949,

Washington DC: World Bank.

World Trade Organization (2004), Trade Policy Review: Sri Lanka, Geneva: World

Trade Organization.

32

Figure 1: Real GDP growth rate and political episodes and policy regimes,a Sri Lanka, 1951 to 2005

a The United National Party (UNP) has been a right of centre party; the Sri Lanka Freedom Party (SLFP) has been a left of centre

party. Both parties have frequently entered into coalition governments with other parties. The Peoples‟ Alliance (PA) is a SLFP-

dominated coalition.

Source: Authors‟ compilation

Figure 2: Share of agriculture in GDP and exports, Sri Lanka, 1950 to 2005

(percent)

0

10

20

30

40

50

60

70

80

90

100

1950

1953

1956

1959

1962

1965

1968

1971

1974

1977

1980

1983

1986

1989

1992

1995

1998

2001

2004

Years

Perc

en

tag

e

Ag Share of GDP Ag Share of Exports

Source: Central Bank of Sri Lanka, Annual Report, Various Issues

34

Figure 3: Shares of covered crops in value of agricultural production at undistored prices, Sri

Lanka, 1966 to 2004

(percent)

0

10

20

30

40

50

60

70

80

90

100

1966

1970

1974

1978

1982

1986

1990

1994

1998

2002

Residual

Onion

Chillie

Potatoe

Rubber

Coconut

Tea

Rice

Source: Derived from FAO data and authors‟ spreadsheet

35

Figure 4: Fertilizer subsidy, Sri Lanka, 1962 to 2007

$US Millions

0

20

40

60

80

100

1201962

1964

1966

1968

1970

1972

1974

1976

1978

1980

1982

1984

1986

1988

1990

1992

1994

1996

1998

2000

2002

2004

2006

Years

$U

S M

illi

on

s

Source: Central Bank of Sri Lanka (various issues).

36

Figure 5: Nominal rates of assistance to tea, rubber, coconut and rice, Sri Lanka, 1955 to 2004

(percent)

Tea

-60

-50

-40

-30

-20

-10

0

1955

1957

1959

1961

1963

1965

1967

1969

1971

1973

1975

1977

1979

1981

1983

1985

1987

1989

1991

1993

1995

1997

1999

2001

2003

Rubber

-80

-70

-60

-50

-40

-30

-20

-10

0

1955

1957

1959

1961

1963

1965

1967

1969

1971

1973

1975

1977

1979

1981

1983

1985

1987

1989

1991

1993

1995

1997

1999

2001

2003

37

Figure 5 (continued): Nominal rates of assistance to tea, rubber, coconut and rice, Sri Lanka,

1955 to 2004

(percent)

Coconut

-60

-40

-20

0

20

40

60

1955

1957

1959

1961

1963

1965

1967

1969

1971

1973

1975

1977

1979

1981

1983

1985

1987

1989

1991

1993

1995

1997

1999

2001

2003

Rice

-40

-20

0

20

40

60

80

100

1955

1957

1959

1961

1963

1965

1967

1969

1971

1973

1975

1977

1979

1981

1983

1985

1987

1989

1991

1993

1995

1997

1999

2001

2003

Source: Authors‟ spreadsheet

38

Figure 6: Nominal rates of assistance to exportable, importable and all covered agricultural

products, Sri Lanka, 1955 to 2004

(percent)

-60

-40

-20

0

20

40

60

80

100

1955

1957

1959

1961

1963

1965

1967

1969

1971

1973

1975

1977

1979

1981

1983

1985

1987

1989

1991

1993

1995

1997

1999

2001

2003

Import-competing

Total

Exportables

Source: Authors' spreadsheet

39

Figure 7: Nominal rates of assistance to all agricultural tradable industries, all nonagricultural

tradables, and relative rates of assistance, Sri Lanka, 1955 to 2004

(percent)

-80

-40

0

40

80

120

160

1955

1957

1959

1961

1963

1965

1967

1969

1971

1973

1975

1977

1979

1981

1983

1985

1987

1989

1991

1993

1995

1997

1999

2001

2003

NRA ag tradables

NRA non-ag tradables

RRA

a The RRA is defined as 100*[(100+NRAag

t

)/(100+NRAnonagt

)-1], where NRAagt

and

NRAnonagt

are the percentage NRAs for the tradable parts of the agricultural and nonagricultural

sectors, respectively.

Source: Authors‟ spreadsheet

40

Table 1: Agriculture‟s share of GDP, employment and exports, Sri Lanka, 1950 to 2005

(percent)

1950-51 1960-61 1970-71 1980-81 1990-91 2000-02 2005

Sectoral shares of GDP

Agriculture 44.5 34.6 35.1 33.7 26.3 21.9 18.9

Plantation Agriculture 26.3 17.8 15.8 13.9 8.1 5.2 4.4

Tea 7.7 6.5 3.2 2.6 2.4 1.4 1.2

Rubber 5.5 2.3 1.8 1.4 0.6 0.4 0.4

Coconut 7.1 4.8 4.0 3.8 2.4 1.4 1.1

Processing of tea,

rubber, coconuta

6.5 4.2 6.8 6.1 2.7 2.0 1.7

Non-plantation Agriculture 14.6 14.5 16.7 15.0 14.8 12.1 11.5

Paddy 1.5 5.7 7.2 6.1 4.9 3.1 3.0

Other 13.1 8.8 9.4 8.9 9.9 9.0 8.5

Forestry 1.9 1.4 1.4 2.0 1.6 1.9 1.7

Fishing 1.2 0.9 1.2 2.7 1.8 2.7 1.3

Industries 8 9 14 18 23 26 27

Services 53 55 51 48 51 52 55

Sectoral shares of exports

Agricultural Exports >90 >90 94.6 61.6 36.3 19.3 18.2

Tea >50 >50 55.5 35.1 24.9 14.3 12.8

Rubber >20 >20 22.0 14.7 3.9 0.5 0.7

Coconut >15 >15 14.5 7.0 3.5 1.7 1.8

Other 3.1 4.8 4.0 2.8 2.9

Manufactures <2 <2 1.7 31.2 56.6 77.1 80.3

Unclassified 3.9 2.7 7.1 1.0 1.5

Sectoral shares of employment 1953 1963 1971 1981 1991 2001 2005

Agriculture 53 53 50 45 42 33 31

Industry 12 12 12 15 20 22 24

Services 35 35 38 40 38 45 45

a Processing of tea, rubber and coconut products is usually included under manufacturing. Here

it is included under Agriculture, Forestry and Fisheries in GDP and export shares, but not in

employment shares.

Source: Central Bank of Sri Lanka (various issues)

Table 2: NRAs of covered agricultural products, Sri Lanka, 1955 to 2004

(percent, five-year averages)

1955-59 1960-64 1965-69 1970-74 1975-79 1980-84 1985-89 1990-94 1995-99 2000-04

Exportablesa -22.8 -40.0 -38.6 -41.1 -45.2 -31.1 -21.4 -24.2 -2.0 5.9

Rubber -15.8 -51.5 -48.9 -56.2 -59.6 -51.4 -37.7 -21.8 -4.4 -0.2 Coconut -28.6 -29.6 -24.9 -32.8 -36.5 -19.6 -5.1 -34.6 -1.3 16.7 Tea -22.3 -39.4 -39.1 -36.8 -37.4 -30.4 -25.6 -12.6 -1.5 -1.2

Importablesa 62.5 11.9 -5.9 9.0 -3.7 -0.6 -2.1 22.4 31.8 12.8

Rice 62.5 11.9 -5.9 9.0 -7.7 -5.8 0.1 8.6 19.2 3.7 Potato - - - - 77.6 43.3 32.6 157.7 124.8 205.8 Onion - - - - -11.6 28.7 -12.6 43.7 79.3 53.4 Chillies - - - - 52.6 33.4 6.9 62.1 76.9 67.2

All covered productsa -10.3 -29.9 -30.0 -20.3 -31.9 -19.2 -12.6 -1.7 11.5 8.6

Dispersion of covered

productsb

44.2 28.7 20.9 31.9 26.2 22.8 22.4 25.0 20.8 12.6

% coverage (at

undistorted prices) 66 66 67 65 64 63 67 65 62 64

a

Weighted averages, with weights based on value of production at undistorted prices. b

Dispersion is a simple 5-year average of the annual standard deviation around the weighted mean of NRAs of covered products.

Source: Authors‟ spreadsheet

Table 3: Nominal rates of assistance to agricultural and non-agricultural industries and relative rate of assistance, Sri Lanka, 1955 to

2004

(percent)

1955-59 1960-64 1965-69 1970-74 1975-79 1980-84 1985-89 1990-94 1995-99 2000-04

Covered agric. productsa -10.3 -29.9 -30.0 -20.3 -31.9 -19.2 -12.6 -1.7 11.5 8.6

Non-covered agric. products 13.2 -9.3 -14.8 -10.7 -16.3 -10.6 -7.8 -0.6 9.9 6.2

All agricultural productsa -2.4 -23.0 -24.9 -16.9 -26.4 -16.0 -11.1 -1.4 10.9 7.7

Non-product-specific input

assistance (NPS) 0.0 0.2 0.4 0.6 0.8 2.4 1.1 0.1 1.3 1.7

Total agriculture (incl. NPS)b -2.4 -22.8 -24.5 -16.3 -25.5 -13.5 -9.9 -1.2 12.2 9.5

Agricultural trade bias indexc -0.52 -0.45 -0.35 -0.45 -0.43 -0.31 -0.18 -0.38 -0.25 -0.05

Tradables

NRA, All Agriculture -2.7 -25.7 -27.6 -18.5 -29.0 -15.4 -11.2 -1.3 14.0 10.8

NRA, All Non-Agriculture 104.9 124.6 138.4 70.7 52.9 57.1 59.0 47.1 36.4 22.9

Relative rate of

assistance (RRA)d

-52.5 -66.6 -68.0 -51.6 -53.5 -46.2 -44.3 -32.9 -16.3 -9.8

MEMO, ignoring exchange rate

distortions:d

NRA, all agric. products -2.4 -12.9 -15.2 -11.0 -19.7 -11.0 -8.0 -0.9 11.7 9.5

Agricultural trade bias index -0.52 -0.21 -0.06 -0.23 -0.23 -0.22 -0.09 -0.34 -0.24 -0.05

RRA -52.5 -61.7 -63.9 -48.0 -49.2 -44.3 -42.9 -32.6 -16.8 -9.8

a NRA including product-specific input subsidies.

b NRAs including product-specific input subsidies and non-product-specific (NPS) assistance. Total of assistance to primary factors and intermediate inputs divided by total value of primary agriculture

production at undistorted price, expressed as a percentage. c Trade bias index is TBI = (1+NRAagx/100)/(1+NRAagm/100) – 1, where NRAagm and NRAagx are the average percentage NRAs for the import-competing and exportable parts of the agricultural

sector. d

The RRA is defined as 100*[(100+NRAagt )/(100+NRAnonagt)-1], where NRAagt and NRAnonagt are the percentage NRAs for the tradables parts of the agricultural and nonagricultural sectors,

respectively. Source: Authors‟ spreadsheet

Appendix: Key quantity and price data, assumptions and sources for Sri Lanka

Volume of production, exports and imports data for agricultural products

From various publications of Central Bank of Sri Lanka‟s Annual Report (various issues) and

Economics and Social Statistics of Sri Lanka (various issues) and FAO.

Farm-gate product prices data

Data for paddy/rice are from Bhalla (1987) for the period of 1955 to 1986 and data are from the

data series of producer price of paddy of Central Bank of Sri Lanka Annual Report (various

issues) and adjusted following the method of Bhalla (1987). Data for other products are from

Central Bank of Sri Lanka‟s Annual Report (various issues) and Economics and Social Statistics

of Sri Lanka (various issues) and FAO.

Wholesale and retail product prices

From Central Bank of Sri Lanka‟s Annual Report (various issues) and Economics and Social

Statistics of Sri Lanka (various issues)

Border prices

Fob and cif prices are directly from Central Bank of Sri Lanka‟s Annual Report (various issues)

and Economics and Social Statistics of Sri Lanka (various issues) and FAO.

Exchange rates

Official exchange rates are from Central Bank of Sri Lanka‟s Annual Report (various issues) and

Economics and Social Statistics of Sri Lanka (various issues) and, for black market premia, from

Easterly (2006).

Production, consumption, input and trade taxes and subsidies

These data are from Central Bank of Sri Lanka’s Annual Report (various issues) and

Economics and Social Statistics of Sri Lanka (various issues) and the Ministry of Plantation

Industries (various issues).
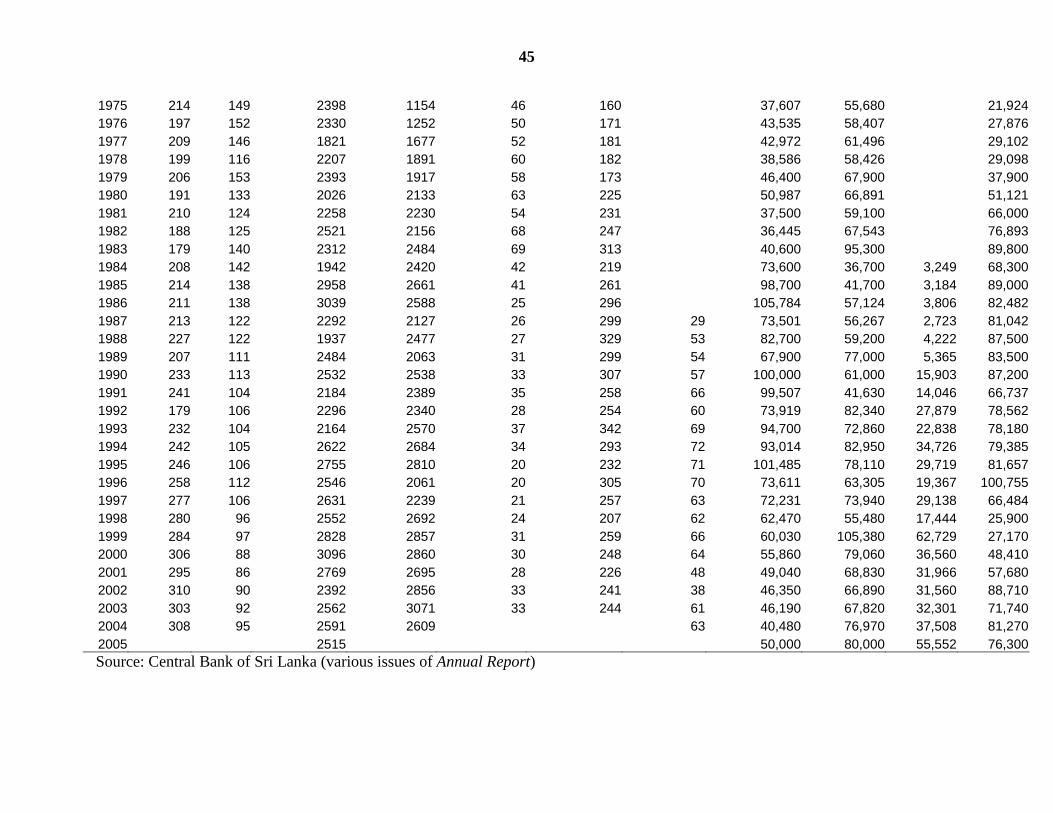
44

Appendix Table A1: Production of major agricultural crops, Sri Lanka, 1948 to 2005

Tea Rubber Coconut Paddy Minor Exports

Crops Sub.Food

Crops Sugar Chillies &Peper Red Onion B'Onion Potatoes

Year Prod

(Mn.Kg) Pro(Kg,

Mn) Prod(Mn.nuts) Prod(MT,000) Prod(MT'000) Prod(MT'000) Prod(MT'000) Prod (MT) Prod (MT) Prod (MT) Prod(MT)

1948 136 96 1765 390.7 na na

1949 135 91 1763 482.7 3 14

1950 139 115 1982 461 4 37

1951 148 107 2238 459.7 4 39

1952 144 98 2455 603.9 na 44

1953 137 100 2288 457.6 na 36

1954 166 95 2203 649.8 na 0

1955 172 95 2420 745 8 73

1956 170 97 2374 561 8 68

1957 180 99 2108 652 8 75

1958 187 102 2109 763 21 55

1959 187 93 2313 760 20 59

1960 197 99 2183 897 20 62

1961 206 98 2601 899 21 76 11,000 36,593 3,928

1962 212 104 2811 1001 17 64 12,000 0 1,148

1963 220 105 2549 1026 8 87 13,000 29,216 7,271

1964 219 112 2991 1054 11 59 16,243 27,202 4,721

1965 228 119 2681 757 23 55 20,231 31,956 2,117

1966 222 131 2468 954 14 99 19,367 31,888 7,361

1967 221 144 2416 1145 21 97 28,916 38,425 11,509

1968 225 149 2601 1346 13 68 24,108 34,922 18,270

1969 220 151 2440 1374 15 91 19,812 34,581 26,927

1970 212 160 2410 1616 26 78 32,198 38,218 31,741

1971 218 142 2610 1396 14 106 30,000 41,613 30,500

1972 213 140 2963 1312 15 133 31,980 43,679 31,279

1973 211 155 1935 1312 49 144 40,037 46,011 26,384

1974 204 132 2031 1602 50 144 44,581 52,798 26,896

45

1975 214 149 2398 1154 46 160 37,607 55,680 21,924

1976 197 152 2330 1252 50 171 43,535 58,407 27,876

1977 209 146 1821 1677 52 181 42,972 61,496 29,102

1978 199 116 2207 1891 60 182 38,586 58,426 29,098

1979 206 153 2393 1917 58 173 46,400 67,900 37,900

1980 191 133 2026 2133 63 225 50,987 66,891 51,121

1981 210 124 2258 2230 54 231 37,500 59,100 66,000

1982 188 125 2521 2156 68 247 36,445 67,543 76,893

1983 179 140 2312 2484 69 313 40,600 95,300 89,800

1984 208 142 1942 2420 42 219 73,600 36,700 3,249 68,300

1985 214 138 2958 2661 41 261 98,700 41,700 3,184 89,000

1986 211 138 3039 2588 25 296 105,784 57,124 3,806 82,482

1987 213 122 2292 2127 26 299 29 73,501 56,267 2,723 81,042

1988 227 122 1937 2477 27 329 53 82,700 59,200 4,222 87,500

1989 207 111 2484 2063 31 299 54 67,900 77,000 5,365 83,500

1990 233 113 2532 2538 33 307 57 100,000 61,000 15,903 87,200

1991 241 104 2184 2389 35 258 66 99,507 41,630 14,046 66,737

1992 179 106 2296 2340 28 254 60 73,919 82,340 27,879 78,562

1993 232 104 2164 2570 37 342 69 94,700 72,860 22,838 78,180

1994 242 105 2622 2684 34 293 72 93,014 82,950 34,726 79,385

1995 246 106 2755 2810 20 232 71 101,485 78,110 29,719 81,657

1996 258 112 2546 2061 20 305 70 73,611 63,305 19,367 100,755

1997 277 106 2631 2239 21 257 63 72,231 73,940 29,138 66,484

1998 280 96 2552 2692 24 207 62 62,470 55,480 17,444 25,900

1999 284 97 2828 2857 31 259 66 60,030 105,380 62,729 27,170

2000 306 88 3096 2860 30 248 64 55,860 79,060 36,560 48,410

2001 295 86 2769 2695 28 226 48 49,040 68,830 31,966 57,680

2002 310 90 2392 2856 33 241 38 46,350 66,890 31,560 88,710

2003 303 92 2562 3071 33 244 61 46,190 67,820 32,301 71,740

2004 308 95 2591 2609 63 40,480 76,970 37,508 81,270

2005 2515 50,000 80,000 55,552 76,300

Source: Central Bank of Sri Lanka (various issues of Annual Report)

46

Appendix Table A2: Composition of imports, Sri Lanka, 1070 to 2004

(percent)

1970 1980 1990 2000 2004

Agricultural Imports 46.4 20.6 14.2 11.3 11.2

Rice 15.1 2.2 1.2 0.1 0.8

Flour 9.7 5.3 1.0 0.0 0.0

Wheat & Meslin 1.0 1.6 2.1 1.7 2.3

Sugar 6.7 5.7 4.9 1.9 1.4

Milk and milk products 2.4 2.5 2.2 1.6 1.5

Other 11.5 3.3 2.8 6.05 5.2

Other Imports 53.6 79.4 85.8 88.7 88.8

Total 100.0 100.0 100.0 100.0 100.0

Source: Central Bank of Sri Lanka (various issues)

47

Appendix Table A3: Rice import tariffs, Sri Lanka, 1995 to 2006

Period

Statutory

Duty

Duty

Waiver

Effective

Import

Duty/tariff

Surcharge

%

TT/GST

VAT %

DL/

NSL

%

Total Tax

Incidence a/

Jan 1, 1995-Feb 7, 1995 35% or

Rs7/Kg

0 55% 0 EX 4.5 65.7%

Feb 8, 1995- April 1996 35% 0 35% 0 EX 4.5 44.6%

Apr 15, 1996-Jan 30, 1997 35% 35% 0 0 EX 4.5 7.6%

Jan 31, 1997-Nov 20, 1997 35% 0 35% 0 EX 4.5 44.6%

Nov 21, 1997- Jan 31, 1998 35% 35% 0 0 EX 4.5 7.6%

Feb 1, 1998- Nov 5, 1998 0 35% 0 EX 4.5 44.6%

Nov 6, 1998-Oct 23, 1999 35% 0 35% 0 EX 5.5 46.3%

Oct 24, 1999-Dec 31, 1999 35% 25% 10% 0 EX 6.5 20.9%

Jan 1, 2000-May 10, 2000 35% 0 35% 0 EX 6.5 48.0%

May 11, 2000-July 16, 2000 35% 0 35% 0 EX 6.5 48.0%

July 17, 2000-Feb 19, 2001 35%+QR 0 35%+QR 0 EX 6.5 48.0%

Feb 20, 2001- Mar 31, 2001 35%+QR 0 35%+QR 40 EX 6.5 60.0%

Apr 01, 2001-Sep 11, 2001 35%+QR 0 35%+QR 40 EX 7.5 61.7%

Sep 12, 2001 – Nov 21, 2001 35%+QR 0 35%+QR 40 EX 6.5 60.0%

Nov 22, 2001-Dec 8, 2001 35%+QR 35% 0+QR 40 EX 6.5 8.1%

Dec 9, 2001-Dec 31,2001 35%+QR 17.5% 17.5%+QR 40 EX 6.5 34.1%

Jan 1, 2002- Jan 20, 2002 35%+QR 0 35%+QR 40 EX 6.5 60.0%

Jan 21, 2002- Jul 31, 2002

CWE was allowed to import

30,000 MT

Rs 7/Kg 0 Rs. 7/Kg

0 EX 6.5 55.6%

August 1, 2002 – Nov 5, 2002 Rs 7/Kg 0 Rs. 7/Kg 0 10 36.6%

Nov 6, 2002-Mar 4, 2003 Rs 5/Kg 0 Rs. 5/Kg 0 10 27.4%

Mar 5, 2003-Aug 18, 2003 Rs 7/Kg 0 Rs. 7/Kg 0 10 36.4%

Aug 19, 2003-Jan 31, 2006 Rs 9/Kg 0 Rs. 9/Kg

0 10 Na

Jan 31, 2006 todate Rs 20/Kg 0 Rs: 20/Kg 0 10 Na

Source: UpadatedTable 4 of Jayanetti and Tilakaratna (2005) using Various Notifications of Sri

Lanka Customs.

a. Includes the defense levy, stamp duty & other surcharges

Figures in brackets are Average Duty Collection Rates.

48

Appendix Table A4: Exchange rates, Sri Lanka, 1960 to 2005

(Rs./US$)

Year Official Exchange Rate Secondary Market Rate

1960 4.75 6.8

1961 4.76 8.1

1962 4.76 9.6

1963 4.76 11.3

1964 4.78 12.6

1965 4.78 11.5

1966 4.78 16.2

1967 5.93 14.1

1968 5.93 7.9

1969 5.96 7.7

1970 5.96 9.8

1971 5.96 13.4

1972 6.7 16.6

1973 7.75 11.0

1974 6.6 13.9

1975 7.71 16.9

1976 8.83 24.3

1977 15.56 17.7

1978 15.51 21.2

1979 15.45 25.0

1980 18 22.4

1981 20.55 22.6

1982 21.32 27.6

1983 25 36.4

1984 26.28 36.2

1985 27.41 32.8

1986 28.52 31.5

1987 30.76 33.8

1988 33.03 54.5

1989 40 48.3

1990 40.24 53.1

1991 42.58 53.5

1992 46 54.2

1993 49.56 54.8

1994 49.98 54.1

1995 54.05 56.7

1996 56.71 62.1

1997 61.29 68.8

1998 67.78 72.1

1999 72.12 80.1

2000 80.06 80.1

2001 93.16 93.2

2002 96.73 96.7

2003 96.74 96.7

2004 104.61 104.6

Source: Official from Central Bank of Sri Lanka; black market premia from Easterly (2006)

49

Appendix Table A5: Annual distortion estimates, Sri Lanka, 1955 to 2004

(a) Nominal rates of assistance to covered products (percent) Chillies Coconut Onion Potato Rice Rubber Tea All covered

1955 na -35 na na 42 -18.0 -23 -14

1956 na -24 na na 51 -3.6 -18 -8

1957 na -28 na na 70 -19.0 -23 -10

1958 na -29 na na 95 -24.9 -25 -9

1959 na -28 na na 54 -13.5 -22 -11

1960 na -32 na na 42 -38.5 -32 -21

1961 na -37 na na 32 -45.6 -35 -26

1962 na -23 na na -7 -53 -40 -31

1963 na -26 na na 4 -59 -44 -34

1964 na -30 na na -11 -62 -46 -38

1965 na -31 na na -16 -59 -43 -38

1966 na -18 na na -23 -70 -51 -44

1967 na -19 na na -9 -57 -44 -32

1968 na -34 na na 1 -25 -28 -20

1969 na -23 na na 18 -34 -30 -15

1970 na -22 na na 15 -48 -36 -19

1971 na -48 na na 7 -60 -41 -7

1972 na -33 na na 3 -56 -44 -31

1973 na -26 na na 42 -45 -30 -10

1974 na -34 na na -22 -72 -33 -35

1975 na -30 na na -12 -61 -39 -31

1976 na -4 na 91 -16 -70 -40 -35

1977 na -37 na 23 38 -38 -15 -11

1978 36 -53 -36 150 -18 -61 -45 -38

1979 69 -58 13 46 -29 -67 -48 -45

1980 52 -52 -9 -41 -12 -55 -36 -33

1981 36 -25 97 164 -4 -53 -35 -18

1982 48 -9 16 25 -1 -48 -30 -12

1983 35 1 11 28 -10 -48 -26 -15

1984 -5 -13 28 40 -2 -54 -25 -17

1985 22 -14 51 70 8 -30 -30 -7

1986 0 26 59 80 23 -31 -25 5

1987 -22 25 -62 -39 7 -30 -21 -8

1988 30 -21 -87 14 -29 -54 -33 -33

1989 5 -42 -25 38 -10 -43 -20 -20

1990 41 -45 -47 67 4 -46 -25 -14

1991 47 -33 3 178 -1 -40 -28 -8

1992 32 -34 -42 146 8 -15 -5 -5

1993 73 -26 68 144 18 -4 -2 9

1994 118 -35 236 253 14 -4 -2 10

1995 102 -42 61 177 29 -5 -2 10

1996 59 -30 86 66 15 -7 -2 0

1997 74 10 65 83 22 -7 -1 13

1998 83 35 108 149 6 -3 -1 16

1999 67 20 78 150 23 0 -2 18

2000 71 25 65 160 3 0 -1 11

2001 81 50 78 225 7 0 -2 19

2002 63 19 37 181 23 0 -1 17

2003 54 1 34 257 -5 0 -1 2

2004 na -10 na na -9 -1 -1 -6

50

Appendix Table A5 (continued): Annual distortion estimates, Sri Lanka, 1955 to 2004

(b) Nominal and relative rates of assistance to alla agricultural products, to exportable

b and

import-competing b

agricultural industries, and relativec to non-agricultural industries

(percent)

Total ag NRA Ag tradables NRA

Non-ag

tradables

NRA RRA

Covered products Non-

covered

products

All

products (incl NPS)

Export-

ables

Import-

competing All Inputs Outputs

1955 0 -14 6 -7 -25 42 -8 105 -55

1956 0 -8 12 -1 -16 51 -1 105 -52

1957 0 -10 16 -1 -23 70 -2 105 -52

1958 0 -9 23 2 -26 95 2 105 -50

1959 0 -11 10 -4 -23 54 -4 104 -53

1960 0 -21 3 -13 -34 42 -14 103 -58

1961 0 -26 -2 -18 -38 32 -20 114 -63

1962 0 -31 -15 -26 -39 -7 -29 130 -69

1963 0 -34 -13 -27 -44 4 -30 135 -70

1964 0 -38 -19 -31 -46 -11 -36 142 -73

1965 0 -38 -20 -32 -43 -16 -36 158 -75

1966 0 -44 -24 -37 -50 -23 -42 172 -79

1967 0 -32 -17 -26 -41 -9 -30 165 -74

1968 0 -20 -10 -17 -30 1 -19 124 -64

1969 0 -15 -3 -11 -29 18 -12 73 -50

1970 0 -19 -6 -15 -35 15 -17 77 -53

1971 0 -7 -14 -9 -48 7 -11 93 -54

1972 0 -31 -14 -24 -44 3 -28 93 -63

1973 0 -10 3 -4 -34 42 -5 52 -38

1974 0 -35 -22 -29 -45 -22 -34 39 -53

1975 0 -31 -18 -25 -43 -12 -30 43 -51

1976 0 -35 -20 -29 -45 -13 -33 65 -60

1977 0 -11 3 -5 -28 37 -7 55 -40

1978 0 -38 -22 -31 -52 -13 -37 51 -58

1979 0 -45 -25 -37 -58 -17 -43 51 -62

1980 0 -33 -19 -26 -48 -8 -32 51 -55

1981 0 -18 -10 -11 -34 5 -17 56 -47

1982 0 -12 -7 -8 -25 4 -12 56 -43

1983 0 -15 -9 -11 -22 -4 -14 56 -45

1984 0 -17 -9 -13 -26 0 -16 68 -50

1985 0 -7 -3 -4 -23 15 -7 68 -44

1986 0 5 4 6 -10 22 5 68 -37

1987 0 -8 -5 -6 -6 -10 -8 53 -40

1988 0 -33 -22 -29 -35 -32 -33 53 -56

1989 0 -20 -13 -17 -33 -5 -20 53 -48

1990 0 -14 -9 -13 -35 7 -14 45 -41

1991 0 -8 -6 -7 -32 15 -8 45 -37

1992 0 -5 -4 -4 -23 12 -5 52 -38

1993 0 9 7 8 -14 34 10 50 -27

1994 0 10 9 10 -18 44 11 43 -23

1995 0 10 9 11 -20 47 11 37 -19

1996 0 0 4 3 -16 29 2 40 -27

1997 0 13 12 14 3 32 14 36 -16

1998 0 16 11 16 13 20 16 35 -14

1999 0 18 14 18 10 32 19 33 -11

2000 0 11 8 11 10 14 11 21 -8

2001 0 19 13 19 17 22 19 23 -3

2002 0 17 13 17 8 32 17 23 -4

2003 0 2 2 4 0 6 3 25 -18

2004 0 -6 -5 -4 -4 -9 -6 22 -23

a. NRAs including assistance to nontradables and non-product specific assistance.

b. NRAs including products specific input subsidies.

51

c. The Relative Rate of Assistance (RRA) is defined as 100*[(100+NRAagt)/

(100+NRAnonagt)-1], where NRAag

t and NRAnonag

t are the percentage NRAs for the tradables

parts of the agricultural and non-agricultural sectors, respectively.

52

Appendix Table A5 (continued): Annual distortion estimates, Sri Lanka, 1955 to 2004

(c) Value shares of primary production of covereda and non-covered products,

(percent)

Chillies Coconut Onion Potato Rice Rubber Tea Non-covered

1955 na 15 na na 11 12 27 34

1956 na 16 na na 9 13 28 34

1957 na 16 na na 9 13 27 34

1958 na 18 na na 9 12 27 34

1959 na 21 na na 10 11 24 34

1960 na 15 na na 11 14 26 34

1961 na 15 na na 11 12 28 34

1962 na 12 na na 15 12 26 34

1963 na 12 na na 14 13 27 34

1964 na 14 na na 15 13 25 34

1965 na 16 na na 12 13 25 34

1966 na 11 na na 14 18 23 34

1967 na 11 na na 18 13 21 36

1968 na 20 na na 21 8 19 32

1969 na 17 na na 20 12 18 32

1970 na 16 na na 21 13 18 31

1971 na 5 na na 48 4 7 36

1972 na 12 na na 17 11 22 38

1973 na 12 na na 19 13 16 39

1974 na 14 na na 31 11 12 33

1975 na 10 na na 23 10 15 43

1976 na 9 na 1 20 17 16 37

1977 na 21 na 1 16 8 21 33

1978 2 18 2 0 21 9 16 32

1979 2 19 1 1 18 14 11 35

1980 2 19 1 1 18 10 11 37

1981 2 16 1 1 23 8 12 38

1982 2 14 1 1 23 7 13 38

1983 2 12 1 1 21 8 16 38

1984 3 16 1 1 16 8 20 36

1985 6 16 1 1 20 7 17 32

1986 8 11 1 2 21 9 15 34

1987 6 12 2 4 18 7 15 35

1988 4 10 7 2 22 9 13 32

1989 6 13 1 2 23 7 15 34

1990 5 11 3 1 24 6 18 31

1991 7 13 1 1 24 5 16 33

1992 6 18 4 1 24 4 9 34

1993 5 15 1 1 23 4 13 37

1994 4 16 1 1 21 6 12 39

1995 4 15 1 1 21 7 11 40

1996 4 18 1 1 15 6 14 41

1997 2 19 1 1 16 5 17 40

1998 3 16 1 0 20 4 19 38

1999 3 20 2 0 22 3 16 34

2000 2 15 1 0 22 3 19 36

2001 2 14 1 1 21 3 21 37

2002 2 17 1 1 20 4 19 36

2003 2 14 1 1 23 5 18 36

2004 na 16 na na 22 6 21 36

a At farmgate undistorted prices

Source: Authors‟ spreadsheet


Recommended